Abstract
This paper evaluates the possibility of analyzing the composition of high-quality copper scrap with X-ray fluorescence spectrometry (XRF) instead of electrogravimetry combined with flame atomic absorption spectroscopy (EG+FAAS) method. The evaluation of the methods was performed on three real copper scraps, the composition of which were estimated in average samples taken after re-melting. Traceability of XRF results was ensured by the use of new certified reference materials (CRMs) dedicated to copper scrap analysis. The copper content results obtained by XRF were characterized by high agreement with the reference results obtained by EG+FAAS method. The estimated expanded uncertainty for Cu of both methods was 0.23%. In addition to significant time savings without compromising accuracy, the XRF method additionally provided information on the content of 12 other elements, such as Sn, Zn, Co, Cd, Sb, Ni, Fe, Pb, Bi, Ag, Al, and P. This may make the XRF method attractive compared to the commonly used EG+FAAS method.
1. Introduction
The use of copper is very widespread in many areas of everyday life: automotive, architectural, electrical, electronical and telecommunications, tubing and piping, industrial, and more. Global demand for copper is growing, driven by the development of renewable energy technologies and electric vehicles. Copper is 100% recyclable, and due to the increasing demand for this element, a large part of this demand is met by recovering this metal from secondary raw materials. This has intensified the focus on recycling to satisfy supply requirements and decrease dependence on primary copper mining. Recycling copper is notably more energy-efficient and environmentally sustainable compared to primary production. It contributes to the reduction of greenhouse gas emissions and the conservation of natural resources, aligning with global sustainable development goals and the principles of the circular economy. The market for recycled copper is growing, driven by both economic incentives and environmental considerations. The global copper recycling industry is growing rapidly, driven by technological advances, regulatory support and a growing demand for sustainable practices. Taking into account global data, the value of the copper market in 2024 is estimated at USD 271 billion, of which the copper scrap market is USD 99 billion—which is approximately 37%. However, this may vary in different countries and the share of the copper scrap market may range from 20% to even 50% [1]. Taking into account the size of the copper scrap market and the relatively high price of this element, precise and accurate determination of the copper content in scrap is extremely important and its incorrect assessment may lead to financial losses. Therefore, entities dealing in the copper scrap trade are interested in a correct assessment of this element.
On the secondary raw materials market, there are various types of scrap materials differing in copper content, the most desirable of which are those with high copper content of over 95%. These may consist of copper sheets, copper dyes, guide rails, wires, pipes, shredded cables, scraps, tapes, semi-finished products, and others. The main difficulty is the correct collection of the analytical sample that represents the entire batch of scraps. Typical copper scrap processing includes separation and processing stages. Depending on the form of scrap, different recycling technologies are used. Regardless of the technology used, it is important to use accurate and fast chemical analysis methods. This is necessary from not only the perspective of planning and controlling the recycling process, but also from the business perspective. The copper content in scrap determines the value of the entire scrap batch and is the basis for settlements, which is why entities involved in the sale and processing of copper scrap focus their attention on the precise determination only on this element.
One of the most important issues is sampling. This stage is not standardized, and many companies use their own solution. Laubertová at al describes the process of obtaining analytical samples from the freight transport: a minimum 10% of the delivered scrap are taken, which is then to 20 kg and then to 8 kg—the sample that is to be homogenized by re-melting [2]. Three samples of approximately 1 g each were taken from the top, middle, and the bottom of the cast for chemical analysis.
Among many analytical methods that allow the determining of copper concentration, copper industry analytical laboratories use electrogravimetry combined with flame atomic absorption spectroscopy (EG+FAAS) as their first choice. Electrogravimetry is often used as a reference method, and the results obtained from it are considered the most reliable and precise [3]. However, it has some limitations. Firstly, it is time-consuming. Secondly, because significant amounts of acids are used for each analysis, it results in the production of strongly acidic sewage, which can contain metals such as lead or arsenic. In the case of a single sample, the consumption of concentrated acids may be assessed for 40–50 mL. Taking into account the necessary repetitions and the large number of samples in laboratory that provide service for smelter installation, the volume of acidic sewage may reach dozens of cubic meters annually.
The electrogravimetric method is one of the oldest procedures for quantitative determination of copper content. It was developed in 1864 by Wolcott Gibbs, who described the electrolysis of copper and nickel [3]. The electrolytic precipitation of copper on a platinum electrode is well known and has been described in many papers [4,5] and standards [6,7]. Electrogravimetry is a method that uses electrolysis in the entire volume of the electrolyte solution. The flow of direct current through the system causes the decomposition of the electrolyte and the release of decomposition products onto the electrodes. The method involves the weight determination of elements that are released during electrolysis as metal at the cathode or as metal oxide at the anode. The condition for proper electrogravimetric determination is to obtain clean and well-adhering metal on the electrode. To achieve this, the composition of the solution must be appropriately selected; a constant current intensity, a constant potential difference, or a specific potential of one of the electrodes must be maintained. Electrogravimetry is a routine method used to determine copper content in many industrial laboratories. The equipment necessary for this method is easily available and relatively cheap. Due to its high accuracy and good precision, as well as ensuring traceability through mass (weighing), this method is also often used as a reference method in resolving disputes. In practice, however, it is possible to make an error in the correct determination of the copper content. There are copper alloys in which other elements may also accumulate on the cathode, increasing the mass of the precipitated metal and overestimating the copper result. In the case of copper scrap samples, this can happen quite often. Therefore, before starting the electrogravimetry method, it is necessary to know the full chemical composition of the analyzed material in order to possibly remove components that interfere with copper precipitation. At this point, for example, semi-quantitative XRF analysis may be sufficient. It is also necessary to check whether electrolysis was carried out correctly and whether any copper was left in the solution. For this purpose, the solution remaining after electrolysis is analyzed for copper content, e.g., using atomic absorption spectrometry (AAS).
Recently, the use of fast elemental analyzers in recycling analysis has increased sig-nificantly. The two most commonly used techniques are X-ray fluorescence (XRF) and la-ser-induced breakdown spectroscopy (LIBS). These techniques can be integrated into large automated sorters together [8,9,10] where they perform rapid analyses, providing a huge amount of data on the composition of the analyzed material. Due to the simplicity of analysis, handheld LIBS and XRF spectrometers are becoming increasingly popular. These types of devices are easy to use, provide immediate results, do not require advanced staff training, and do not require laboratory facilities. This is often sufficient for rapid identification of the analyzed alloy [11]. However, in these applications, the results obtained with these techniques have a relatively low metrological quality, as this is not necessary for sorting or rapid identification. When considering the advantages and disadvantages of these two techniques, LIBS can analyze a wider range of elements, including lighter ones, while XRF is more effective for heavier elements. XRF is sensitive to the surface, while LIBS can provide depth profiling. Generally, XRF is easier to use and requires less complex calibrations compared to LIBS.
In this paper, the application of X-ray fluorescence spectrometry to the analysis of the composition of copper scrap was considered. The XRF method uses X-ray radiation to excite the sample and, based on the emission of its own characteristic fluorescent radiation, enables analysis of the chemical composition of the sample [12]. Spectrometers available on the market offer various possibilities; depending on the needs, they can serve as large industrial spectrometers or as much simpler and smaller benchtop or even handheld spectrometers. Due to the speed of analysis, its non-destructive nature and the possibility of measurement of many elements simultaneously, it is often used in the preliminary assessment of the composition of copper scrap. However, these are not quantitative analyses but only qualitative or semi-quantitative. This is primarily due to the lack of reference materials that are required to calibrate the XRF spectrometer to enable quantitative analysis. The high uncertainty of semi-quantitative (or so called standardless analysis) methods and the inability to ensure their measurement traceability does not allow us to accept such analysis as a certainty, which is why they are not used in financial settlements between copper scrap dealers.
This paper discusses replacing the commonly used EG+FAAS method with the application of the XRF for rapid analysis of copper scrap with >90% Cu. For this, series of six new certified reference materials (CRMs) has been developed in which composition was designed to correspond to the actual re-melted copper scrap, allowing the calibration of the spectrometer in a wide range of chemical compositions, not only for Cu, but also for Sn, Zn, Co, Cd, Sb, Ni, Fe, Pb, Bi, Ag, Al, and P. The elemental composition and their concentration range was developed in consultation with a copper scrap plant laboratory and was designed to cover a wide range of possible impurities in copper scrap. The materials were developed in accordance with ISO 17034 [13], ensuring the highest metrological quality and allowing their use in accredited laboratories.
In the case of analytical methods, the results of which are of significant importance in financial settlements such as the analysis of copper scrap, it is necessary to estimate the uncertainty of the method. There are several options for estimating uncertainty [14,15]. There is a time-consuming and complicated estimation of uncertainty based on individual components of uncertainty resulting from the entire measurement procedure. In this case, individual components are combined as standard uncertainties in order to obtain the total standard uncertainty. Another slightly easier method is validation, based on the validation parameters of the method. This method was chosen in this study. Since the EG+FAAS method is accepted as the reference method and serves as a reference for evaluating the XRF method, the estimated uncertainty and accuracy of the XRF method were compared to the uncertainty and results obtained using the EG+FAAS method.
2. Experimental
2.1. Materials
Wire copper scrap was chosen as the testing material. The laboratory received three average samples collected by one of the European copper smelter companies from the current scrap stream at 4 kg each. The samples were homogenized by re-melting in an induction furnace at 1150–1180 °C and cast into a cylindrical cast iron mold with 40 mm diameter. As a result of re-melting, mass recovery was in the range of 98–99%. The amount of losses was negligible and did not affect the overall copper composition of the sample. This allowed the discarding of produced slag and dust. The process of sample collection and preparation were carried out according to the currently used procedure in the company that deliver the samples and was not investigated.
2.2. Analytical Methods and Instrumentation
2.2.1. EG+FAAS
1.0000 g of the sample chips were placed in a 400 mL beaker and treated with 15 mL of saturated boric acid solution, 2 mL of hydrofluoric acid, and 15 mL of concentrated nitric acid (V). The beaker was covered with a watch glass and heated on a hot plate until the sample was dissolved. The prepared solution was diluted to 100 mL and ammonia was added to form a precipitate of copper (II) hydroxide. Then, 15 mL of concentrated nitric acid was added to the alkalinized solution and heated to remove nitrogen oxides. After cooling, a few drops of concentrated sulfuric acid (VI) were added. Then, the solution was diluted with distilled water of 300 mL and electrolysis was performed. For this, IKA EN 500 (Ika Labortechnik, Staufen, Germany) and WAMED EP6/1 (Wamed, Warsaw, Poland) electrolyzer with Pt-Ir (2%) electrodes were used. Electrodes were placed in the solution: a spiral anode and a weighed grid cathode. The electrolysis was carried out by a current of 2–3 A/dm3 and a voltage above 3 V. After completing electrolysis, the electrodes were rinsed with water, the beaker with the solution was removed and the cathode was dipped in acetone for a few seconds and left for 3–5 min in a laboratory dryer at a temperature of 105 °C ± 5 °C to be dried, cooled, and weighed.
The remaining electrolyte was quantitatively transferred to a 500 mL volumetric flask and filled up with demineralized water. The concentration of copper remaining in the electrolyte was determined using flame atomic absorption technique (FAAS). The spectrometer (iCE3300, Thermo Fisher Scientific, Waltham, MA, USA) was calibrated with 1000 mg copper standard solution in the range of 0.25–4.00 mg/L.
The final result of copper concentration in the sample was calculated as a sum of the copper weighted on the cathode and the copper left in the electrolyte.
2.2.2. X-Ray Fluorescence Spectrometry
The spectrometer (ZSX Primus, Rigaku, Osaka, Japan), equipped with a 4 kW rhodium anode tube, took measurements of the sample area with a 20 mm diameter. The calibration standards and the samples were in the form of cylinders with a diameter of 40 mm and a height of 20 mm. Before measurement, the sample surface was prepared using a laboratory milling machine with tungsten carbide inserts (HTP 40, Herzog Maschinenfabrik GmbH & Co KG, Osnabruck, Germany). For spectrometer calibration, six CRMs of the CCD series (Łukasiewicz-IMN, certificates are in the Supplementary Materials) and three homemade reference materials for copper (Cu99, Cu97, and Cu90) were used. For matrix absorption enhancement effects, an empirical alpha correction was used. The composition of standards used for calibration is presented in Table 1. The total analysis per sample took approximately 8 min.

Table 1.
Standards used for calibration of the XRF spectrometer. All concentrations in %.
3. Results and Discussion
Three samples of re-melted high-quality copper scrap were analyzed using the two methods discussed in this paper for comparison. For each examined material, three samples were cut off from the top, middle, and the bottom of a casted rod. Such an approach to sampling ensured good representativeness of the results for the rod. For the gravimetric method, drilled chips from the entire length of the sample cross-section were taken. The results, obtained from gravimetric and XRF methods, are presented in Table 2. In the case of XRF, in addition to the copper concentration, the contents of the remaining 12 elements were also determined. The expanded uncertainty (k = 2) for copper analysis by XRF UCu,XRF was estimated to be 0.23%, while gravimetry UCu,grav was estimated to be 0.23%. For both, uncertainty was estimated using a method based on validation parameters. The concentration of Co, Cd, Sb, and Bi was under the detection limit of the spectrometer, which were as follows (ppm): 10, 50, 50, and 50. In total, for the analysis of copper in one cable scrap sample (3 measurements from different sampling locations) using the EG+AAS method, it was estimated that approximately 1.5 L of acidic waste was generated, while the XRF method did not generate any hazardous waste at all (only a few grams of easily manageable chips from milling the surface).
Table 2.
Results for Cu concentration (%) in 3 samples of high-quality copper scrap obtained by EG+FAAS method, and Sn, Zn, Ni, Fe, Pb, Ag, Al, and P by XRF method.
The results obtained using the EG+FAAS method were considered as the reference. For all three samples, the results were in good agreement within the uncertainty range of the methods. In addition, to assess the validity of the newly developed XRF method, a paired samples t-test was performed to determine whether there was a significant difference between these two methods [16]. For this, the t value was calculated. The condition for considering the differences between the methods as insignificant was to obtain a value lower than critical . First, the difference for each pair of results (EG+FAAS and XRF results) was calculated. Then, from the resulting differences, the mean value and its standard deviation were calculated. The formula for calculating t was as follows:
where is the number of degrees of freedom (in our case ).
The calculated value was 0.675 and the critical value, read from the student’s t-distribution tables [17], was 2.306 (for significance level α = 0.05). Therefore, the criterion was met; thus, the results for copper concentration obtained using the XRF method do not differ significantly from the results obtained using the EG+FAAS method. The new XRF method can be considered as correct for copper determination in re-melted cable scrap. Obtaining quantitative information about the content of the other 12 elements is an undoubted advantage here.
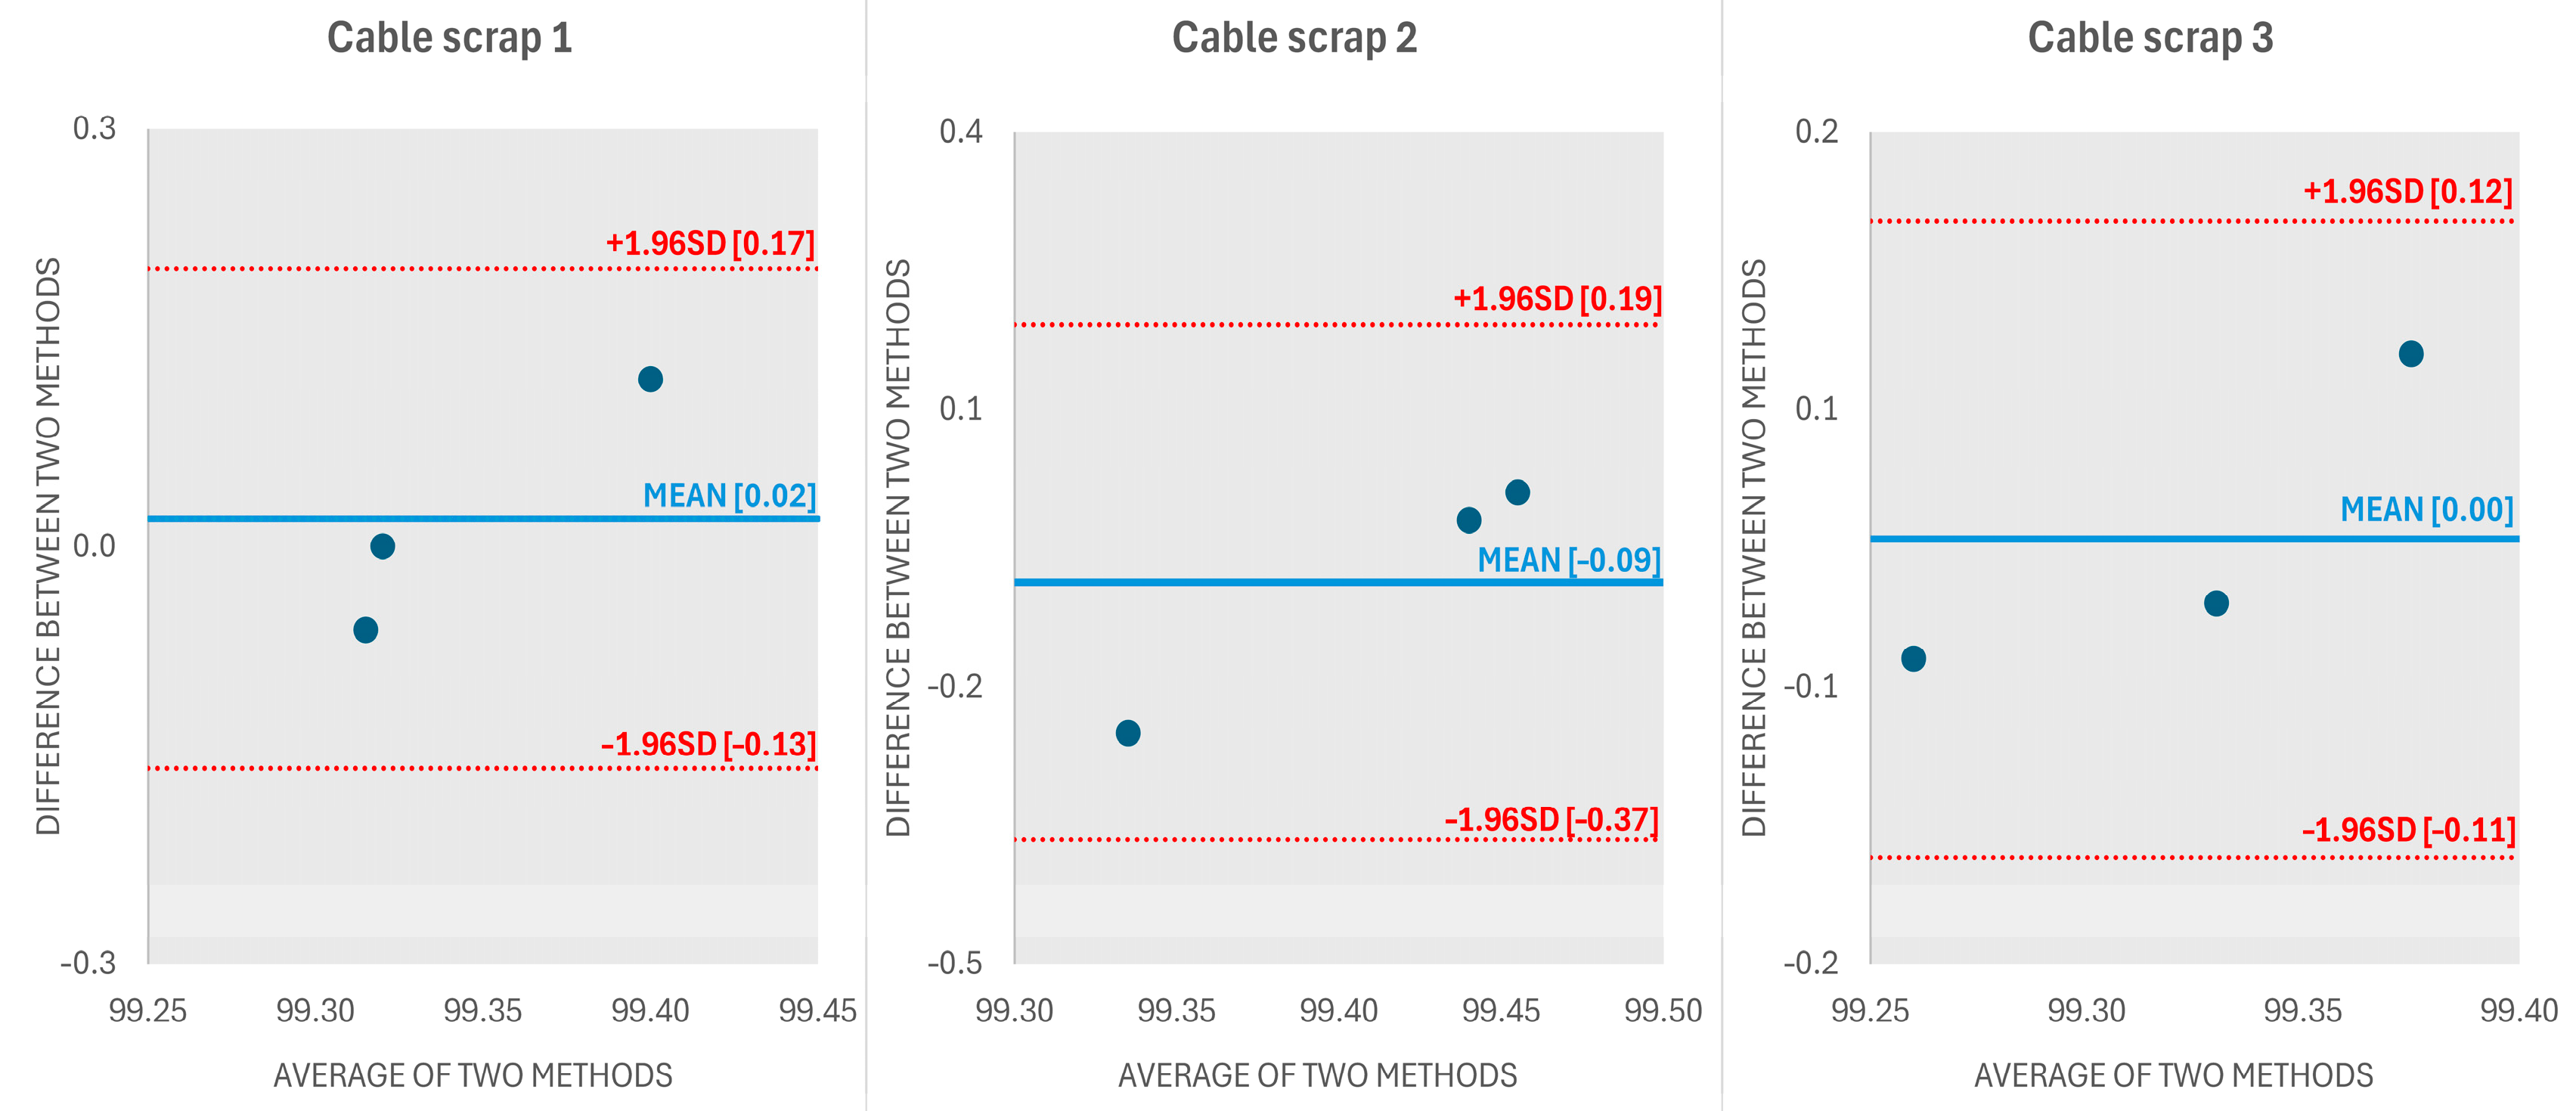
For the graphical presentation of the evaluation of two different measurement methods, a Bland–Altman plot, also known as a difference plot, was used [18]. This is a graphical method used to assess the agreement between two different measurement methods and is particularly useful when comparing a new method with a reference method. It can be noticed (Figure 1) that there are no outliers in the graph that fall outside the limits of agreement, (red dashed lines) so the methods can be considered as consistent.
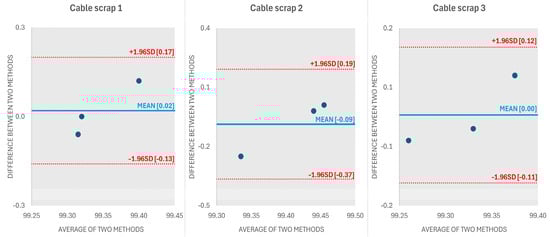
Figure 1.
Bland–Altman plot for results obtained with EG+FAAS and XRF methods for 3 copper cable scrap samples.
4. Conclusions
To summarize, the use of the XRF technique for precise and correct determination of copper content in samples of re-melted high-quality copper scrap is possible, and the quality of the results is statistically equal to the reference EG+FAAS procedure. However, this requires calibrating the spectrometer with standards of appropriate composition that corresponds with typically analyzed samples. This work proves that the use of commercially available CRMs for this purpose, in the form of a series of six CCD standards and three homemade copper reference materials, allows the obtaining of correct calibration and copper concentration results. Moreover, XRF analysis, in addition to the high compliance of the copper result in comparison with the reference EG+FAAS method, provides more information about the content of the following 12 elements: Sn, Zn, Co, Cd, Sb, Ni, Fe, Pb, Bi, Ag, Al, and P. The use of CRMs for calibration ensures measurement consistency and traceability; therefore, this type of analysis can be used in laboratories accredited to work in accordance with the ISO 17025 standard [19]. An undoubted advantage of the XRF analysis of copper scrap after melting is the speed of carrying out the entire procedure analytical time, which can be estimated at 10 min (including sample preparation) in contrast to the few hours needed to analyze copper with electrogravimetry and FAAS. Moreover, the method does not require acidic digestion, and the analyzed disks may be recovered to the recycling stream so it can be treated as waste-free. This decreases laboratory costs of savage utilization and strongly limits the environmental impact of the analytical process. A risk worth mentioning in XRF analysis is the possibility of making an error in the case of copper alloys with elements that are impossible to determine by this method. This applies to beryllium, which occurs as an alloying element in some copper alloys.
5. Patents
Method of manufacturing materials intended for certified reference materials (CRMs) for testing copper-based alloys, Patent Office of the Republic of Poland, Application no. P.448491.
Supplementary Materials
The following supporting information can be downloaded at: https://www.mdpi.com/article/10.3390/recycling10020036/s1, S1: Certificate of reference material CCD1: CCD1.pdf; S2: Certificate of reference material CCD2: CCD2.pdf; S3: Certificate of reference material CCD3: CCD3.pdf; S4: Certificate of reference material CCD4: CCD4.pdf; S5: Certificate of reference material CCD5: CCD5.pdf; S6: Certificate of reference material CCD6: CCD6.pdf.
Author Contributions
Conceptualization, J.A. and T.G.; methodology, J.A.; validation, S.K. and J.K.; formal analysis, S.K. and J.A.; writing—original draft preparation, J.A.; writing—review and editing, T.G.; project administration, J.A.; funding acquisition, J.A. All authors have read and agreed to the published version of the manuscript.
Funding
This research was funded by the National Center for Research and Development, grant number LIDER/29/0110/L-11/19/NCBR/2020.
Data Availability Statement
Data are contained within the article.
Conflicts of Interest
The authors declare no conflicts of interest. The funders had no role in the design of the study, in the collection, analyses, or interpretation of data, in the writing of the manuscript, or in the decision to publish the results.
References
- Global Recycled Copper Market Size, Share, Trends & Growth Forecast Report By Application (Building and Construction, Transportation, Industrial Machinery and Equipment, Electricity and Electronics, and Others), By Copper Scrap Grade (Bright Bare Copper, Number 1 Copper, Number 2 Copper and Number 1 Insulated Wire) and Region (North America, Europe, Asia Pacific, Latin America, and Middle East & Africa), Industry Analysis From 2024 to 2032. Available online: https://www.marketdataforecast.com/market-reports/recycled-copper-market (accessed on 17 January 2025).
- Laubertova, M.; Havlik, T.; Trpčevská, J.; Piroskova, J. Methodology of sampling in secondary copper processing. Metall 2016, 3, 78–81. [Google Scholar]
- Owen, J.F.; Patterson, C.S.; Rice, G.S. Electrogravimetric Determination of Cobalt, Nickel, and Copper in Presence of Chloride Ion. Anal. Chem. 1983, 55, 990–992. [Google Scholar] [CrossRef]
- Lubert, K.-H.; Kalcher, K. History of Electroanalytical Methods. Electroanalysis 2010, 22, 1937–1946. [Google Scholar] [CrossRef]
- Pietrzyk, D.J.; Frank, C.W. Chapter Seven—Precipitation Methods. In Analytical Chemistry, 2nd ed.; Academic Press: London, UK, 1979; pp. 90–130. [Google Scholar] [CrossRef]
- Burns, D.T.; Szabadvary, F.; Zolotov, Y.A. History of Analytical Science. In Encyclopedia of Analytical Science, 3rd ed.; Worsfold, P., Poole, C., Townshend, A., Miró, M., Eds.; Elsevier: Amsterdam, The Netherlands, 2019; pp. 399–410. [Google Scholar] [CrossRef]
- EN 16117-1:2011; Copper and Copper Alloys—Determination of Copper Content—Part 1: Electrolytic Determination of Copper in Materials with Copper Content Less Than 99,85%. CEN: Brussels, Belgium, 2011.
- EN 16117-2:2014; Copper and Copper Alloys—Determination of Copper Content—Part 2: Electrolytic Determination of Copper in Materials with Copper Content More Than 99,80%. CEN: Brussels, Belgium, 2014.
- Van den Eynde, S.; Diaz-Romero, D.J.; Engelen, B.; Zaplana, I.; Peeters, J.R. Assessing the Efficiency of Laser-Induced Breakdown Spectroscopy (LIBS) Based Sorting of Post-Consumer Aluminium Scrap. Procedia CIRP 2022, 105, 278–283. [Google Scholar] [CrossRef]
- Díaz-Romero, D.J.; Van den Eynde, S.; Sterkens, W.; Eckert, A.; Zaplana, I.; Goedemé, T.; Peeters, J. Real-Time Classification of Aluminum Metal Scrap with Laser-Induced Breakdown Spectroscopy Using Deep and Other Machine Learning Approaches. Spectrochim. Acta Part B At. Spectrosc. 2022, 196, 106519. [Google Scholar] [CrossRef]
- Kölking, M.; Flamme, S.; Heinrichs, S.; Schmalbein, N.; Jacob, M. More Resource Efficient Recycling of Copper and Copper Alloys by Using X-Ray Fluorescence Sorting Systems: An Investigation on the Metallic Fraction of Mixed Foundry Residues. Waste Manag. Res. 2024, 42, 814–822. [Google Scholar] [CrossRef] [PubMed]
- Piorek, S. Rapid Sorting of Aluminum Alloys with Handheld µLIBS Analyzer. Mater. Today Proc. 2019, 10, 348–354. [Google Scholar] [CrossRef]
- Bertin, E.P. Principles and Practice of X-Ray Spectrometric Analysis, 2nd ed.; Plenum Press: New York, NY, USA, 1975. [Google Scholar]
- ISO 17034:2016; General Requirements for the Competence of Reference Material Producers. ISO: Geneve, Switzerland, 2016.
- Barałkiewicz, D.; Pikosz, B.; Belter, M.; Marcinkowska, M. Speciation Analysis of Chromium in Drinking Water Samples by Ion-Pair Reversed-Phase HPLC–ICP-MS: Validation of the Analytical Method and Evaluation of the Uncertainty Budget. Accredit. Qual. Assur. 2013, 18, 391–401. [Google Scholar] [CrossRef]
- Paired Samples t-Test: Definition, Formula, and Example. Available online: https://www.statology.org/paired-samples-t-test/ (accessed on 17 January 2025).
- Critical Values of the Student’s t Distribution. Available online: https://www.itl.nist.gov/div898/handbook/eda/section3/eda3672.htm (accessed on 17 January 2025).
- Martin Bland, J.; Altman, D.G. Statistical methods for assessing agreement between two methods of clinical measurement. Lancet 1986, 327, 307–310. [Google Scholar] [CrossRef]
- ISO/IEC 17025:2017; General Requirements for the Competence of Testing and Calibration Laboratories. ISO: Geneve, Switzerland, 2017.
Disclaimer/Publisher’s Note: The statements, opinions and data contained in all publications are solely those of the individual author(s) and contributor(s) and not of MDPI and/or the editor(s). MDPI and/or the editor(s) disclaim responsibility for any injury to people or property resulting from any ideas, methods, instructions or products referred to in the content. |
© 2025 by the authors. Licensee MDPI, Basel, Switzerland. This article is an open access article distributed under the terms and conditions of the Creative Commons Attribution (CC BY) license (https://creativecommons.org/licenses/by/4.0/).