Abstract
Polystyrene pots and trays are a promising input material for a closed packaging-to-packaging cycle. For the evaluation of the food law compliance it is necessary to know the possible contamination with substances from the first use but also from cross-contamination during recollection or even from possible misuse of the packing for storage of hazardous chemicals. As part of the study, 49 conventionally recycled PS samples from six European countries were analyzed for contamination. A rapid screening method was used, which has already been applied to PET recyclates. The 30 most highly concentrated substances were semi-quantified and identified. Overall, 10,310 individual post-consumer PS packages were investigated. Evidence of misuse of the PS pots and trays was found in one samples with the substance pinene at a concentration of 475 to 711 mg/kg. The incidence of misuse is therefore 0.0097%. The maximum initial concentration was determined 0.069 mg/kg or to 0.65 mg/kg under worst-case assumptions. Based on the data, an initial concentration of 1 mg/kg in post-consumer washed post-consumer rPS flakes is suggested as pragmatic worst-case approach in the evaluation of consumer safety of rPS containing food packaging.
1. Introduction
Polystyrene (PS) widely used in food packaging [1] and is a promising polymer for circularity in packaging materials. PS can be very purely sorted with existing technology out of the waste collected in systems established in particular in Europe. It has a substantial collection rate and, like PET, it is a low diffusive polymer. The latter means that PS absorbs only few contaminants into the polymer and, if it has absorbed any, only releases them back into the food in very small quantities. In addition, PS packaging is typically used for food with short shelf life under refrigerated storage conditions, which reduces also the migration from the packaging material into food. The migration properties of PS are therefore very similar to PET, where recycling from packaging to packaging has been working for decades [2,3,4,5,6,7].
Plastic recyclates in contact with food, in particular those from mechanical recycling, must generally comply with EU Regulation 2022/1616 [8], which differentiates between technologies that the European Commission has already determined to be “suitable” and “novel” technologies, which generally have not yet undergone a safety assessment by the European Food Safety Authority (EFSA). PS recyclates (rPS) in direct contact with food are not yet assessed and therefore the recycling processes behind them are categorized as novel technologies. According to EU Regulation 2022/1616, the developer of a novel technology has to submit a notification to the national Competent Authority as well as to the European Commission. This notification includes an initial safety report with data which show that the post-consumer recyclate is safe for the intended food contact applications. rPS can be applied in direct contact to food [9] as well as behind a functional barrier of virgin PS [10,11,12,13]. EFSA assesses the safety of the novel technology based on the initial safety report as well as subsequently monitored and reported data, among other things, to prepare the decision of the European Commission on the suitability of the recycling technology. The timeline for evaluation by EFSA is defined in EU Regulation 2022/1616 ranges from 3.5 years after notification up to seven years until authorization is granted. However, recyclates produced with a duly notified novel technology may be used in contact with food already prior to an assessment by EFSA, under stringent conditions.
According to EU Regulation 2022/1616, only the materials which have been intended for food contact are allowed to enter the recycling stream to new food packaging materials [8]. In addition, the recycling process has to be able to reduce any contamination in plastic to a concentration that does not pose a risk to human health. The recycled plastic products, like all food contact materials, under normal or foreseeable condition of use, must not transfer their constituents to food in quantities which could endanger human health or bring about an unacceptable change in the composition, taste and odor of food [14,15].
In contrast to Europe, some recycling processes have already been approved by the US Food and Drug Administration (FDA) in the USA [16]. According to the FDA guidance document [17] the maximum acceptable level of a residual contaminant in rPS is 300 µg/kg that corresponds to an edible daily intake equal to 1.5 µg/person/day.
One of the main parameters for the safety evaluation of post-consumer rPS for food packaging applications in Europe as well as in the USA is the concentration of potential contaminants in conventionally recycled post-consumer rPS flakes before deep-cleansing and decontamination (the so-called super-clean process). Conventionally recycled PS are typically hot washed and ground flakes. Sometimes the flakes are additionally extruded to rPS pellets. Various analytical techniques were used in order to identify the differences between virgin and recycled PS [18,19,20,21,22,23]. In mechanical recycling, the content/pattern of volatile organic compounds (VOCs) was found to change as a consequence of high temperature and oxygen. Substances like benzaldehyde, acetophenone and other oxygenated derivates of styrene were identified as marker compounds for the discrimination of rPS. However, quantitative data on the content of individual compounds in recycled PS are to the knowledge of the authors rare in the scientific literature, and even if they are present, they are not up to date regarding the applied sorting and recycling steps of modern recollection and recycling processes [24]. Only one study quantified the oxidation products benzaldehyde and acetophenone in rPS from yogurt packaging to 0.86 mg/kg and 0.13 mg/kg respectively [19].
Conventionally recycled PS flakes or pellets are the input material for super-clean processes as well as for the core layer of ABA sheets with a functional barrier of virgin PS (A layer) [9,13]. Therefore, the input contamination level of these conventionally recycled PS flakes, which is a measure of the chemical purity of the PS return in the collection system, is of interest. It includes the possible misuse of PS packaging for the storage of hazardous substances and also the formation of degradation products during previous life of the material or in the recycling process. The degree of contamination of recyclates must therefore be monitored [8].
Due to the lack of statistical data for the so-called “misuse” of PS container for storage of (solid) household chemicals, as a benchmark, the initial contamination levels in polyethylene terephthalate (PET) post-consumer samples can be used. Criteria for the evaluation of recycling processes for post-consumer PET were published [25,26,27] and were used for the safety evaluation of more than 200 opinion letters published by EFSA to date [28]. Regarding the initial concentration of substances in post-consumer PET following contaminants are considered by EFSA [25,27]:
- Contaminants from possible misuse of the PET containers to store chemicals;
- Contaminants from non-food contact PET applications (e.g., non-authorized monomers and additives, or chemicals from non-food consumer products);
- Chemicals from materials other than PET (e.g., PVC, polyolefins, glues, caps, sleeves, labels, polyamides);
- Chemicals used in the recycling process (e.g., detergents);
- Degradation products during recycling;
- Components from packaged food.
In case of post-consumer PET, EFSA followed the results of the European Project FAIR-CT 98-4318 [3,29], which provides data to estimate average input contamination levels in collected PET and the incidence of contamination. The study provided analytical screening data on washed post-consumer PET flakes from twelve European countries [29]. Limonene, which is a flavor substance from soft drinks, was found as a post-consumer contaminant in PET at an average level of 2.9 mg/kg and at a maximum concentration of approximately 20 mg/kg. Contaminants related to other polymers than PET (e.g., phthalates, adipates, slip agents like erucamide etc.) were found only sporadically in concentrations below of 0.5 mg/kg. Chemicals from misused bottles were found in only in three bottles, or more correctly in individual post-consumer PET bottle flakes after conventional recycling, out of approximately 7000 PET bottle flakes. In these “misused” bottle flakes solvents like (i) toluene at a concentration of 4500–6750 mg/kg, (ii) toluene at a concentration of 2000–3000 mg/kg, and (iii) xylene at a concentration of 2000–3000 mg/kg were found. From this experimental data, the incidence of misuse in post-consumer collected PET bottles was about 0.04% at maximum concentrations of 4500 to 6750 mg/kg and results in input concentrations of 1.4 to 2.7 mg/kg in case of misused PET bottles [29]. Following these figures on the misuse of PET bottles, EFSA stated in their evaluation guidelines that “the reference contamination level for misuse for individual substances in the input of a PET recycling process is set at 3 mg/kg PET, corresponding to the worst case figure obtained from the experimental data” [25,27]. Substances from other sources like non-food applications, degradation products, etc. were below these worst-case concentrations and are thus taken into account with the worst-case concentration of 3 mg/kg in washed post-consumer PET flakes.
The aim of this study was a screening of post-consumer rPS according to migration relevant substances, similar to the approach for PET bottles in order to support the food law compliance evaluation of rPS. The study was conducted similar to the screening for substances in post-consumer PET [29] not least because the procedure was accepted by the EFSA. Limonene, as a key compound in post-consumer recyclates, was determined quantitatively by using established, validated and accredited methods also used for PET Other substances relevant for migration, which can be determined in the post-consumer rPS, were identified and semi-quantified.
2. Results
2.1. Study Design
Post-consumer rPS flake samples were collected from six countries in Europe (Belgium, France, Germany, Italy, Sweden and Switzerland). Overall 49 individual batches of post-consumer rPS were collected over a sampling time of approximately two years. From each rPS samples six subsamples were drawn and analyzed. The amount of individual flakes was counted in all subsamples. The mean value of individual PS flakes was determined to 35.1 ± 7.0 per 1.0 g subsample, which indicates that the flake size was relatively homogeneous and showed no significant differences in the different countries or recyclers. Overall, a total amount of 10,310 individual rPS flakes were analyzed within the 294 subsamples. The analyzed amount of individual post-consumer rPS flakes is therefore in a similar or even higher range as for the PET study [29]. Due to the high amount of flakes in investigated samples and because of mixing of the flakes during washing, it is most unlikely that two flakes from the same PS packing (pot or tray) are within 1.0 g subsample. Therefore it can be concluded that 10,310 individual post-consumer PS packaging samples were investigated for the input contamination levels in PS recollected waste and for hints of misuse of the packaging materials. In addition to the recyclate samples, eight samples of PS virgin material were also analyzed. The virgin material used as reference are the ready-formulated PS sheets that were used to make yogurt pots. All samples were analyzed using headspace gas chromatography, which detects the substances relevant for migration. The method is very similar to the method used for PET. Only the equilibration temperature was slightly lowered compared to PET due to the higher oxidation sensitivity of PS.
2.2. Contamination Levels in rPS Flakes
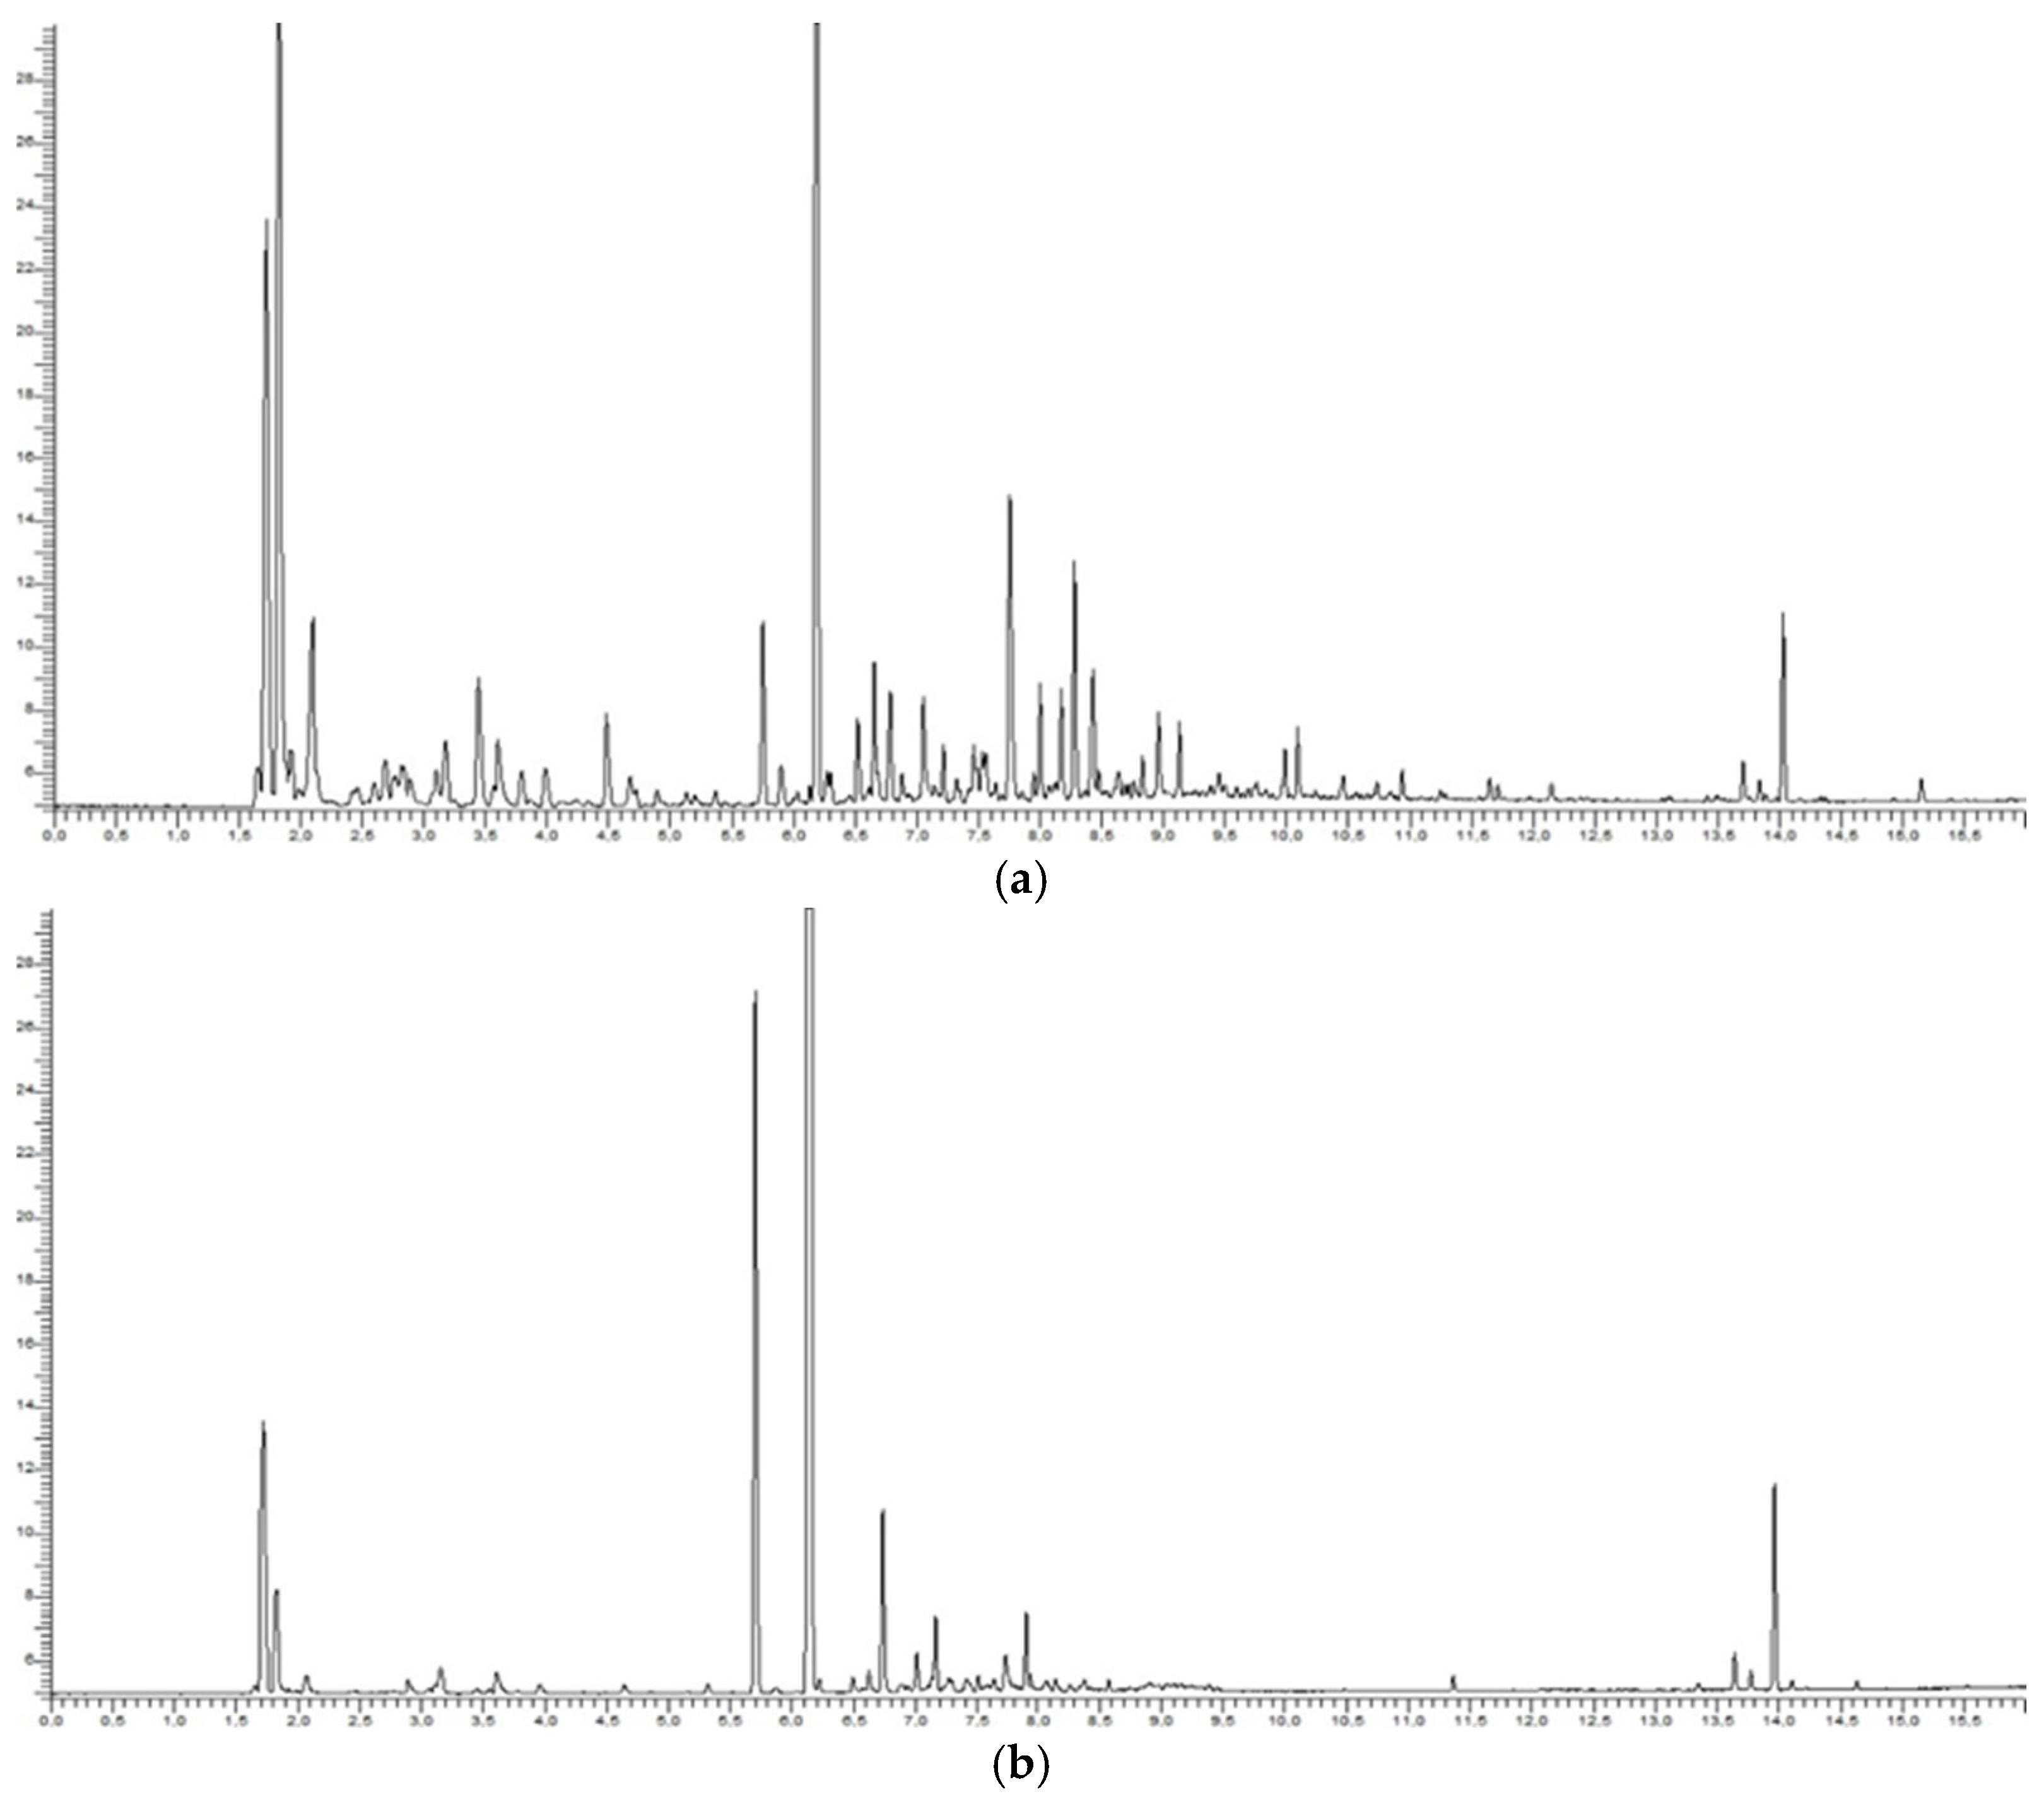
All 294 headspace gas chromatograms were analyzed according to the frequency of the detected substance peaks and also according to their concentration. An example of a representative headspace gas chromatogram of a rPS flake sample is shown in Figure 1a. Virgin PS samples were analyzed with the same screening method as a reference material, which is given in Figure 1b. The gas chromatographic fingerprints of the investigated post-consumer PS flake samples are very similar. This indicates that the collection of the PS input as well as the conventional recycling is very homogeneous. The majority of the detected substance peaks were found in all post-consumer PS samples and also in most cases in virgin PS. Only the concentrations of the substances are (slightly) different and the occurrence of substance peaks in lower concentrations in the various samples analyzed was also different. Significant geographical or seasonable differences in the gas chromatograms were not found. In each of the 294 samples, the post-consumer substance limonene (retention time 8.22 min) was quantified by use of standard addition method. The mean concentration of limonene was 6.9 mg/kg (median 6.6 mg/kg). The maximum concentration of limonene in an individual subsample was 110 mg/kg.
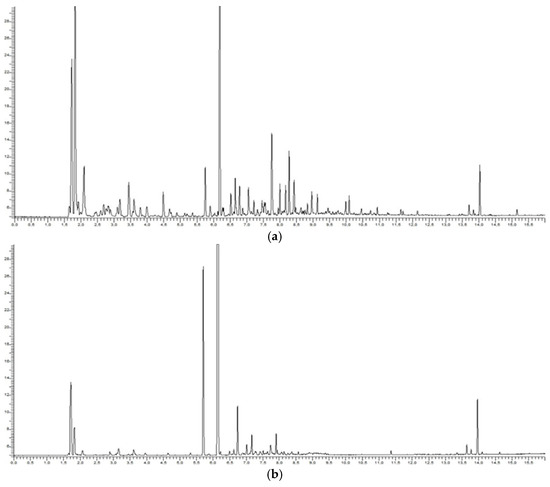
Figure 1.
Representative headspace gas chromatograms of washed post-consumer rPS flakes (a) and virgin HIPS sheets (b).
Substance peaks in high concentrations like solvents were not detected in the samples. As mentioned in section “introduction”, the incidence for PET was 0.04% and the highest concentration of a solvent (toluene) was 6750 mg/kg. Assuming the same flake size for PET, but higher specific gravity of PET, results in 24 flakes per 1.0 g of PET and also assuming the concentration (6750 mg/kg) of a solvent in one individual PET flake results in a mean concentration of 280 mg/kg per individual 1.0 g sample in post-consumer PET. The same approach for PS results in a concentration of 192 mg/kg of a solvent (like toluene) in a 1.0 g sample of post-consumer rPS. A concentration of 192 mg/kg of a solvent is in a similar concentration range as found for the residual monomer styrene and would be easily to detect with the applied method. However, hints for chemicals like solvents in such high concentrations were not found in the investigated samples.
2.3. Quantification of Substances in Conventionally Recycled PS
According to EU Regulation 2022/1616 [8], at least the first 20 substances (incidental contaminants) with a molecular weight below 1000 g/mol in input and corresponding output of the installations using a novel recycling technology must be reported every six months. Since this study is independent of possible super-clean recycling processes, the input samples (washed flakes) were measured. On the other hand, substances relevant for migration are below 250 g/mol, because PS is a low diffusive polymer similar to PET [30] (see Section 3.4). Therefore, this molecular weight range was considered for substances relevant for migration. Substances with higher molecular weight will not migrate in significant quantities under the application conditions.
The post-consumer substance limonene was quantified by use of external standards and a calibration curve. All other substances were semi-quantified by use of the limonene as multi-analyt standard. Subsequently, the concentrations of the detected substances were sorted in descending order by their highest concentration in each of the subsamples. The most relevant substances identified in post-consumer PS flakes were the residual monomer styrene and ethylbenzene. These substances, however, are not incidental substances detected in post-consumer PS. These substances can be detected in every PS sample, also in virgin PS (in similar or even higher concentrations). Due to the fact that some substances also occur in virgin PS, not only the first 20 substances were evaluated, but a total of 30 per measured subsample. For this purpose, the 30 substances with the highest concentrations were evaluated in each analyzed sample and summarized with their concentration, standard deviation, median and frequency of detection of the substances in all measured samples (Table 1). The results of the 30 substances with the highest concentration in all investigated samples are listed in descending order of their highest concentration. In addition, the mean value and the standard deviation of these substances were given, as well as the frequency these substances occurred in the subsamples.

Table 1.
Substances detected in 294 rPS subsamples (washed flakes) before super-cleaning and their semi-quantification using limonene as a multi-analyt standard sorted by highest concentration (Top 30 of 91 detected substances).
Some of the substances detected occurred in (nearly) all samples measured (100% percentage), such as styrene and ethylbenzene. Other substances only occurred sporadically in a few samples or even in a single sample (percentage 0.3%). A total of 294 individual subsamples were measured in which a total of 91 substances were detected. Many of the substances were detectable in almost all samples measured. This indicates that these are typical substances for PS, i.e., by-products from production or oxidation and degradation products. However, 21 of the 91 substances detected occurred in only one of the 294 subsamples. The highest concentration was quantified via a limonene standard to 16.9 mg/kg. The substance was identified as α- and β-pinene. Both pinenes are cis trans isomers which are co-eluating under the applied chromatographic conditions. However, due to the very similar mass spectra of terpenes, it could also be a different terpene. Terpenes are flavoring substances that are found in many foods or are even added to them. α- and β-Pinene is major ingredients of pine oil and might be therefore a substance of misuse. If one also assumes that only one flake of the average 35.1 ± 7.0 flakes was contaminated in each sample, then the concentration in this flake (or the associated packaging) is around 475–711 mg/kg. This is a factor of approx. 10 lower than the maximum concentrations measured in PET (4500–6750 mg/kg) [29]. Nine substances were detected twice in the samples, 7 substances occurred 3 times and two substances were found 5 times in the investigated subsamples. All these sporadic substances were detectable in concentrations lower than 10 mg/kg except n-pentane with a maximum concentration of 178.9 mg/kg (mean concentration in five samples 42.4 ± 76.3, median 8.4 mg/kg). However, n-pentane is very unlikely to be an incidental contaminant during use of the packaging. n-Pentane is used as a foaming agent in the production of expanded PS. It is rather the contamination of foamed PS in the recollected PS packaging materials. Furthermore, n-alkanes and oxidized substances were detected. The n-alkanes most likely originate from polyolefin impurities, which contain the n-alkanes as oligomers. The oxidized substances were either formed during conventional recycling or during sample preparation for headspace analysis at 150 °C. This was carried out under normal atmosphere. Tests under inert gas show significantly lower concentrations of oxidized substances, which supports the hypothesis that the concentrations of oxidized substances are increased during sample preparation.
3. Discussion
3.1. Comparison Between PET Bottles and PS Pots/Trays
In terms of consumer behavior, PET bottles are much more suitable for storage of liquids compared to PS pots or trays, because PET bottles can be re-sealed with a closure. PS pots or trays cannot be re-sealed and are therefore not suitable for storage of liquid chemicals. In addition, solvents such as toluene dissolve PS and destroy the PS container, which is not the case for PET. Therefore, the likelihood of PS pots or trays being used to store hazardous liquid chemicals is most likely significantly lower than with PET bottles. As a consequence, the incidence for misuse of PS pots or trays for storage of chemicals is most likely much lower than that for PET. In addition, due to the lack of re-sealability only short-term storage of liquids or only solid chemicals can be filled into PS pots or trays. Solid chemicals are high molecular substances with very low diffusion rates in PS (or in polymers in general). Consequently, the sorption of high molecular weight chemicals into PS will be very low due to the low diffusivity of PS [30]. Therefore, a lower incidence of misuse of PS pots or trays is expected compared to PET bottles. In addition, a low sorption rate will most probably result in very low initial concentrations of potential contaminants in washed PS flakes, much lower compared to PET.
3.2. Regional and Seasonal Influences on the “Chromatographic Fingerprints”
The gas chromatographic fingerprints of the investigated post-consumer PS flake samples were very similar. Significant geographical or seasonal differences in the gas chromatograms were not found, neither in significant amounts of detected substance peaks nor in significant differences in the determined concentrations. In comparison to the benchmark PET [29], the headspace fingerprints of the investigated post-consumer PS flake samples are also homogeneous as found for post-consumer PET.
3.3. Evaluation of the Initial Contamination Levels
Within this study, 10,310 individual PS flakes were analyzed regarding substances from storage of chemicals or from other sources like cross contamination during collection or degradation. Only one substance might occur from misuse of storage of pine oil (or similar product) in a PS pot or tray. Therefore, the incidence for misuse is 0.0097%. This incidence is a factor of 3–4 lower as found for PET [25,26,27,29]. According to the argumentation given above (Section 3.1), a lower incidence is reasonable for post-consumer PS and the experimental results are in good agreement with theoretical considerations on misuse of non-resealable PS pots or trays.
Using the determined concentration of pinene of 711 mg/kg the concentration of a “misused” substance in post-consumer PS is 0.069 mg/kg. Assuming the same concentration as found for PET (6750 mg/kg [25,26,27,29]), the maximum concentration of a “misuse” solvent in post-consumer PS will be 0.65 mg/kg which was calculated from the incidence and the highest concentration found in PET. Due to the argumentation given in Section 2.1 contamination of post-consumer PS with misused chemicals is—if at all—only possible as short term storage or with solid chemicals. Solid chemicals, however, will be absorbed into PS in low amounts due to the lower diffusivity in PS of solid chemicals compared to solvents. Therefore, the assumed concentration of 6750 mg/kg for a solvent like toluene is most unlikely and can be considered as worst-case. The highest concentration of a single substance in the investigated flake samples was 475–711 mg/kg for a flavor substance identified as pinene, which is significantly lower as the concentrations found in PET. Other sporadic contamination in the samples were below of 10 mg/kg. Substance with higher concentrations were typical substances for PS and most of them were detected also in virgin PS. This indicates that these substance peaks are degradation products and not chemicals from misuse of PS trays. If we assume these substance peaks as “contaminants” (not misused chemicals) at a concentration of 10 mg/kg the initial contamination level will be 0.00097 mg/kg, which is a roughly a factor 670 lower than the value calculated with the maximum contamination level of PET of 6750 mg/kg.
The results of this study shows, that the incidence of misuse as well as the initial concentration levels before super-clean recycling is (much) lower compared to PET. Due to the fact that the EFSA’s evaluation scheme requires an initial concentration level, as a pragmatic approach, an initial concentration of 1 mg/kg for post-consumer PS can be considered as worst-case and included reasonably high safety factors.
3.4. Molecular Weight Range Relevant for Migration
Within the study, a molecular weight range up to about 250 g/mol was considered as relevant for migration into food. This approach is similar to PET [29], which is also a low diffusive polymer. This molecular mass range is relevant for migration from PS for food contact applications. The migration (in µg/kg) for substances with molecular weights up to 500 g/mol is shown in Figure 2 for the relevant storage conditions for PS packaging applications. The following storage conditions were calculated:
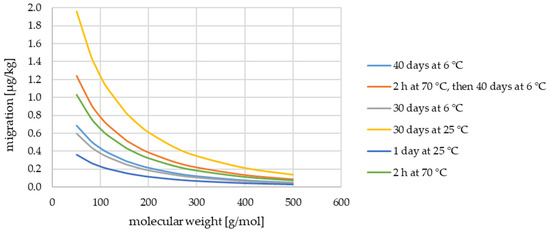
Figure 2.
Predicted migration with an initial concentration of 1 mg/kg according to the AP prediction model [30] and a OEF = 5 (AP = 1, τ = 0 K, EU cube, K = 1, density = 1.04 g/cm3).
- Pots for cold-filled yogurt with storage conditions of 40 days at 6 °C;
- Pots for hot-filled yogurt with storage conditions of 2 h at 70 °C followed by storage for 40 days at 6 °C;
- Trays for meat, fish and cheese with storage conditions of 30 days at 6 °C;
- Trays for fruit and vegetables with storage conditions of 30 days at 25 °C;
- Pots for cold drinks with storage conditions of 1 day at 25 °C;
- Pots for hot drinks with storage conditions of 2 h at 70 °C.
For the migration prediction, the AP prediction model [30,31] was used, which is also applied by EFSA for the evaluation of mechanical PET recycling processes [25]. However, it should be noted, that the AP model is highly over-estimative, especially for high molecular weight substances. EFSA considered the over-estimative character of the AP prediction model for PET with a general over-estimative factor (OEF) of 5 [25]. However, this OEF only takes the extent of real migration into account to a very limited extent, especially for low diffusive polymers like PET and PS. From the data of the previous study, OEFs in the range of 15–20 are more likely for small molecules at refrigerator conditions [9]. For low-volatile substances, the OEFs are already well above 250. The OEF decrease with increasing temperature but are still above 5 at 40 °C. Temperatures of 40 °C are applied only for short times during filling of yogurt so that the impact on migration is very small.
For the most relevant application, cold-filled yogurt, considering an initial concentration of 1 mg/kg, a fictive molecule with a molecular weight of 83 g/mol is in compliance with the migration of 0.5 µg/kg which was the migration threshold limit for yogurt (Table 2 in [9]). It should be noted that the migration calculations were made without considering any cleaning efficiency of the super-clean recycling process. In addition, toluene (molecular weight of 92 g/mol) has an OEF of 20.8 at 5 °C instead of 5 [9] which give additional safety here. Considering the AP predictions, for worst-case application with storage at 25 °C for 30 days for example the migration threshold limit of 0.5 µg/kg could not be overcome by substances with a molecular weight above 250 g/mol. However, the discussion is complicated by the fact that the prediction model over-estimates the migration by a large margin and the OEF depend on the molecular weight of the migrants. A more realistic prediction model should overcome these problems and would make OEF unnecessary. Such a realistic model for PS has been already published [32]. This model is based on experimentally determined activation energies of diffusion EA, which considers the temperature dependency of the diffusion coefficient more correctly as the AP model, which assumes an activation energy of 100 kJ/mol for all migrants independent from their molecular weight or size. This EA based model predicts a much faster decline in migration than the AP model. Thus, the substances relevant for migration are in the range far below about 250 g/mol. However, validation data for the realistic prediction model especially for low temperatures are not published till now. The activation energy based prediction model therefore has actually a high uncertainty especially when the diffusion coefficients are extrapolated over a wide temperature range down to 6 °C. Nevertheless, the general conclusion that only low molecular weight substances are relevant for migration is supported by the realistic prediction model.
4. Materials and Methods
4.1. Sample Materials
Post-consumer PS flake samples, which are collected from household separate collections (e.g., curbside collections, green dot systems), were analyzed regarding post-consumer impurities. The samples were recollected in Belgium, France, Germany, Italy, Sweden and Switzerland. Thus a variety of European country covering different sorting schemes and geographies were considered within this screening. However, there are a limited amount of countries that sort yogurt pots from the packaging waste in sufficient quality for recycling into new packaging. Some countries like Germany, France and Switzerland are therefore somewhat over-represented. All flake samples were hot-washed. The flake size was approximately 0.5 cm × 0.5 cm. The samples were collected and delivered between February 2022 and October 2023. The collected samples therefore include also seasonal influences. The following samples were analyzed within the study:
- Belgium 2 samples;
- France 10 samples;
- Germany 15 samples;
- Italy 2 samples
- Sweden 7 samples;
- Switzerland 13 samples.
Sheets used for the production of yogurt pots were used as reference materials. These do not consist of just one PS material and cannot be assigned to a polymer manufacturer. These sheet samples are the more realistic reference samples compared to virgin HIPS pellets.
4.2. Sampling for Screening
The screening for volatile organic compounds in the investigated samples was achieved by headspace gas chromatography. The applied method is based on the screening method of PET. Within the study, 49 samples from the European market were analyzed regarding to substances from storage of chemicals, non-food substances as well as degradation products during recycling. From each of the 49 samples, six sub-samples of 1.0 g were analyzed. Therefore, overall 294 individual samples were analyzed within the study. In each of these 294 sub-samples the amount of post-consumer PS flakes were counted after the analysis.
4.3. Screening of rPS Flakes for Volatile Substancess
For each test 1.0 g of sample material was weighed into a headspace vial and analyzed by headspace GC/FID. Gas chromatograph: Perkin Elmer Clarus 500, column: ZB 1, Thermostatting conditions: 150 °C (1 h). Quantification of limonene was achieved by external calibration with standards of different concentrations. Volatile components were identified by coupling headspace gas chromatography with mass spectrometry (Perkin Elmer 2400 series HT-HS-GC-MS system, PerkinElmer Inc., Waltham, MA, USA): column: Optima 1 MS. Thermostatting conditions: 150 °C (1 h). Identifications of the mass spectra were done by comparison with the NIST spectra library (NIST 2020, NIST MS search 2.4). A confirmation of the suggested spectra by analysis of respective standards was not done.
4.4. Diffusion Modelling
Migration of organic molecules was calculated by use of the AKTS SML software version 4.54 (AKTS AG, Siders, Switzerland). The program uses finite element analysis [33]. The diffusion coefficients were predicted from the AP model [30,31]. The partitioning coefficient was assumed to be KP,F = 1, which indicates high solubility for the surrogates in food. The density of HIPS was 1.04 g/cm3. The wall thickness in the calculations was 300 µm, which is the worst-case scenario for most of the packaging. It should be noted that due to the low diffusivity of HIPS, the partition coefficient as well as the wall thickness has no influence on the (calculated) migration.
5. Conclusions
Within the study, 49 post-consumer rPS flake samples, collected in six European countries (Belgium, France, Germany, Italy, Sweden and Switzerland), were investigated towards post-consumer contaminants. The samples were collected, delivered and analyzed in February 2022 and October 2023. Therefore, the investigated samples reflect a representative geographical input and consider also different collection schemes as well as potential seasonal influences. All sample were analyzed six times, so that 294 individual sub-samples with an average of 35.1 individual flakes per sample were analyzed. Overall, 10,310 individual conventionally recycled post-consumer PS flakes were analyzed. Due to the large mixing during conventional recycling, it can be assumed that just as many individual packages were analyzed, because it is very unlikely that two flakes from one package are in the 1.0 g sub-sample at the same time. Therefore, as part of the study, 10,310 pots/trays were analyzed for contamination. Hints for misuse were found only in one sample. From the results of this study, the initial concentration of contamination by misuse was derived under worst-case assumptions. The incidence of misuse as well as the initial concentration have a huge impact on the safety evaluation of mechanical PS recycling processes as well as post-consumer PS recyclates behind functional barriers.
The following conclusions can be drawn from the results shown in this study:
- The applied non-target screening method is well suited for the assessment of post-consumer PS recyclates;
- The gas chromatographic fingerprints of the investigated post-consumer PS flake samples are similar, which shows that the collection of the PS input (in different countries and at different times of the year) as well as the conventional recycling is very homogeneous;
- The majority of the detected substance peaks were found in (nearly) all post-consumer PS samples and most of them also in virgin PS. All detected substances were semi-quantified using limonene as multi-analyte standard. The 30 substances with the highest concentrations were identified;
- Most of the PS untypical substance peaks are related to oxidation, degradation or cross contaminants from polyolefins. Substance peaks related to misuse for PS pots and trays with chemicals or solvents in high concentrations were found only in one sample. The incidence of misuse is therefore 0.0097%.
- The maximum concentration of substances from misuse, from non-food PS, cross-contamination from other packaging materials such as polyolefins, degradation products and components from packed food in post-consumer rPS is 0.069 mg/kg. Assuming worst-case contamination levels of 6750 mg/kg as found in PET [29] the initial concentration is 0.65 mg/kg.
As an overall conclusion, the initial concentration of 1 mg/kg in washed post-consumer rPS flakes can be applied as pragmatic worst-case approach in the evaluation of consumer safety of rPS containing food packaging. This value is assuming a contamination of a misused substance of 6750 mg/kg, although in this study no hints for such high concentrations was found. Due to the fact that the initial concentration is derived from the product of incidence (0.0097%) and worst-case concentration (6750 mg/kg) the initial concentration for PS super-clean recycling or the core layer of functional barriers is much lower than 1 mg/kg. The initial contamination levels in post-consumer PS flakes was derived very similar to the procedure used for post-consumer PET [29], which was applied by EFSA for the evaluation process of mechanically recycled post-consumer PET [25,26]. Therefore the worst-case initial concentration of rPS of 1 mg/kg might be also acceptable by EFSA for the evaluation of mechanically recycled PS.
Author Contributions
Conceptualization, F.W.; methodology, F.W. and V.G.; validation, F.W. and V.G.; formal analysis, F.W.; writing—original draft preparation, F.W. and V.G.; writing—review and editing, F.W.; visualization, F.W.; supervision, F.W. All authors have read and agreed to the published version of the manuscript.
Funding
This research received no external funding.
Data Availability Statement
Data are contained within the article.
Acknowledgments
This study was financially supported by Styrenics Circular Solutions (SCS), Belgium. Thanks are due to Matalie Schmidt, Frank Eisenträger (both INEOS Styrolution), Ken Huestebeck, Jens Kathmann (both Styrenics Circular Solutions) for fruitful discussions and proof-reading of the manuscript. Thanks are due to Silvia Demiani, Anita Gruner and Alexandra Mauer for experimental contributions to this work.
Conflicts of Interest
The authors declare no conflict of interest.
References
- Block, C.; Brands, B.; Gude, T. Packaging Materials 2: Polystyrene for Food Packaging Applications, Updated Version; ILSI Europe Report Series; ILSI Europe: Bruxelles, Belgium, 2017; pp. 1–36, Commissioned by the Packaging Materials Task Force; Available online: https://ilsi.eu/publication/packaging-materials-2-polystyrene-for-food-packaging-applications-updated-version/ (accessed on 7 February 2025).
- Begley, T.H.; McNeal, T.P.; Biles, J.E.; Pacquette, K.E. Evaluating the potential for recycling all PET bottles into new food packaging. Food Addit. Contam. 2002, 19, 135–143. [Google Scholar] [CrossRef]
- Franz, R. Programme on the recyclability of food-packaging materials with respect to food safety considerations—Polyethylene terephthalate (PET), paper & board and plastics covered by functional barriers. Food Addit. Contam. 2002, 19, 93–110. [Google Scholar] [CrossRef] [PubMed]
- Bayer, F.L. Polyethylene terephthalate recycling for food-contact applications: Testing, safety and technologies: A global perspective. Food Addit. Contam. 2002, 19, 111–134. [Google Scholar] [CrossRef] [PubMed]
- Benyathiar, P.; Kumar, P.; Carpenter, G.; Brace, J.; Mishra, D.K. Polyethylene terephthalate (PET) bottle-to-bottle recycling for the beverage industry: A review. Polymers 2022, 14, 2366. [Google Scholar] [CrossRef] [PubMed]
- Brouwer, M.T.; Chacon, F.A.; Thoden van Velzen, E.U. Effect of recycled content and rPET quality on the properties of PET bottles, part III: Modelling of repetitive recycling. Packag. Technol. Sci. 2020, 33, 373–383. [Google Scholar] [CrossRef]
- Bayer, F.L.; Jetten, J. Safety assessment of refillable and recycled plastics packaging for food use. In Tittle of the Present Knowledge in Food Safety—A Risk-Based Approach Through the Food Chain; Knowles, M.E., Anelich, L.E., Boobis, A.R., Popping, B., Eds.; Academic Press: Cambridge, MA, USA, 2022; Volume 15, pp. 240–259. ISBN 978-0-12-819470-6. [Google Scholar] [CrossRef]
- The European Commission. Regulation No 2022/1616 of 15 September 2022 on Recycled Plastic Materials and Articles Intended to Come into Contact with Foods, and Repealing Regulation (EC) No 282/2008. Off. J. Eur. Union 2022, L243/3. Available online: https://eur-lex.europa.eu/legal-content/EN/TXT/PDF/?uri=CELEX:32022R1616 (accessed on 16 March 2024).
- Welle, F. Recycling of post-consumer polystyrene packaging waste into new food packaging applications—Part 1: Direct food contact. Recycling 2023, 8, 26. [Google Scholar] [CrossRef]
- Feigenbaum, A.; Dole, P.; Aucejo, A.; Dainelli, D.; de la Cruz Garcia, C.; Hankemeier, T.; Ngono, Y.; Papaspyrides, C.G.; Paseiro, P.; Pastorelli, S.; et al. Functional barriers: Properties and evaluation. Food Addit. Contam. 2005, 22, 956–967. [Google Scholar] [CrossRef]
- Dole, P.; Feigenbaum, A.E.; de la Cruz, C.; Pastorelli, S.; Paseiro, P.; Hankemeier, T.; Voulzatis, Y.; Aucejo, S.; Saillard, P.; Papaspyrides, C. Typical diffusion behaviour in packaging polymers–application to functional barriers. Food Addit. Contam. Part A 2006, 23, 202–211. [Google Scholar] [CrossRef]
- Genualdi, S.; Addo Ntim, S.; Begley, T. Suitability of polystyrene as a functional barrier layer in coloured food contact materials. Food Addit. Contam. Part A 2015, 32, 395–402. [Google Scholar] [CrossRef]
- Welle, F. Recycling of post-consumer polystyrene packaging waste into new food packaging applications—Part 2: Co-extruded functional barriers. Recycling 2023, 8, 39. [Google Scholar] [CrossRef]
- The European Commission. Regulation No 1935/2004 of the European Parliament and of the Council of 27 October 2004 on Materials and Articles Intended to Come into Contact with Food and Repealing Directives 80/590/EEC and 89/109/EEC. Off. J. Eur. Union 2004, L338/4. Available online: https://eur-lex.europa.eu/LexUriServ/LexUriServ.do?uri=OJ:L:2004:338:0004:0017:en:PDF (accessed on 16 March 2024).
- The European Commission. Regulation No 10/2011 of 14 January 2011 on Plastic Materials and Articles Intended to Come into Contact with Food. Off. J. Eur. Union 2011, L12/1. Available online: https://eur-lex.europa.eu/legal-content/EN/TXT/PDF/?uri=CELEX:32011R0010&from=EN (accessed on 16 March 2024).
- US FDA Database on Post-Consumer Recycled (PCR) Plastics for Food-Contact Articles. Available online: https://www.cfsanappsexternal.fda.gov/scripts/fdcc/?set=RecycledPlastics (accessed on 21 February 2025).
- Use of Recycled Plastics in Food Packaging (Chemistry Considerations): Guidance for Industry. 2021. Available online: https://www.fda.gov/media/150792/download (accessed on 21 February 2025).
- Vilaplana, F.; Ribes-Greus, A.; Karlsson, S. Analytical strategies for the quality assessment of recycled high-impact polystyrene: A combination of thermal analysis, vibrational spectroscopy and chromatography. Anal. Chim. Acta 2007, 604, 18–28. [Google Scholar] [CrossRef]
- Vilaplana, F.; Ribes-Greus, A.; Karlsson, S. Chromatographic pattern in recycled high-impact polystyrene (HIPS)–Occurrence of low molecular weight compounds during the life cycle. Polym. Degrad. Stabil. 2010, 95, 172–186. [Google Scholar] [CrossRef]
- Vilaplana, F.; Martinez-Sanz, M.; Ribes-Greus, A.; Karlsson, S. Emission pattern of semi-volatile organic compounds from recycled styrenic polymers using headspace solid-phase microextraction gas chromatography-mass spectrometry. J. Chromatogr. A 2010, 1217, 359–367. [Google Scholar] [CrossRef]
- Lin, Q.-B.; Song, X.-C.; Fang, H.; Wu, Y.-M.; Wang, Z.-W. Migration of styrene and ethylbenzene from virgin and recycled expanded polystyrene containers and discrimination of these two kinds of polystyrene by principal component analysis. Food Addit. Contam. Part A 2017, 34, 126–132. [Google Scholar] [CrossRef] [PubMed]
- Song, X.-C.; Lin, Q.-B.; Chen, C.-F.; Chen, J.-H.; Hu, C.-Y. Discrimination between virgin and recycled polystyrene containers by Fourier transform infrared spectroscopy and principal component analysis. Packag. Technol. Sci. 2018, 31, 567–572. [Google Scholar] [CrossRef]
- Song, X.-C.; Wrona, M.; Nerin, C.; Lin, Q.-B.; Zhong, H.-N. Volatile non-intentionally added substances (NIAS) identified in recycled expanded polystyrene containers and their migration into food simulants. Food Packag. Shelf Life 2019, 20, 100318. [Google Scholar] [CrossRef]
- Huber, M.; Franz, R. Studies on contamination of post consumer plastics from controlled resources for recycling into food packaging applications. Dtsch. Lebensm.-Rundsch. 1997, 93, 328–331. [Google Scholar]
- EFSA CEF Panel (EFSA Panel on Food Contact Materials, Enzymes, Flavourings and Processing Aids). Scientific Opinion on the criteria to be used for safety evaluation of a mechanical recycling process to produce recycled PET intended to be used for manufacture of materials and articles in contact with food. EFSA J. 2011, 9, 2184. [Google Scholar] [CrossRef]
- Barthelemy, E.; Spyropoulos, D.; Milana, M.-R.; Pfaff, K.; Gontard, N.; Lampi, E.; Castle, L. Safety evaluation of mechanical recycling processes used to produce polyethylene terephthalate (PET) intended for food contact applications. Food Addit. Contam. Part A 2014, 31, 490–497. [Google Scholar] [CrossRef] [PubMed]
- EFSA CEF Panel (EFSA Panel on Food Contact Materials, Enzymes and Processing Aids). Scientific Guidance on the criteria for the evaluation and on the preparation of applications for the safety assessment of post-consumer mechanical PET recycling processes intended to be used for manufacture of materials and articles in contact with food. EFSA J. 2024, 22, e8879. [Google Scholar] [CrossRef]
- Register Open EFSA. Available online: https://www.efsa.europa.eu/en/register-of-questions (accessed on 16 March 2024).
- Franz, R.; Mauer, A.; Welle, F. European survey on post-consumer poly(ethylene terephthalate) materials to determine contamination levels and maximum consumer exposure from food packages made from recycled PET. Food Addit. Contam. 2004, 21, 265–286. [Google Scholar] [CrossRef] [PubMed]
- European Union. Practical Guidelines on the Application of Migration Modelling for the Estimation of Specific Migration; EU Report 27529 EN; Publications Office of the European Union: Luxembourg, 2015; ISBN 978-92-79-52790-6. Available online: https://op.europa.eu/de/publication-detail/-/publication/1b79bc61-97f6-11e5-983e-01aa75ed71a1 (accessed on 16 March 2024).
- Begley, T.; Castle, L.; Feigenbaum, A.; Franz, R.; Hinrichs, K.; Lickly, T.; Mercea, P.; Milana, M.; O’Brian, A.; Rebre, S.; et al. Evaluation of migration models that might be used in support of regulations for food-contact plastics. Food Addit. Contam. 2005, 22, 73–90. [Google Scholar] [CrossRef]
- Welle, F. Diffusion coefficients and activation energies of diffusion of organic molecules in polystyrene below and above glass transition temperature. Polymers 2021, 13, 1317. [Google Scholar] [CrossRef]
- Roduit, B.; Borgeat, C.H.; Cavin, S.; Fragniere, C.; Dudler, V. Application of finite element analysis (FEA) for the simulation of release of additives from multilayer polymeric packaging structures. Food Addit. Contam. Part A 2005, 22, 945–955. [Google Scholar] [CrossRef]

Disclaimer/Publisher’s Note: The statements, opinions and data contained in all publications are solely those of the individual author(s) and contributor(s) and not of MDPI and/or the editor(s). MDPI and/or the editor(s) disclaim responsibility for any injury to people or property resulting from any ideas, methods, instructions or products referred to in the content. |
© 2025 by the authors. Licensee MDPI, Basel, Switzerland. This article is an open access article distributed under the terms and conditions of the Creative Commons Attribution (CC BY) license (https://creativecommons.org/licenses/by/4.0/).