
Recycled Shredded-Tire Chips Used As Support Material in a Constructed Wetland Treating High-Strength Wastewater from a Bakery: Case Study

Abstract
:
1. Introduction
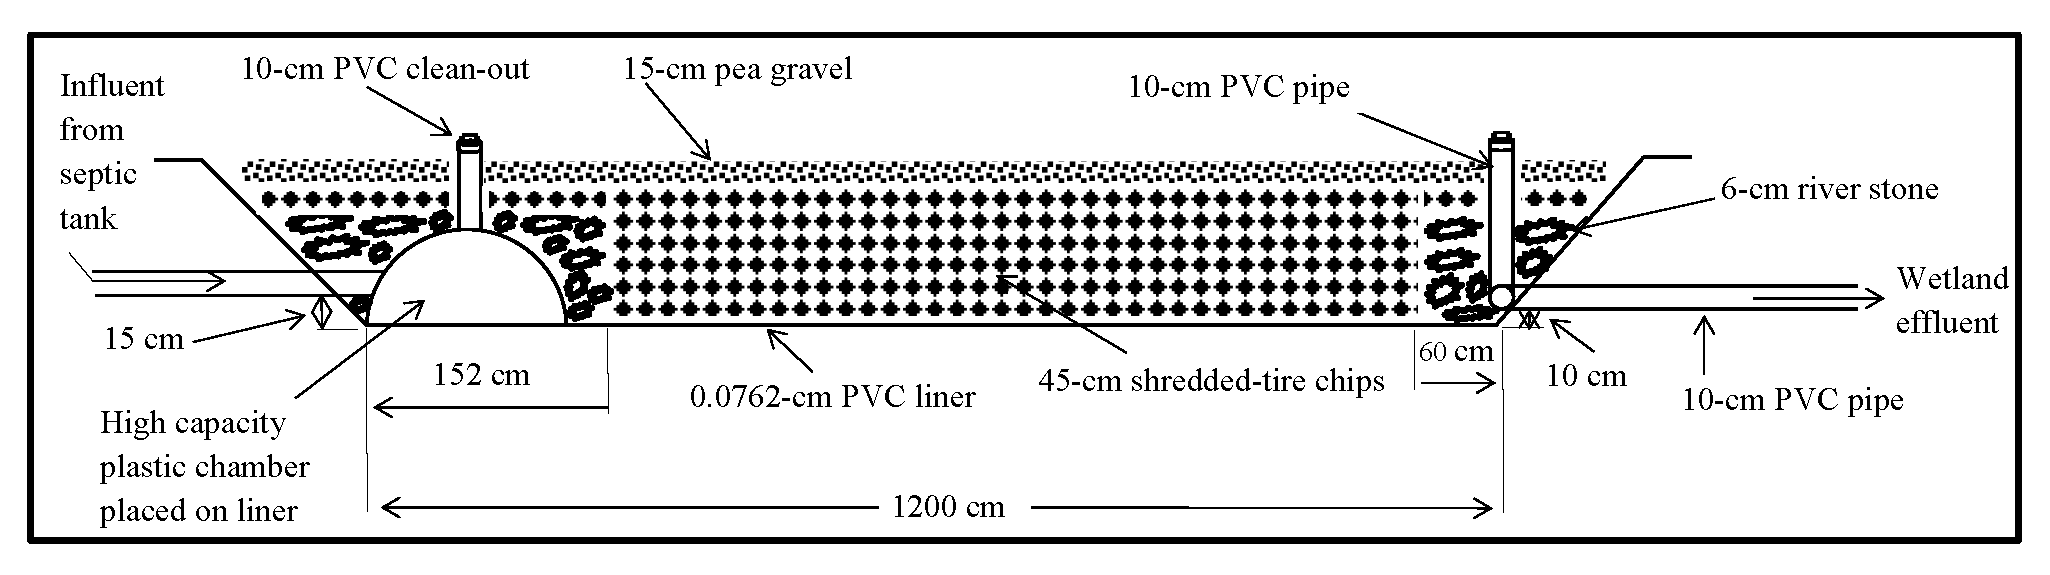
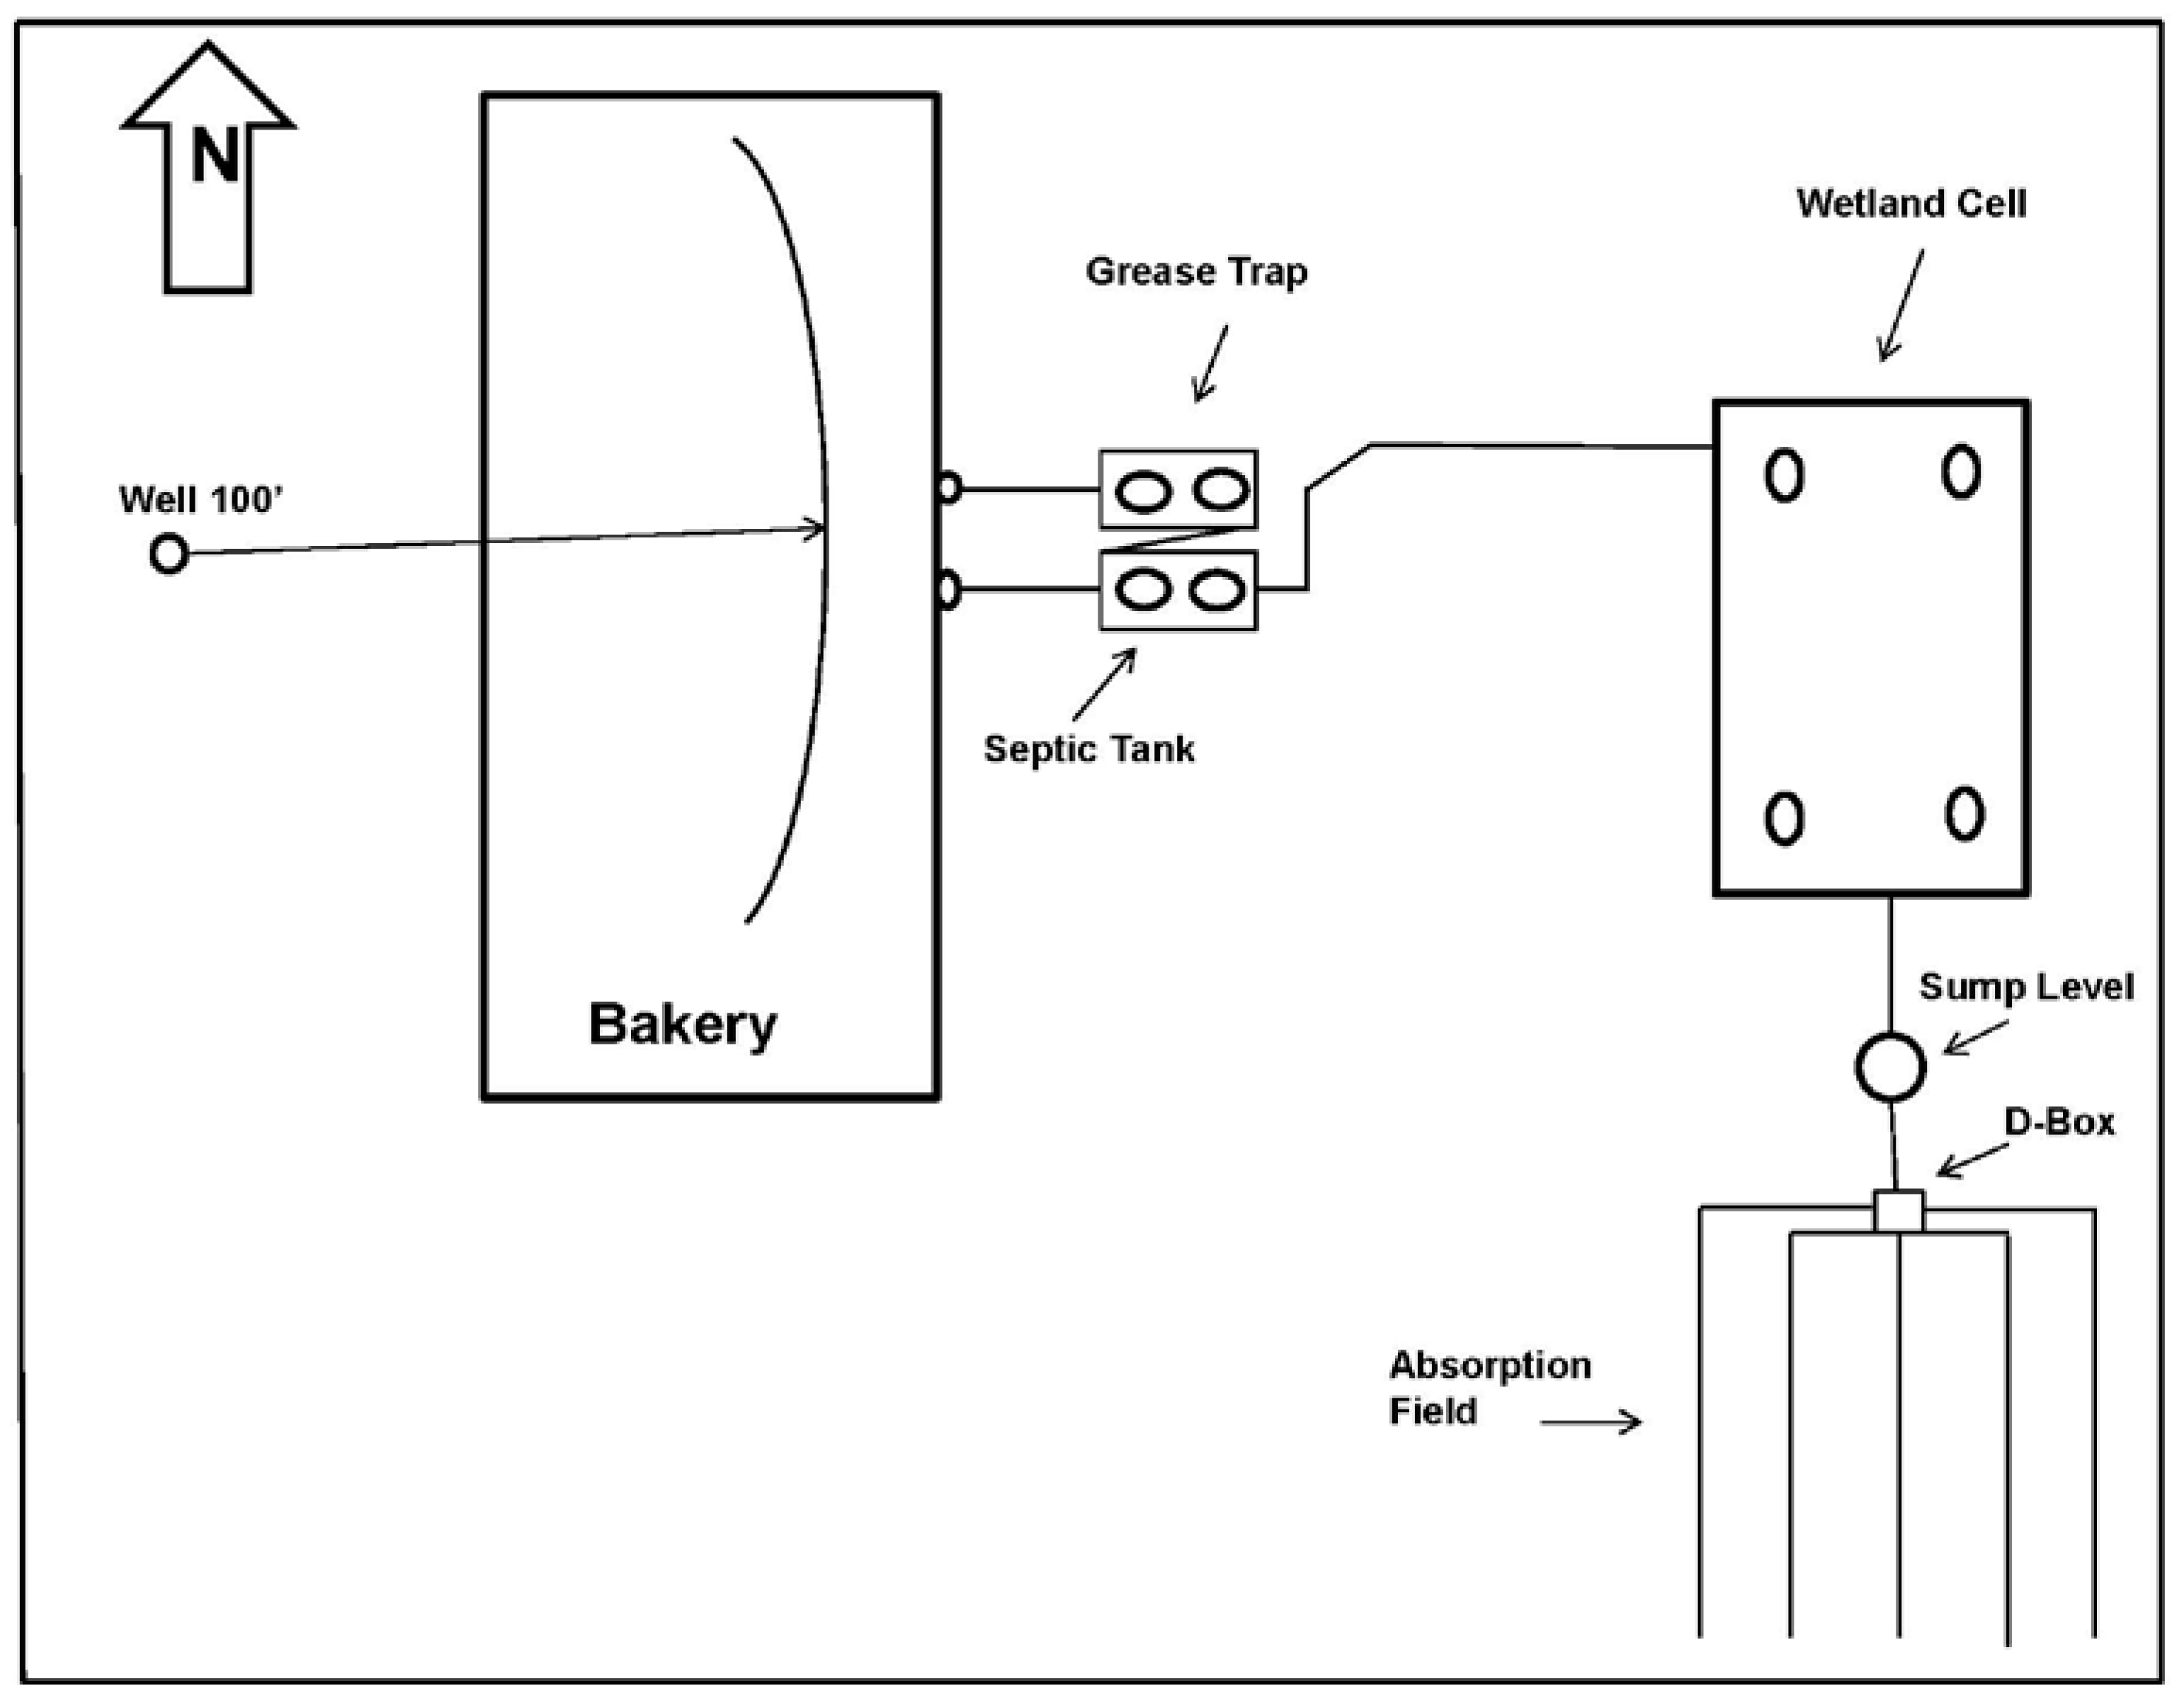
2. Materials and Methods

3. Results and Discussion

| Age | DO (mg/L) | T (°C) | BOD5 (mg/L) | TSS (mg/L) | TP (mg/L) | E. coli (MPN) | ||||||
|---|---|---|---|---|---|---|---|---|---|---|---|---|
| (Days) | In | Out | In | Out | In | Out | In | Out | In | Out | In | Out |
| 30 | 1.2 | 1.5 | 23.5 | 17.7 | 850 | 20 | 170 | 10 | 4.92 | 0.85 | 9 × 10⁴ | 3 × 10⁴ |
| 83 | 1.94 | 1.6 | 22.9 | 21.5 | 830 | 150 | 330 | 85 | 8.22 | 0.55 | 17 × 104 | 12 × 104 |
| 101 | 0.02 | 0.04 | 26.6 | 22.9 | 710 | 510 | 240 | 220 | 7.24 | 1.3 | 98 × 103 | 12 × 103 |
| 148 | 0.22 | 0.26 | 25.1 | 16.3 | 2200 | 96 | 351 | 90 | 4.89 | 2 | 33 × 105 | 25 × 103 |
| 188 | 0.07 | 0.25 | 24.5 | 15.3 | 1400 | 120 | 160 | 130 | 1.7 | 0.41 | 39 × 105 | 3 × 10³ |
| 318 | 0.33 | 0.21 | 22.6 | 11.1 | 2000 | 560 | 240 | 140 | 2.33 | 0.76 | 9 × 10³ | 7 × 10³ |
| 370 | 1.5 | 1.3 | 19.1 | 5.3 | 3100 | 160 | 360 | 150 | 6.54 | 0.363 | 9 × 10² | 5 × 10² |
| 436 | 2.2 | 4.6 | 20.9 | 17.3 | 1800 | 610 | 210 | 270 | 6.6 | 2.12 | 1 × 10⁵ | 4 × 10⁴ |
| 510 | 3.2 | 3.5 | 28.0 | 25.7 | 4200 | 99 | 1100 | 140 | 4.48 | 1.72 | 9 × 10³ | 5 × 10³ |
| 655 | 1.4 | 1.3 | 23.2 | 19.8 | 1900 | 110 | 310 | 150 | 7.28 | 4.53 | 9 × 10⁴ | 4 × 10⁴ |
| 775 | 1.3 | 1.4 | 24.5 | 21.6 | 1600 | 18 | 276 | 74 | 6.76 | 5.47 | 9 × 10³ | 2 × 10³ |
| 895 | 1.51 | 2.1 | 17.8 | 5.6 | 5680 | 186 | 464 | 80 | 3.76 | 1.95 | 2 × 10⁴ | 2 × 10⁴ |
| 1015 | 2.2 | 1.3 | 25.9 | 23.2 | 3790 | 31 | 592 | 62 | 4.5 | 1.6 | 1 × 10⁶ | 2 × 10³ |
| 1115 | 1.9 | 1.1 | 26.3 | 20.5 | 3160 | 87 | 552 | 38 | 3.6 | 2.2 | 2 × 10⁵ | 1 × 10⁴ |
| Mean | 1.4 | 1.5 | 23.6 | 17.4 | 2373 | 197 | 383 | 117 | 5.2 | 1.8 | 8 × 10⁵ | 2 × 10⁴ |
| SD | 0.9 | 1.3 | 2.9 | 6.3 | 1445 | 610 | 245 | 69 | 1.9 | 1.5 | 13 × 105 | 3 × 10⁴ |
| Age | NH+4-N (mg/L) | NO−3-N (mg/L) | TKN (mg/L) | TN (mg/L) | ||||
|---|---|---|---|---|---|---|---|---|
| (Days) | In | Out | In | Out | In | Out | In | Out |
| 30 | 14.8 | 3.62 | 0 | 0 | 33.5 | 14.1 | 33.5 | 14.1 |
| 83 | 25.1 | 13.3 | 0 | 0 | 119 | 56.6 | 119 | 56.6 |
| 101 | 31.6 | 0.19 | 0 | 0 | 63.4 | 23.4 | 63.4 | 23.4 |
| 148 | 39.3 | 4.42 | 0 | 0 | 127 | 20 | 127 | 20 |
| 188 | 35.2 | 0.2 | 0 | 0 | 40.2 | 14.7 | 40.2 | 14.7 |
| 318 | 38.8 | 0.16 | 0 | 0 | 33.7 | 25.8 | 33.7 | 25.8 |
| 370 | 23.4 | 0.126 | 0 | 0 | 53.2 | 27.7 | 53.2 | 27.7 |
| 436 | 41.4 | 2.12 | 0 | 0 | 39.3 | 21.6 | 39.3 | 21.6 |
| 510 | 47.6 | 4.01 | 0.5 | 0.5 | 47 | 4.1 | 47.5 | 4.6 |
| 655 | 36.7 | 11.4 | 0.5 | 0.5 | 57.3 | 37.2 | 57.8 | 37.7 |
| 775 | 14 | 7.7 | 0.5 | 0.7 | 60.2 | 39.3 | 60.7 | 40 |
| 895 | 12.8 | 0.05 | 0.5 | 0.5 | 54 | 31.3 | 54.5 | 31.8 |
| 1015 | 24.5 | 0.35 | 0.5 | 0 | 44.8 | 20.5 | 45.3 | 21 |
| 1115 | 16.9 | 3.4 | 0.8 | 0.5 | 30 | 12.9 | 30.8 | 13.4 |
| Mean | 28.7 | 3.6 | 0.24 | 0.19 | 57.3 | 24.9 | 57.5 | 25.09 |
| SD | 11.8 | 4.4 | 0.29 | 0.27 | 29.7 | 13.2 | 29.6 | 10.9 |
| Water Quality Parameters | Subsurface Horizontal Flow Constructed Wetland {Mean (SD)} | ||
|---|---|---|---|
| Influent | Effluent | Efficiency (%) | |
| Fat, Oil and Grease {FOG (mg/L)} | 1101 (150) | 5.3 (0.5) | 99 |
| Fecal Coliforms {E. coli (MPN/100 mL)} | 8 × 10⁵ (13 × 105) | 2 × 10⁴ (3 × 10⁴) | 97 |
| Biochemical Oxygen Demand {BOD5 (mg/L)} | 2373 (1445) | 197 (610) | 92 |
| Ammonia-N {NH+4-N (mg/L)} | 28.7 (11.8) | 3.6 (4.4) | 87 |
| Total Suspended Solids {TSS (mg/L)} | 383 (245) | 117 (69) | 69 |
| Total Phosphorus {TP (mg/L)} | 5.2 (1.9) | 1.8 (1.5) | 65 |
| Total Kjeldahl Nitrogen {TKN (mg/L)} | 57.3 (29.7) | 24.9 (13.2) | 57 |
| Total-Nitrogen {(TN = TKN + NN) (mg/L)} | 57.5 (29.6) | 25.09 (10.9) | 56 |
| Potassium {K (mg/L)} | 31.9 (8.9) | 20.5 (9) | 36 |
| Nitrate-Nitrogen {NN = NO−3-N (mg/L)} | 0.24 (0.29) | 0.19 (0.27) | NA |
| Dissolved Oxygen {DO (mg/L)} | 1.4 (0.9) | 1.5 (1.3) | NA |
| pH (standard units) | 3.9–6.2 | 6.3–7.6 | NA |
| Water Temperature (°C) | 23.6 (2.9) | 17.4 (6.3) | NA |
4. Conclusions
Acknowledgments
Author Contributions
Conflicts of Interest
References
- García-Pérez, A.; Grant, B.; Harrison, M. Water quality effluent from a recirculating vertical flow constructed wetland. Small Flow Q. 2006, 7, 34–38. [Google Scholar]
- 2 Korkusuz, E.; Beklioglu, M.; Demirer, G. Treatment efficiencies of the vertical flow pilot-scale constructed wetlands for domestic wastewater treatment. Turk. J. Eng. Env. Sci. 2004, 28, 333–344. [Google Scholar]
- Tang, X.Q.; Huang, S.L.; Scholz, M. Comparison of phosphorus removal between vertical subsurface flows constructed wetlands with different substrates. Water Environ. J. 2009, 23, 180–188. [Google Scholar] [CrossRef]
- Prochaska, C.A.; Zouboulis, A.I. Removal of phosphates by pilot vertical-flow constructed wetlands using a mixture of sand and dolomite as substrate. Ecol. Eng. 2006, 26, 293–303. [Google Scholar] [CrossRef]
- Zurita, F.; de Anda, J.; Belmont, M.A. Treatment of domestic wastewater and production of commercial flowers in vertical and horizontal subsurface-flow constructed wetlands. Ecol. Eng. 2009, 35, 861–869. [Google Scholar] [CrossRef]
- Olyphant, G.A.; Letsinger, S.L. Environmental feasibility of using recycled tire pieces as media in septic system absorption fields. Indiana Geol. Surv. 2011, 6, 1–47. [Google Scholar]
- Lin, W.; Holmes, G.A. A new life for old tires: Constructed wetland with shredded-tire chips produces consistently high quality lagoon effluent. J. Water Environ. Technol. 2010, 22, 48–53. [Google Scholar]
- McKenzie, C. Tire chips-A growing trend as aggregate in soil absorption systems. Small Flows Q. 2003, 4, 14–17. [Google Scholar]
- Krayzelova, L.; Lynn, T.J.; Banihani, Q.; Bartacek, J.; Jenicek, P.; Ergas, S.J. A tire-sulfur hybrid adsorption denitrification (T-SHAD) process for decentralized wastewater treatment. Water Res. 2014, 61, 191–199. [Google Scholar] [CrossRef] [PubMed]
- Lisi, R.D.; Park, J.K.; Stier, J.C. Mitigating nutrient leaching with a sub-surface drainage layer of granulated tires. Waste Manag. 2004, 24, 831–839. [Google Scholar] [CrossRef] [PubMed]
- APHA; AWWA; WEF. Standard Methods for the Examination of Water and Wastewater, 20th ed.; American Public Health Association: Washington, DC, USA, 1998. [Google Scholar]
- United States Environmental Protection Agency. Manual: Methods for Chemical Analysis of Water and Wastes; EPA/600/4–79/020; Office of Research and Development, United States Environmental Protection Agency: Washington, DC, USA, 1983. [Google Scholar]
- Ebeling, J.; Tsukuda, S.; Hankins, J.; Solomon, C. Performance evaluation of a recirculating sand filter and peat filter in West Virginia. Small Flows Q. 2003, 4, 27–37. [Google Scholar]
- Benefield, A.L. Wastewater Quality/Strength/Content—Washington State Department of Health; Waste Management Report WAC 246-272-11501; Washington State Department of Health: Washington, DC, USA, 2002; Volume 4, pp. 1–18. [Google Scholar]
- Zurita, F.; Belmont, M.A.; de Anda, J.; White, J.R. Seeking a way to promote the use of constructed wetlands for domestic wastewater treatment in developing countries. Water Sci. Technol. 2011, 63, 654–659. [Google Scholar] [CrossRef] [PubMed]
- Kantawanichkul, S.; Karnchanawong, S.; Jing, S.R. Treatment of fermented fish production wastewater by constructed wetland system in Thailand. Chiang Mai J. Sci. 2009, 36, 149–157. [Google Scholar]
- Zurita, F.; de Anda, J.; Belmont, M.A. Performance of laboratory-scale wetland planted with tropical ornamental plants to treatment domestic wastewater. Water Qual. Res. J. Can. 2006, 41, 410–417. [Google Scholar]
- Wallace, S.D.; Knight, R.L. Small-scale constructed wetland treatment systems. In Feasibility, Design Criteria, and O&M Requirements; Water Environmental Research Foundation Document 01-CTS-5; IWA Publishing: Washington, DC, USA, 2006. [Google Scholar]
- Wymazal, J. Removal of phosphorus in constructed wetlands with horizontal sub-surface flow in the Czech Republican. Water Air Soil Pollut. Focus 2004, 4, 657–670. [Google Scholar] [CrossRef]
- Arias, C.A.; Brix, H.; Johansen, N.H. Phosphorus removal from municipal wastewater in an experimental two-stage vertical flow constructed wetland system equipped with a calcite filter. Water Sci. Technol. 2003, 48, 51–58. [Google Scholar] [PubMed]
- García-Pérez, A.; Harrison, M.; Grant, B. Recirculating vertical flow constructed wetland for on-site sewage treatment: An approach for a sustainable ecosystem. J. Water Environ. Technol. 2011, 9, 39–46. [Google Scholar] [CrossRef] [Green Version]
- Lesikar, B.; Weaver, R.; Ritcher, A.; O’Neill, C. Constructed Wetland Media. Available online: http://www.agrilifebookstore.org/OWTS-Constructed-Wetland-Media-p/el-5459.htm (accessed on 4 August 2015).
- Richter, A.Y.; Weaver, R.W. Treatment of domestic wastewater by subsurface flow constructed wetlands filled with gravel and tire chip media. Environ. Technol. 2003, 24, 1561–1567. [Google Scholar] [CrossRef] [PubMed]
- Grimes, B.H.; Steinbeck, S.; Amoozegar, A. Analysis of tire chips as a substitute for stone aggregate in nitrification trenches of onsite septic systems: Status and notes on the comparative macro biology of tire chip vs. stone aggregate trenches. Small Flows Q. 2003, 4, 18–21. [Google Scholar]
- García-Pérez, A.; Harrison, M.; Grant, B.; Chivers, C. Microbial analysis and chemical composition of maize (Zea mays, L.) growing on a recirculating vertical flow constructed wetland treating sewage on-site. Biosyst. Eng. 2013, 114, 351–356. [Google Scholar] [CrossRef]
© 2015 by the authors; licensee MDPI, Basel, Switzerland. This article is an open access article distributed under the terms and conditions of the Creative Commons Attribution license (http://creativecommons.org/licenses/by/4.0/).
Share and Cite
García-Pérez, A.; Harrison, M.; Chivers, C.; Grant, B. Recycled Shredded-Tire Chips Used As Support Material in a Constructed Wetland Treating High-Strength Wastewater from a Bakery: Case Study. Recycling 2016, 1, 3-13. https://doi.org/10.3390/recycling1010003
García-Pérez A, Harrison M, Chivers C, Grant B. Recycled Shredded-Tire Chips Used As Support Material in a Constructed Wetland Treating High-Strength Wastewater from a Bakery: Case Study. Recycling. 2016; 1(1):3-13. https://doi.org/10.3390/recycling1010003
Chicago/Turabian StyleGarcía-Pérez, Alfredo, Mark Harrison, Craig Chivers, and Bill Grant. 2016. "Recycled Shredded-Tire Chips Used As Support Material in a Constructed Wetland Treating High-Strength Wastewater from a Bakery: Case Study" Recycling 1, no. 1: 3-13. https://doi.org/10.3390/recycling1010003
APA StyleGarcía-Pérez, A., Harrison, M., Chivers, C., & Grant, B. (2016). Recycled Shredded-Tire Chips Used As Support Material in a Constructed Wetland Treating High-Strength Wastewater from a Bakery: Case Study. Recycling, 1(1), 3-13. https://doi.org/10.3390/recycling1010003