1. Introduction
Flow batteries are widely used in various fields of energy and are considered the most promising objects for large-scale energy storage [
1]. Along with other chemical energy storage devices (lithium-ion, nickel–cadmium, lead–acid batteries), flow batteries are confidently conquering the storage market for alternative and distributed energy [
2,
3]. They are used for daily network balancing due to their advantages and high efficiency as long-duration energy storage devices [
4]. Despite this, a number of issues remain unresolved, both in terms of the design of the batteries and increasing their efficiency, as well as the problem of performance degradation [
5].
A vanadium redox flow battery consists of several basic elements: a flow cell (stack), which are fuel cells wherein an electrochemical reaction occurs; a hydrodynamic system, including pumps, flow sensors and a pressure pump control system; and electrolyte tanks [
6]. Flow batteries require several stacks to achieve the desired performance [
7]. Stacks are electrically connected in series–parallel to gain the necessary voltage and power, while the hydrodynamic systems are connected in parallel by electrolytes so that an equally charged electrolyte is supplied to each stack, which allows them to work with equal characteristics [
8]. This is especially important since the stack power and efficiency depend on the rate of electrolyte flow through the stack [
9].
In real-time operation, even the same flow battery stacks can have different hydrodynamic resistances, for example, throughout long-term operation, as a consequence of electrode and membrane degradation, which leads to an imbalance in the electrolyte flow passing through them and uneven operation [
10]. The stack with the lowest hydrodynamic resistance takes on a larger volume of electrolytes, which leads to a worse operation of other stacks in the system. At the same time, the power of a system with stacks electrically connected in series is limited by the weakest element, leading to the degradation of its characteristics. There is also a big problem of shunt resistance in all-vanadium redox flow batteries [
11,
12]. This has forced researchers to look for ways to increase the resistivity in the channels of flow cells. For example, the authors of [
13] proposed using long flow channels to increase the resistance. This increases the hydrodynamic resistance, but also reduces the shunt currents.
Various approaches are being studied to improve the efficiency and energy density of vanadium redox flow batteries [
14]. For example, studies on the development of new electrode materials using carbon nanostructures [
15] such as nanotubes, graphene and ultrafine carbon [
16], or deposited catalytic particles of metal oxides [
17], such as manganese, nickel and bismuth [
18], are of great interest. A large number of studies are devoted to the development of new electrolytes [
19] and membranes [
20]. Computational Fluid Dynamics (CFD) simulations are an efficient way to test different flow field designs and validate the electrochemical performance of the results [
21].
Other approaches are based on increasing efficiency through an optimal battery management strategy. In contrast to the development of new materials, which is a passive way to improve battery performance, the improvement of algorithms and control methods is an active method. In addition to the basic elements of the vanadium battery, there may also be auxiliary ones, e.g., a battery charge control system, a stack-balancing system or a power conversion system. An algorithm employed to control the pump performance in order to improve the flow battery efficiency was proposed in [
22]. The electrolyte flow rate changes at different stages of the charge and discharge process. This new control approach improved system efficiency and Coulomb efficiency by 3.34% and 3.84%, respectively, compared to a constant flow rate. This proposed method solves a serious problem in flow battery applications, namely, premature shutdown of the battery at a low charge level [
23], which leads to incomplete use of electrolyte energy and a decrease in the depth of discharge (DoD). Another approach using the pulsating flow, where pumps operate in a discontinuous mode, is presented in [
24]. The pump load was reduced by almost 50% with a slight reduction in the battery DoD. Overall system efficiency increased to more than 80%. But this approach reduces pump service life, while the maintenance costs for pumps increase up to 14% of the maintenance costs for the entire system [
25].
If it is necessary to increase the DoD and at the same time adapt to a changing load, then, as shown in [
26], the flow must increase when the load increases. This slightly reduces the efficiency, but at the same time hardly reduces the battery DoD. The results were confirmed using a 5 kW/5 kWh all-vanadium flow battery. However, in the presented studies, the systems contain only one stack and do not consider the problem that arises in a system with two or more stacks, namely, the imbalance of electrolyte flows in various circuits. This problem cannot be solved using pump control methods, because this will result in an excessive load on the pumps and one of the circuits will operate with excess electrolyte capacity, which will lead to a decrease in the overall system efficiency.
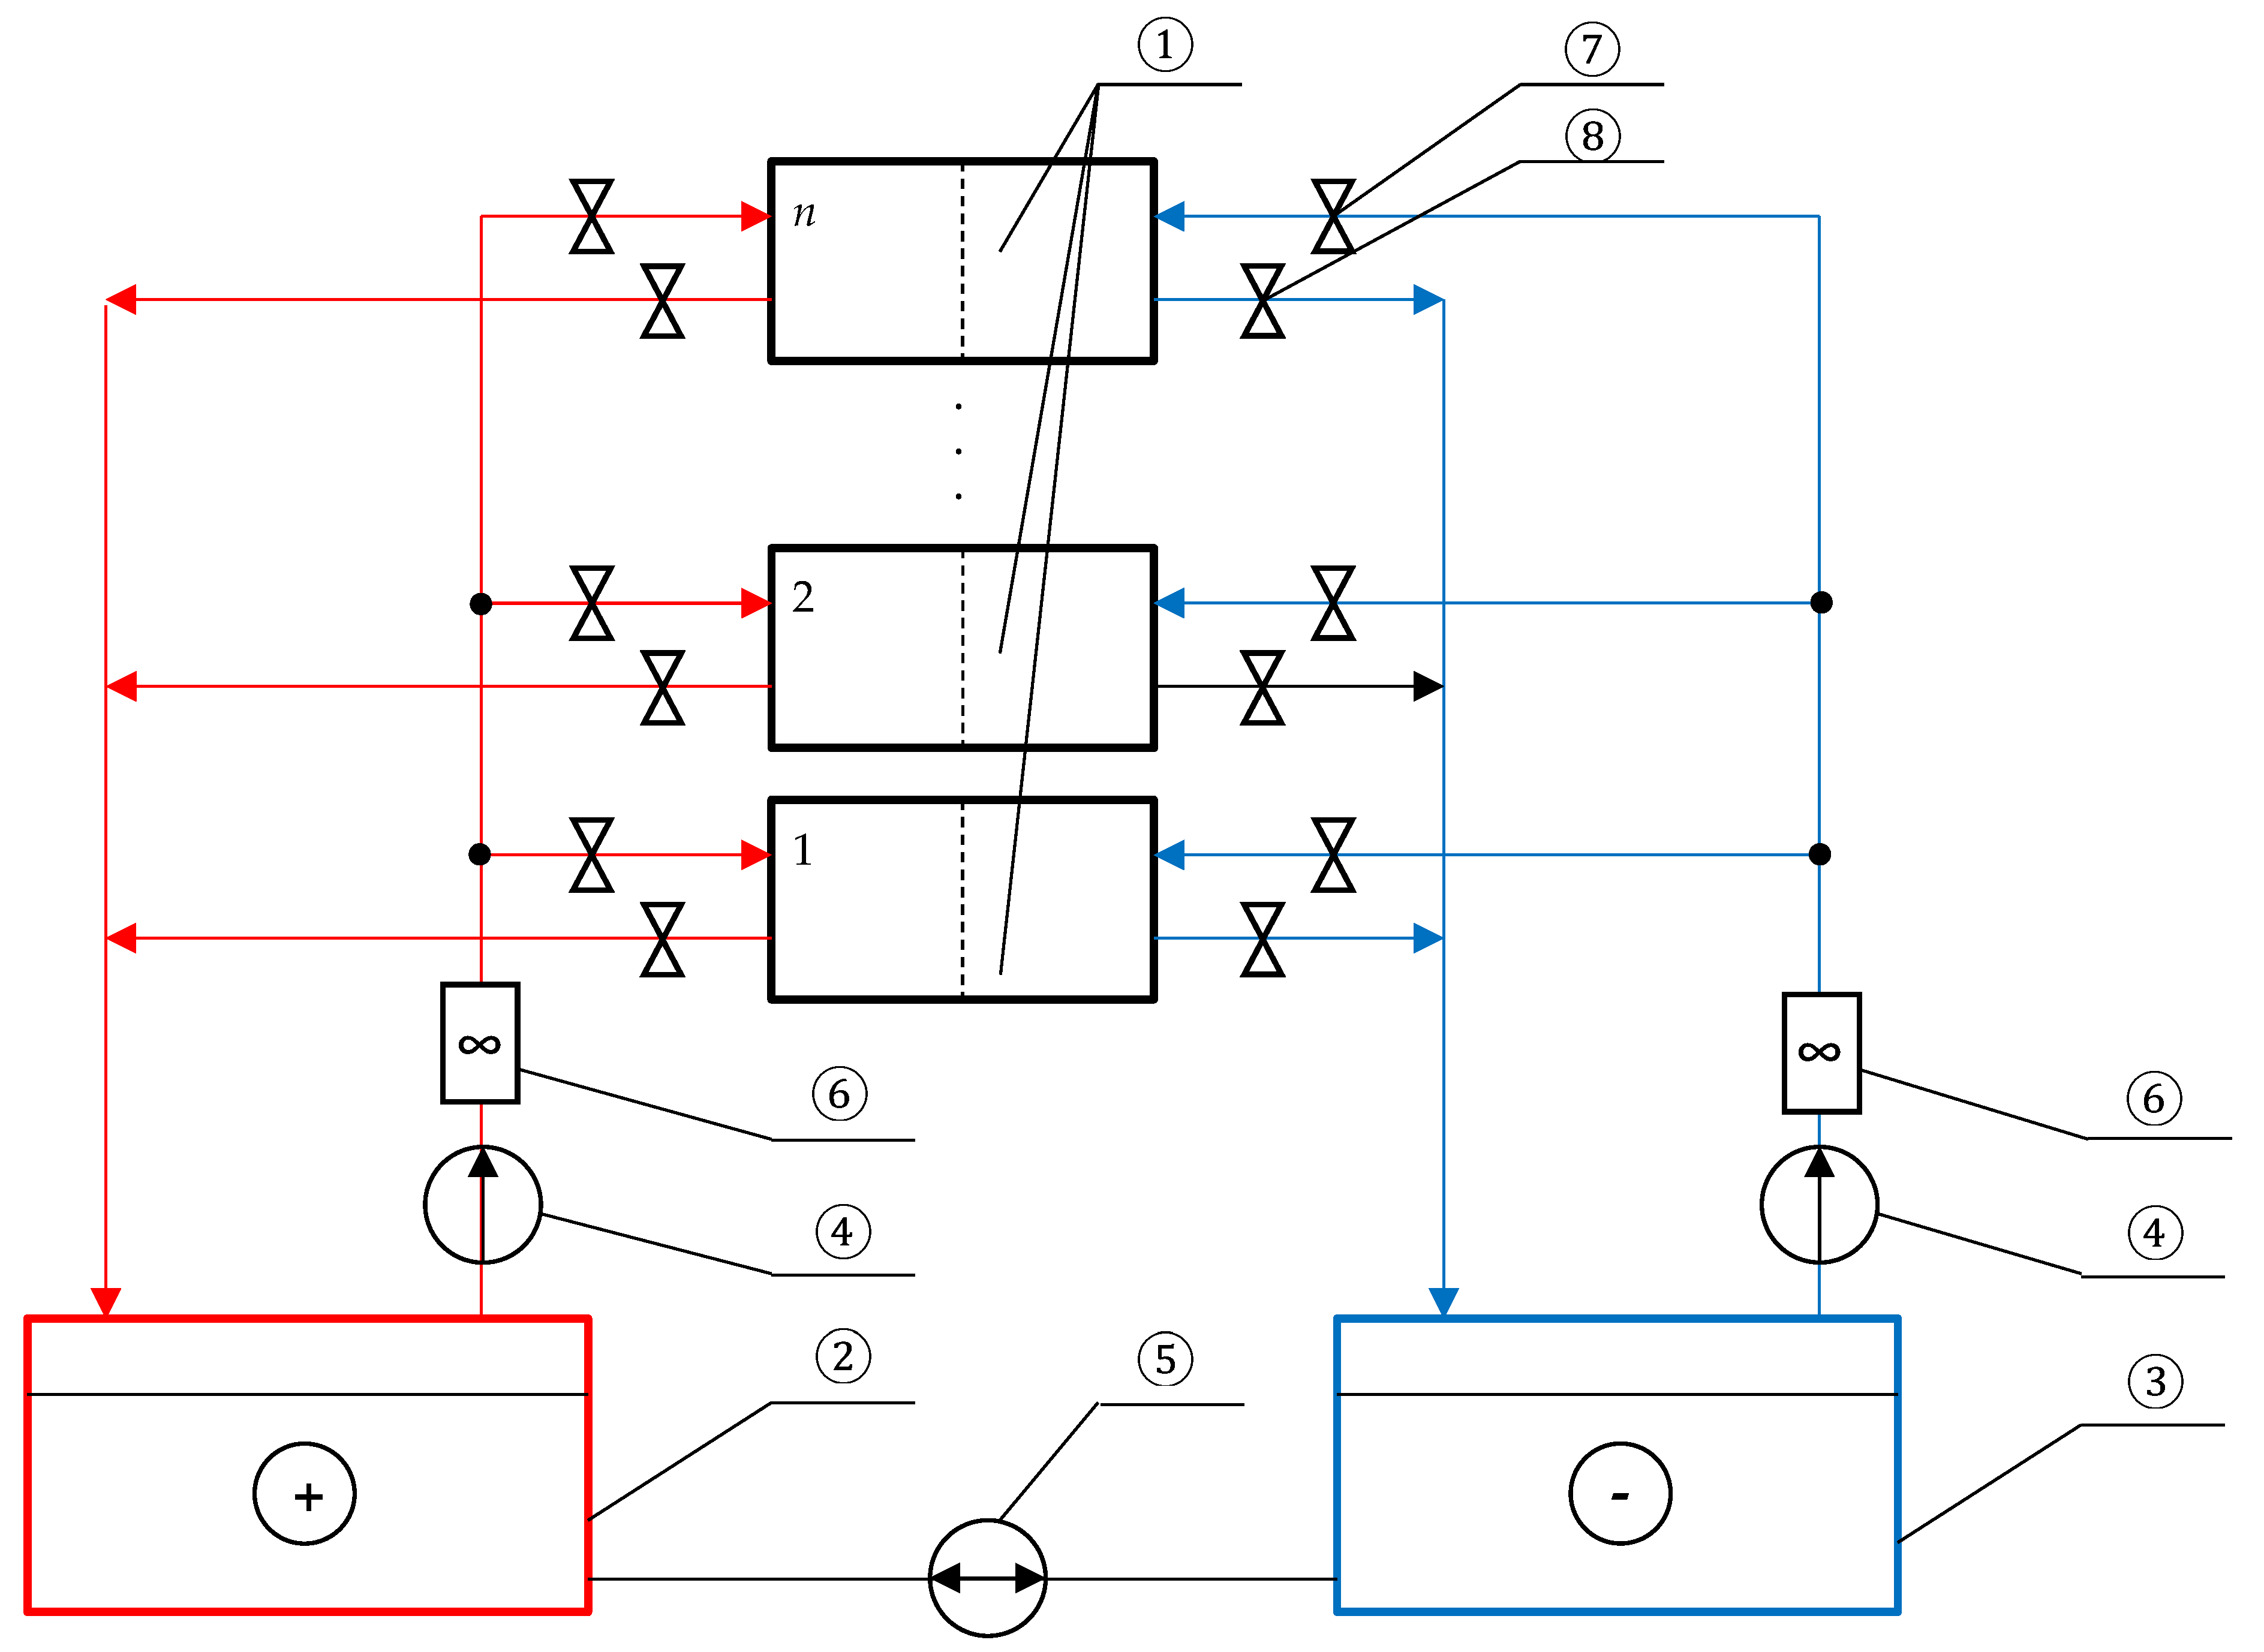
This paper deals with the problem of balancing flow battery stacks connected in parallel in terms of the volumetric flow rate of the electrolyte. A prototype of an uninterruptible power supply (UPS) system based on two stacks of all-vanadium redox flow batteries electrically connected in series and in parallel in electrolytes is studied. The electrolyte is pumped using two centrifugal pumps, one for each circuit (the circuit with a positive electrolyte and that with a negative electrolyte). The aim of this article is to demonstrate that due to the difference in stack hydrodynamic parameters, electrolyte flows through the stacks differently, and the voltage induced on the stack with a lower electrolyte flow decreases. This leads to an incomplete use of electrolyte energy and results in a decrease in system efficiency and DoD. This effect can be corrected by reducing the flow through the cell with low hydrodynamic resistance using ball valves (
7), according to the scheme in
Figure 1 [
27].
The rest of the article is structured as follows.
Section 2 presents a description of the studied prototype and experimental methodology. The results of the study of stack characteristics and battery DoD without and after regulation of the electrolyte flow are presented in
Section 3.
Section 4 describes the proposed electrolyte flow control approach and its benefits, including the developed pressure valve and optimal system operation algorithm.
2. Materials and Methods
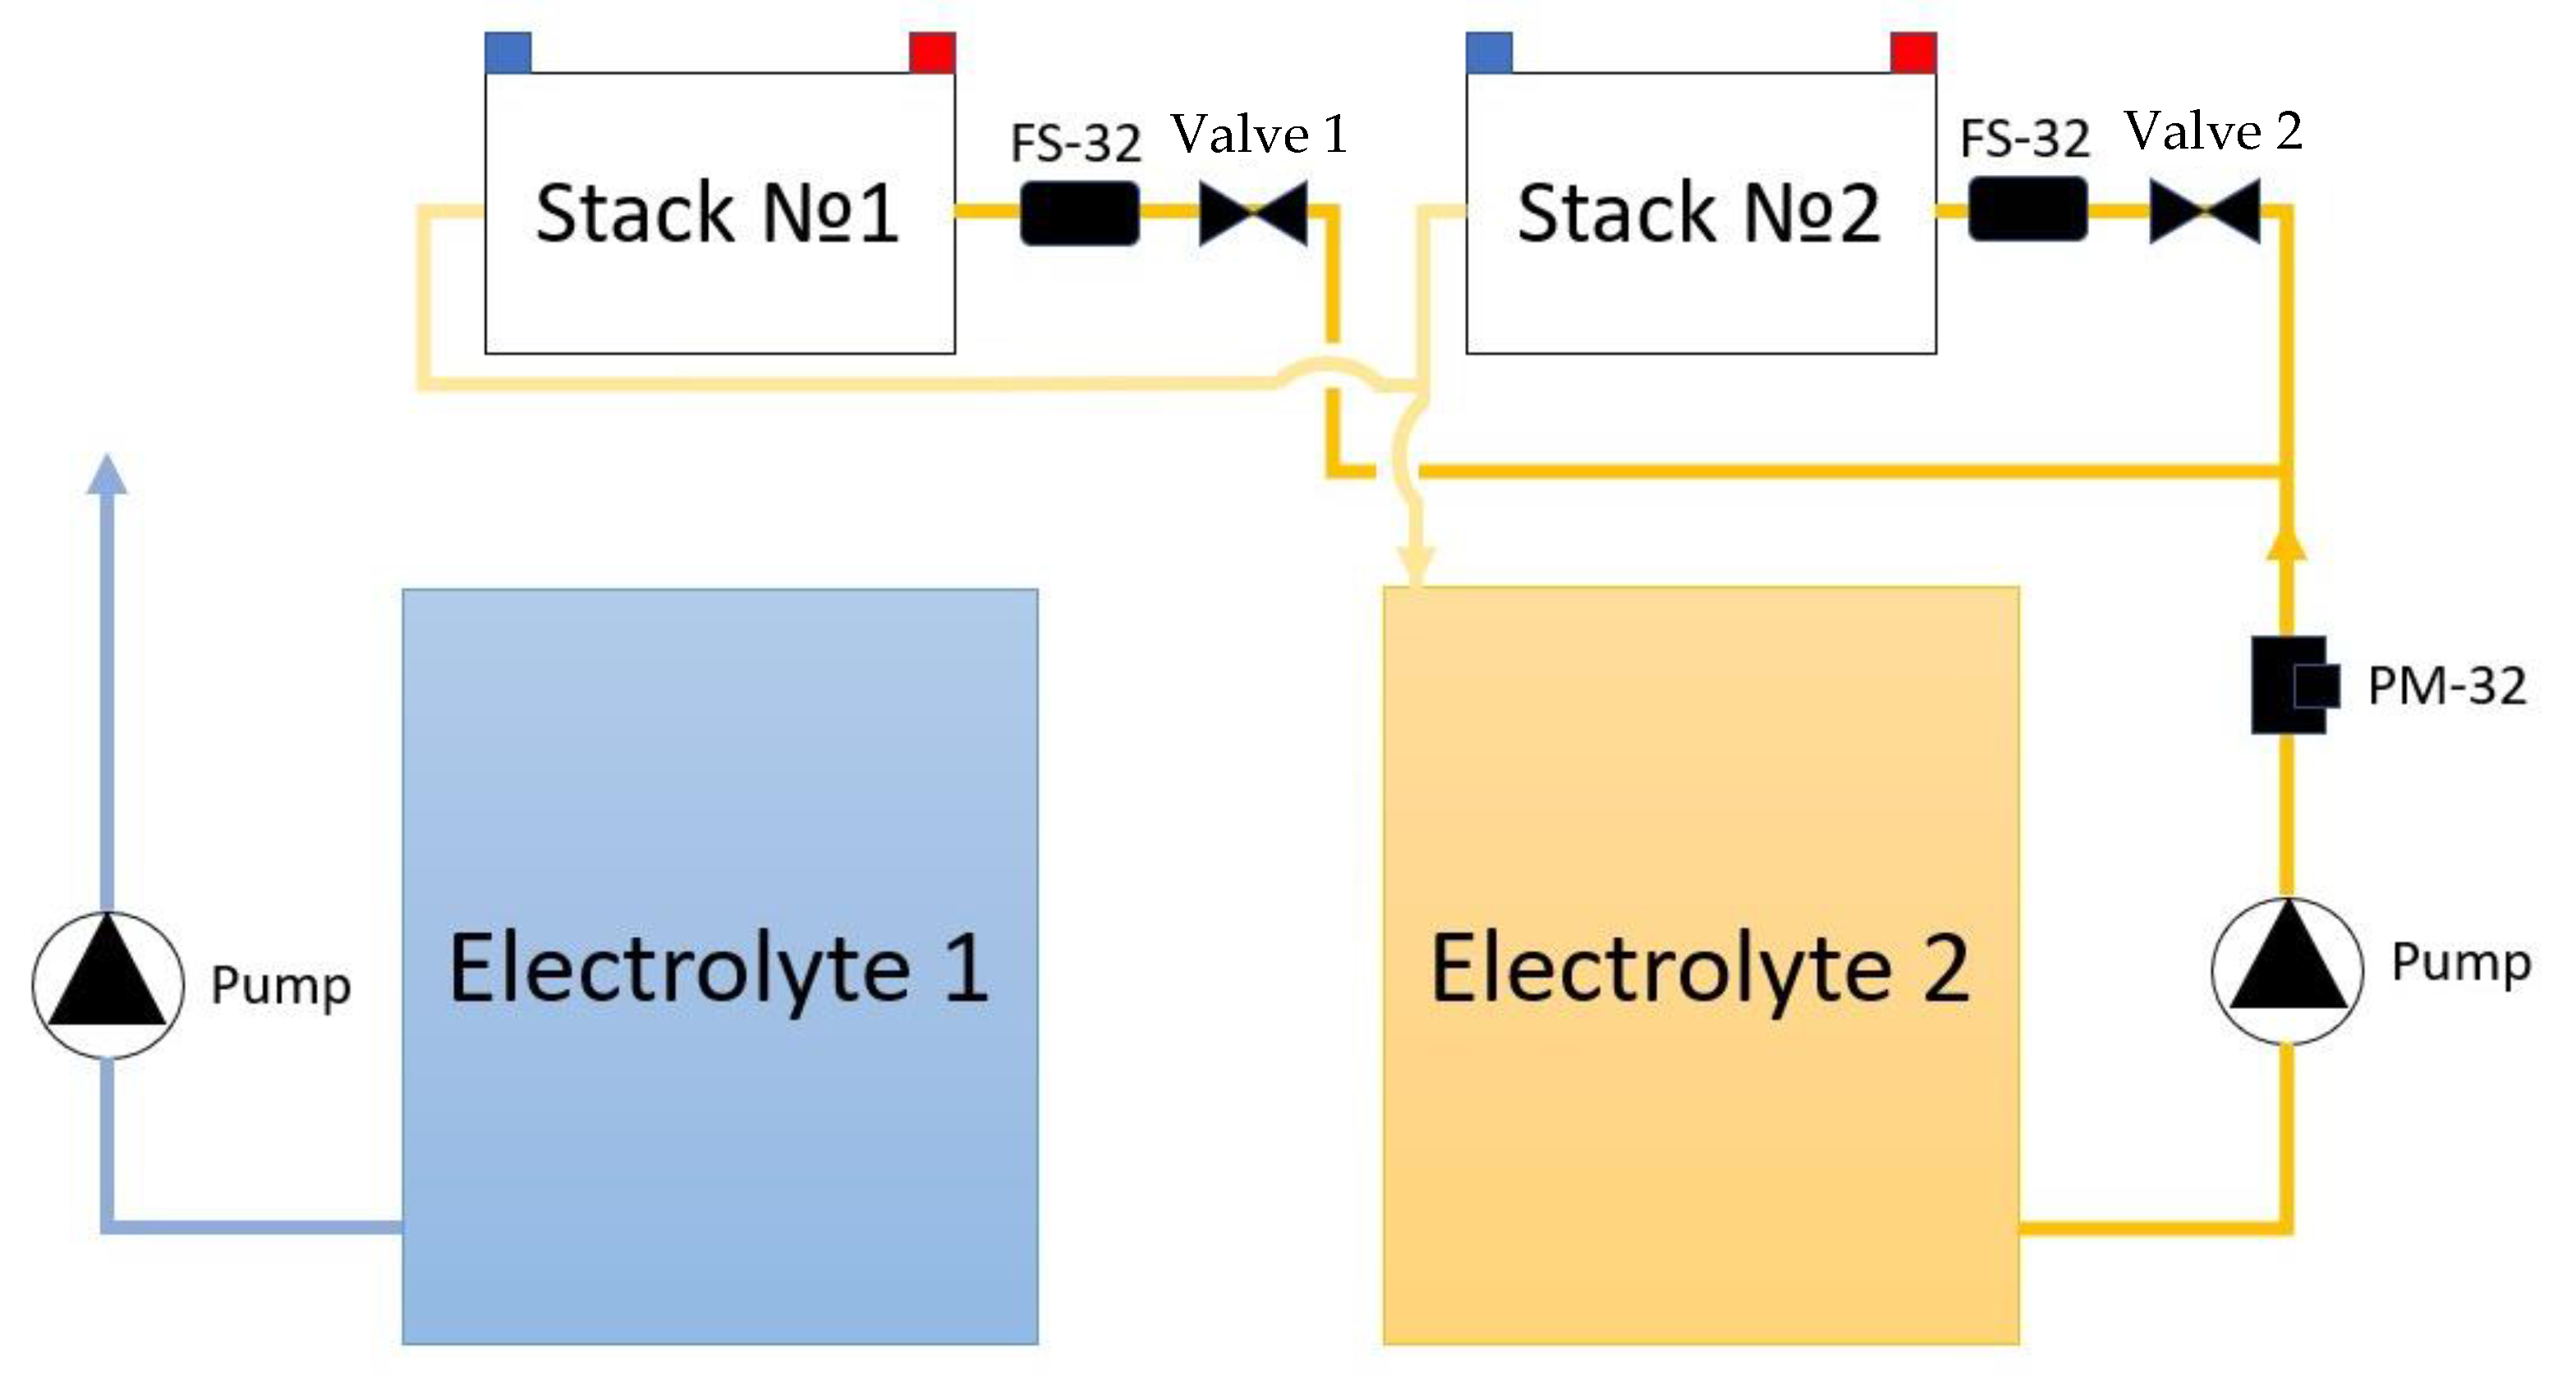
The external view of the UPS prototype with two stacks of all-vanadium redox flow batteries is shown in
Figure 2. The hydraulic system of each stack can be separately closed using valves and flow sensors which are installed at each stack inlet (
Figure 3). One pressure sensor is installed on each circuit, because the pressure is the same for both stacks even when the flow is split between them. The pumps are controlled using frequency converters. The system elements are presented in
Table 1.
A sulfuric acid electrolyte with a vanadium concentration of 1.6 mol/L and a sulfate ion concentration of 3 mol/L was used as an electrolyte. The volume of electrolyte in the tanks was 1.4 m
3. The capacity
E0 calculation was carried out according to the discharge curve using the equation [
28]:
where
U(
t) and
I(
t) are the instantaneous values of the voltage and current, respectively, and
tDch is the discharge time.
The charge was carried out in the same way in each test. The electrolytes were mixed in order to exclude the effect of imbalance on the results before each test. The electrolyte mixing was controlled using a spectrophotometer.
Figure 4 shows the electrolytes’ optical density spectra before charging. The average charge of vanadium ions in the electrolyte after mixing was 3.5+. In this case, the spectra in each test were similar to each other, which proves the similarity of the initial conditions of the tests. The average valency was determined using calibration solutions containing vanadium 1.6 mol/L and VO
2+ and V
3+ ions. The concentration of VO
2+ ions was determined by comparing the line intensity at 760 nm, and the concentration of V
3+ ions at 400 nm. Thus, the electrolyte was found to have a composition of 0.8 mol/L VO
2+ and 0.8 mol/L V
3+.
Charging was carried out in IU mode with the valves fully open, where first, a constant 100 A charge current was maintained until a 116 V system voltage was reached; then, a constant voltage was maintained in the system until a 40 or 20 A current was reached.
The valves were adjusted before the discharge. The stack with the lowest hydraulic resistance (in this work, this was stack № 2) was partially overlapped. The hydraulic system was adjusted as follows: the positive and negative electrolyte valves were rotated at a certain angle and fixed in this position. In this case, a 90° angle is a fully closed valve, and 0° is a fully open valve. Following this, the pumps were turned on and the discharge began. The discharge was carried out at a 63–65 V system voltage with a 98–102 A constant current. A constant discharge current was maintained by the operator by changing the load resistance as the battery voltage decreased.
The pause between the charge and discharge process was 5 min, so that the self-discharge value in the stacks remained at the same level for all tests.
The study of electrolyte flow through each stack was carried out separately by closing the inlet valves on the other stack. Thus, the electrolyte only passed through one stack. The pumps’ frequency was set by a frequency converter.
3. Results
Figure 5 shows the dependencies of the electrolyte pressure through stack № 1 and stack № 2 (when the other stack is closed) on the frequency that was set on the frequency converters. The dependence curve has an extremum, which corresponds to 50 Hz. It is an optimal frequency for pump operation. Increasing the frequency in order to increase productivity of this system is not possible because the flow rate depends on the inlet pressure [
29]. This phenomenon was observed in [
30], and apparently this trend is valid for this type of pump as well.
It is also worth noting that the pressure for the positive electrolyte (hydrodynamic circuit) was higher than for the negative electrolyte. At the same time, this difference was almost the same for both stacks. Perhaps, this is due to the electrolyte density, because in the positive circuit, reactions occur with the participation of vanadyl ions VO
2+, which are more massive than classical vanadium ions [
31]:
A decrease in flow rate with an increase in frequency above 50 Hz was also confirmed by the data on the dependence of electrolyte flow rate on pressure (
Figure 6). It can be seen that the flow rate first went up with the pressure increase, but then decreased, which is associated with a decrease in inlet pressure due to the pumps’ frequency exceeding the rated frequency of 50 Hz. It can also be noted that the flow rate in the negative circuit with an equal load on the pumps was higher than that in the positive circuit. Extrapolating the data obtained, it can be seen that the hydraulic resistance coefficient for the negative circuit was practically the same for stacks № 1 and № 2—0.451 and 0.447 atm/(m
3/h). The hydraulic resistance coefficient for the positive circuit differed greatly for stacks № 1 and № 2—0.906 and 0.669 atm/(m
3/h), respectively. This presents a problem, because if both stacks turn on at the same time, it can lead to a decrease in flow in stack № 1 due to higher hydraulic resistance, which in turn, will lead to a decrease in its power [
32]. The reciprocal values of the hydraulic resistance coefficient are added up with a simultaneous switching on (
Figure 7).
Figure 8 shows the decrease in power of stack № 1 due to the decrease in voltage over time at the stack terminals when the battery is discharged. The discharge took place with the valves fully open. It can be seen that the voltage on stack № 2 decreased more slowly than that on stack № 1. This effect, as it was assumed above, is associated with the large hydraulic resistance of stack № 1 in the positive circuit.
To minimize this effect, the valves at the inlet of the positive circuit of stack № 2 were partly overlapped, thereby adding additional hydraulic resistance in this circuit. These actions should partially equalize the flows in the circuits of both stacks and lead to balancing the stacks in terms of power.
Table 2 presents the results of the battery discharge capacity under various charging conditions and various valve positions. Ball valves were closed at 60° and 70° angles.
Figure 9a shows an increase in the operating time (i.e., discharge time) when the valve is closed at a 60° angle. At the same time, it must be assumed that a strong overlap of the valve can adversely affect the flow of electrolyte through stack № 2 and cause a negative effect. On the contrary, for example, it can be observed when the valve was closed at 70°. As can be seen from
Figure 9a, there was a sharp decrease in discharge capacity by 8 times (from 9.85 to 1.22 kWh, as shown in
Table 2) when the valves were closed at an angle from 60° to 70°. Therefore, it can be assumed that the optimum for opening the valve is up to 70°. The same effect of capacity reduction when the electrolyte flow rate changes was observed in [
23].
Interest has also been aroused by the possibility of dynamic adjustment during operation, because with a decrease in the charge of the electrolyte, the difference in flows begins to exert an increasing influence. Therefore, attempts were made to manually adjust the valves in the range of 55°–65° in order to withstand the minimum difference between stack voltages. The valves were first blocked at 55° and then during operation they are blocked at 65°. The moment of closing the valve during operation is marked as “Switching” in
Figure 9. This mode of operation is hereinafter referred to as manual adjustment. The stack voltages for valves with manual adjustment is shown in
Figure 10. It can be seen that the voltage difference remained practically unchanged for most of the discharge time, and the voltage of stack № 1 sharply increased only at the end of the discharge, which is apparently related to the depth of electrolyte discharge.
At the same time, it should be noted that the depth of charge affects the battery capacity, so when the battery is charged up to 20 A, it increased the capacity compared to the charge of up to 40 A by 68.7%. However, in the qualitative comparison, the depth of the charge did not play a significant role. If the overlap of the valves increases the capacity, it is only necessary to have the same conditions during charging; for example, for mode 2, the capacity was higher than for mode 3 (
Table 2). However, the reason for this is not the valves’ position, but the depth of the initial charge. The valve overlap had a positive effect at a closing angle of 60° (modes 1 and 3) with the same depth of the initial charge, as it can be seen from
Figure 9a.
A decrease in the difference between adjustment and non-adjustment (i.e., when the valves are fully open) modes was observed at a charge depth of up to 20 A. This is expressed in relation to a decrease in the ratio of discharge times (
Figure 9b). The discharge time increased by 15.7% with manual adjustment. This is comparatively less than with a charge depth of up to 40 A (
Figure 9a), where the discharge time with manual adjustment increased by 24.4%.
4. Discussion
The effect of balancing by reducing the flow through one of the stacks can be explained as follows. Based on the experiments performed, it can be assumed that the stack power does not depend linearly on the electrolyte flow rate, as shown in [
29]. Therefore, if one of the stacks operates with excess power, reducing the flow rate through it even by 30% may not lead to a significant decrease in power, while increasing the speed by the same value for the second stack will lead to a significant increase in power. At the same time, it should be taken into account that if the flow rate drops below the critical value, then a sharp drop in power will occur.
Table 2 shows that the valves’ overlap leads to an increase in discharge capacity under the same charge conditions. But this effect has an optimum, because with an almost complete valve overlap, a decrease in discharge capacity was observed as the flow through stack № 2 was significantly reduced. In general, the stationary overlapping of valves gives a 25% increase in capacity. But much more interesting is manual adjustment, which achieved a 31 and 15% increase in capacity for 40 and 20 A charge currents, respectively. This approach opens up a new way of balancing flow batteries, where automatic valves can act as balancing elements to regulate flows in the corresponding circuits.
A pressure valve can be used for this adjustment. It seems to be a more reliable solution compared to mechanical valves that have moving parts. The durability of mechanical valves is significantly lower than for a flow battery as a whole, and this weak structural element can cause depressurization of the hydraulic system. Therefore, taking into account these risks, another way of organizing the flow overlap is proposed.
Figure 11 shows a sectional diagram of a pressure shut-off valve. Pressure is applied to hole (1), which causes compression of PVC pipe (2), blocking the flow through the pipes (4). This results in flow reduction through the valve. Distilled water or oil can act as the pressure source. Air can also be used, but it is more inert due to its compressibility. This method is safer, because the valve itself is surrounded by a casing (3), which still protects the electrolyte flow in the event of pipe (2) rupture. The ingress of hydraulic fluid is not dangerous if glycerin or distilled water is used.
This approach can be especially effective for systems that have been in operation for a long time because it is obvious that the flow battery stacks will not collapse evenly and some stacks will degrade faster than others. Therefore, they may face the same fate as stack № 1 in this study, and active balancing may be required to improve the system performance. At the same time, balancing may require an algorithm based on the readings of voltage and current sensors. However, one can use an algorithm that will optimize the system operation based only on the readings of flow sensors.
Figure 12 shows a flow chart of an optimization algorithm for pressure valve operation.
The algorithm is based on determining the flow rate (
vi) and voltage on stacks (
Ui). In this case, it is first necessary to determine which stack has the lowest voltage and assign it the number “1”. Next, the other stack is automatically assigned the number “2”, and then the algorithm selects the optimal position of the pressure valve. It is important that the valve on stack № 1 is not adjustable, otherwise, it may cause the algorithm to completely close all the valves on the stacks. Flow attenuation should only be performed on stacks with the best performance. At the same time, it is necessary to optimize valve operation precisely in terms of voltage, and not in terms of flow rate, because degradation processes can occur in stacks, which also reduces the operating voltage, leading to a strong divergence in voltage at an equal flow rate. It is also worth noting that optimal operation may not be the situation when the voltage on the stacks has leveled off, but there may be a situation where the voltage difference remains constant, which was observed in mode 6 (
Figure 10).
This mechanism has been experimentally tested for a system with two stacks, but balancing may be much more difficult or even impossible for a system with three or more stacks. This problem requires further study and the development of a mathematical model in order to obtain generalized conclusions.


 ,
, 


