1. Introduction
Lithium-ion batteries (LIBs) have already become the dominant power source for consumer electric devices [
1,
2,
3]. Since the widespread use of LIBs in electric vehicles (EVs), the ever-increasing market has led to even higher demands for commercial LIBs. To address the requirements of the automobile industry and to alleviate “drive-range anxiety” among consumers, extensive efforts have been made to research and develop LIBs with higher energy density and higher charging rates [
4,
5]. Other efforts have also been made in the pursuit of LIBs with better cycling performance, higher thermal stability, better safety, and reduced cost [
2,
6,
7].
In the study of LIBs, the potential for fast charging is limited by issues such as reaction inhomogeneity and Li plating. Graphite is commonly used in commercial battery anodes due to its low cost, high Li diffusivity, and low delithiation potential characteristics, but the low-voltage plateau in the charge–discharge profiles of graphite may inevitably increase the risk of Li plating during the fast charging process [
8,
9]. Li plating and the localized abuse caused by inhomogeneity are recognized as crucial factors leading to reduced lifetime and increased safety risks under abusive operating conditions [
10,
11,
12,
13,
14]. For example, inhomogeneity-induced local overuse and overcharge can result in internal short circuits under mechanical load, potentially culminating in thermal runaways.
The inhomogeneity of reactions in commercial LIBs can be categorized into three types: in-plane, which refers to inhomogeneity on the surface parallel to the current collector; inter-layer, which represents the variation among electrode layers in full cells; and intra-layer, which describes the inhomogeneity along the thickness direction of the electrode coating. Numerous studies have investigated inhomogeneity in the in-plane directions [
15,
16,
17,
18] and the inter-layer dimension [
19,
20,
21]. However, limited attention has been given to inhomogeneity in the intra-layer direction [
11].
Figure 1 shows typical cathode and anode configurations in commercial LIBs, in which the vertical direction of the SEM images and the schematic diagram represents the intra-layer direction mentioned above. Previous studies by Harris et al. [
22], Hogrefe et al. [
23], and Kuwabara et al. [
24] have examined microscopic electrochemical behaviors, the dendrite growth of deposited Li, and contaminated Cu on the cross-section of LIBs, respectively. Although these studies have demonstrated the significance of intra-layer inhomogeneity (ILIH in short), more complex experimental methods, such as operando or in situ techniques, are required for the detailed and quantitative characterization of ILIH.
Compared to ex situ observation and characterization techniques, in situ techniques provide a precise and reliable analysis of battery cells under different conditions (SOCs, etc.). Furthermore, operando techniques make it even more possible to observe and detect batteries during the charging and discharging processes [
27]. Consequently, operando or in situ techniques have emerged as a research hotspot in LIBs since the 2010s [
28].
Researchers have employed operando or in situ techniques to conduct numerous studies, including investigating Li dendrite growth [
29], observing cracks on electrode particles [
30], and characterizing Li concentration and current densities in electrodes or electrolytes [
31,
32,
33], etc. However, there is a relative scarcity of studies focusing on the cross-section of batteries, which require operando techniques and transverse-type samples [
28]. Most existing studies have only concentrated on the observation of Li plating and Li dendrite growth [
22,
29,
31,
34]. Although Li plating is crucial for studying battery failure, inhomogeneity may be more important for maintaining battery durability from an integrity perspective [
10].
To investigate inhomogeneity via the operando approach, optical characterization methods have been developed. For instance, Marie et al. employed an “in situ colorimetry method”, utilizing optical observation to quantify the SOC or potential of graphite electrodes [
18,
35]. Hogrefe et al. adopted the method to estimate the speed of lithiation by analyzing the colorimetric area of LiC
12 and LiC
6 in the cross-section of battery cells [
36]. Even though the colorimetric method has been employed in relevant studies, the limitations of this method when applied to particles in commercial batteries with poor consistency remain unsolved.
In summary, thorough studies on ILIH and its quantitative characterization are crucial for enhancing the durability and safety of LIBs. Nevertheless, to the best of the authors’ knowledge, there have been very few studies that have successfully characterized ILIH during the (dis)charging process, let alone established a quantitative ILIH measuring method.
In this research, an operando optical microscopic approach was used to obtain simultaneous electrical and chromatic image data. Furthermore, a new data analysis method is proposed to characterize the Li intercalation level of anode graphite particles in commercial batteries, enabling the quantitative characterization of ILIH. The robustness of the method was verified via the results obtained from multiple battery cells subjected to different charging and discharging rates. Additionally, based on the relationship between ILIH and the SOC, the electrochemical mechanism underlying the trend of ILIH along the SOC is further discussed.
The remainder of this article is organized as follows: In
Section 2, the sample preparation and experimental settings are introduced. In
Section 3, the newly proposed ILIH assessment method is detailed, and its necessity is briefly explained through a preliminary analysis of the optical signal. The results of the ILIH assessment are shown in
Section 4. Finally, the conclusions and outlooks of this study are provided in
Section 5.
3. Methods
Based on the optical and electrical data obtained in the experiments, a series of data analysis processes were conducted. The corresponding methods are fully illustrated in this section. The section begins by presenting an intuitive analysis of the optical signal from the cross-sections of the batteries, highlighting the necessity of the ILIH assessment method, which is further introduced in this section.
3.1. Preliminary Analysis of the Optical Signal
In this subsection, we illustrate that the color response of the cross-sections on the anode side is highly sensitive to changes in battery SOC, and significant inhomogeneity in the intra-layer direction can be observed. However, owing to the inherent randomness of commercial batteries, the statistical results exhibit the limitation of the colorimetric method in identifying the SOCs of local regions and characterizing the ILIH values.
In this study, three battery samples were tested and observed. One sample was selected to demonstrate the characteristics of the operando optical response.
Figure 4 presents the representative electrical signal of the battery in the tests, whereas
Figure 5a illustrates the color reaction of the graphite lithiation process captured by optical microscopy. As the lithiation process progresses, the Lithium–Carbon composite in the anode undergoes a color change reaction, transitioning from grey to blue, orange, and gold [
35,
36]. This physicochemical phenomenon is a consequence of the transition between different phases within the Lithium–Carbon composite during lithiation and delithiation processes, which can be readily discerned through optical observation. At room temperature, the phases correspond to Li
0.04C
6-Li
0.33C
6-Li
0.5C
6-LiC
6, correlating with a color transition from grey to dark blue to orange (or dark red) to gold [
22,
37]. Moreover, distinctive differences in the graphite color in the cross-section were observed at different charging rates. The arrows in
Figure 5a indicate that higher charging rates result in a larger golden area near the separator and a larger blue area further away from the separator, which can be classified as an ILIH phenomenon. On the other hand, previous studies [
23] and the observations in
Figure 5a indicate that the LFP cathode material exhibited insignificant optical variation throughout the lithiation and delithiation processes. Additionally, variations in the size and distribution of anode graphite particles were observed in commercial battery coatings, primarily due to the manufacturing process.
In previous studies, the colorimetric method has been employed to determine the SOC of the particles. However, due to the inherent randomness resulting from the experimental settings, sample preparation, anode material systems, etc., the colorimetric method was not suitable for evaluating the Li intercalation status of the local area of interest.
The primary color ratio analysis in two parts of the same battery sample is shown in
Figure 5. The local image captures of part ① and ② (
Figure 5a) at 30% SOC and 60% SOC are respectively zoomed in and shown in
Figure 5b,c. The primary color ratios of these two parts were calculated throughout the 0.125C charging process, and the results are presented in curve graphs. In these graphs, the short-dashed lines indicate the positions of 30% and 60% SOC. The inconsistent color ratio trends of the primary colors indicate variations in the color reaction at different local areas. The differences between part ① and ② are also obvious intuitively: at the same 30% SOC condition, they exhibit a similar blueish color, whereas at the same 60% SOC condition, the particles in part ② turn orange to a similar extent. Furthermore, in part ①, some particles become bright gold, whereas others remain blue.
From the preliminary analysis, it is evident that there are variations in the color change among different parts of the cross-section. Therefore, a single absolute criterion is not suitable for quantitatively analyzing the intricate information obtained from the image. This introduces non-negligible interference in the absolute colorimetric analysis process and may bring limitations to the existing colorimetric methods. Hence, in order to evaluate the real-time ILIH value of the battery, a new method is introduced (in the following section).
3.2. ILIH Assessment Method
In this subsection, the ILIH assessment method is explained in detail. The method was based on the color change of the Lithium–Carbon composite in the anode during its Li intercalation: a grey–blue–red–gold color reaction along with the intercalation reaction of Li
0.04C
6-Li
0.33C
6-Li
0.5C
6-LiC
6 [
35,
36,
37]. However, to overcome the inherent randomness mentioned above, the assessment could not rely on absolute criteria. Therefore, this paper has established a relative criterion using the optical data obtained during low-rate (dis)charging processes. Through a series of data processing operations, the quantitative assessment of ILIH was achieved.
Specifically, the data processing operations included: characterization of the Original Relative Illuminance, which managed to normalize the data in a positional sense, as introduced in
Section 3.2.1; calculation of the Normalized Relative Illuminance, which normalizes the data in terms of illuminance, as introduced in
Section 3.2.2; and characterization of the ILIH value, which included a linear simplification process and an angular decomposition process aimed at eliminating systematic inhomogeneity noise, as introduced in
Section 3.2.3.
3.2.1. Characterization of the Original Relative Illuminance
As mentioned before, the randomness in battery electrode manufacturing leads to different sizes and non-uniform distribution of the anode graphite particles. Moreover, the thickness and position of the electrode coating also changes during charging and discharging processes, which can be seen in
Supplementary Video S1. This is mainly due to the volume change of electrode particles in the (de)lithiation process and other environmental disturbances. Thus, the absolute position of the anode coating (the object of this study) cannot be guaranteed.
In order to carry out an operando comparison of the same sample under different SOCs, charging rates, battery cells, etc., it is necessary to eliminate the influence of component deformation and position shifting on image data. As a result, to obtain robust quantitative results from the image analysis of the battery samples, the following operation is required.
The Original Relative Illuminance (ORI) is calculated by analyzing the color information of the photochrome captured in optical microscopy.
Figure 6a shows a typical part of the image capture when Battery-A (one of the studied battery samples) was fully charged. In this image, ①④⑥ represent the anode and ②⑤⑦ represent the cathode. Only ④①②③⑤ and the external circuit form a complete loop.
Figure 6b presents the ORI extracted from the original image (
Figure 6a) by summing up the primary color values of pixels on the same row (perpendicular to the anode coating thickness direction). The upper and lower boundaries of the anode coating were identified according to the optical characteristics of the separator (③) and current collector (④), respectively. Then, the pixels boxed in the identified area were isolated and characterized in terms of their relative position (ranging from 0 to 1) along the anode coating thickness direction.
Figure 6c shows the result of position normalization for the ORI. This process helps to eliminate interference caused by the volume change of the battery or any wobbling of the microscope.
3.2.2. Calculation of the Normalized Relative Illuminance
As mentioned earlier, non-uniformity in graphite particle size, distribution, and physicochemical characteristics can arise due to experimental settings, sample preparation, the manufacture of anode coatings, anode material systems, etc. Non-uniformity may cause inconsistent color reactions and incomparable illuminance changes, posing challenges in evaluating the Li intercalation status of the local area of interest.
In order to address the challenges posed by the inherent randomness mentioned above, this article proposed a method: normalizing the ORI of one of the primary colors to establish consistent “Color–Li intercalation” relationships across different local areas. The normalized ORI is referred to as the Normalized Relative Illuminance (NRI) throughout the rest of this article.
The formula for calculating NRI is as follows:
where,
is the relative position along the thickness in the anode coating (ranging from 0 to 1);
denotes the time history;
represents the RGB primary colors. Using the formula, the minimum and maximum values of ORI were calculated at each
point with respect to
. Consequently, NRI serves as a rational characterization parameter for the Relative Lithium Insertion Amount (RLI) of the anode.
Figure 7 illustrates the calculation process of
, wherein the following equations are satisfied:
where any
.
By normalizing the local illuminance of ORI, the inherent difference among the particles at different relative positions can be reduced to an acceptable extent. As a result, real-time evaluation of ILIH in the battery sample can be further achieved using NRI data.
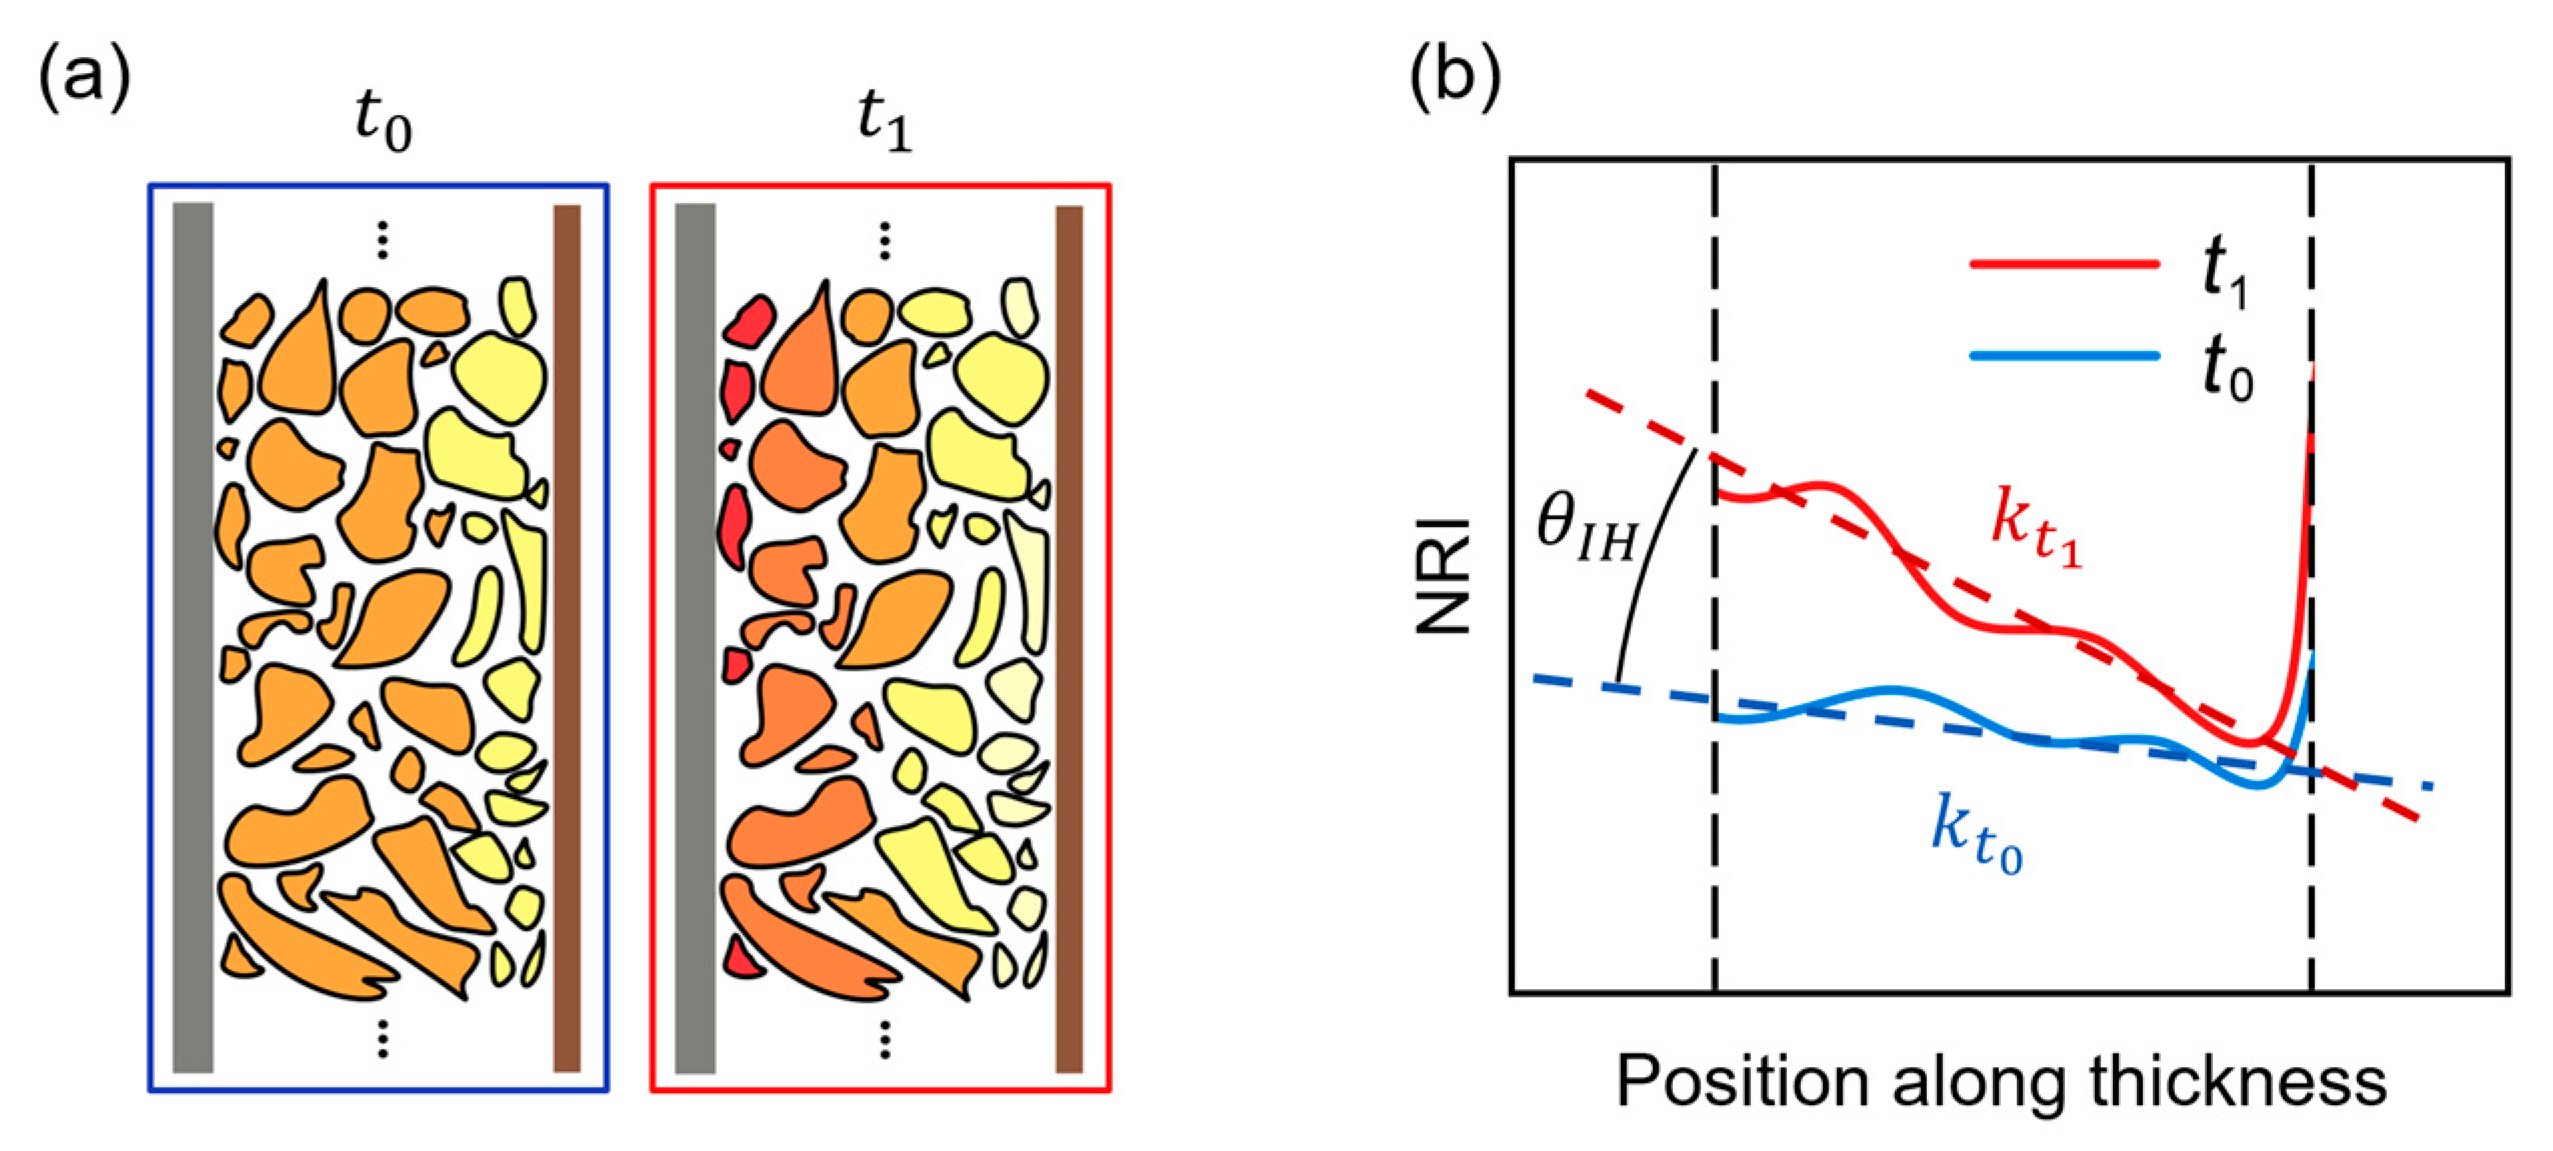
3.2.3. Characterization of the Intra-Layer Inhomogeneity (ILIH) Value
The ILIH is specifically represented by the degree of SOC deviation at different positions along the thickness direction. In this study, the authors tried to describe ILIH with a specific “ILIH value”, represented by . In the practical analysis process, the determination of this slope is based on the fitting of NRI at different positions along the thickness direction. However, it should be emphasized that the NRI value at a particular location cannot directly represent the local SOC. As mentioned before, the manufacturing of commercial batteries and the preparation of samples in the laboratory may introduce systematic deviations to the relationship between NRI and SOC. To overcome this deviation, during low-rate (dis)charging processes (1/8C in this case) is considered zero, i.e., it is considered homogeneous. Consequently, the NRI slope values in the low-rate process represent the systematic noise of the sample at specific SOCs. Therefore, the following operation is required to eliminate systematic deviations and to obtain the assessed ILIH value ().
Figure 8 presents the schematic diagrams related to NRI fitting and the ILIH characterization process. Time
corresponds to medium/high-rate conditions (1/4C, 1/2C, or 1C in this case), whereas time
corresponds to low-rate conditions (1/8C in this case). Notably, the battery sample is at the same SOC at both moments. As mentioned before,
in low-rate conditions is considered systematic noise. So, as
Figure 8a illustrates, a comparison between
and
can derive
with a specified SOC and charging/discharging rate.
Figure 8b illustrates the NRI fitting process, in which the estimation of
is made. Systematic noise needs to be excluded from the image analysis results at
, so an angular decomposition formula was derived as follows:
in which case, as
is in the low-rate charging process,
is considered to be zero.
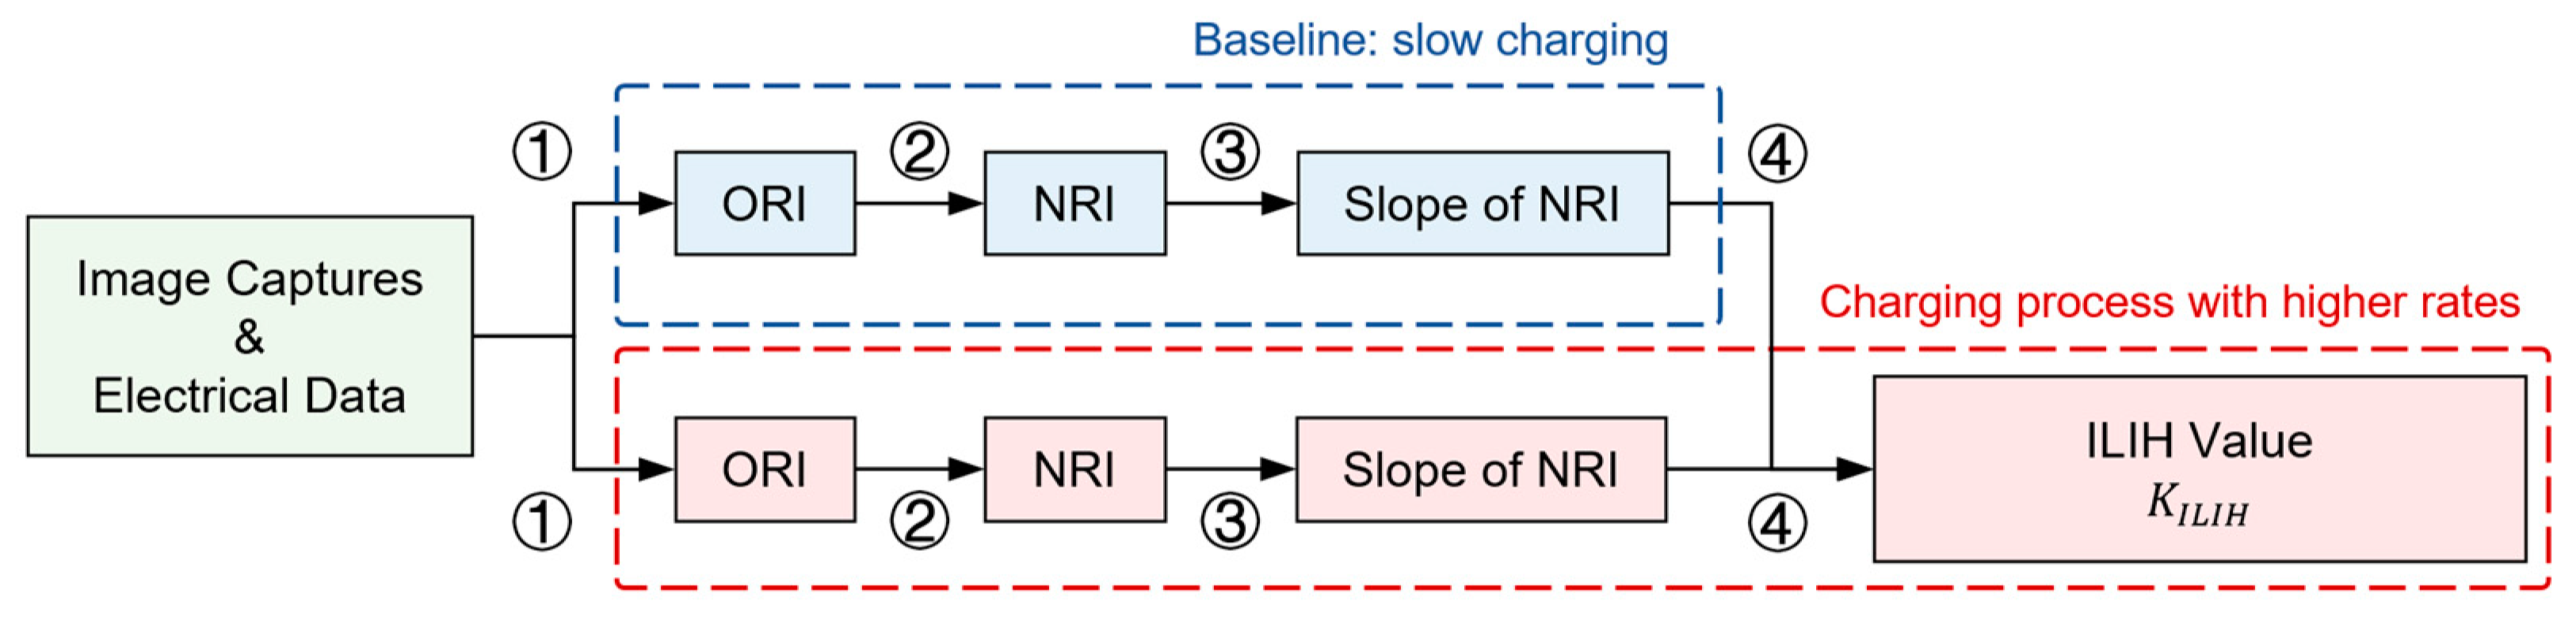
To summarize, the ILIH value assessment process is outlined in a flow chart, as shown in
Figure 9. The nominalization of position and illuminance ensures reliability at both the position and color levels, respectively. This process converts the qualitative and unstable image results into quantitative and robust
results.
Significantly, because the images, ORI, NRI, and
are time series data, a data-navigating video can be generated during processing. Furthermore, the data-navigating video can assist in error checking during the data analysis process. An example of a data-navigating video is provided in
Supplementary Video S2, and a brief introduction and analysis of the video can be found in the
Supplementary Material. A detailed analysis of the
results will be discussed in the next section.
4. Results and Discussions
By applying the ILIH assessment method demonstrated above, a series of
results were obtained, all of which are illustrated and discussed in this section. In
Section 4.1, the
results are presented and discussed, and the robustness of the introduced method is verified for different battery samples with different charging rates. In
Section 4.2, the
trend and its underlying physicochemical mechanism are illustrated and discussed in detail, providing support to the interpretability of the ILIH assessment method.
4.1. Results of ILIH Value Assessment
As shown in
Figure 5 and
Supplementary Video S2, the Red Channel exhibits the most significant changes during the (dis)charging process. Therefore, processing the Red Channel data would be highly beneficial in characterizing ILIH. Consequently, a series of
-SOC data (via the Red Channel) from different batteries and charge/discharge rates are sorted out.
Figure 10 illustrates the
-SOC plot during the charging process of the three batteries, whereas
Figure 11 shows the plot during the discharging process. Due to slight electrochemical instability in Battery-C, the charging/discharging rates did not precisely match the pre-set values in the tests, and the 1C rate was not properly executed. However, because the three cycles were still comparable (0.172C is close to 0.125C, and 0.345C and 0.69C are two times and four times the 0.172C baseline), Battery-C was still worth analyzing. For the sake of clarity, the three different charging rates are uniformly expressed as “0.125C”, “0.25C”, and “0.5C” throughout this study. Additionally, the cross-section of the Battery-B sample exhibited lower reflectance in the ECCS, resulting in dimmer original photochromatic captures that were more easily affected by systematic noise, leading to greater fluctuations in its
-SOC plot.
In the charging process,
has negative values because the zero point of position along the thickness is defined on the separator side. It is important to note that the positive and negative values of
represent the direction of inhomogeneity, whereas the absolute value refers to the extent of inhomogeneity.
Figure 10 shows a similar
trend, including a near-zero plateau at low SOCs, a rapid change at medium–high SOCs, and restoration at high SOCs.
During the discharging process, shown in
Figure 11,
returns to zero as the SOC decreases. Battery-A and Battery-B exhibit similar trends, whereas Battery-C behaves differently, with barely any change in
during the discharging process. The divergent trend is attributed to the different end points of
-SOC in the charging process, where Battery-C has large positive end points instead of negative ones. In the experiments, Battery-C undergoes an extremely short CV charging process compared to Battery-A and Battery-B, which may result in abnormal charging end points. The authors believe that the abnormal behavior of Battery-C in this case may also result from the sample’s slight electrochemical instability.
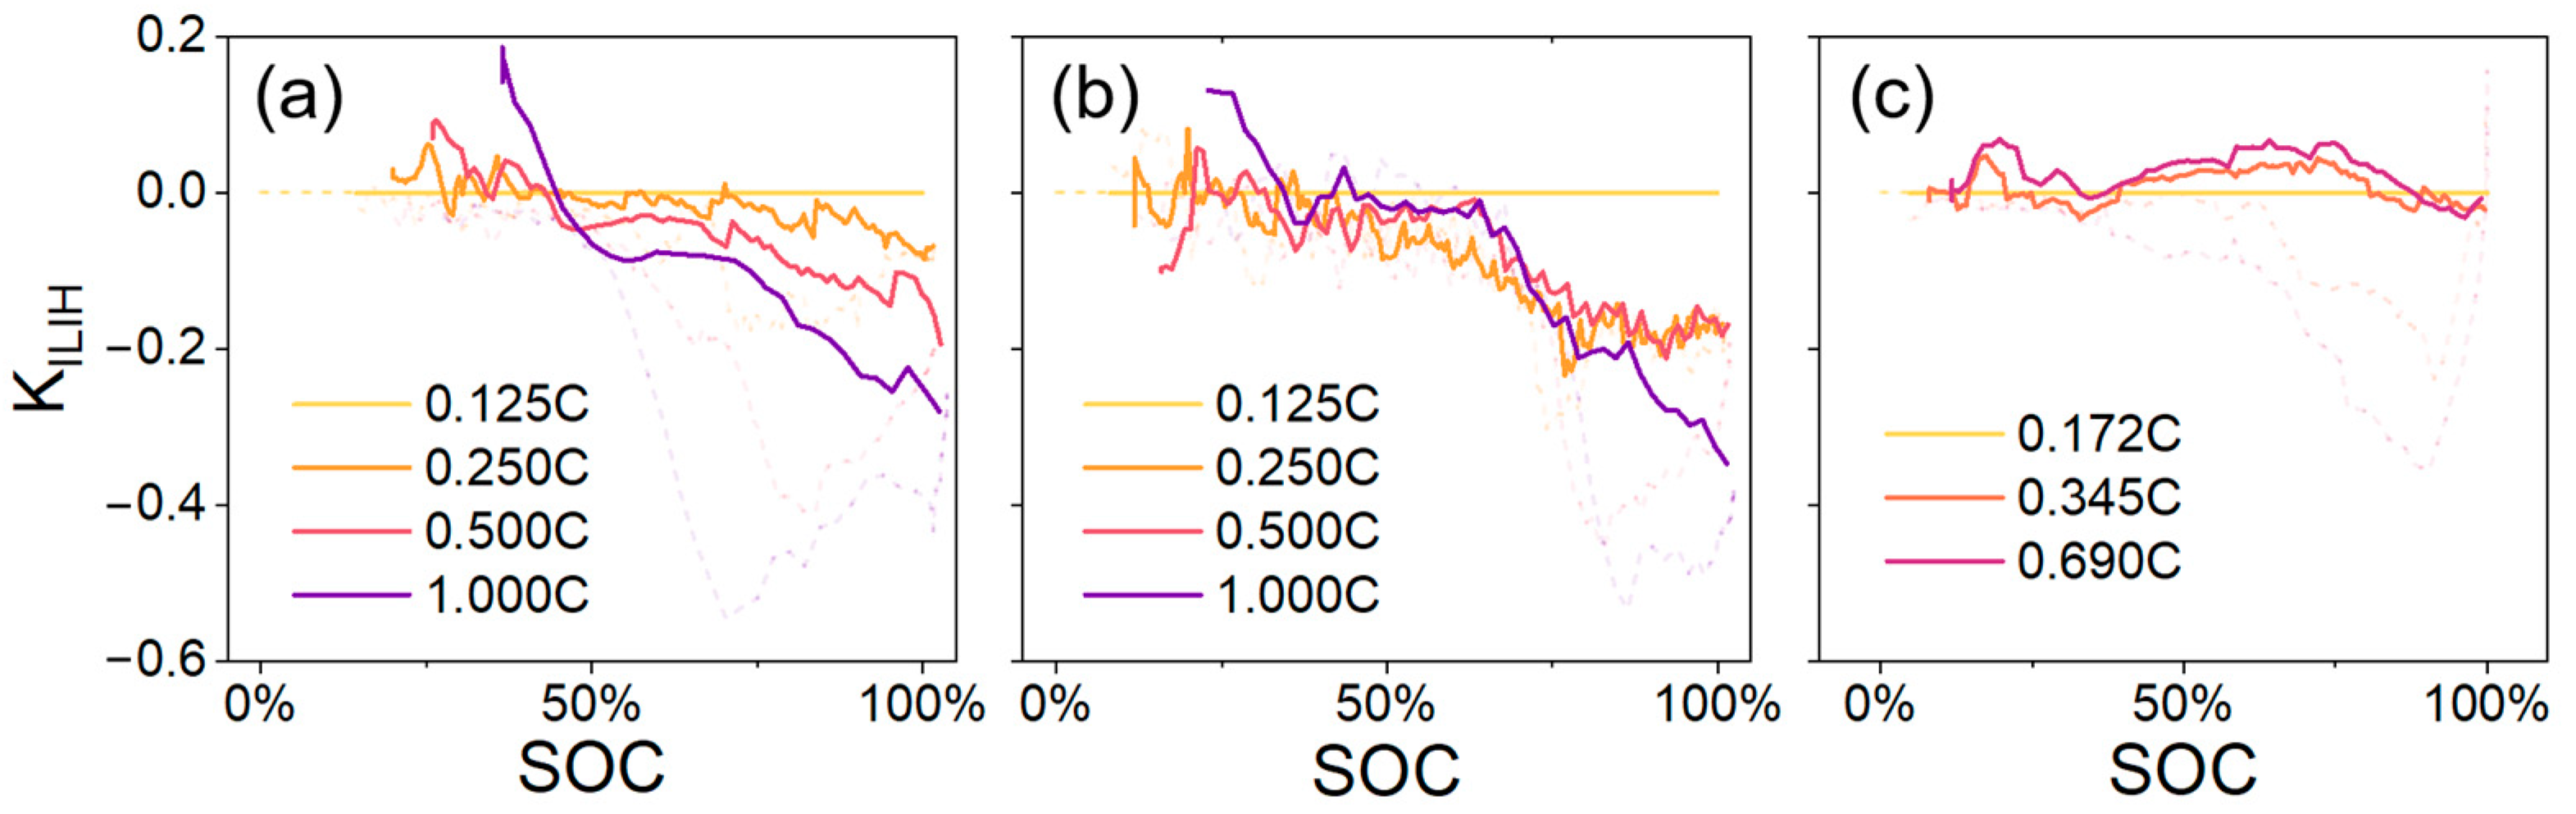
By combining the
-SOC curves obtained at the same charging rates, as shown in
Figure 12a–c, a comparison between different battery cells can be made. The peak
(in the negative domain) was
at 0.25C and
at 0.5C, whereas in the 1C condition (excluding Battery-C), the peak value was approximately
. The peak
results are summarized in
Figure 12d. The relationship exhibits an increasing trend with increasing charging rate. In conclusion, the quantitative ILIH characterization method demonstrates robustness across different battery cells and charging rates.
4.2. ILIH Value Trend Analysis
To provide a detailed analysis of the charging
-SOC curve trend, a specific curve is singled out in
Figure 13. By focusing on the 0.5C single CC–CV–CC cycle of Battery-A as an example, the
-SOC curve can be divided into six parts. For each part, a Relative Lithium Insertion Amount vs. Position graph is shown in
Figure 13 to illustrate the underlying mechanism. The Relative Lithium Insertion Amount (RLI) represents the relative insertion amount at each position along the thickness based on the assessment approach proposed in this study. It is important to note that the rectangular dashed frame in
Figure 13 represents the fully charged status in the real-world low-rate charging process, which is not equivalent to the theoretical fully inserted state of Li.
The six parts and the underlying mechanism are as follows:
①: Only anode particles near the separator start Li insertion, but because the fitting of NRI covers the entire anode, (or the fitted NRI slope) changes minimally.
②: Li inserts into particles evenly, resulting in a rapid change in towards a significant negative value within a narrow SOC range.
③: Anode particles near the separator reach the maximum insertion amount, whereas the insertion of particles near the current collector continues, causing to decrease.
④: In the CV charging process, continues to decrease.
⑤ and ⑥: In the CC discharging process, Li begins to take off from the separator side particle. So, decreases in the negative domain until it reaches zero, and then it continues to increase.
Based on the underlying mechanism, it becomes evident that enhancing anode materials and refining the manufacturing process through parameter optimization, such as microstructure and material system adjustments, may elevate the diffusion rate within the anode coating layer. These improvements hold the promise of mitigating ILIH during the reaction process and, consequently, improving the stability of fast-charging battery systems.
Although no literature strictly supports the mechanism of the demonstrated
-SOC trend, the mechanism proposed in this paper was inspired by Guo et al. [
38] and Krachkovskiy et al. [
32]. Nevertheless, the
trend and its underlying mechanism effectively support the interpretability of the ILIH assessment method.


