Abstract
A triple polarization (TP) model is proposed based on the second-order RC hysteresis equivalent circuit model, in order to more precisely reflect the dynamic and static characteristics of a LiFePO4 (LFP) battery, considering the long relaxation time and overshoot of its polarization voltage. The TP model introduces an RC link, whose time constant varies with changes in the battery operating status to represent the fast build-up and slow relaxation of the polarization voltage. Specifically, such an RC link evolves into an RLC parallel link during charging to reveal the overshoot characteristic. In this way, the external characteristics of LFP batteries, considering the complex phase transition process, are simulated by a simple equivalent circuit. Constant-current pulse tests are performed to verify the proposed model. For application, a state-of-charge (SOC) estimation is implemented on the basis of the TP model, with the use of a transformed cubature Kalman Filter (TCKF). The experimental results show that the TP model is able to represent the dynamic and static characteristics, as well as estimate the SOC of an LFP battery with a good accuracy.
1. Introduction
LiFePO4 batteries have been widely used in electric vehicles and energy storage power stations, due to their low cost, excellent cycling performance, good thermal stability, and environmental friendliness [1,2]. For lithium-ion batteries (LIBs), SOC is one of their most important parameters and is usually derived using model-based estimation algorithms. Owing to their easy calculation and analysis, equivalent circuit models (ECM) are employed in battery management system (BMS) simulations and applications [3].
However, the wide voltage plateau of an LFP battery makes it difficult to estimate the SOC with a high accuracy, which requires a more accurate battery model [4,5]. Moreover, compared with other types of LIBs, an LFP battery has a more pronounced hysteresis effect, relaxation effect, and memory effect, which are considered to be caused by the phase transitions of lithium iron phosphate cathode material [6]. In the past, these phase transitions were usually neglected when modelling LIBs, thus leading to simulation errors, especially for LFP batteries. Recently, scholars have introduced the concept of phase transitions to model LFP batteries based on the classical pseudo-two-dimensions (P2D) model, such as modeling the intercalation process with phase-field methods [7,8,9,10] and considering the non-homogeneous reactions [6,11,12,13]. These mechanistic models consist of many complex partial differential equations, which are difficult to apply in existing BMS systems. Thus, referring to a P2D model considering phase transitions, it is beneficial to introduce this concept into the traditional ECMs.
The hysteresis characteristics of the battery are characterized by non-overlapped OCV-SOC curves during its charging and discharging, caused by the fact that its equilibrium potential is dependent on its charge/discharge history [5,14]. It has been defined that the OCV-SOC characteristic curve obtained by a full charge and discharge cycle is the primary hysteresis loop, while the secondary hysteresis loops can be obtained by the partial charge and discharge of the battery. Secondary hysteresis loops are all inside the primary hysteresis loop and have a tendency to converge to the latter one [15]. To describe the hysteresis characteristics of LIBs, scholars have proposed several methods, such as introducing the Preisach model (which is widely used in magnetic applications) [16], adding a hysteresis factor [17], and using a one-state hysteresis module [18]. In this paper, the one-state hysteresis module proposed by Professor Plett [18] is used to describe the hysteresis voltage, and the second-order RC hysteresis model is the basic for the improved model.
For the relaxation effect, there are several phenomena associated with this, typically with widely varying time constants [19,20]. In [19], complex partial differential algebraic equations are used to simulate the related transients, including the “relaxation of the double-layer capacitance, local equalization of the state of charge, and reduction of concentration gradients in the solid insertion material and in the electrolyte”. In order to take the relaxation effect into consideration in a BMS, it is necessary to a develop simpler way of describing it. In [17], the relaxation effect is treated as the OCV recovery process and a recovery factor in the form of an exponential is introduced to model it. In [21], the diffusion process is considered as the main contributor to the relaxation effect and its time constant is taken as a linear function of the resting time. In [22], the polarization voltage is modeled by a cubic differential equation to represent the prolonged time-constant feature. Compared with the models mentioned above, the method proposed in this paper, which utilizes a variable time constant RC link to represent the relaxation effect, is simpler and the identification of the model parameters is easier.
The memory effect, first reported in LFP materials by Sasaki et al. [23] in 2013, has been neglected in LIBs for long time. Based on Sasaki’s study, some scholars have conducted further research on the memory effect. Jia Jianfeng indicated that the memory effect relies on the relaxation time, with a larger overshoot after a longer rest [24]. Guo Xiaolong explained that the memory effect is size-dependent, as the phase transition is related to the particle size [25]. Shi Wei found that the memory effect is also influenced by the external size of the battery [26]. However, few studies have modeled the polarization voltage overshoot, which is closely related to the memory effect. Although Sasaki has explained the memory effect in light of the many-particle model and non-uniform chemical potential of LFP along with the active population concept [6], this approach is difficult to apply in a BMS. In this paper, a simple RLC parallel circuit is used to simulate the polarization voltage overshoot.
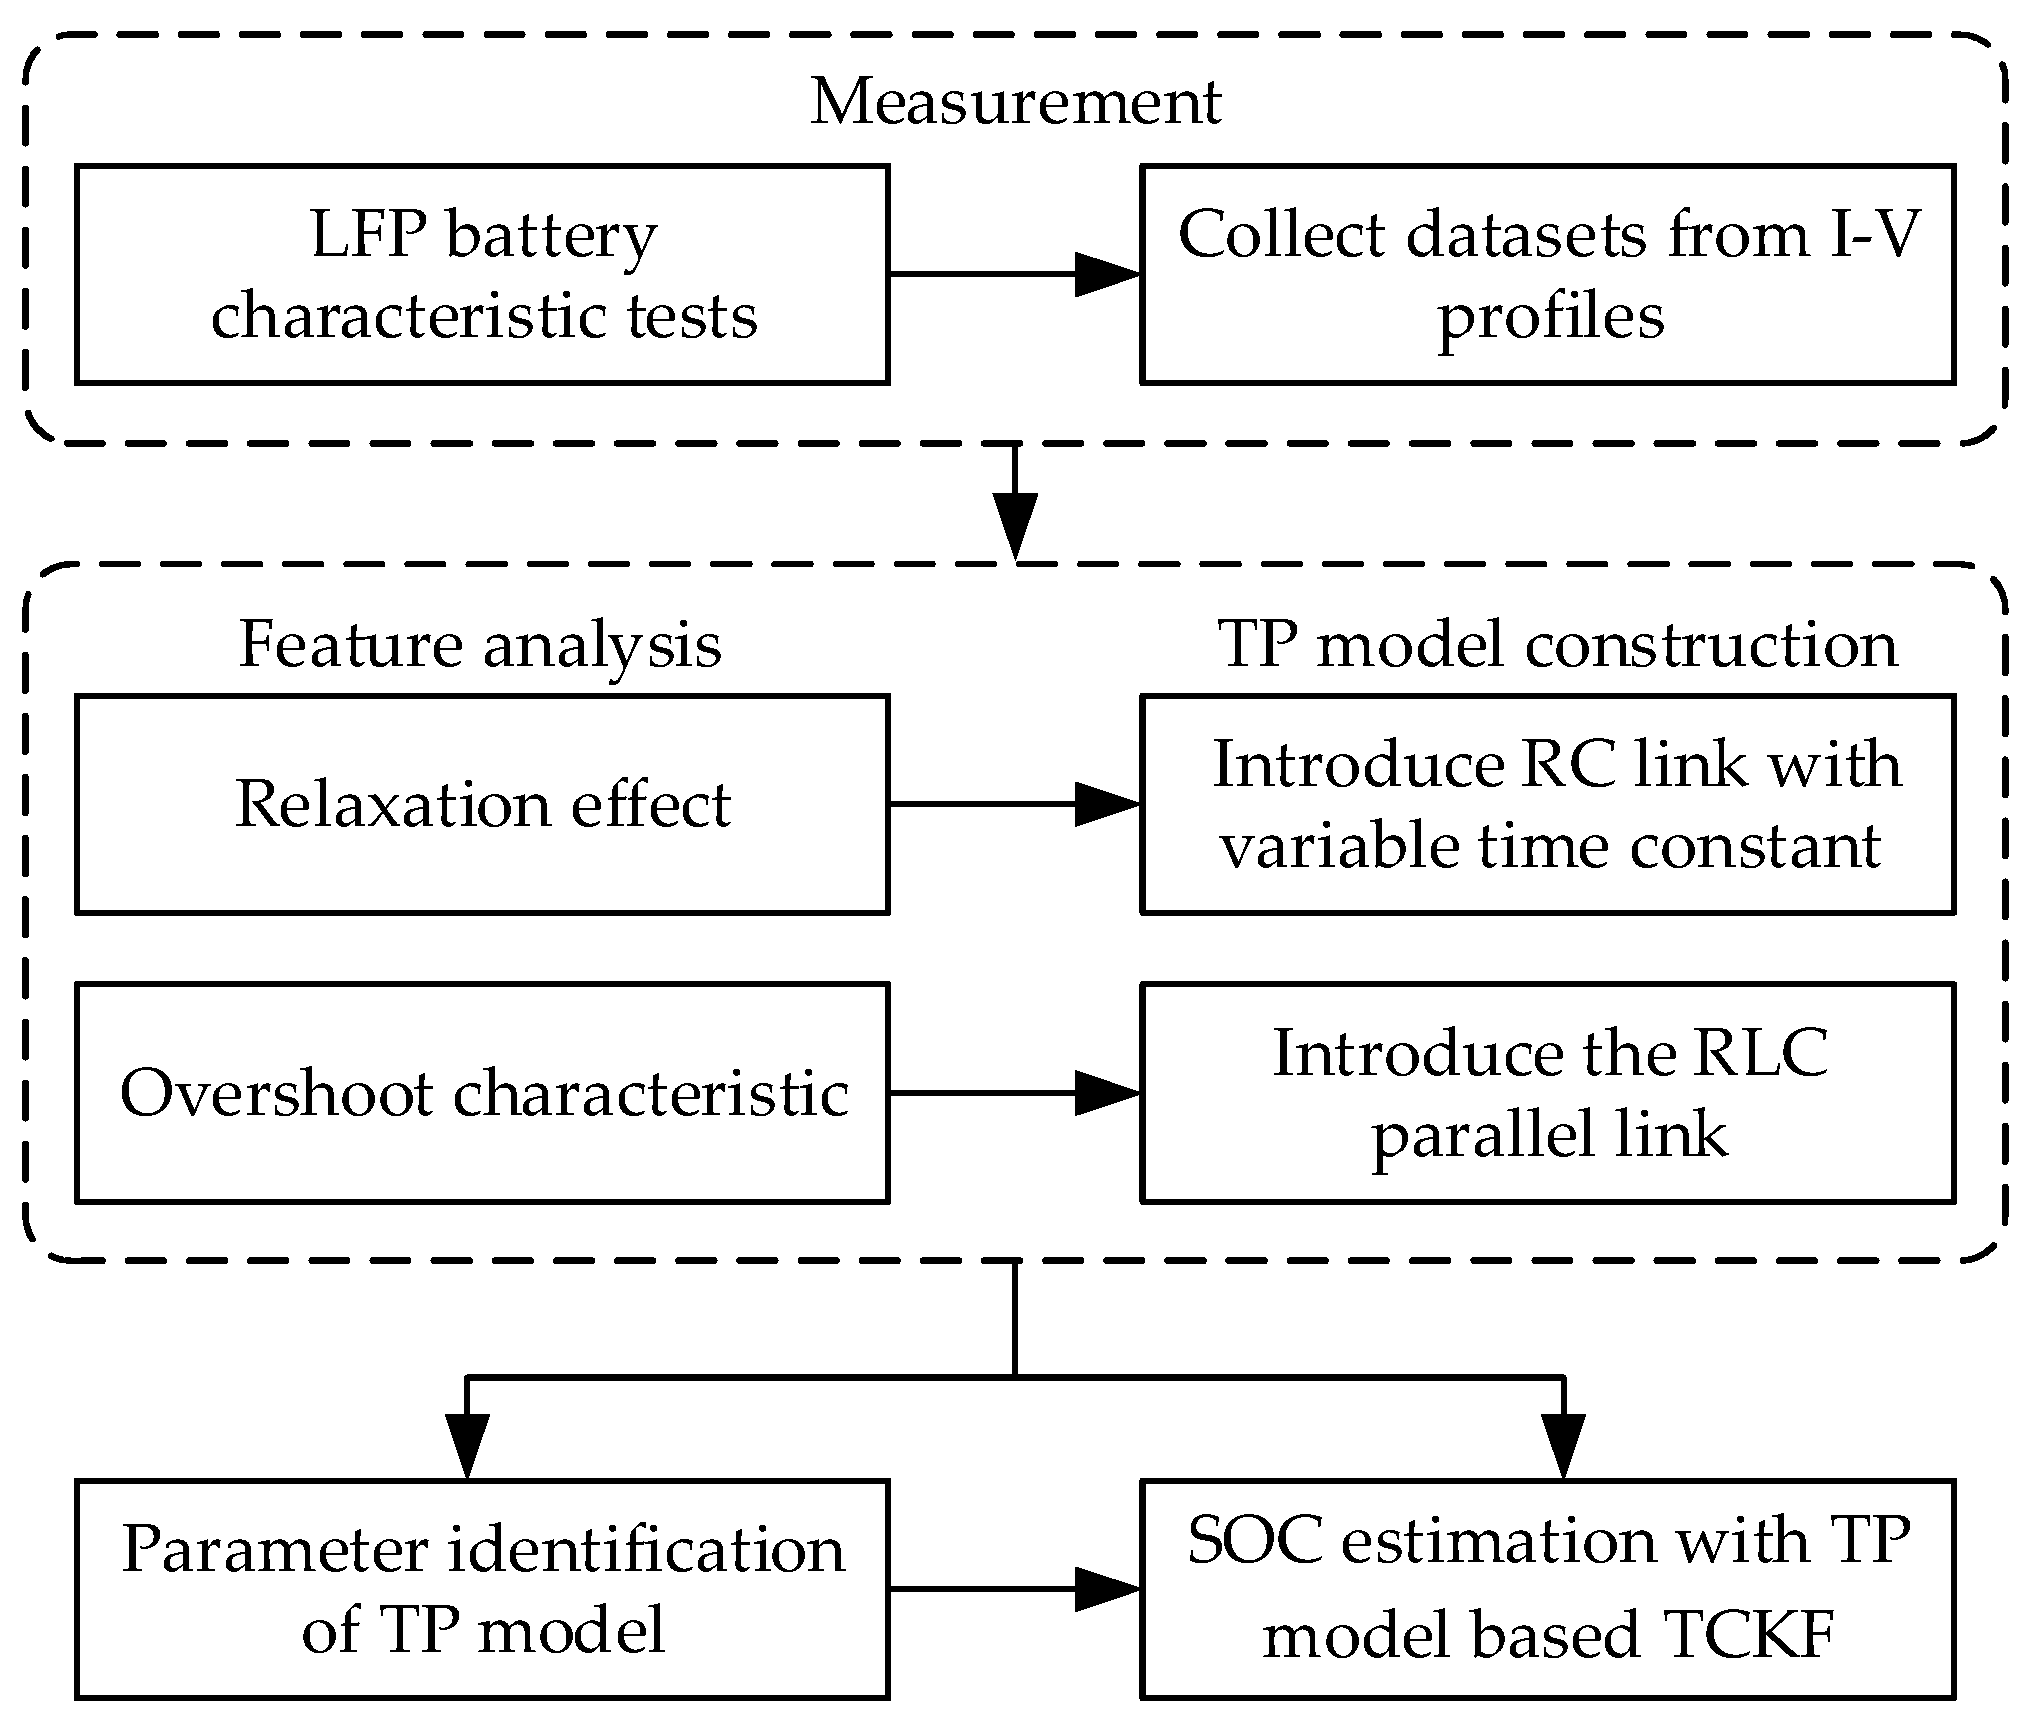
By taking the long relaxation time and overshoot of the polarization voltage of an LFP battery into account, an improved equivalent circuit model is proposed in this paper based on the second-order RC hysteresis model, i.e., the triple polarization model. The TP model reflects the fast build-up and slow relaxation of the polarization voltage by adding an RC link with a variable time constant, and it reflects the overshoot characteristic by replacing the RC link with an RLC parallel link during charging. In this way, the external characteristics of LFP batteries, considering the complex phase transition process, are simulated by a simple equivalent circuit. Compared with traditional ECMs, the TP model has a higher accuracy in voltage simulation and is able to decrease the estimation error in SOC estimation. This paper is organized as follows: Section 2 introduces the theory of the TP model, Section 3 introduces the parameter identification of the TP model, Section 4 introduces the TCKF algorithm to estimate the SOC, and Section 5 verifies the superiority of the proposed model and algorithm via experimentation. Figure 1 is the flowchart of the TP model construction.
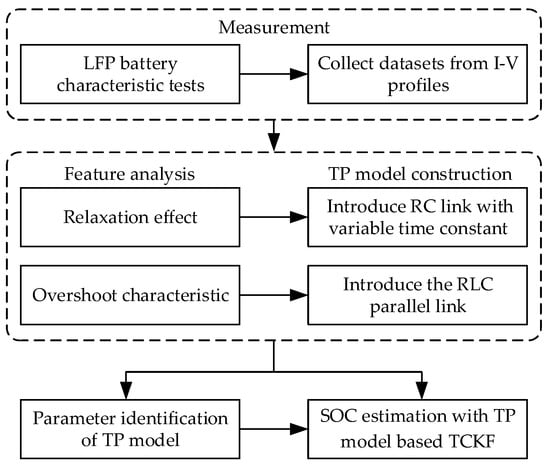
Figure 1.
Flowchart of the TP model construction.
2. Theory of the TPM of LFP Battery
2.1. The Relaxation Effect and the Addition of RC Link with Variable Time Constant
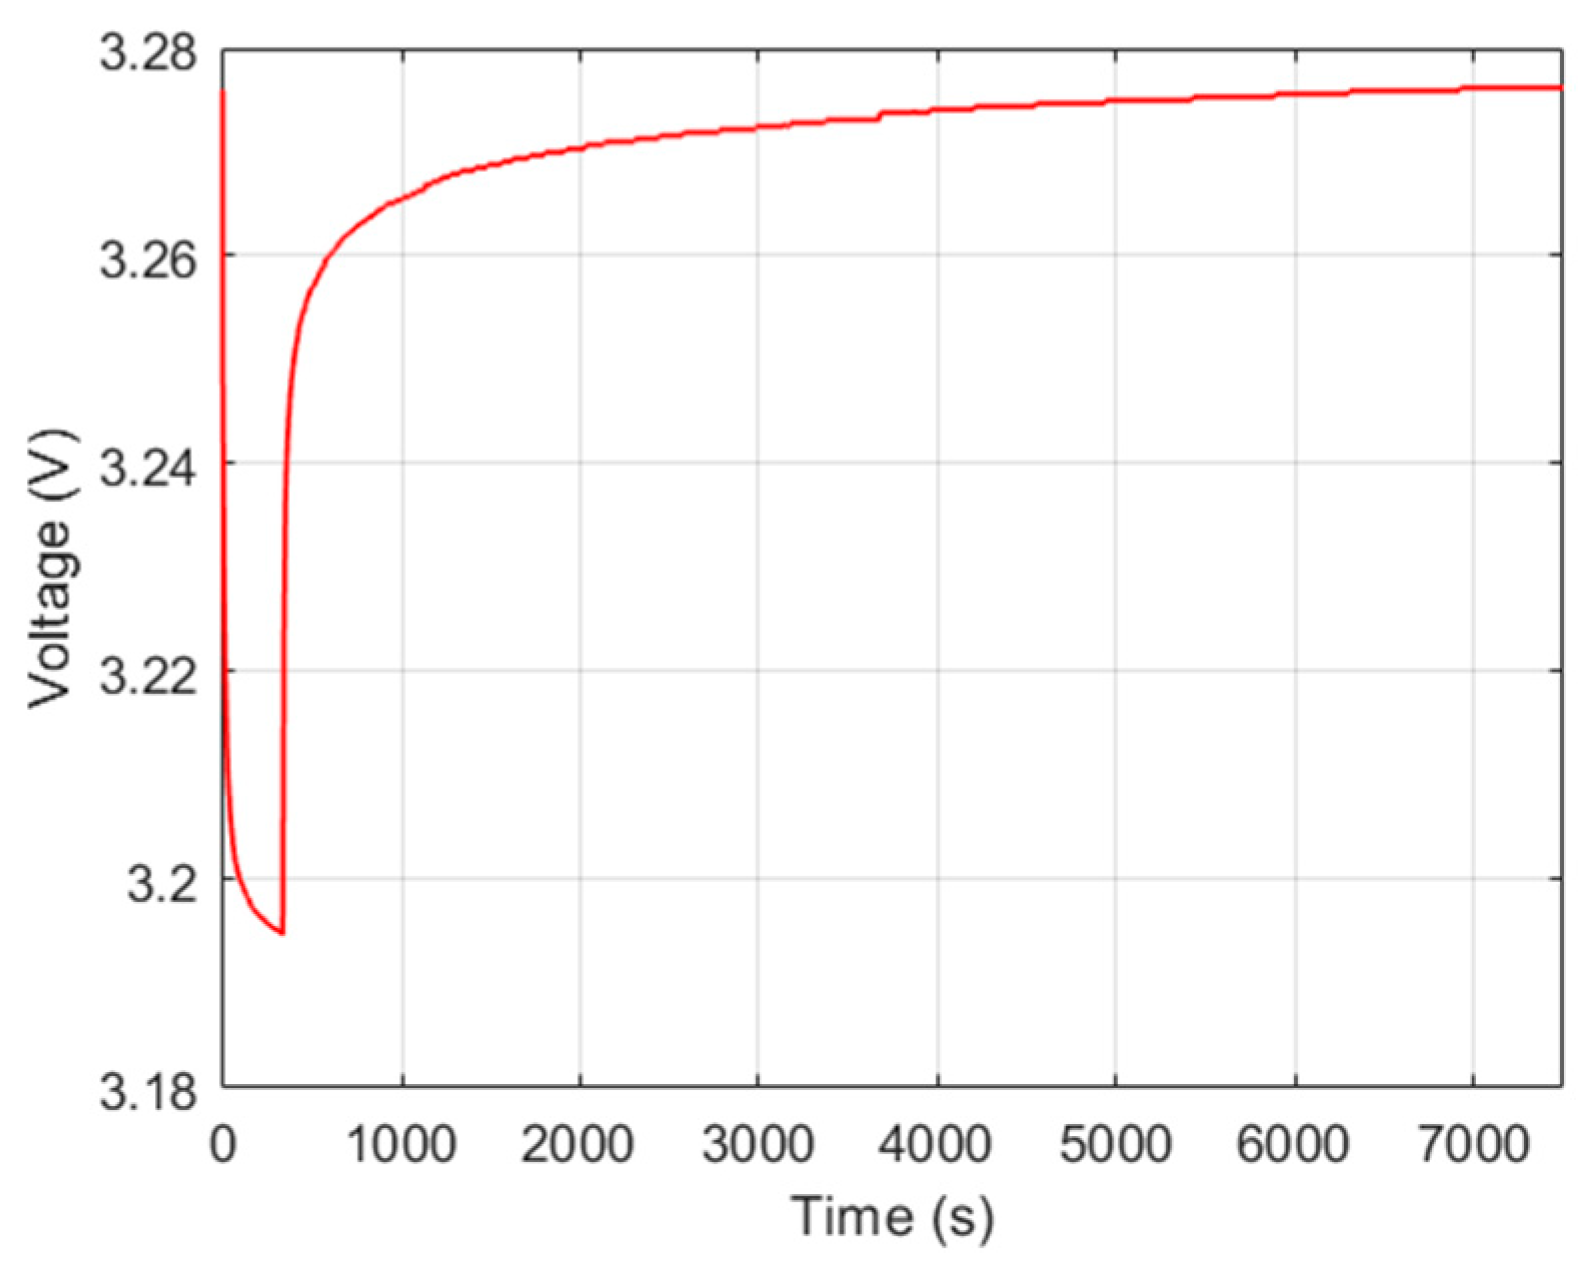
Polarization voltage relaxation is a process in which the terminal voltage slowly converges to the equilibrium voltage after charging or discharging. The relaxation time of an LFP battery is usually longer than 2 h. The possible reason for this is that, for lithium iron phosphate materials, particles in the two-phase region may exchange lithium ions during relaxation to reach an equilibrium two-phase system of Li-rich and Li-poor stripes, which takes a long time [6,27]. Figure 2 shows the voltage curve of a 120 Ah LFP battery discharging for a 5% capacity with a 0.5 C constant current and then rested for 2 h under open-circuit conditions. As Figure 2 shows, the OCV does not reach a steady state, even after resting for 1h. This indicates that there is a large time constant component at resting, while, during the build-up process of the polarization voltage, the corresponding time constant component is small.
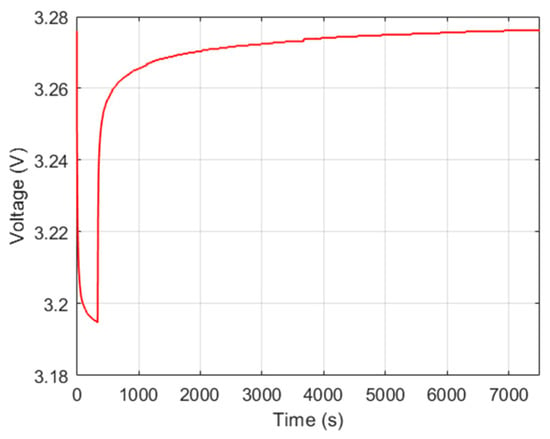
Figure 2.
Battery terminal voltage curve during resting after discharging.
The step response of the polarization voltage of the second-order RC model is exponentially varying, which contains two time-constant components. From Figure 2, it is clear that the time constants corresponding to the charging and discharging processes are not exactly equal to the ones corresponding to the resting process. However, in the original second-order RC model, they are assumed to be equal, which introduces a modeling error. For batteries with a long relaxation time, especially LFP batteries, it is necessary to improve the second-order RC model.
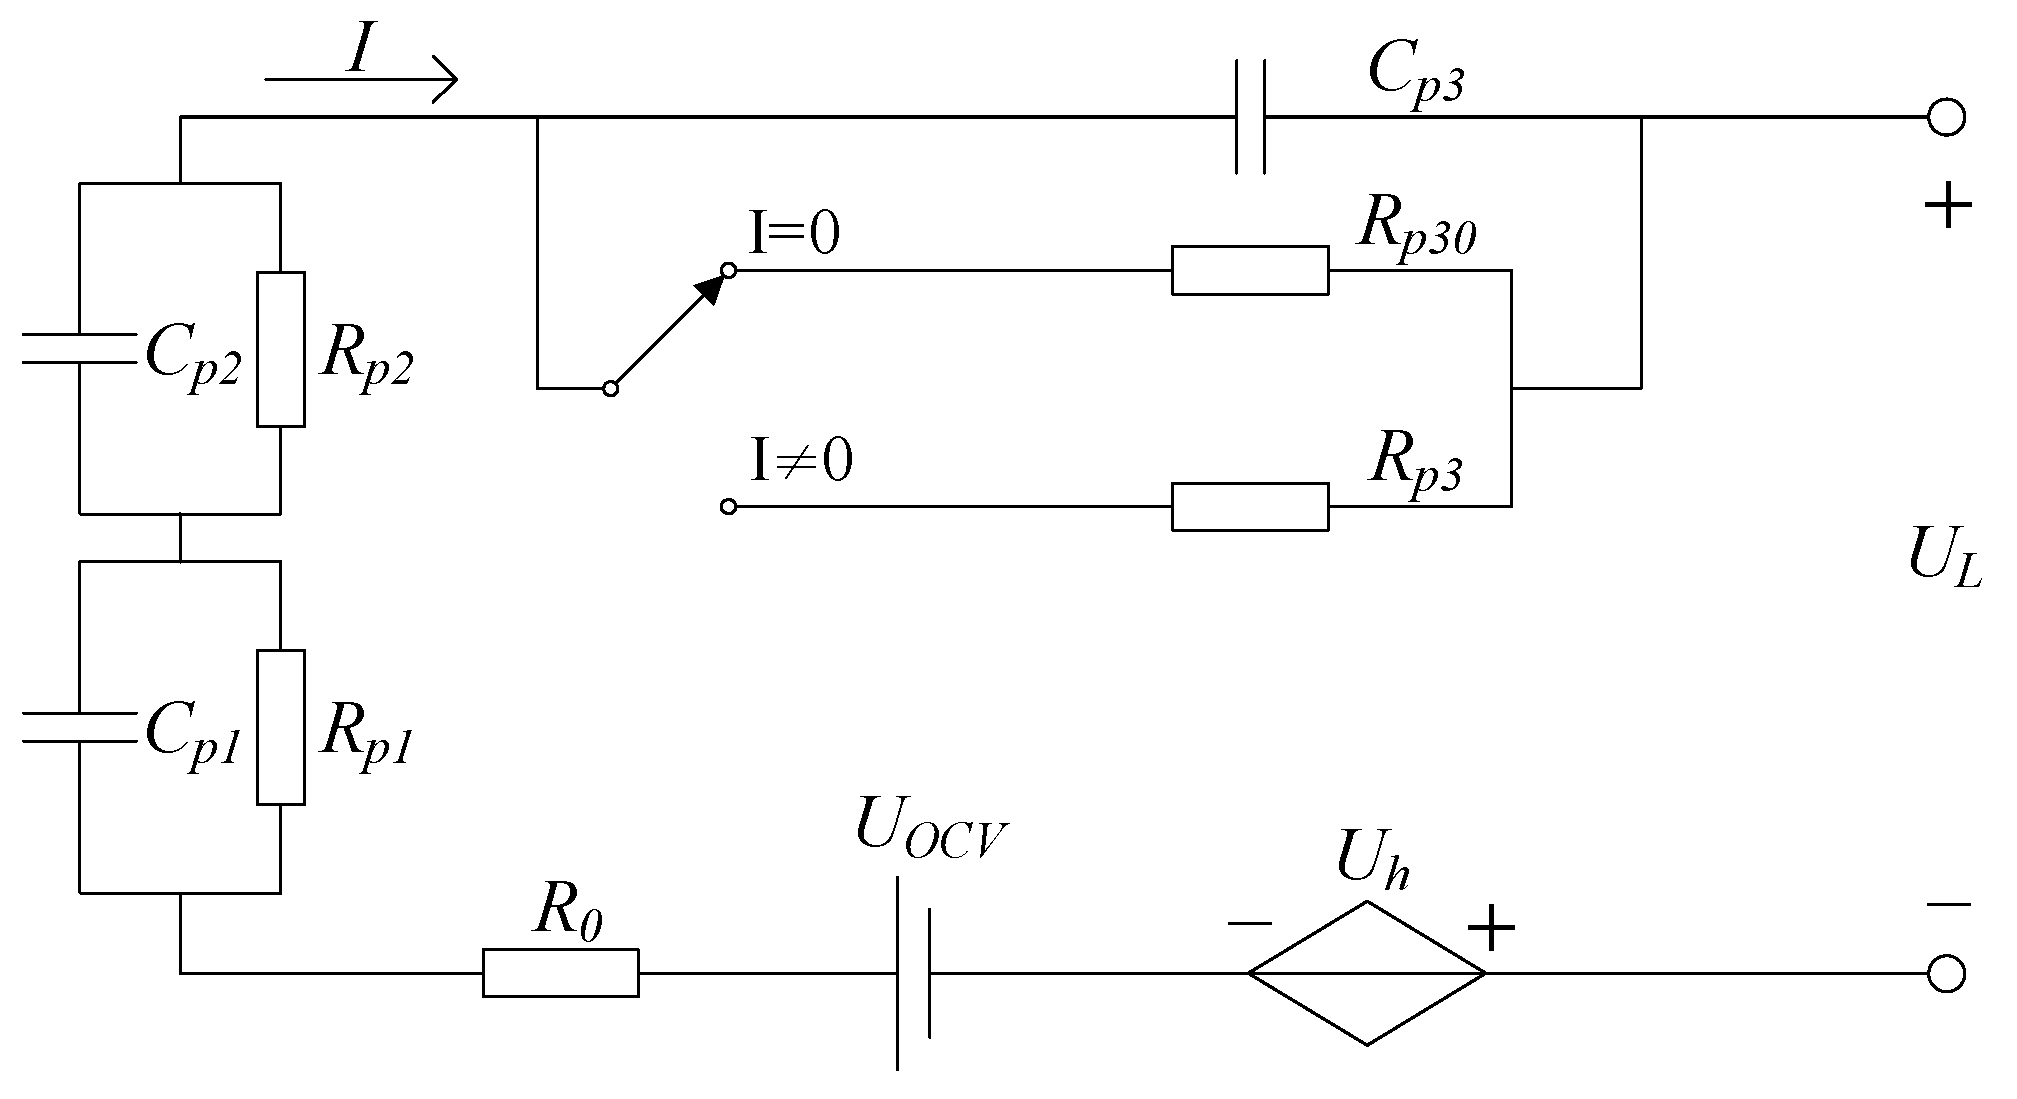
In order to reflect the fast build-up and slow relaxation of partial polarization voltage, this paper introduces an RC link whose time constant varies with changes in the battery operating status on the basis of the second-order RC hysteresis model. Figure 3 shows the modified ECM with the addition of a variable time constant RC link, which changes the time constant by switching between the resistors and .
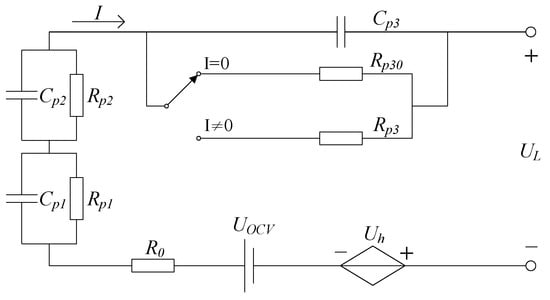
Figure 3.
TP model with the time-constant-variable RC link.
The second-order RC hysteresis model, with the addition of a variable-time-constant RC link, is described by the following equations:
where is the average value of the open circuit voltage during the charging and discharging of the battery, is the current (positive for discharge), denotes the hysteresis voltage, is the decay factor, is the maximum hysteresis voltage corresponding to the SOC, denotes the voltage of the variable-time-constant RC link, is the polarization capacitance, is the polarization internal resistance when the value of is not zero, and is the polarization internal resistance when the value of is zero, apparently .
2.2. The Overshoot Characteristic and the Addition of RLC Parallel Link
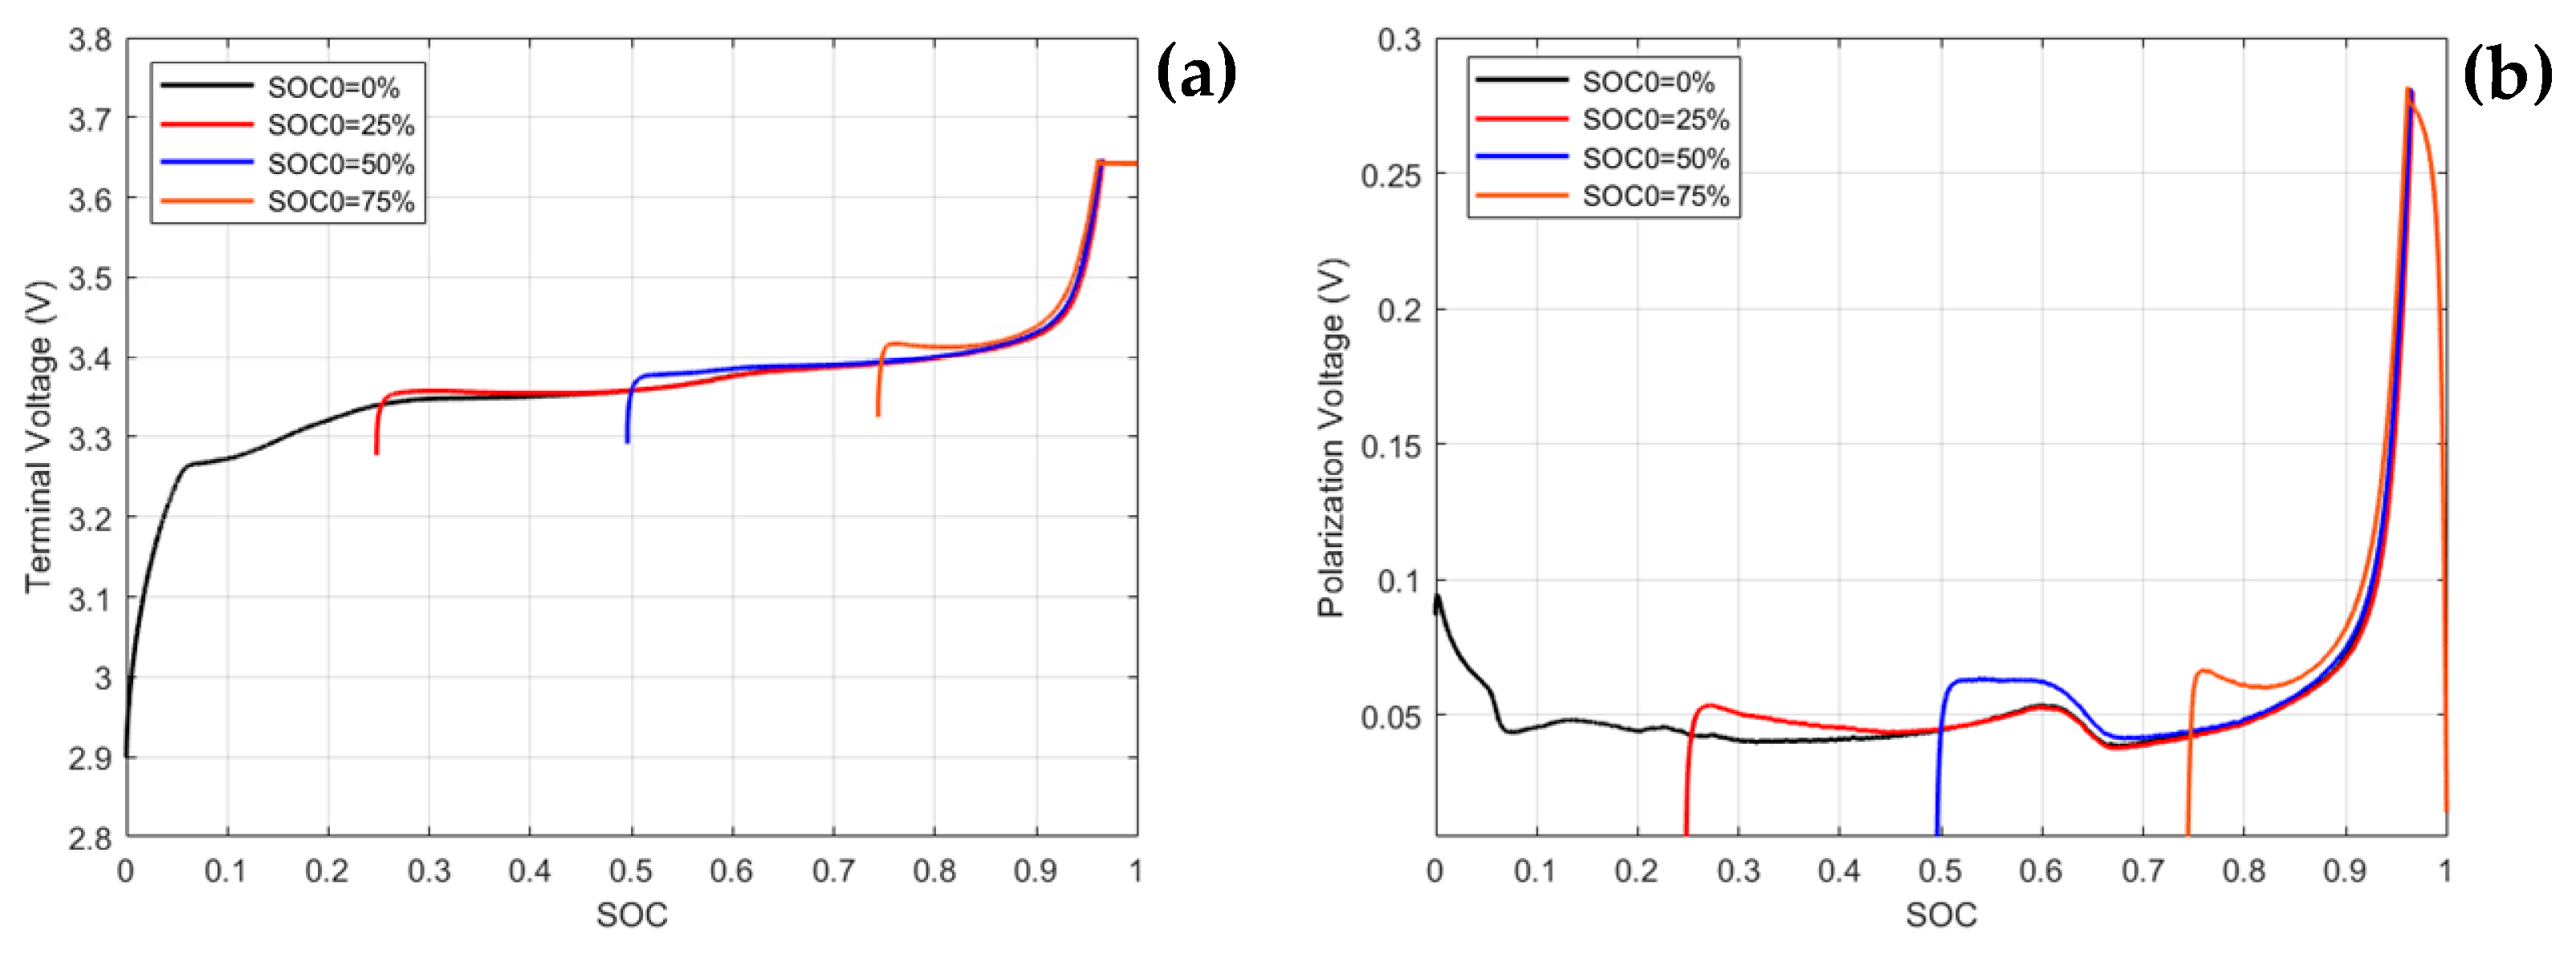
Figure 4 shows the comparison of the polarization voltage variation for different initial SOCs in the step charging of a 120 Ah LFP battery. The polarization voltage in Figure 4b is obtained by subtracting the corresponding open circuit voltage from the terminal voltage. The charging currents are set to 0.5 C and the battery is rested for 3 h under open-circuit conditions before charging. This experimental procedure refers to [28]. From Figure 4, the following two phenomena can be observed: (1) the polarization voltage curves of the different initial SOCs almost overlap after reaching a steady state, indicating that the polarization voltage steady state values are the same with different initial SOCs; and (2) the excess portions of the polarization voltage with SOCs of 25%, 50%, and 75% beyond the value with an SOC of 0% are different, indicating that the dynamic overshoot values are different with different initial SOCs.
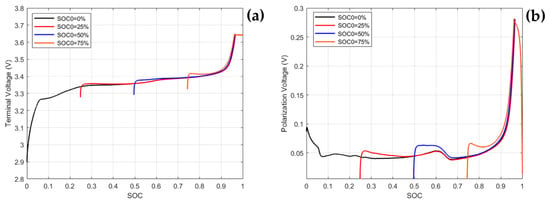
Figure 4.
Polarization characteristics of charging at different initial SOC. (a) Comparison of terminal voltage curves and (b) comparison of polarization voltage curves.
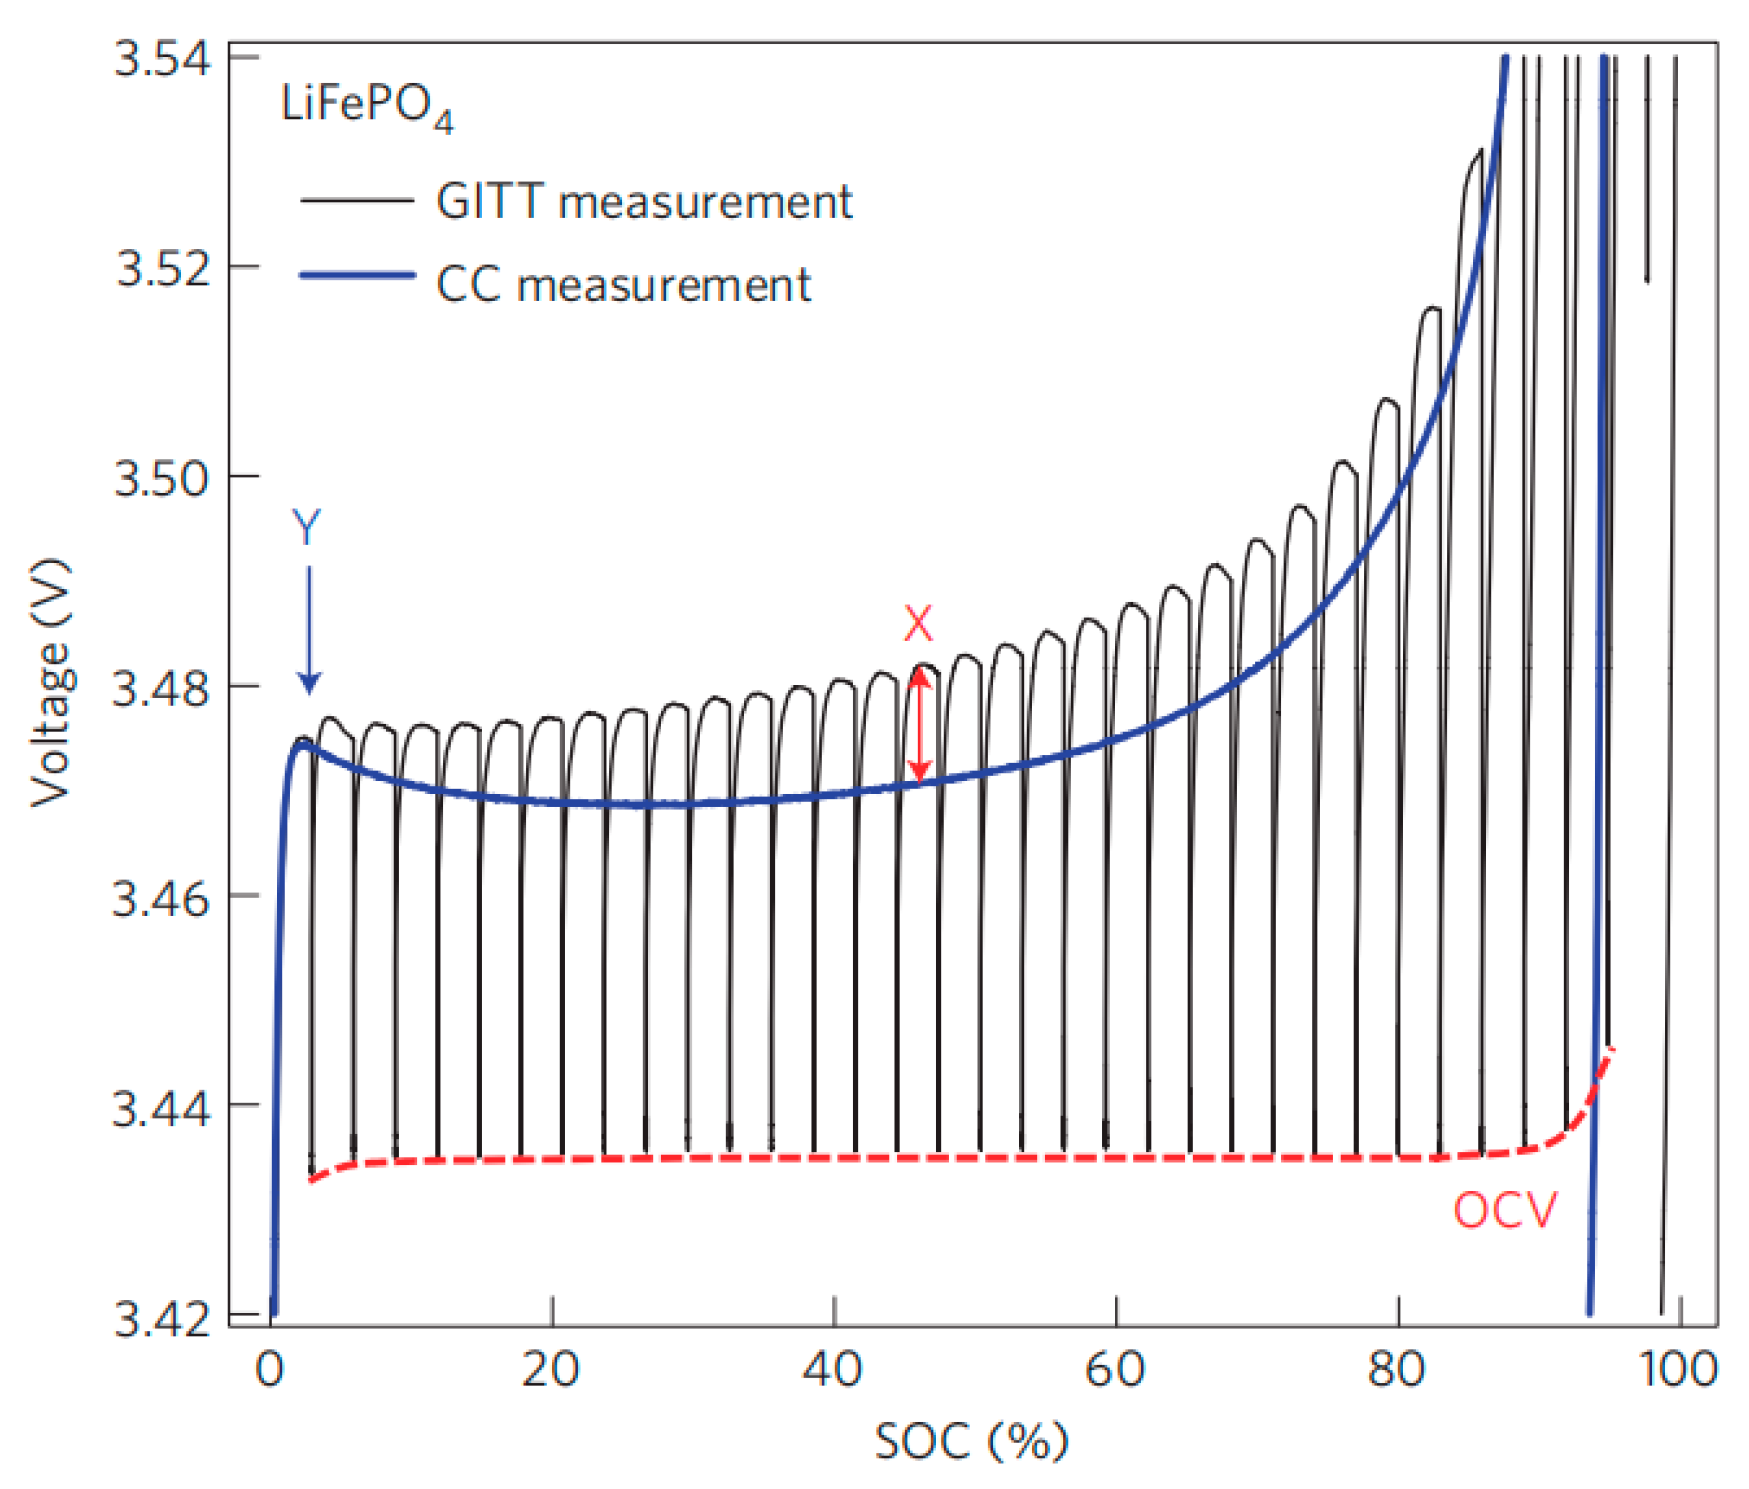
It is found that an exceptional polarization overshooting is also observed in the GITT tests, as is shown in Figure 5 [23]. Sasaki et al. [23] thought that the marked Y in Figure 5, standing for the initial overshoot, should be caused by a kinetics effect, while the marked X, standing for the overshooting after relaxation, can be explained by a many-particle model and the non-uniform chemical potential of LFP.
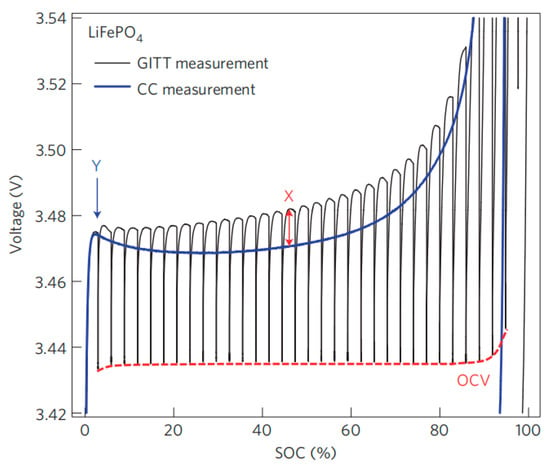
Figure 5.
GITT and constant-current measurements of LFP [23]. Copyright 2013, Springer Nature.
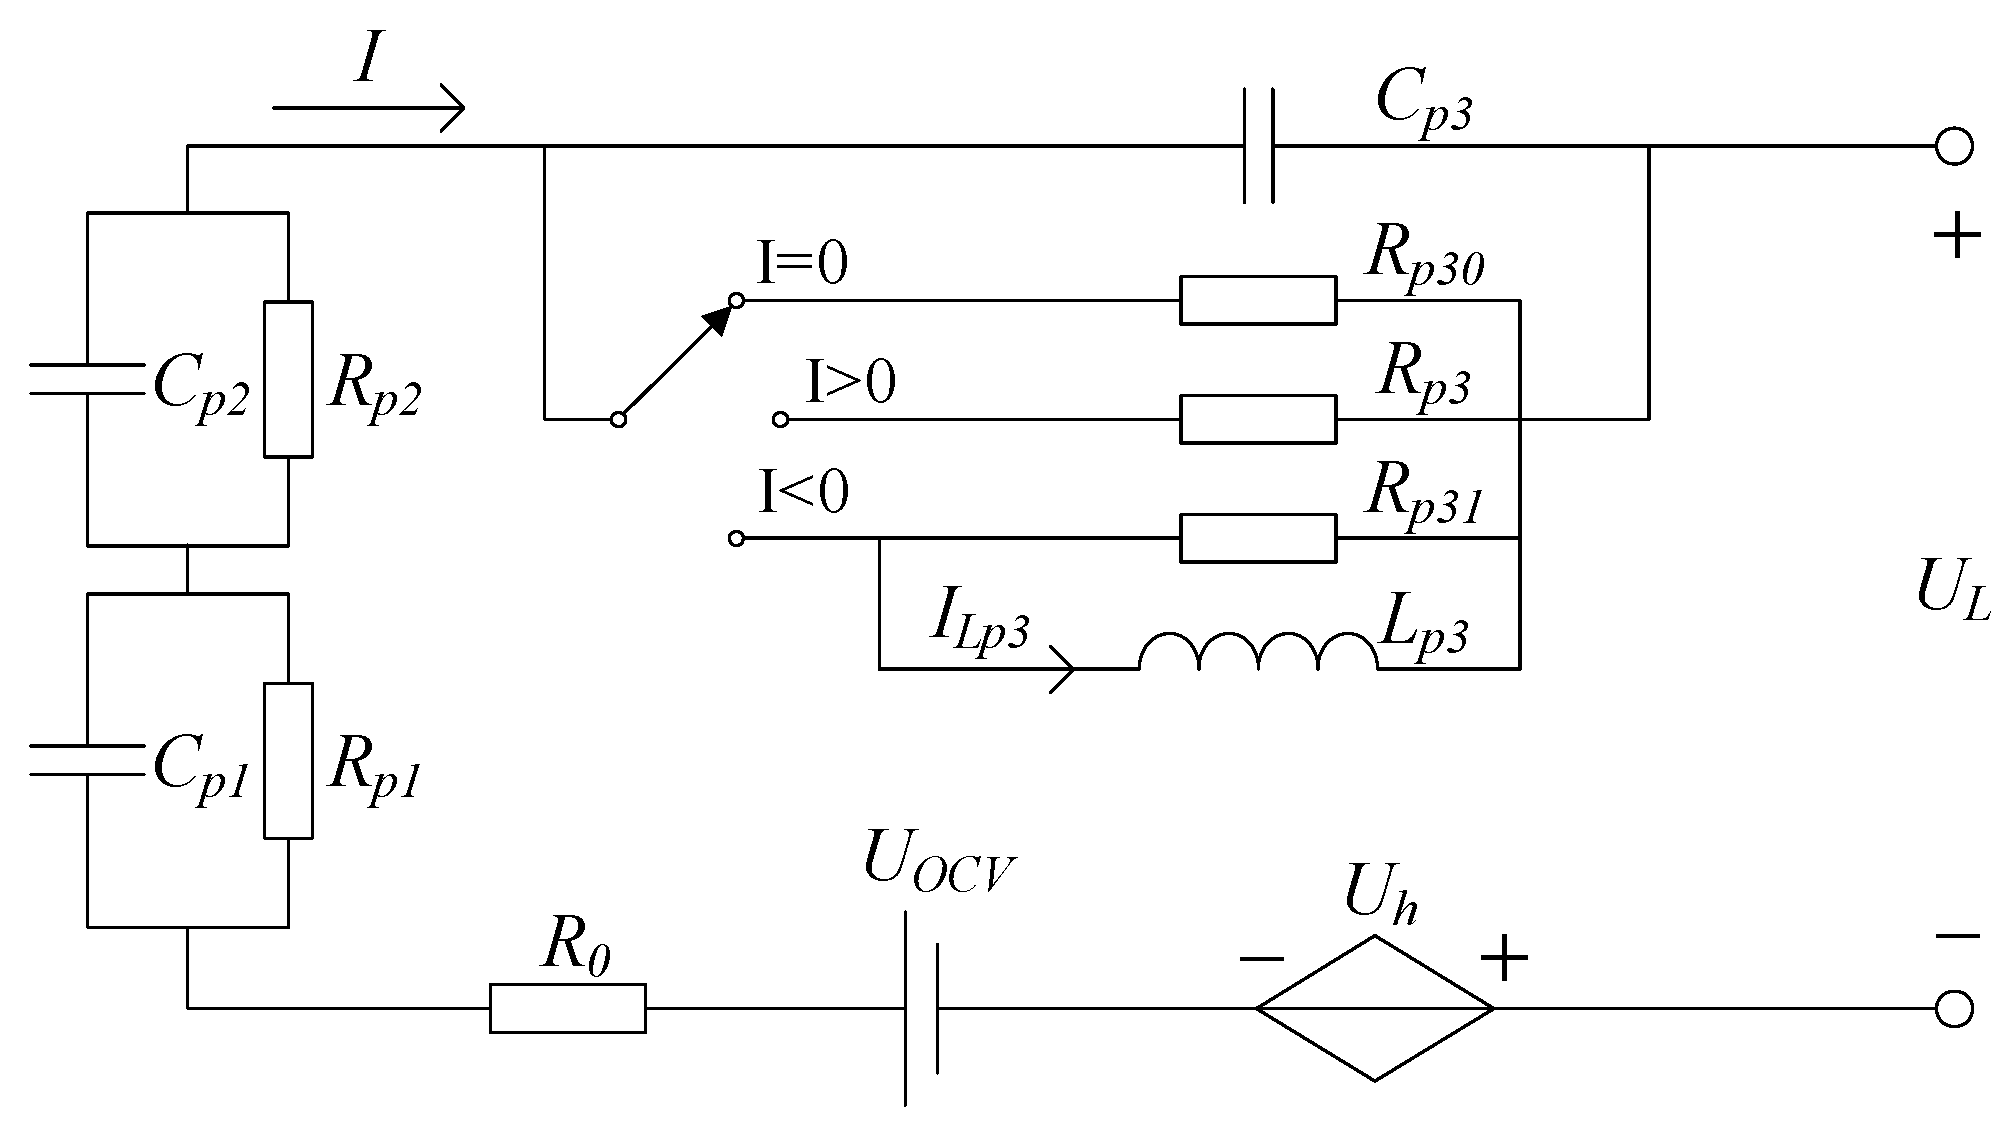
The traditional second-order RC model cannot reflect the overshoot characteristics of the polarization voltage of an LFP battery, so the polarization part of the model needs to be improved. In this paper, the above proposed variable-time-constant RC link is replaced by an RLC parallel link during the battery charging to reflect the polarization voltage overshoot phenomenon.
Figure 6 shows the modified ECM with the added RLC link. The conversion from the RC link to the RLC link is achieved by switching from the polarization resistor branch to the RL parallel branch. Since the capacitor is unchanged, the voltage change on the capacitor is continuous, but the throw-in involving the inductor makes it non-derivable for the capacitor voltage curve and inductor current curve at the moment of switching. Thus, it is necessary to reset the value of the inductor current at switchover.
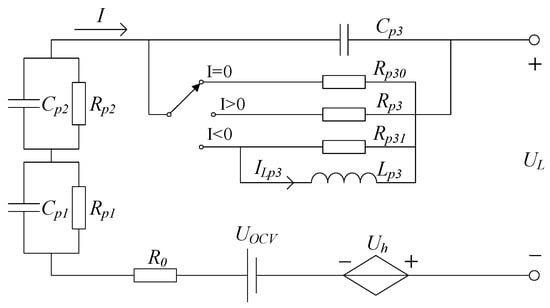
Figure 6.
TP model with the RLC parallel link.
For the RLC parallel circuit, according to the KCL and KVL, we can obtain:
where is the capacitance voltage of the RLC parallel link, is the inductor branch current, and is the total current.
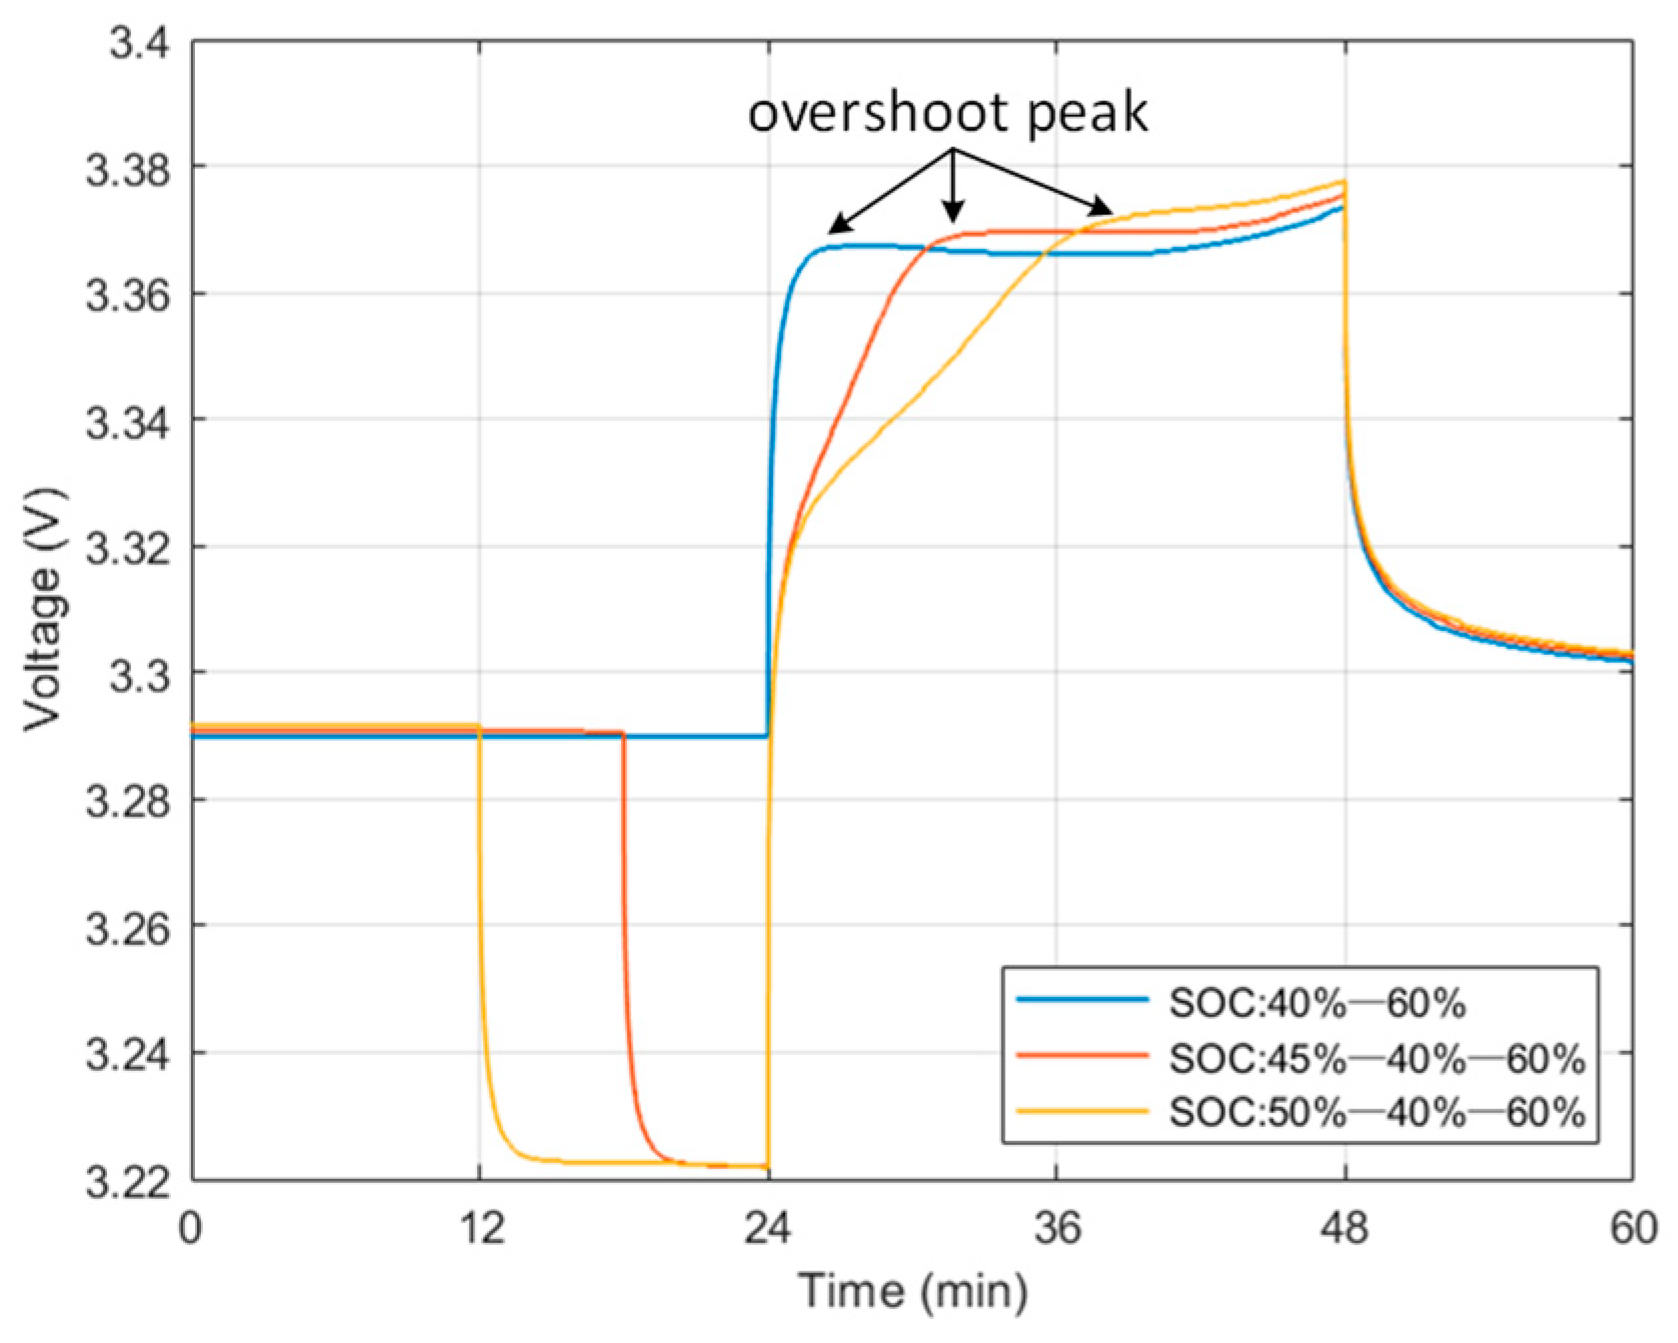
Figure 7 shows the comparison of the terminal voltages of one LFP battery charging/discharging using three different strategies. For the first test, the initial SOC is 40% after a 3 h rest, charging the cell to a 60% SOC directly; for the second test, the initial SOC is 45% after a 3 h rest, discharging the cell to a 40% SOC, and then charging the cell to a 60% SOC without rest; and for the third test, the initial SOC is 50% after a 3 h rest, discharging the cell to a 40% SOC, and then charging the cell to a 60% SOC without rest. Both the charging and discharge rate are 0.5 C. As can be seen from the figure, charging the battery immediately after discharging will delay the overshoot peak of the polarization voltage, and the delay time is about the time required to make up the discharged capacity. In addition, the voltage profile in the delayed stage is approximated by a straight line with a constant slope, which does not conform to the exponential trend. Neither the second-order RC model nor TP model could reflect this trend well.
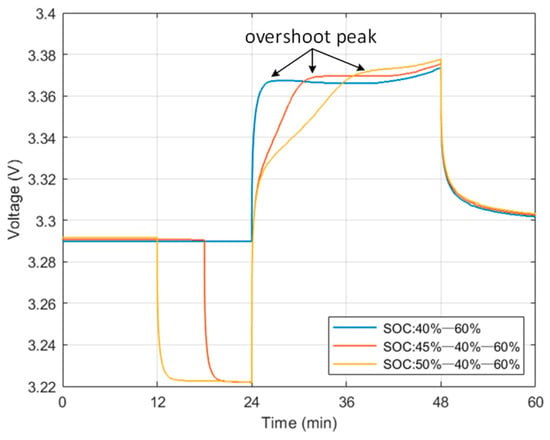
Figure 7.
Comparison of terminal voltage curves under different discharge–charge conversion cases.
In this paper, the initial current of the inductor is adjusted to reduce the voltage change rate of the RLC link to reduce the error to a certain extent. The initial value of the inductor current during the charging in this paper is obtained from Equation (3).
where is the inductor current regulation coefficient at the starting moment of the charging, is the terminal voltage of the additional polarization link, and since the steady-state value of at discharge is about one half of the overshoot peak value at charging, is taken as two in this paper.
In summary, the triple polarization model proposed in this paper is based on the second-order RC hysteresis ECM with the addition of a variable-time-constant RC link, which will be substituted by an RLC parallel link during charging. The TP model is modeled as follows.
where indicates the terminal voltage of the additional polarization link and indicates the current of the inductor branch.
The part representing the second-order RC hysteresis model is discretized by the zero-order hold method and the additional polarization link is discretized using the Euler method. The discretization state equation of the TP model is
where and .
3. Parameter Identification of TP Model
3.1. Offline Parameter Identification of Variable Time Constant RC Link
A normal HPPC (Hybrid Pulse Power Characteristic) test will cause the OCV of an LFP battery to deviate from the main hysteresis loop when a reverse pulse is applied, and the deviation value is difficult to determine. To solve this problem, this paper proposes a modified HPPC test for off-line parameter identification, whose current direction is unchanged to maintain the OCV on the main hysteresis loop. The specific steps of the modified HPPC test conducted in this paper are as follows.
Step 1—conduct the test in a constant temperature chamber and set the specified temperature. Charge the battery to full charge at a specified rate using the CCCV mode and then rest for 3 h under open-circuit conditions.
Step 2—discharge the battery at the specified rate using the CC mode for 90 s and then rest for 300 s.
Step 3—discharge the battery at the specified rate using the CC mode until the SOC value of the battery drops by 5%, and then rest for 3 h.
Step 4—repeat Step 2 and Step 3 until the SOC value of the battery drops to 0%.
Step 5—charge the battery at the specified rate using the CC mode for 90 s and then rest for 300 s.
Step 6—charge the battery at the specified rate using the CC mode until the SOC value of the battery rises by 5%, and then rest for 3 h.
Step 7—repeat Step 5 and Step 6 until the SOC value of the battery rises to 95%.
Step 8—charge the battery at the specified rate using the CC mode for 90 s and then rest for 300 s.
Step 9—charge the battery to full charge at the specified rate using the CCCV mode.
In this paper, we tested a 120 Ah LFP battery, whose dynamic overshoot peak of polarization voltage occurs before 90 s during charging. In order to identify the parameters of the RLC parallel link, the pulse phase data need to include the overshoot peak, so the pulse time is set at 90 s, and when testing different types of LFP batteries, this needs to be adjusted accordingly.
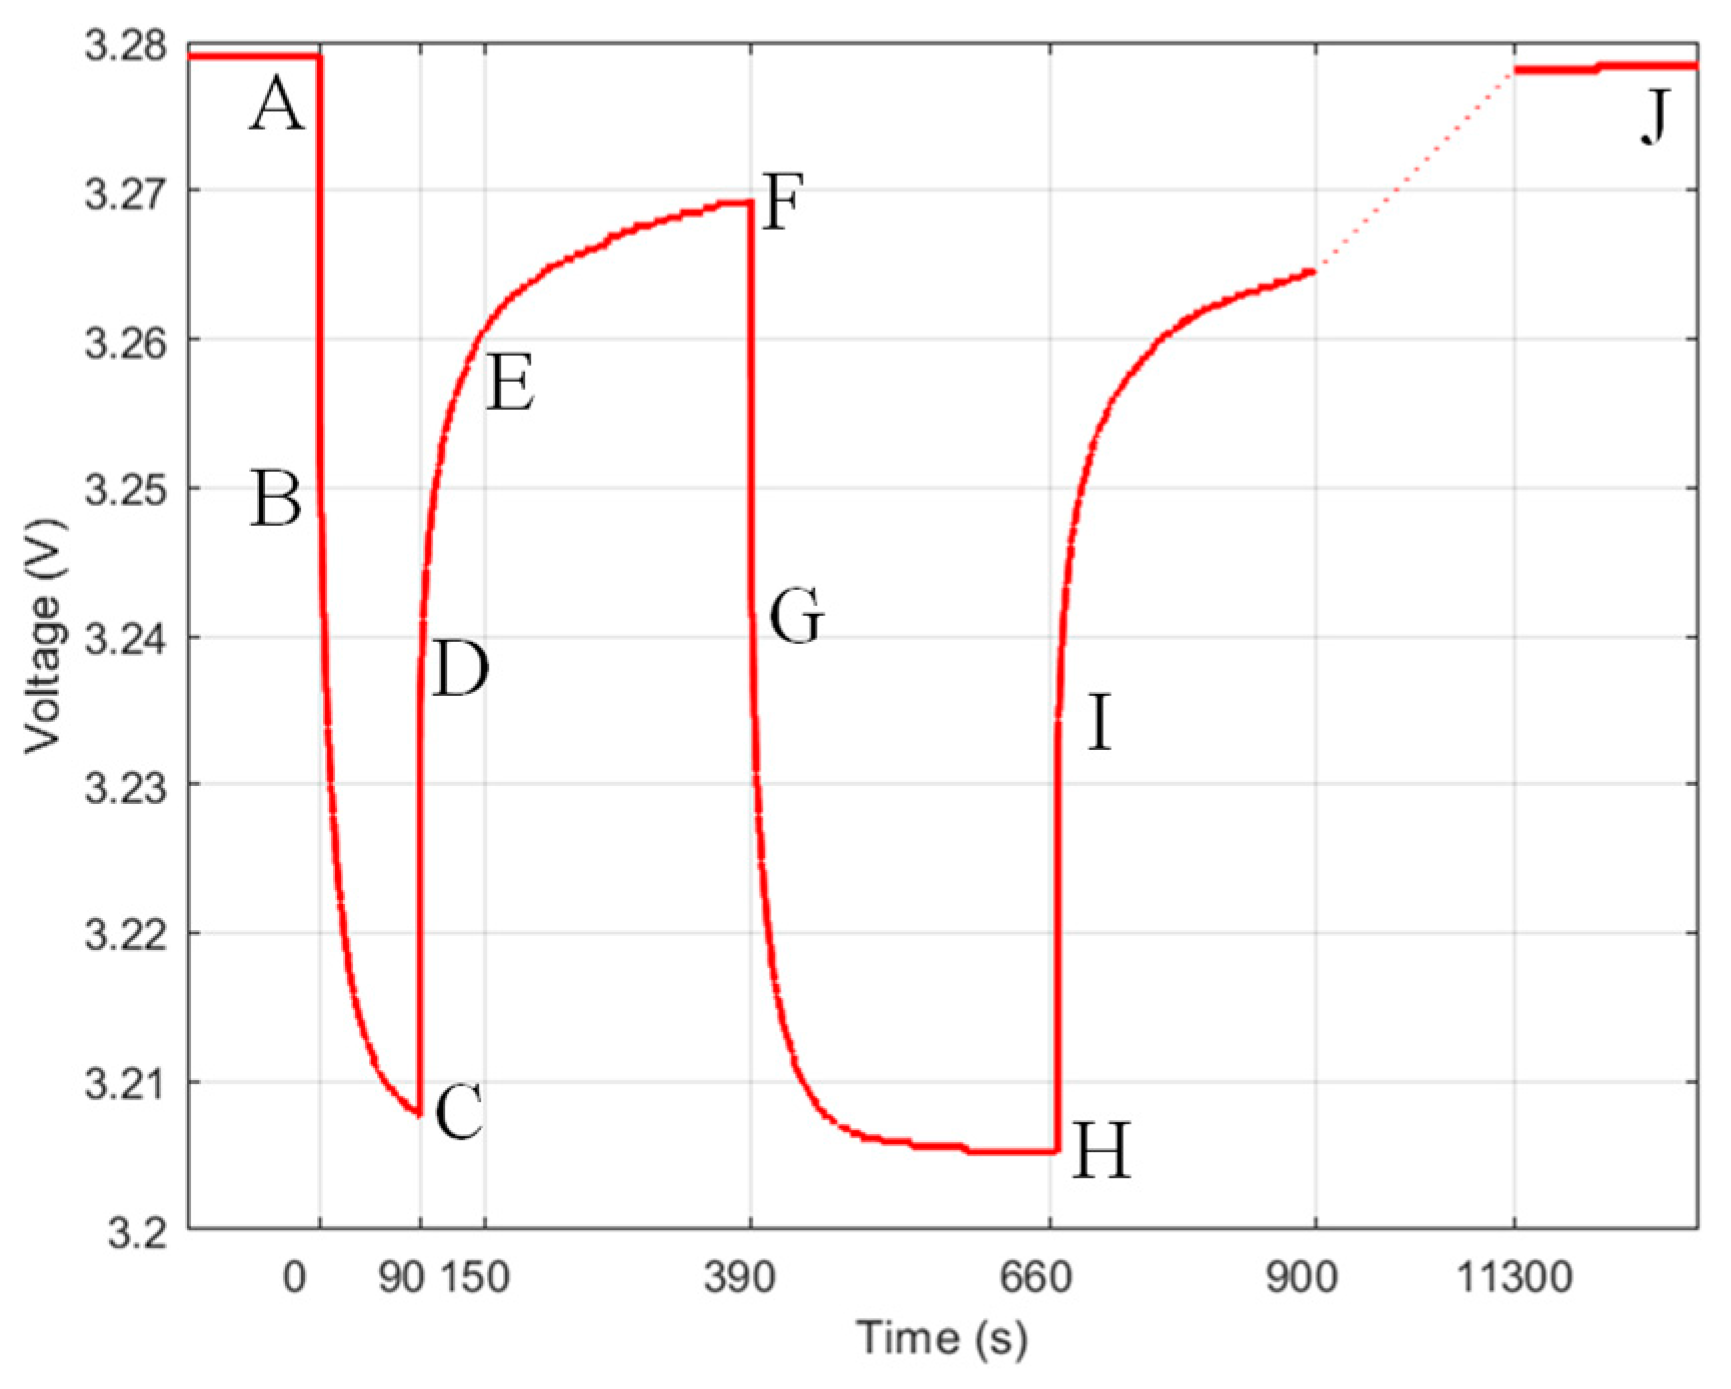
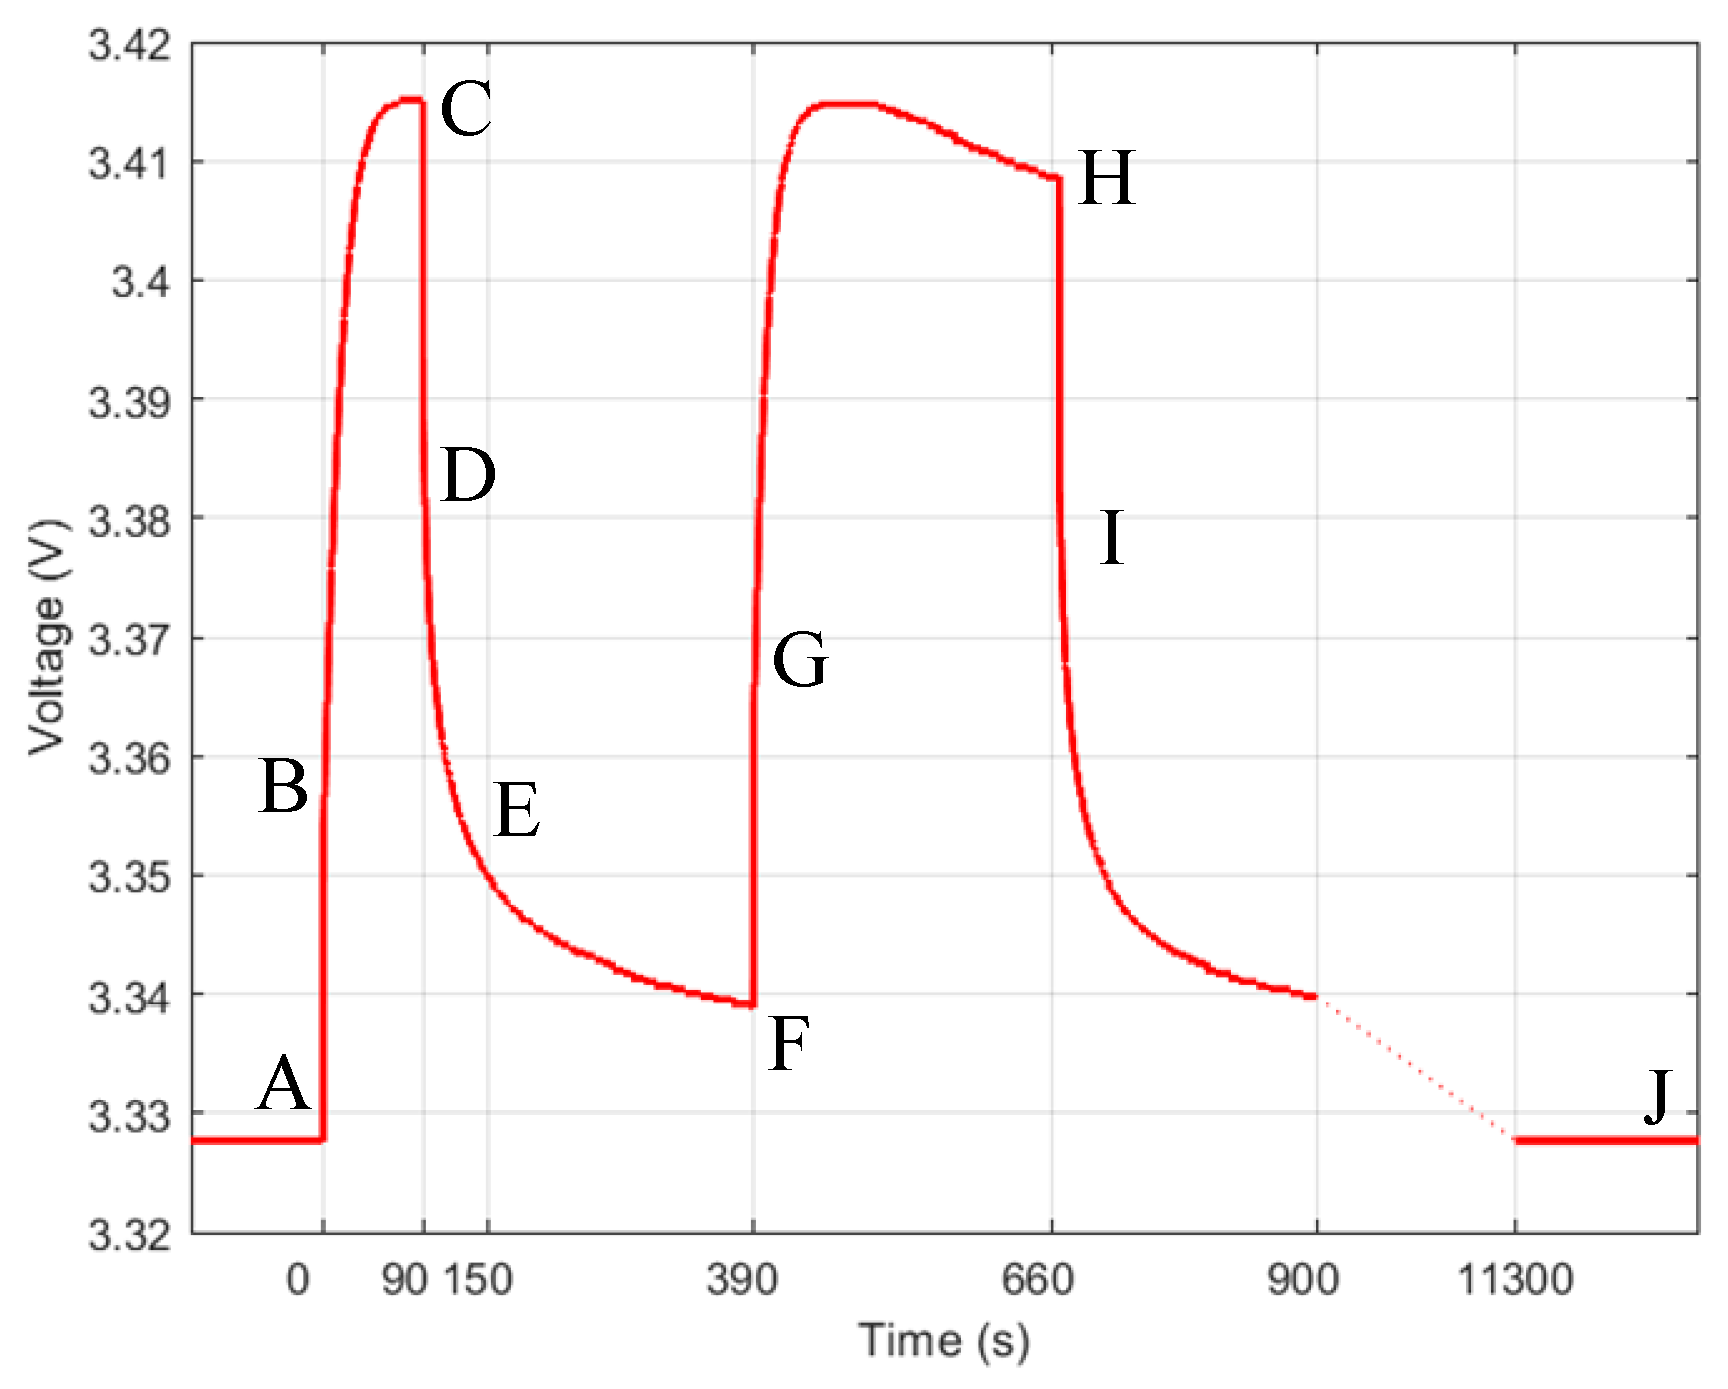
Figure 8 shows the battery terminal voltage variation curve for one cycle of the discharge phase of the modified HPPC test, where points A–J are the transition points for each work step (except for point E, which is the data point 1 min after point D). Taking the discharge stage as an example, the specific method for the offline parameter identification of the improved second-order RC model with the addition of a variable-time-constant RC links is as follows.
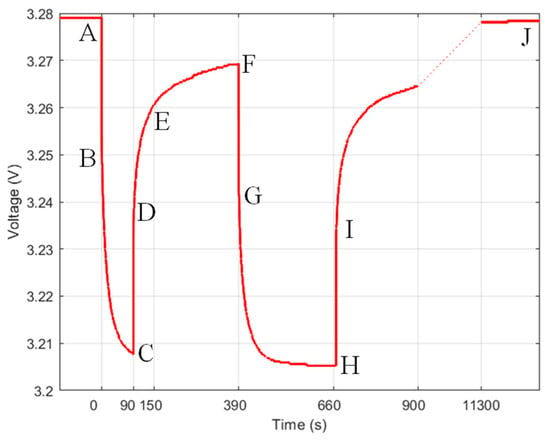
Figure 8.
One cycle of the voltage curve of modified HPPC test in discharging stage.
Step 1. The instantaneous change voltages at the discharge start moment and rest start moment can be regarded as the ohmic polarization voltage; thus, the ohmic internal resistance R0 can be derived from Equation (6).
Step 2. The data from the resting stage of 1 min after the pulse discharge (D–E) can be regarded as a zero input response. Thus, we can use a triple exponential fit by Equation (7) to obtain the polarization voltages (, , and ) and the corresponding time constants (, , and ). Considering that the relaxation time of an LFP battery is longer than 2 h, the lower limit of the time constant of the additional RC link is set to 1000 s, i.e., s.
Step 3. The battery rests for 3 h before the pulse discharge, so the pulse discharge phase (A–C) can be treated as a zero-state step response. Thus, , , and can be derived from Equations (8) and (9).
Step 4. On the basis of the third step, the data of the pulse discharge phase (A–C) are still used, and the time constant and corresponding polarization internal resistance during the discharge of the variable-time-constant RC link are obtained from Equation (10) using a single exponential fit; then, the polarization capacitance .
Step 5. Assuming that the of the discharge phase and resting phase are the same, then .
3.2. Offline Parameter Identification of RLC Parallel Link
The offline parameter identification of the RLC parallel link also takes the modified HPPC test with a single current direction. Figure 9 shows the battery terminal voltage variation curve for one cycle of the charge phase of the modified HPPC test, where points A–J are the transition points for each work step (except for point E, which is the data point 1 min after point D).
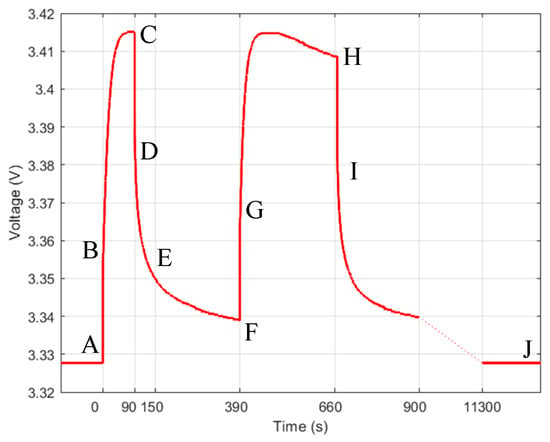
Figure 9.
One cycle of the voltage curve of modified HPPC test in charging stage.
For the RLC parallel circuit, using the KCL, we can obtain that:
where denotes the capacitance voltage of the RLC parallel link and denotes the total current.
When the RLC parallel circuit undergoes a zero-state step response, the derivation of Equation (12) yields:
where and .
The zero-state step response for Equation (13) has the following formal solution:
where and .
The model off-line parameter identification steps for the RLC parallel link reflecting the polarization voltage overshoot characteristics are similar to those for the variable-time-constant RC link, with the same first three steps. Then, the fourth step is replaced as follows.
Step 4. On the basis of the third step, the data of the pulse-charging phase (A–C) are still used, and , and are obtained from Equation (14), using double exponential fitting. Then, , and are derived from Equations (15)–(17).
4. SOC Estimation Based on TCKF Algorithm
Considering the high dimensionality of the TP model and strongly nonlinearity of the system when applied to an LFP battery, this paper takes the Cubature Kalman Filter (CKF) into account for the SOC estimation. The CKF algorithm can solve the problem of the linearization error of a Taylor expansion being large when taking the EKF algorithm in a strongly nonlinear system, and it can solve the problem of the numerical instability of the UKF algorithm [29]. However, the CKF algorithm suffers from the problem of nonlocal sampling, where the distance between each sampling point and the centroid is proportional to the number of dimensions n. The TCKF algorithm performs an orthogonal transformation on the sampled points of the CKF algorithm to derive a new set of sampled points, in that the higher-order information will be essentially zero, which effectively solves the non-local sampling problem of the CKF algorithm [30]. In addition, the computational complexity of the TCKF algorithm is equivalent to the traditional CKF algorithm, and the estimation accuracy is accurate to at least second-order Taylor precision.
The TCKF transforms the sampling points orthogonal using an orthogonal matrix, and the transformed sampling points are obtained from Theorems 1 and 2 below.
Theorem 1.
The n-dimensional matrix is known to be [31]:
where , , is the largest integer not greater than , and if n is odd, . Then is an orthogonal matrix.
Theorem 2.
Suppose is a set of sampling points used in the nth-order precision numerical integration formula, and is an orthogonal matrix with the same dimension as , then is a set of sampling points with the same weights and dimensions as .
According to Theorems 1 and 2, the CKF sampling points are orthogonally transformed to obtain the new sampling points, and the orthogonal transformation matrix of the cubature point is:
For the nonlinear system, as shown in Equation (20), the flow of the state estimation using the TCKF algorithm is shown in Table 1.

Table 1.
Flow chart of TCKF algorithm.
In performing the SOC estimation of an LFP battery, the state equation and output equation based on the TP model are shown as Equation (21). Since the polarization voltage is a segmented function and the polarization inductance branch current is discontinuous, the polarization voltage is just solved separately in each iteration as one term of the output equations in this paper.
where is calculated by Equation (22).
5. Experimental Results and Discussion
5.1. Experiment
A commercially available 120 Ah battery cell with an LFP cathode and graphite anode was used in this study. The experimental tests included static capacity testing, modified HPPC tests, and constant-current pulse tests. The modified HPPC tests, proposed in Section 3, were performed to identify the model parameters and acquire the OCV-SOC curves. The constant-current pulse tests were conducted to verify the proposed model and algorithm. All the experiments were carried out on the Neware battery tester (CT-4002-5V300A) at 25 °C in a constant temperature chamber.
5.2. Model Verification
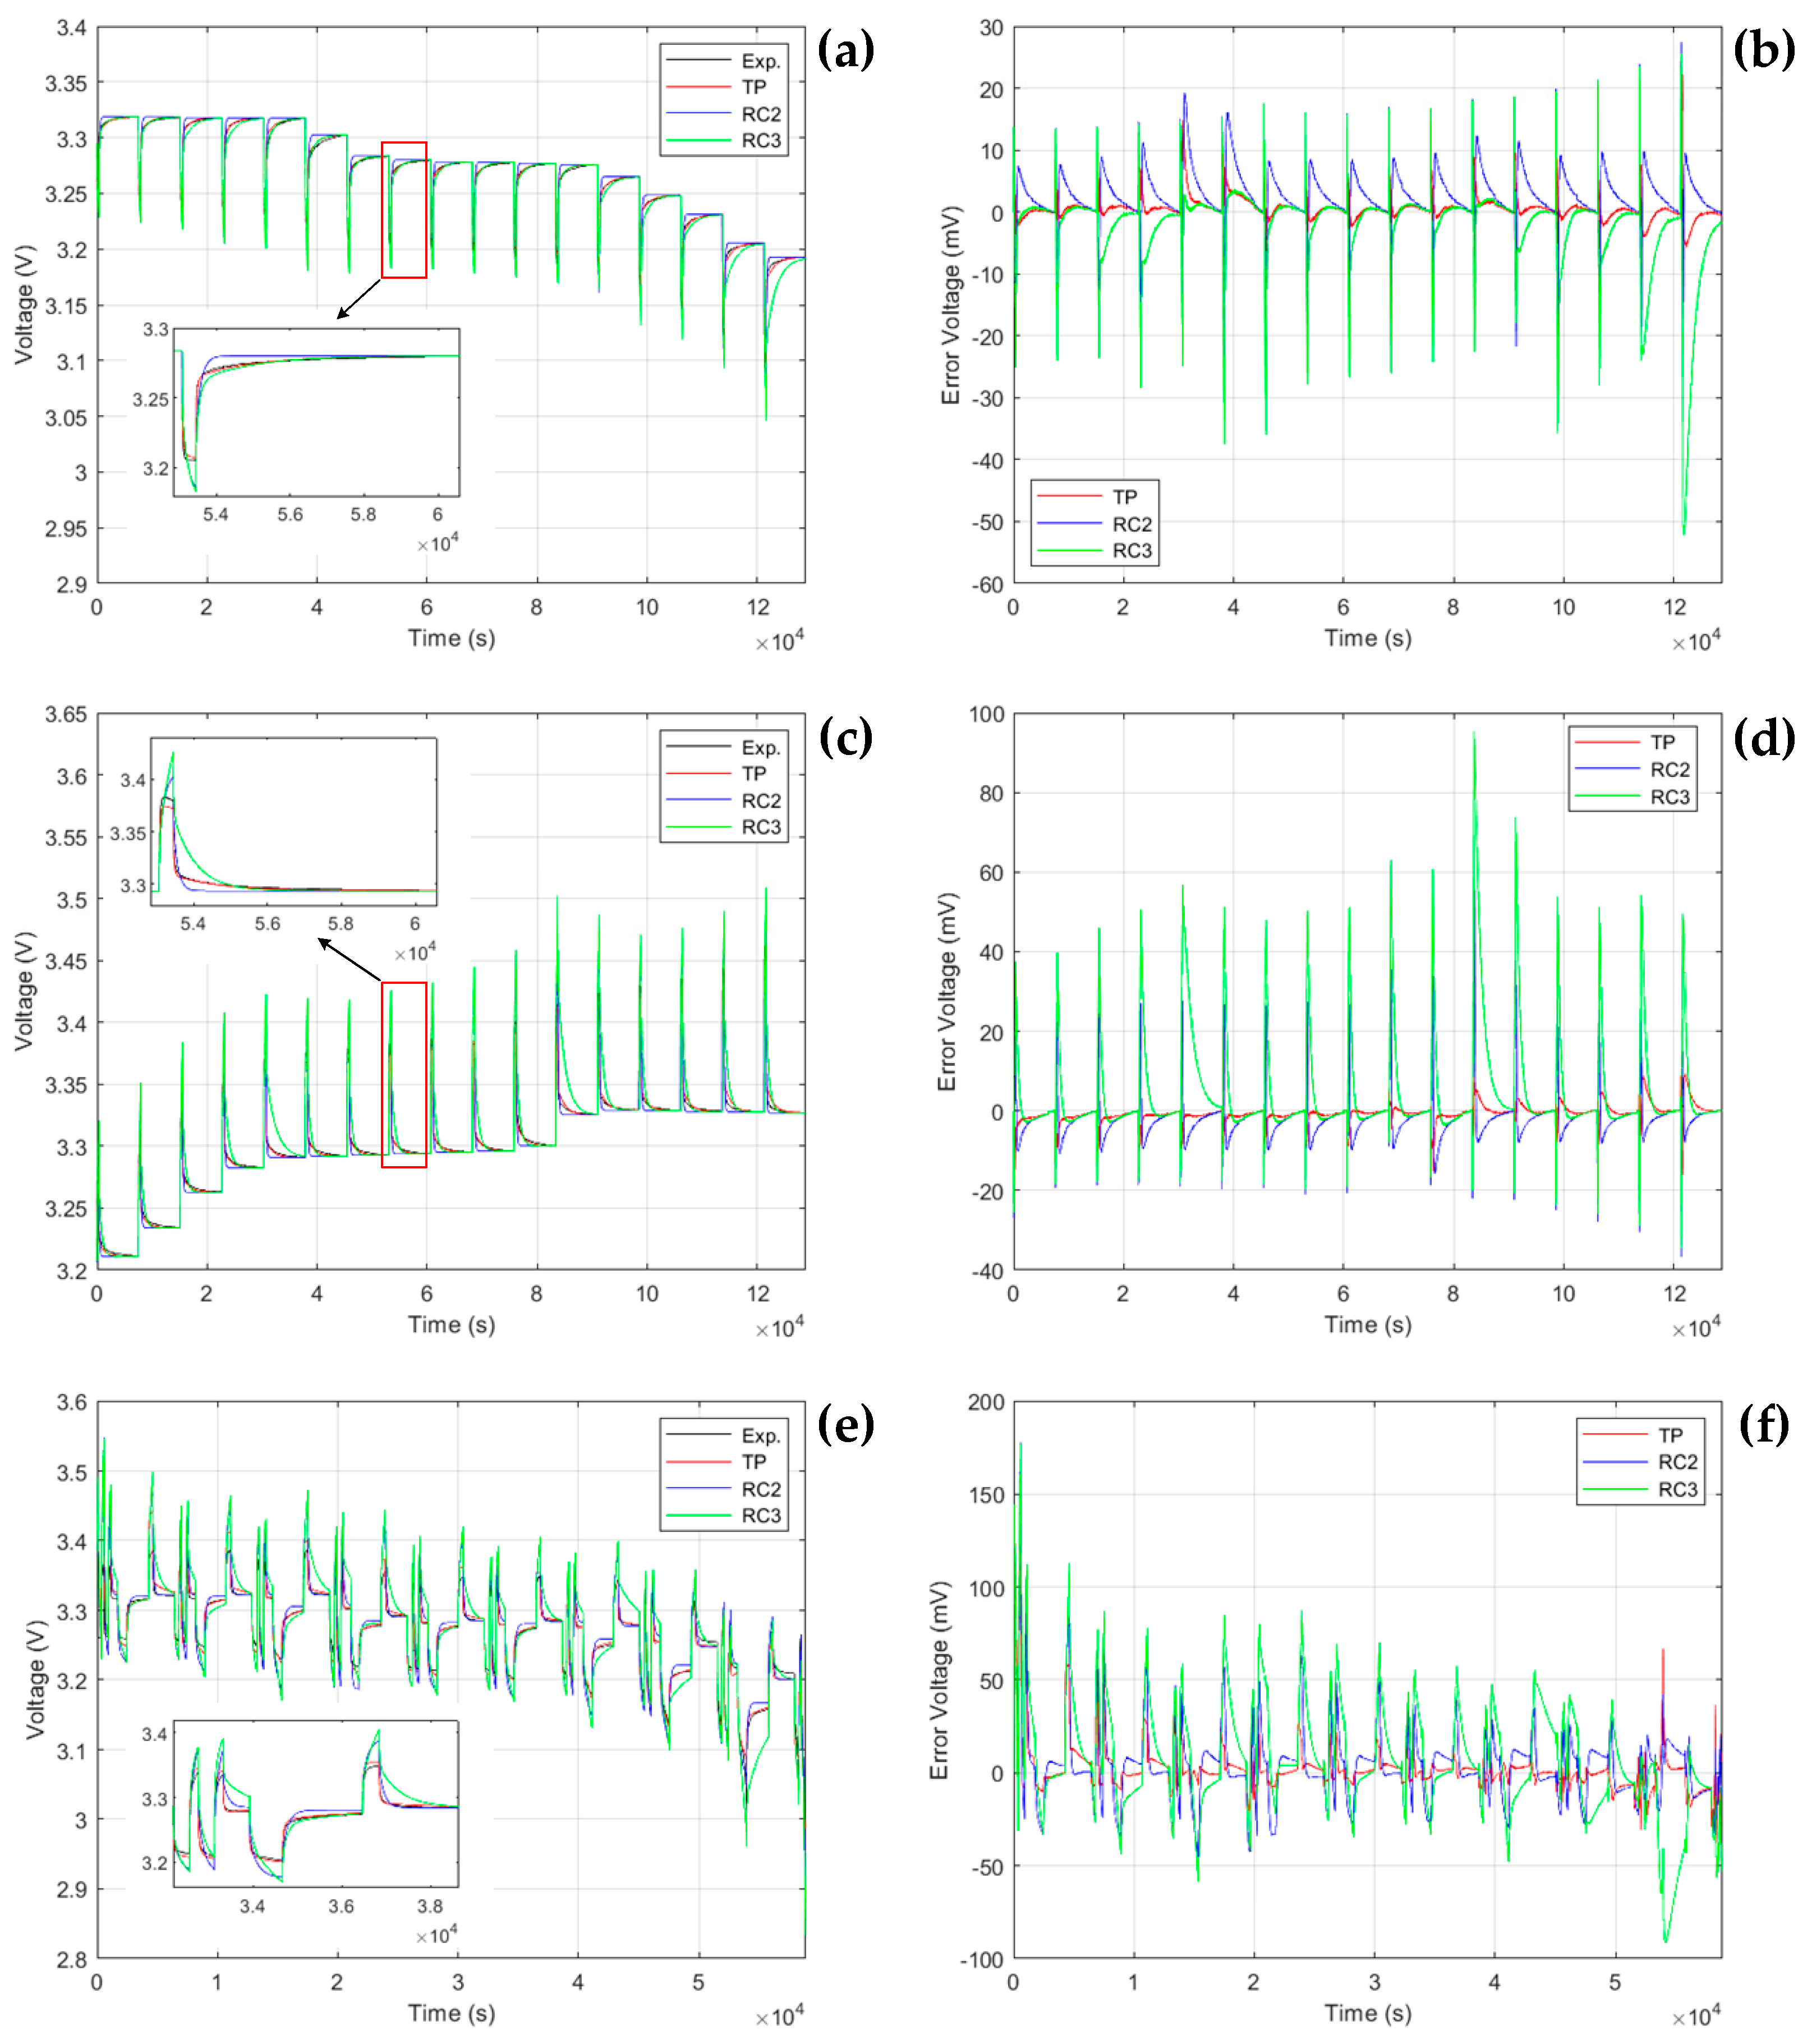
In this paper, the reliability of the TP model for following the voltage characteristics of an LFP battery was verified by constant current pulse (CCP) tests. The charge/discharge currents of the tests were all set to 0.5 C, since the model parameters in this paper were all identified from the HPPC tests with a current of 0.5 C. The parameters of the second-order RC model and third-order RC model were identified using a multi-exponential fitting method, taking the data from the rest period after the pulse of the HPPC test. Figure 10 shows the comparison of the simulation voltages and the errors for the TP model, second-order RC model (RC2), and third-order RC model (RC3) under constant current pulse conditions, and Table 2 shows the MAE and RMSE of the simulated voltages of these three models under different operating conditions. Combined with the graphs, it can be seen that the TP model proposed in this paper had better voltage estimation results under constant current pulse tests, and the MAE and RMSE of the simulated voltages of the TP model were the smallest. The specific analysis is given below.
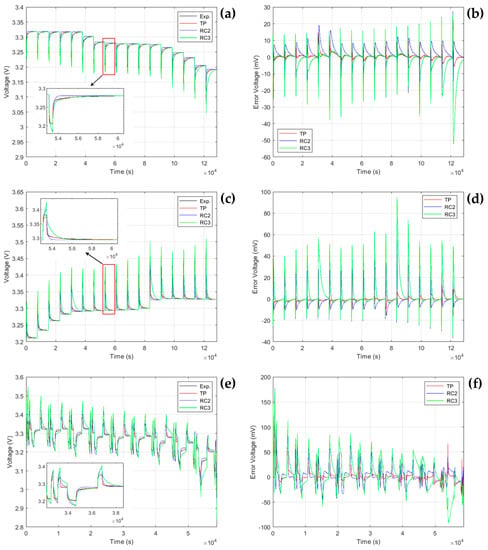
Figure 10.
Comparison of simulation voltage results. (a) Simulation voltage results at 0.5 C CCP discharging, (b) simulation voltage errors at 0.5 C CCP discharging, (c) simulation voltage results at 0.5 C CCP charging, (d) simulation voltage errors at 0.5 C CCP charging, (e) simulation voltage results at 0.5 C CCP test, and (f) simulation voltage errors at 0.5 C CCP test.

Table 2.
Model simulation voltage errors.
As can be observed in Figure 10a,c, for the second-order RC model and third-order RC model, the simulated voltages were bigger than the experimental value during charging and smaller during discharging. The reason for this was that, affected by the relaxation effect, the polarization resistance, identified based on the data at resting, was often bigger than the value when at charging/discharging because the percentage of slow-dynamic characteristics was high during resting but low during charging/discharging [32].
Moreover, the accuracy of the third-order RC model was lower than the second-order RC model abnormally in Figure 10a,c, which was more obvious during the charging stage. Because, in addition to relaxation characteristics, LFP batteries also have overshoot characteristics, this made the percentage of the apparent slow-dynamic characteristics even less during charging/discharging. The overshoot feature was more pronounced during the charging. Furthermore, when identifying the parameters with data at resting, the second-order RC model was equivalent to ignoring the large time constant, which made the error relatively large at resting but relatively small at charging/discharging, while for the third-order RC model, the result was the opposite. Although the third-order RC model could better reflect the variation trend at resting, its simulation results at the resting stage were also unsatisfactory because the polarization voltage at charging/discharging was incorrectly simulated in the first place. It also reflected the necessity of adding the variable-time-constant RC link.
For the TP model proposed in this paper, during charging, the introduction of the RLC parallel link could better reflect the overshoot characteristic of the polarization voltage; during resting, the time constant of the time-constant-variable RC link was large enough that it could reflect the characteristic of the long relaxation time; during discharging, the time constant of the additional RC link turned small, which could reflect the feature of the fast establishment of the corresponding polarization voltage. Moreover, for the mixed charging and discharging conditions, the initial current of the inductor was adjusted at the charging start moment to reduce the change rate of the terminal voltage of the RLC parallel link. It could reflect the postponement of the polarization voltage overshoot peak when the battery was discharged with an insufficient resting time, and better results were obtained this way, as shown in Figure 10e.
5.3. Algorithm Verification
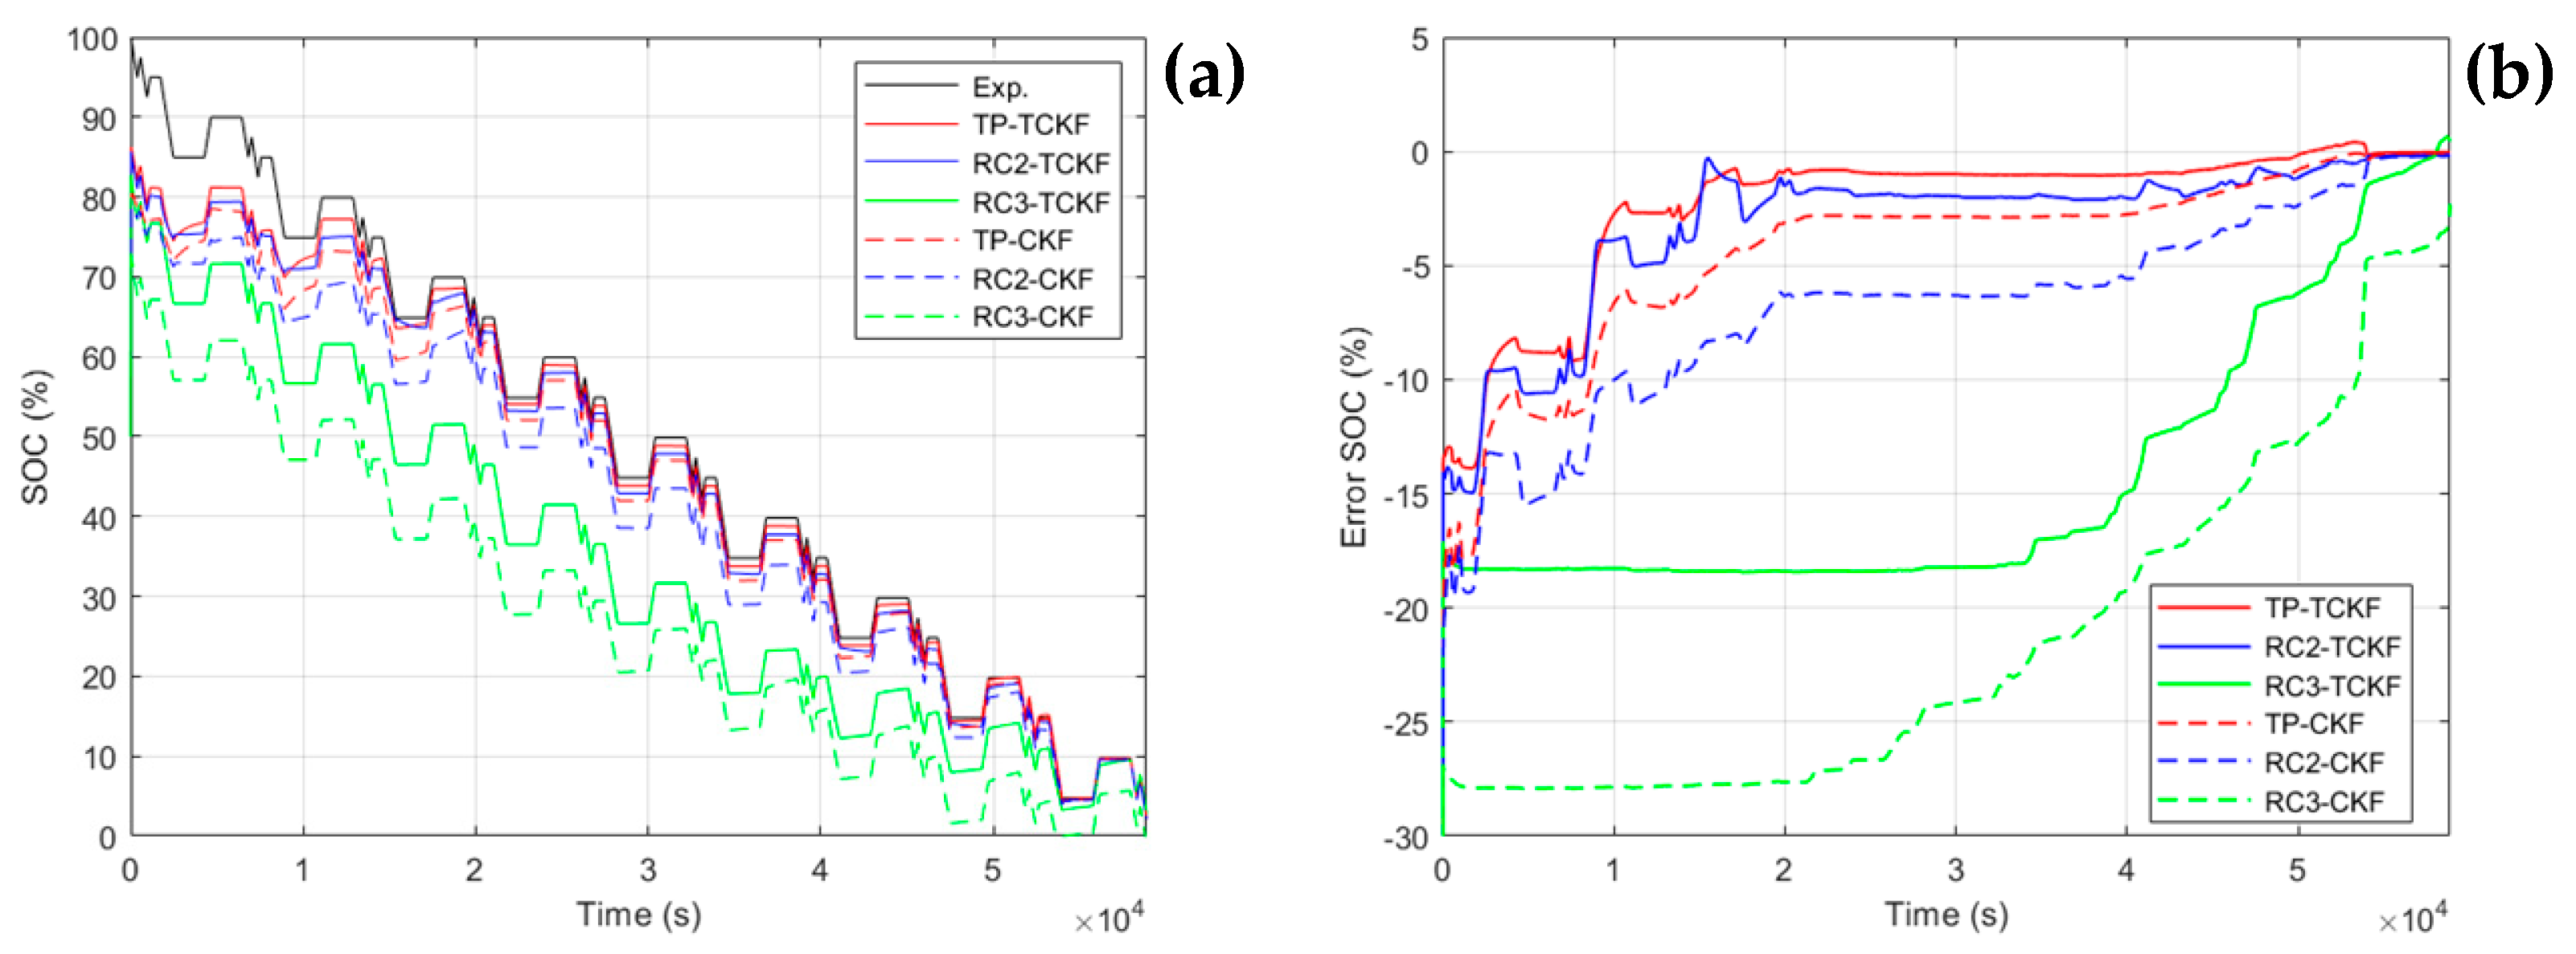
To verify the accuracy of the TCKF algorithm and TP model, the SOC estimation was performed using the TP model, second-order RC model, and third-order RC model with the CKF algorithm and TCKF algorithm, respectively. The SOC calculated using the Ampere-hour (AH) counting method with experimental data was taken as the real SOC, and the initial SOC was 100%. The initial SOC of the algorithms was set as 50% to better show the reliability of the algorithms, because the algorithm convergence time would be longer when the initial deviation was larger. The SOC estimation results are shown in Figure 11. As can be seen from Table 3 and Figure 11, using the same estimation algorithm, the MAE and RMSE errors of the SOC estimation based on the TP model were smaller than those based on the second-order RC model and third-order RC model; meanwhile, based on the same equivalent circuit model, the MAE and RMSE errors of the SOC estimation using TCKF algorithm were smaller than those using the CKF algorithm; thus, the TP model-based TCKF algorithm had the best SOC estimation results, with an MAE of 2.3749% and RMSE of 4.1563%.
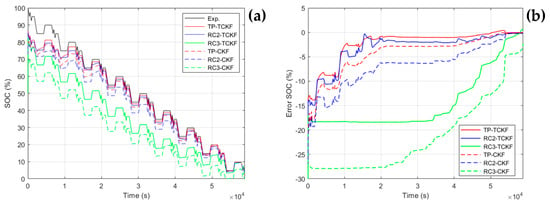
Figure 11.
Comparison of SOC estimation results of different models and algorithms. (a) Comparison of SOC estimation results and (b) comparison of SOC estimation errors.

Table 3.
SOC estimation errors for different models and algorithms.
6. Conclusions
In this paper, the TP model was established on the basis of the second-order RC hysteresis model through an experimental analysis of the polarization voltage of an LFP battery. The TP model introduced an RC link whose time constant varied with the charge/discharge and resting state of the battery, reflecting the characteristic that the polarization voltage built up faster and the relaxation time was longer; the RC link was replaced by an RLC parallel link during charging, reflecting the polarization voltage overshoot feature. Then, an offline identification method for the TP model parameters was given, and the SOC estimation was implemented using the TCKF algorithm on the basis of the TP model. Finally, the following conclusions were obtained through experimental verification.
(1) The TP model, which considers the relaxation and overshoot features of polarization voltage, can better reflect the dynamic and static characteristics of an LFP battery than the traditional equivalent circuit models.
(2) When using the same SOC estimation algorithm, the estimation results based on the TP model are significantly more precise than those based on the second-order RC model and third-order RC model.
(3) The TCKF algorithm can effectively solve the non-local sampling problem of the CKF algorithm, and it can achieve better estimation results when applied to the SOC estimation of an LFP battery.
Author Contributions
G.Z.: methodology, writing—review and editing. O.W.: data curation, validation, writing—original draft. Q.W.: data curation, writing—review and editing. J.K.: supervision, writing—review and editing. J.V.W.: supervision, writing—review and editing. All authors have read and agreed to the published version of the manuscript.
Funding
This work was supported by the National Natural Science Foundation of China under Grants No. 52277224, No. 51977163, the foundation of Hubei province under Grants No. 2021BAE130 and the Industrialization Project of Xiangyang Technology Transfer Center of Wuhan University of Technology (WXCJ-20220014).
Data Availability Statement
The data presented in this study are available on request from the corresponding author.
Conflicts of Interest
The authors declare no conflict of interest.
References
- Goodenough, J.B.; Park, K.S. The Li-ion rechargeable battery: A perspective. J. Am. Chem. Soc. 2013, 135, 1167–1176. [Google Scholar] [CrossRef]
- Zhu, S.Q.; Huang, A.; Xu, Y. Improving methods for better performance of commercial LiFePO4/C batteries. Int. J. Electrochem. Sci. 2021, 16, 210564. [Google Scholar] [CrossRef]
- He, R.; Xie, W.; Wu, B.; Brandon, N.P.; Liu, X.; Li, X.; Yang, S. Towards interactional management for power batteries of electric vehicles. RSC Adv. 2023, 13, 2036–2056. [Google Scholar] [CrossRef] [PubMed]
- Zheng, Y.; Ouyang, M.; Lu, L.; Li, J.; Han, X.; Xu, L.; Ma, H.; Dollmeyer, T.A.; Freyermuth, V. Cell state-of-charge inconsistency estimation for LiFePO4 battery pack in hybrid electric vehicles using mean-difference model. Appl. Energy 2013, 111, 571–580. [Google Scholar] [CrossRef]
- Ma, J.; Xie, J.; Bai, K. Comparative Study of Non-Electrochemical Hysteresis Models for LiFePO4/Graphite Batteries. J. Power Electron. 2018, 18, 1585–1594. [Google Scholar]
- Kondo, H.; Sasaki, T.; Barai, P.; Srinivasan, V. Comprehensive study of the polarization behavior of LiFePO4 electrodes based on a many-particle model. J. Electrochem. Soc. 2018, 165, A2047. [Google Scholar] [CrossRef]
- Daubner, S.; Amos, P.K.; Schoof, E.; Santoki, J.; Schneider, D.; Nestler, B. Multiphase-field modeling of spinodal decomposition during intercalation in an Allen-Cahn framework. Phys. Rev. Mater. 2021, 5, 035406. [Google Scholar] [CrossRef]
- Koga, S.; Camacho-Solorio, L.; Krstic, M. State estimation for lithium-ion batteries with phase transition materials via boundary observers. J. Dyn. Syst. Meas. Control 2021, 143, 4048779. [Google Scholar] [CrossRef]
- Zhou, X.; Reimuth, C.; Xu, B.X. Phase-field simulation of misfit dislocations in two-phase electrode particles: Driving force calculation and stability analysis. Int. J. Solids Struct. 2022, 249, 111688. [Google Scholar] [CrossRef]
- Cheng, F.; Hu, Y.; Zhao, L.; Sarwar, S. Global solutions to a phase-field model with logarithmic potential for lithium-ion batteries. Math. Mech. Solids 2022, 27, 3–21. [Google Scholar] [CrossRef]
- Jokar, A.; Désilets, M.; Lacroix, M.; Zaghib, K. Mesoscopic modeling and parameter estimation of a lithium-ion battery based on LiFePO4/graphite. J. Power Sources 2018, 379, 84–90. [Google Scholar] [CrossRef]
- Guo, B.; Liu, C.; Gao, Y.; Zhu, C.; Zhang, X.; Ma, X.; Wang, F. A combining electrochemical model for LiFePO4-graphite lithium-ion battery considering cathode heterogeneous solid phase phenomenon. Int. J. Energy Res. 2022, 46, 15231–15243. [Google Scholar] [CrossRef]
- Kirk, T.L.; Evans, J.; Please, C.P.; Chapman, S.J. Modeling electrode heterogeneity in lithium-ion batteries: Unimodal and bimodal particle-size distributions. SIAM J. Appl. Math. 2022, 82, 625–653. [Google Scholar] [CrossRef]
- Dreyer, W.; Jamnik, J.; Guhlke, C.; Huth, R.; Moškon, J.; Gaberšček, M. The thermodynamic origin of hysteresis in insertion batteries. Nat. Mater. 2010, 9, 448–453. [Google Scholar] [CrossRef]
- Baronti, F.; Zamboni, W.; Femia, N.; Roncella, R.; Saletti, R. Experimental analysis of open-circuit voltage hysteresis in lithium-iron-phosphate batteries. In Proceedings of the IECON 2013-39th Annual Conference of the IEEE Industrial Electronics Society, Vienna, Austria, 10–13 November 2013; pp. 6728–6733. [Google Scholar]
- Chayratsami, P.; Plett, G.L. Hysteresis modeling of lithium-silicon half cells using discrete preisach model. In Proceedings of the 2018 8th IEEE International Conference on Control System, Computing and Engineering (ICCSCE), Penang, Malaysia, 23–25 November 2018; pp. 31–36. [Google Scholar]
- Roscher, M.A.; Sauer, D.U. Dynamic electric behavior and open-circuit-voltage modeling of LiFePO4-based lithium ion secondary batteries. J. Power Sources 2011, 196, 331–336. [Google Scholar] [CrossRef]
- Plett, G.L. Extended Kalman filtering for battery management systems of LiPB-based HEV battery packs: Part 3. State and parameter estimation. J. Power Sources 2004, 134, 277–292. [Google Scholar] [CrossRef]
- Fuller, T.F.; Doyle, M.; Newman, J. Relaxation phenomena in lithium-ion-insertion cells. J. Electrochem. Soc. 1994, 141, 982. [Google Scholar] [CrossRef]
- Park, M.; Zhang, X.; Chung, M.; Less, G.B.; Sastry, A.M. A review of conduction phenomena in Li-ion batteries. J. Power Sources 2010, 195, 7904–7929. [Google Scholar] [CrossRef]
- Pei, L.; Wang, T.; Lu, R.; Zhu, C. Development of a voltage relaxation model for rapid open-circuit voltage prediction in lithium-ion batteries. J. Power Sources 2014, 253, 412–418. [Google Scholar] [CrossRef]
- Hsieh, Y.C.; Chiu, Y.C.; Wu, W.T.; Huang, Y.C. Battery model based on cubic over-potential differential equation. IET Power Electron. 2019, 12, 3085–3092. [Google Scholar] [CrossRef]
- Sasaki, T.; Ukyo, Y.; Novák, P. Memory effect in a lithium-ion battery. Nat. Mater. 2013, 12, 569–575. [Google Scholar] [CrossRef] [PubMed]
- Jia, J.; Tan, C.; Liu, M.; Li, D.; Chen, Y. Relaxation-induced memory effect of LiFePO4 electrodes in Li-ion batteries. ACS Appl. Mater. Interfaces 2017, 9, 24561–24567. [Google Scholar] [CrossRef] [PubMed]
- Guo, X.; Song, B.; Yu, G.; Wu, X.; Feng, X.; Li, D.; Chen, Y. Size-dependent memory effect of the LiFePO4 electrode in Li-ion batteries. ACS Appl. Mater. Interfaces 2018, 10, 41407–41414. [Google Scholar] [CrossRef] [PubMed]
- Shi, W.; Wang, J.; Zheng, J.; Jiang, J.; Viswanathan, V.; Zhang, J.G. Influence of memory effect on the state-of-charge estimation of large-format Li-ion batteries based on LiFePO4 cathode. J. Power Sources 2016, 312, 55–59. [Google Scholar] [CrossRef]
- Bai, P.; Cogswell, D.A.; Bazant, M.Z. Suppression of phase separation in LiFePO4 nanoparticles during battery discharge. Nano Lett. 2011, 11, 4890–4896. [Google Scholar] [CrossRef] [PubMed]
- Jiang, J.; Liu, Q.; Zhang, C.; Zhang, W. Evaluation of acceptable charging current of power Li-ion batteries based on polarization characteristics. IEEE Trans. Ind. Electron. 2014, 61, 6844–6851. [Google Scholar] [CrossRef]
- Peng, J.; Luo, J.; He, H.; Lu, B. An improved state of charge estimation method based on cubature Kalman filter for lithium-ion batteries. Appl. Energy 2019, 253, 113520. [Google Scholar] [CrossRef]
- Zhang, Y.; Huang, Y.; Wu, Z.; Li, N. Moving state marine SINS initial alignment based on transformed cubature Kalman filter. In Proceedings of the 26th Chinese Control and Decision Conference (2014 CCDC), Changsha, China, 31 May–2 June 2014; pp. 3262–3267. [Google Scholar]
- Ghanipoor, F.; Hashemi, M.; Salarieh, H. Toward calibration of low-precision MEMS IMU using a nonlinear model and TUKF. IEEE Sens. J. 2020, 20, 4131–4138. [Google Scholar] [CrossRef]
- Yang, J.; Xia, B.; Shang, Y.; Huang, W.; Mi, C. Improved battery parameter estimation method considering operating scenarios for HEV/EV applications. Energies 2016, 10, 5. [Google Scholar] [CrossRef]
Disclaimer/Publisher’s Note: The statements, opinions and data contained in all publications are solely those of the individual author(s) and contributor(s) and not of MDPI and/or the editor(s). MDPI and/or the editor(s) disclaim responsibility for any injury to people or property resulting from any ideas, methods, instructions or products referred to in the content. |
© 2023 by the authors. Licensee MDPI, Basel, Switzerland. This article is an open access article distributed under the terms and conditions of the Creative Commons Attribution (CC BY) license (https://creativecommons.org/licenses/by/4.0/).

