Article

A Comparative Mechanistic Study on the Intercalation Reactions of Mg2+ and Li+ Ions into (Mg0.5Ni0.5)3(PO4)2

1
AIT Austrian Institute of Technology GmbH, Centre for Low-Emission Transport, Giefinggasse 2, 1210 Vienna, Austria
2
Department of Materials Chemistry, Universität Wien, Währinger Straße 42, 1090 Vienna, Austria
3
Institute for Environmental Biotechnology, Department IFA, University of Natural Resources and Life Sciences Vienna, Konrad-Lorenz-Straße 20, 3430 Tulln an der Donau, Austria
4
Department of Chemistry, Queen Mary University of London, Mile End Rd, London E1 4NS, UK
*
Author to whom correspondence should be addressed.
Batteries 2023, 9(7), 342; https://doi.org/10.3390/batteries9070342
Submission received: 9 May 2023 / Revised: 2 June 2023 / Accepted: 21 June 2023 / Published: 25 June 2023
(This article belongs to the Special Issue Recent Progress in All-Solid-State Lithium Batteries)

Abstract

:
Magnesium-ion batteries represent promising environmentally sustainable energy-storage systems with higher energy densities than their lithium counterparts. In this work, the charge storage mechanisms of the olivine-related compound (Mg0.5Ni0.5)3(PO4)2 using Mg2+ and Li+ ions were investigated and compared for the first time when copper was chosen as the current collector. A comprehensive physicochemical and electrochemical characterization was performed on the pristine powder and electrodes at different states of charge. Although (Mg0.5Ni0.5)3(PO4)2 is electrochemically active, it undergoes irreversible conversion reactions in both Mg and Li chemistries. The conversion reactions proceed with an ionic exchange between structural Ni2+ and Mg2+ or Li+ cations, which results in the formation of sarcopside-Mg3(PO4)2, a Cu–Ni alloy and poorly crystalline Li3PO4, respectively. A capacity of 600 mA h g−1 was achieved with a Li metal counter electrode in the Li cell since the conversion reaction could go to completion. A capacity of 92 mA h g−1 was delivered in the Mg cell using an activated carbon counter electrode. These findings shed light on the fundamental mechanism of activity in olivine-related compounds, underlining the importance of performing systematic studies to unveil the complex interactions between both single-valent and multivalent ions with novel structures.

1. Introduction

In recent years, research into energy storage systems has shifted to the investigation of “next-generation” battery chemistries to complement the well-known Li-ion battery (LIB). Specifically, the limited abundance of critical raw materials, such as cobalt and natural graphite and burgeoning lithium geopolitics due to the concentration of its reserves in selected countries [1] combined with inherent safety aspects in the operation of LIBs, has prompted research into other chemistries, such as sodium (Na+) and multivalent (i.e., Mg2+, Ca2+, Zn2+ and Al3+) ion batteries [2,3,4,5]. Among these alternatives, magnesium-based systems are considered as possible candidates to partially replace Li-ion technologies since magnesium (Mg) is naturally abundant, non-toxic, recyclable [6] and available at a relatively low cost. Another advantage of Mg lies in its improved safety since the Mg2+/Mg plating-stripping process occurs without dendrite formation when low current densities are used (<1 mA cm−2) [7]. Furthermore, metallic Mg has a high theoretical volumetric capacity of 3833 mA h cm−3 due to its di-valent nature and a relatively low negative standard potential of −2.37 V vs. SHE (standard hydrogen electrode), as well as a high theoretical gravimetric energy density of 2205 mA h g−1 [8,9,10]. Over the past decades, the development of cathode structures for Mg-ion batteries (MIBs) has focused on sulphides (e.g., Chevrel phase of the type Mo6S8) [11,12,13] and transition metal-based oxides (e.g., V2O5, MnO2, MoO3, etc.) [14,15,16,17,18,19,20,21]. However, these materials are plagued by poor kinetics of diffusion of Mg2+ ions which leads to their trapping, low practical capacities and working potentials, as well as a strong thermodynamic tendency to undergo conversion reactions [11,22,23,24,25]. Following the discovery of the capability of LiFePO4 to host Li+ ions [26,27], polyanionic-based cathode materials (e.g., Natrium Super Ionic CONductor-NASICON, olivine and Prussian blue) have also received attention for use as active cathode materials in MIBs. Despite their low theoretical gravimetric capacities, polyanionic compounds are advantageous since they are structurally stable (non-oxygen releasing) [28], non-toxic, and exhibit relatively high intercalation potentials [26], as well as high cationic diffusivities [25,29]. Zhang et al. [30] reported attempts to electrochemically intercalate Mg2+ cations into olivine FePO4. However, a discharge capacity of only ca. 12 mA h g−1 was obtained at 1.8–1.9 V vs. Mg2+/Mg due to the amorphization of the surface of the active material [30]. Similar studies on Mg intercalation into NASICON-type materials, such as Mg0.5Ti2(PO4)3, have also been performed. It was shown that, despite the sluggish diffusion, Mg2+ guest cations could be accommodated into the framework of Mg0.5Ti2(PO4)3, resulting in a sloped step in potential in the galvanostatic curve at around −1.6 V vs. Ag+/Ag at a current density of 50 µA cm−2 [31].
Despite the extensive investigation into orthophosphates as cathode materials in LIBs, there is a dearth of studies on the suitability of these materials for use in MIBs. For example, there are several works reporting on the electrochemical properties of Cu3(PO4)2 [32], CuNi2(PO4)2 [33] and Ni3(PO4)2 [28] for LIB applications, but no similar studies on their potential use in MIBs. In LIBs, it has been observed that the intercalation voltage [26,27] and cycling capability [33] of phosphate-based electrodes are affected by the transition metal cation in the cathode structure. Zhong et al. [32] reported the electrochemical properties of crystalline Cu3(PO4)2/C composites, showing that Li+ ions can be reversibly intercalated with a specific capacity of 425 mA h g−1 during the first discharge cycle from 4.8 to 1.5 V vs. Li+/Li (10 mA g−1 as current density). [32] To improve cyclic performance, Zhao et al. [33] synthesised CuNi2(PO4)2/C via a solid-state reaction method and substitution of two Cu atoms in Cu3(PO4)2 with Ni. Electrochemical testing from 3.0 to 1.5 V vs. Li+/Li showed that when using a specific current of 40 mA g−1, a specific discharge capacity of 400 mA h g−1 was attained in the first cycle with 76.5% capacity retention after the first charge [33]. Ni3(PO4)2 was investigated by Aziam et al. [28] as a potential conversion anode for LIBs. The Ni3(PO4)2/C composites exhibit a large plateau at 1.5 V vs. Li+/Li during the first discharge cycle, yielding a final specific capacity of 503 mA h g−1 at 0.5 V vs. Li+/Li [28].
Considering the Mg chemistry, in a rare study of this kind, Zhang et al. [30] observed that the discharge of FePO4 up to 0.8 V vs. Mg2+/Mg leads to the formation of Mg3(PO4)2 and Fe3(PO4)2 via a conversion reaction. This suggests that Mg0.5FePO4, which is the predicted intercalation product of FePO4, is not thermodynamically stable [30]. Therefore, to address the lack of knowledge in Mg-chemistry, this work is focused on investigating for the first the mechanism of electrochemical storage (i.e. conversion or intercalation) of the mixed-cation orthophosphate (Mg0.5Ni0.5)3(PO4)2 (MNP), following the success of olivine and olivine-related phosphates as active materials for LIBs [27,34]. Ni2+ charged species were selected to substitute structural Mg2+ cations since the two metals have similar cationic radii in octahedral coordination (r(Mg2+) = 0.66 Å and r(Ni2+) = 0.65Å) [35]. This ensures the stability of the crystal structure of the orthophosphate phase with a shared, mixed occupation of Mg2+ and Ni2+, thereby allowing the preparation of a phase-pure sample at synthesis conditions [36]. In addition, as observed for LIBs, the use of nickel in active materials allows greater storage capacities to be achieved [37]. Although MNP has already been synthesised [36], its use as an active electrode material in LIBs and MIBs has not previously been proposed. The theoretical specific charge capacity of MNP is calculated to be 255.7 mA h g−1 for the full oxidation of Ni2+ to Ni4+. However, the potentials required for Mg2+ extraction are too high to maintain the stability of conventional Mg-based electrolytes and are, thus, likely to result in the decomposition of the active material itself [38]. This work is therefore focused on unveiling the reduction mechanisms of MNP active material.
After being synthesised, the crystal structure, chemical composition, and morphology of MNP active material were thoroughly characterised via diffraction, spectroscopy and microscopy methods. Electrochemical investigations of the electrode active materials were performed using both Mg and Li cells since the reaction mechanism and thermodynamic driving force for the Mg reaction can be better understood when they are compared and contrasted to those for Li. The cycled electrodes were analysed using X-ray diffraction, infrared and X-ray photoemission spectroscopies methods (ex-situ approach) to unveil the reaction mechanisms of MNP. MNP is shown to be electrochemically active in both Mg and Li chemistries via irreversible conversion pathways, and an alloying reaction between Ni (from the MNP) and Cu (current collector) was also observed.

2. Results

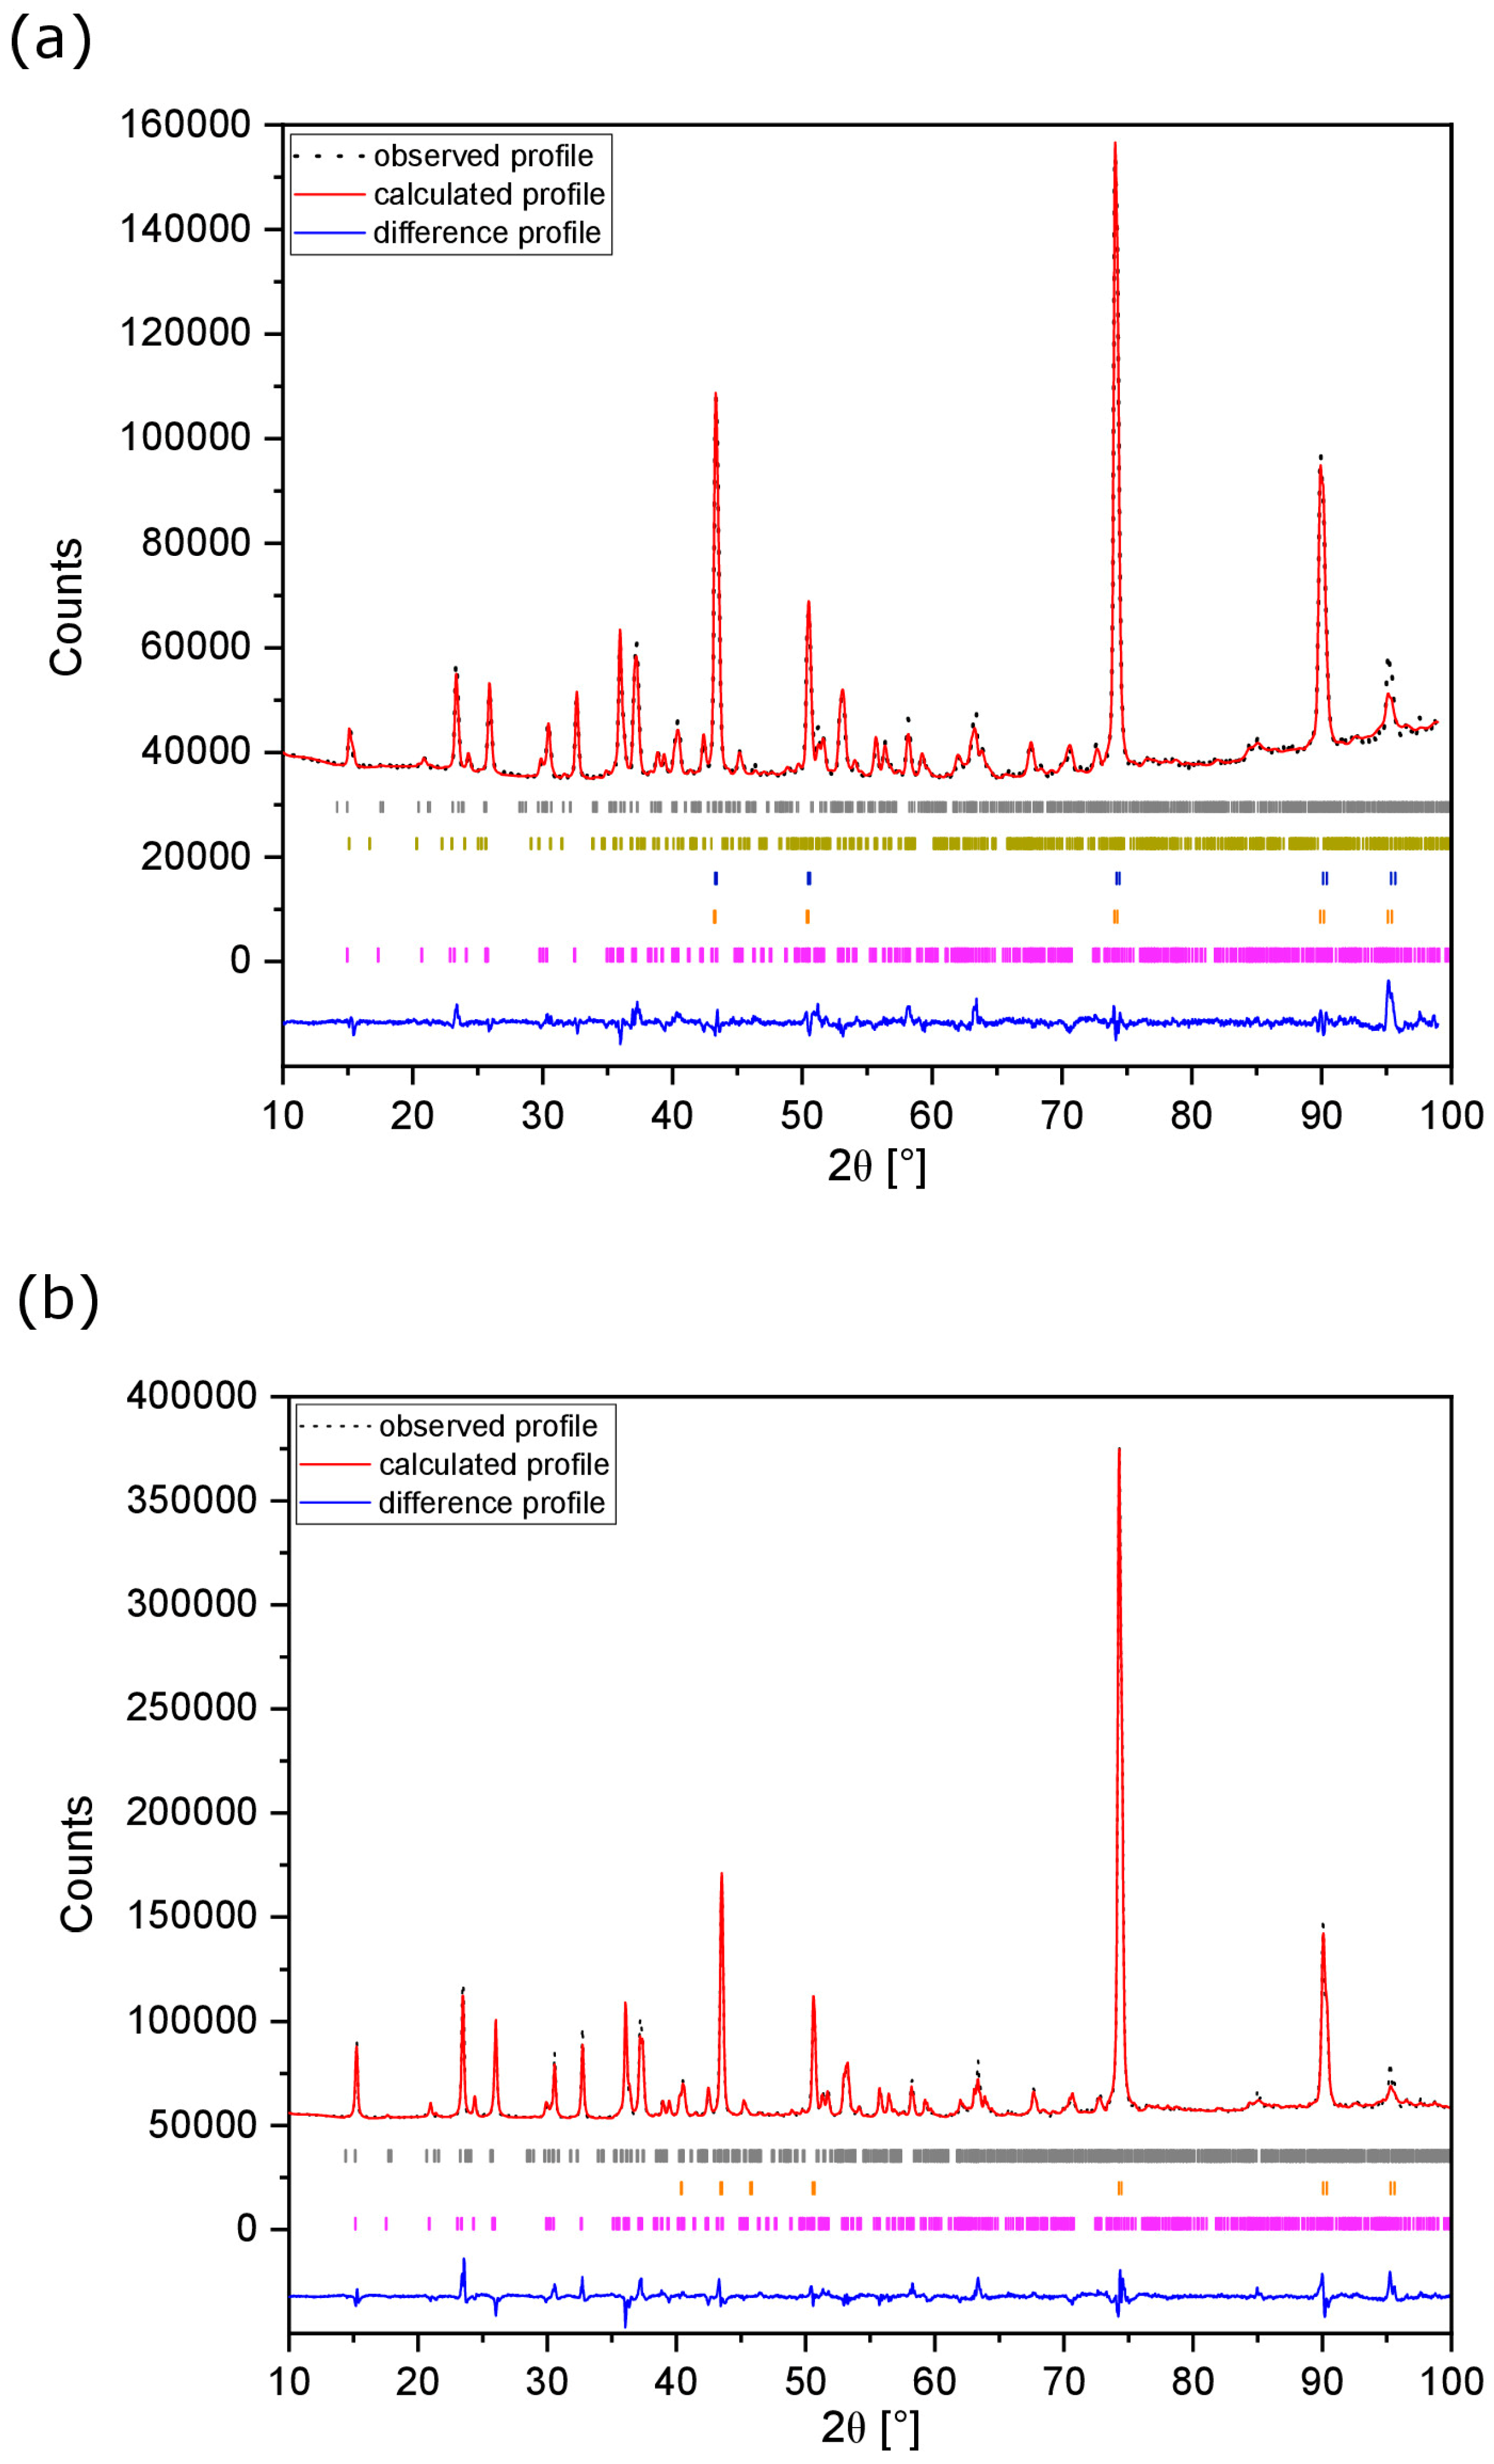
2.1. Physico-Chemical Characterisation of MNP Pristine Powder

The fitted X-ray diffraction (XRD) profile of the MNP powder is shown in Figure 1a, with the refined atomic parameters given in Table 1 and the corresponding crystal and refinement parameters in Table S1 in the Supporting Information (SI). The Rietveld analysis revealed a relatively high level of purity, with less than 1.0 wt.% of NiO. MNP adopts the sarcopside structure in space group P21/c (Figure 1b) with lattice parameters a = 5.8860 (1) Å, b = 4.70841(9) Å, c = 10.1717(2) Å and β = 90.777(1)°. Magnesium and nickel ions are distributed unequally on 2b and 4e Wykoff positions (Mg/Ni(1) and Mg/Ni(2), respectively), with the 2b site favoured by Ni. The cations located on the 2b sites are surrounded by six oxygen atoms with bond lengths ranging from 2.07 to 2.09 Å. These distorted octahedra share edges with neighbouring phosphate tetrahedra. The cations located on the 4e sites are bonded to six oxygen atoms with bond lengths ranging from 2.0 to 2.1 Å. However, these octahedra share only corners with phosphate tetrahedra.
Scanning electron microscopy of the as-prepared powder shows irregularly shaped micron-sized particles with a non-uniform size distribution (Figure 2a,b). Based on dynamic light scattering analysis, the average diameter of 50% of particles is 30 µm, as shown in Figure 2c.
The attenuated total reflection Fourier transform infrared (ATR-FTIR) spectrum of the as-prepared powder is shown in Figure 2d. The high-frequency part of this spectrum (1200–700 cm−1, ν3 + ν1) is assigned to the stretching vibrations of the phosphate unit, whereas the bands between 700 cm−1 and 400 cm−14 + ν2) correspond to the bending vibrations of the P–O bond. Since the tetrahedral (PO4)3– units are surrounded by NiO6 and MgO6 octahedra in the structure, some changes in the spectrum and a shift of the modes to lower or higher wavenumbers are expected (influence of non-tetrahedral cations). Thus, the P–O antisymmetric (ν3) and symmetric stretching (ν1) bands are located between 1085 and 987 cm−1 and at 909 cm−1, respectively. The antisymmetric (ν4) and symmetric (ν2) bending modes of the O–P–O angle are identified in the regions 635–531 cm−1 and 471–455 cm−1, respectively [39,40,41,42]. The bands in these regions may overlap with the vibrational modes of the Mg–O and Ni–O bonds [43]. A large splitting of the ν3 bands of the (PO4)3– is detected, as reported before for other olivine phosphate-based structures [44]. In fact, the type and strength of the chemical bond between oxygen and the transition metal cation influence the interactions within the phosphate unit. Thus, a higher second ionisation energy of the transition metal cations in octahedral sites produces a stronger interaction with the neighbouring P–O bond, leading to vibration patterns at higher frequencies for the ν3 bands of the (PO4)3– units [44]. Furthermore, the external modes or lattice vibrations and translations are observed below 400 cm−1. The substitution of Ni2+ by Mg2+ cations influences the crystal field, thereby activating the P–O symmetric stretching vibration mode and resulting in the shoulder at 883 cm−1 [40].
X-ray photoemission spectroscopy (XPS) measurements were carried out on the MNP powder to probe the chemical state of the powder surface. To remove surface impurities, XPS spectra were collected after etching with Ar ions. The spectra of the main elements (P 2p, O 1s, Mg 2s and Ni 2p) of the MNP powder after Ar etching are shown in Figure 3 as functions of binding energy. The phosphorous 2p spectrum (light green line in Figure 3a) exhibited a singlet at 134.6 eV corresponding to the 2p3/2 emission line of phosphorous in the (PO4)3– units. The observed peak is in good agreement with the peak position for phosphorous in orthophosphate groups reported by Felker et al. [45]. However, the core level spectrum of P 2p reveals an additional peak (orange line in Figure 3a) at 130.6 eV, which was not observed in the non-etched sample (see Figure S1) [45]. This could be related to a local decomposition of the sample during etching, leading to the formation of P–P bonds, as reported by Hart et al. [46] and Liu et al. [47]. Figure 3b and c show the O 1s and Mg 2s spectra with binding energies at around 533 eV and 1305.9 eV, respectively. For both elements, only one single peak was observed. The O 1s signal corresponds well with oxygen in orthophosphate units [45], whereas the Mg 2s peak exhibits a small shift to higher binding energy compared to the data published for the same oxidation state (+2) in MgO [48,49]. Conversely, the spectrum for Ni results in a complex overlapping of multiple peaks, which arises from multiple splitting, ligand charge transfer effects, shake-up and plasmon loss structures contributions [50,51,52]. As reported in the literature for Ni3(PO4)2, the Ni 2p XPS spectrum (Figure 3d) shows two edges split by spin-orbit coupling, assigned to 2p1/2 at 870.3 eV (lilac line in Figure 3d) and 2p3/2 at 854.3 eV (cyan line in Figure 3d), respectively [53]. Two shake-up satellites for the 2p1/2 and 2p3/2 components are also present at 874.6 eV and 857.4 eV, respectively. Furthermore, the tail of the main peak (2p3/2) at low binding energies can be assigned to the NiO, consistent with its presence as an impurity, as seen in the XRD analysis [50,51].

2.2. Electrochemical Testing

2.2.1. Preliminary Evaluation of the Electrochemical Activity of MNP

Preliminary electrochemical tests were needed to provide insights into the electrochemical activity of MNP with Li+ and Mg2+ charged species. In the first step, the slurry of the MNP active material was cast on aluminium (Al) current collectors. This step allowed us to evaluate the electrochemical activity of the MNP active material in the high-voltage region, as Al metal is known to be stable at high potentials in LIB applications due to the presence of an oxidation layer on the current collector surface [54]. Thus, preliminary electrochemical cells were assembled, coupling these working electrodes with Li reference electrodes using a Li-electrolyte (see SI for the composition details). This initial experiment showed that no significant charge capacity was attained upon oxidation of MNP, as seen in Figure S2. This lack of charging behaviour may be due to the absence of defects (interstitials and/or vacancies) in the MNP crystal structure, which prevents the Mg2+ ions from migrating through the crystal structure via hopping mechanisms. During the discharge step, instead, a voltage profile with a low gradient step was observed between 1.1 and 0.8 V vs. Li+/Li. This was followed by a plateau at ca. 0.2 V vs. Li+/Li. The latter potential plateau may be related to the formation of Al–Li alloys during the reduction reaction [54], although this electrochemical event was not further investigated in this work. The first sloping plateau, however, indicates that MNP shows electrochemical activity with Li+ at lower potentials. Therefore, to further investigate the charge storage mechanisms using Mg2+ and Li+ charge carriers, the MNP active material was coated onto Cu metal, as this current collector is preferred at lower working potentials. Since MNP is primarily being investigated for its electrochemical activity with Mg2+, the experimental results for the cells with Mg-based electrolytes are presented below first, followed by those for Li-based electrolytes.

2.2.2. The Electrochemical Activity of MNP with Mg2+ Ions

To overcome the passivation issues associated with the use of Mg metal in the presence of most commonly used electrolytes [55,56], activated carbon (AC) was used as the counter and reference electrode with the Mg-electrolyte (see SI for the composition and experimental details). The voltage window between −2.4 and −0.8 V vs. AC was selected for the investigations according to the results of cyclic voltammetry (Figure S3), as irregular effects were observed on the cyclic voltammetry (CV) curve of MNP at an onset potential of −0.7 V vs. AC. Similar effects were also measured when bare Cu metal was used as the working electrode. Without additional investigations, it was therefore assumed that these artefacts occurred due to an interaction between Cu and the electrolyte at potentials higher than −0.8 V vs. AC.
The discharge profile at a specific current of 2 mA g−1 is characterised by a slope change at around −1.7 V vs. AC, followed by a steady decrease in cell potential. A practical, specific capacity of 92 mA h g−1 was attained on discharge up to −2.4 V vs. AC (Figure 4). However, during charging up to −0.8 V vs. AC, the practical capacity of the electrode active material drops to 19 mA h g−1. Even when a constant voltage step was used in the charge cycle with a current limitation set to 10% of the initial charge current, only a minimal additional capacity of 0.6 mA h g−1 was recovered on charge (Figure S4). These low capacities may be due to the high overpotentials which accompany the conversion reaction, which hinder the kinetics of magnesium extraction. In addition, it has already been observed that, due to the absence of defects (interstitials and/or vacancies) in the original MNP crystal structure, Mg2+ ions are hindered in their migration through the crystal lattice, which would also result in high overpotentials for the charge reaction.
To understand the potential charge storage mechanisms of MNP with Mg2+, ex-situ XRD and ATR-FTIR analyses were performed on the MNP working electrodes in the discharged and charged states. For these investigations, cells were discharged up to −2.4 V vs. AC, whereas cells in the charged state were first discharged up to −2.4 V and then charged to −0.8 V vs. AC. The extent of the magnetisation reaction was also evaluated by ex-situ XPS analysis using the fully discharged MNP working electrode as the probe. Multiphase The measured XRD patterns of the pristine (Figure 5), discharged (Figure 6a) and charged (Figure 6b) working electrodes were refined with the Rietveld method in order to investigate the bulk interaction between Mg2+ cations and the MNP active material. All patterns are dominated by peaks arising from the Cu current collector, which show preferred orientation due to the rolling of the Cu foil [57]. Table 2 summarises the active phase information derived from the Rietveld analysis. Crystal and refined parameters are tabulated in Tables S2 and S3. In the pristine electrode, Mg2P2O7 was detected as an impurity in the active material, suggesting some instability of the MNP under the electrode processing conditions, which results in the partial decomposition of the MNP active material into the more thermodynamically stable Mg2P2O7 phase, as reported by Magnusson et al. [58] for the Cu2P2O7-Cu3(PO4)2 system. However, MgP2O7 was only detected as a minor phase with 3.68 wt.%, which is close to the detection limit of the technique and therefore, little can be concluded about its presence in the diffraction pattern of the pristine electrode.
Rietveld refinement of the XRD pattern, shown in Figure 6a, indicates that an MNP-type phase is retained after the discharge step. A second sarcopside type phase (ca. 7 wt.% of the active material), with 4.4% greater volume than that of the pristine MNP phase, is also observed. This phase is tentatively attributed to the sarcopside-Mg3(PO4)2 type phase (in space group P21/c) previously identified by Annersten et al. [59] as a high-pressure phase existing at 3 GPa. Additionally, the peaks associated with the current collector show asymmetry and broadening after the discharge step. The results are consistent with the extrusion of Ni2+ cations from the octahedral sites of the pristine MNP lattice under electrochemical conditions to form Mg-rich phases along with the formation of a Cu–Ni alloy phase, as reported by Gulyaev et al. [60] Hence, the reaction can be summarised as:
(Mg0.5Ni0.5)3(PO4)2 + 3x Mg2+ + 6x e + yCu → (Mg0.5+xNi0.5−x)3(PO4)2 + Ni3xCuy
The formation of sarcopside-Mg3(PO4)2 therefore corresponds to x = 0.5 in reaction 1, while the Mg-rich MNP phase corresponds to a lower value of x. The theoretical specific capacity associated with this reaction is 255.7 mA h g−1 (corresponding to x = 0.5). The observed specific capacity of 92 mA h g−1, however, indicates that an x-value of 0.177 was attained. On charging (Figure 6b), the sarcopside-Mg3(PO4)2 is lost, but the Cu–Ni alloy is retained along with the MNP-type phase. This suggests that after extrusion, Ni2+ does not re-enter the active material as it is trapped in the Cu current collector, and on charging, the MNP phase remains rich in Mg.
To confirm the discharge mechanism proposed in reaction 1, XPS analyses were conducted on the pristine and discharged electrodes monitoring the spectra of the P 2p, Mg 2s and Ni 2p main components (Figure S5). Comparing the P 2p spectra of the electrodes with that obtained for the MNP powder (light green and orange lines in Figure 3a), no important differences were noted, which suggests that both the electrode processing and the following discharge step did not alter the orthophosphate structure of the active material (Figure S5a,b). The presence of orthophosphate and pyrophosphate groups results in P 2p peaks exhibiting the same binding energies [61]. Hence, the formation of Mg2P2O7, as detected at a concentration of 3.68 wt.% via XRD of the pristine electrode, cannot be confirmed by XPS analysis. On the other hand, the Mg2+ ions storage mechanism via a conversion reaction could be probed by monitoring the Mg 2s and Ni 2p peaks. In fact, after discharging up to −2.4 V vs. AC, the Mg 2s single peak grows in intensity, suggesting an increased concentration of Mg2+ ions at the surface of the MNP active material (Figure S5c,d). Similar behaviour was observed by Li et al. [62] during the electrochemical magnetisation of VS4 [62]. The XPS spectra of Ni for the pristine electrode and the electrode in the discharged state show a complex set of components after fitting (Figure S5e,f), as was also observed for the pure MNP powder. The characteristic 2p1/2 and 2p3/2 spin-orbit peaks and the corresponding shake-up satellites are detected at 870.9/875.4 eV and 853.3/857.7 eV for the pristine electrode, as well as at 870.9/875.1 eV and 853.3/857.5 eV for the discharged electrode. The appearance of an additional peak shoulder at 850.6 eV was observed after the discharge step (blue line in Figure S5f). This peak is characteristic of metallic Ni and, therefore, can be assigned to the extrusion of Ni from the MNP crystal lattice [52].
ATR-FTIR spectroscopy was also performed on the pristine, discharged and charged electrodes to comprehensively follow the magnetisation/de-magnetisation reaction (Figure 7). All the spectra show the intramolecular stretching (ν3 + ν1) and bending (ν4 + ν2) vibrations of the PO43– anions since orthophosphate units form the framework of the active material. In particular, all patterns exhibit infrared bands in the range 1200–1150 cm−1 and around 724–726 cm−1 due to the stretching of the P–O bond in the (PO3) units and the asymmetric stretching vibration of bridging P–O–P unit in the P2O72– anion, respectively [63,64]. The presence of these bands, even in the pristine electrode, suggests some decomposition of MNP during electrode processing, as was also observed by X-ray diffraction. A complex set of vibrational modes is detected in the far-IR region for all the analysed samples. Specifically, the coupling of the vibrations of the P–O bonds with the Ni–O and Mg–O units is detected for the pristine, discharged and charged electrodes at wavenumbers lower than 450 cm−1. The bands at 667–672 cm−1 can be ascribed to PVDF, which was used as a binder during the electrode preparation, as they correlate well with the known spectrum of pure polyvinylidene fluoride as a binder (PVDF), showing two bands at 666–677 cm−1 that are related to the C–F2 bending vibration and C–H2 wagging modes, respectively [65]. However, the spectral feature of the fundamental vibrations of the Ni–Cu metal bond may overlap with that of PO43– in the low-frequencies region, considering that in a pure Ni–Cu alloy, the stretching line appears at 455 cm−1 [65]. Comparing the infrared spectra of the pristine and discharged electrodes, broader and less resolved stretching and bending bands are observed for the discharged electrode. These phenomena are due to the extraction of Ni2+ cations from the MNP lattice, which leads to a change in the coordination of the PO43– anions and increased disorder around these units [66]. In contrast, the ATR-FTIR spectrum of the charged electrode exhibits new and better-resolved bands in the ν1 + ν3 and ν2 + ν4 regions. In particular, the typical 1085, 1077 and 1061 cm−1 stretching bands of the PO43– units in the pristine electrode are replaced by several peaks between 1100 and 1000 cm−1, which are characteristic of pyrophosphates (terminal stretching modes of P2O74– ions) [43].

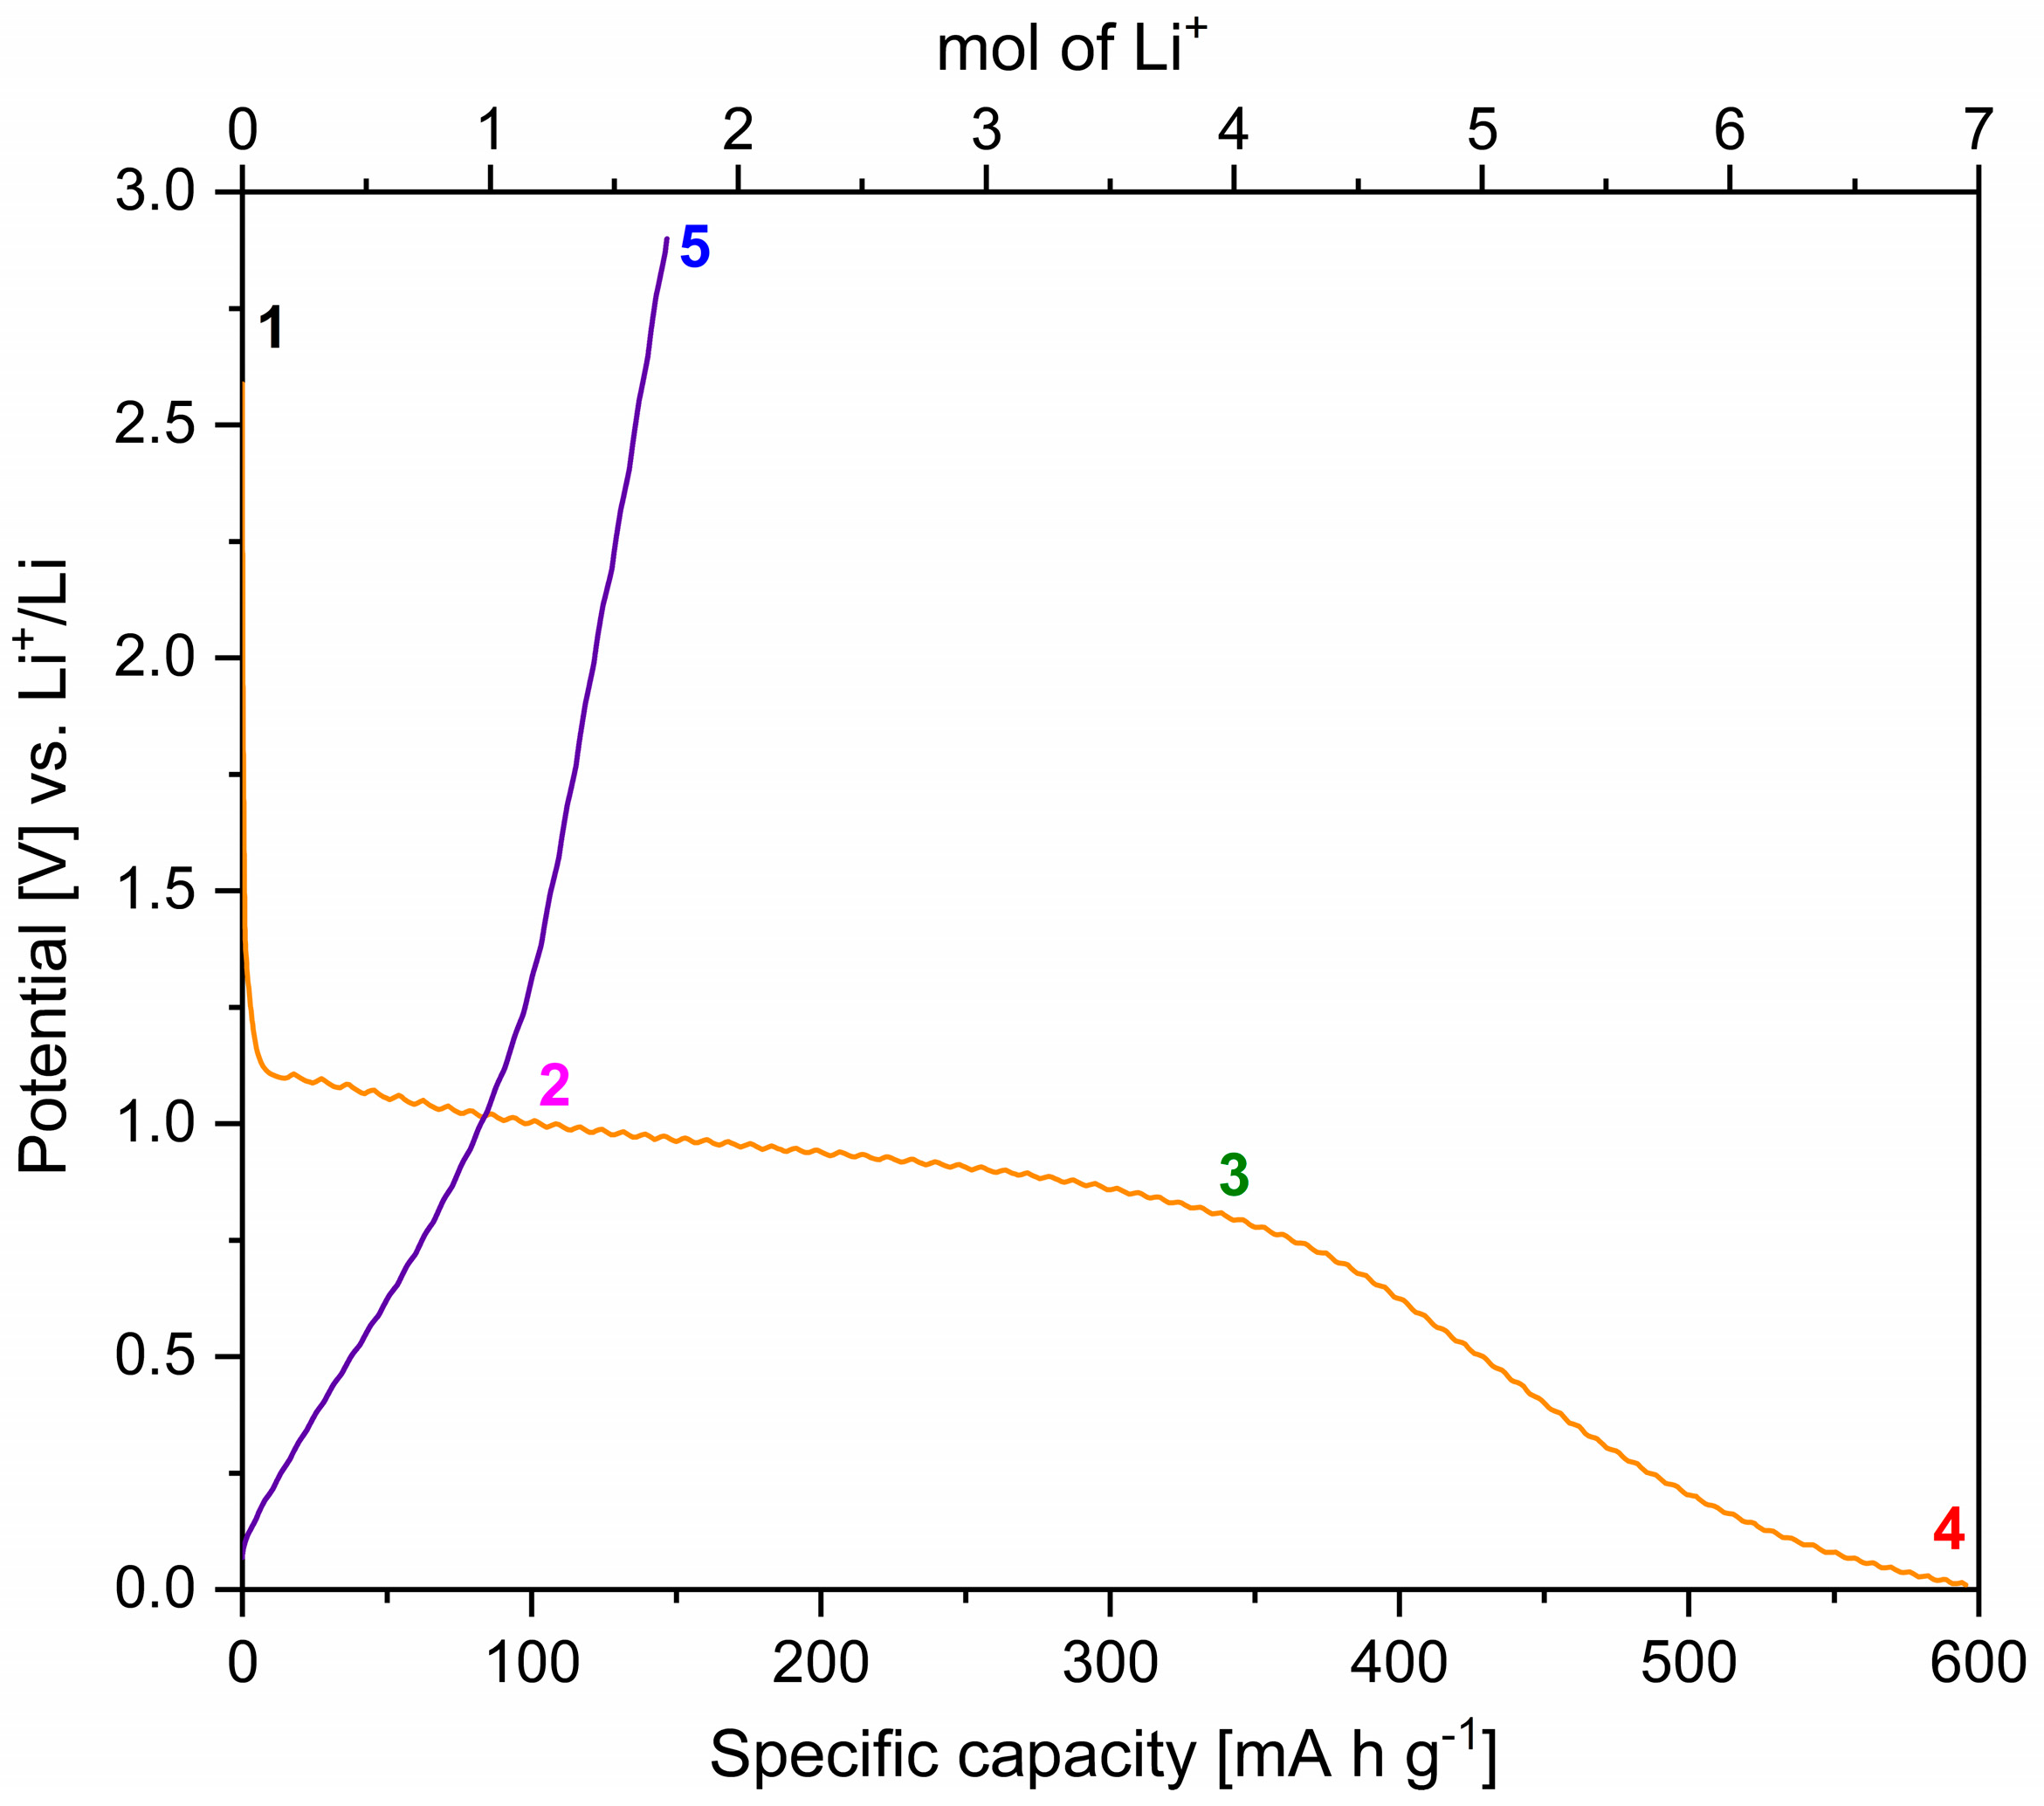
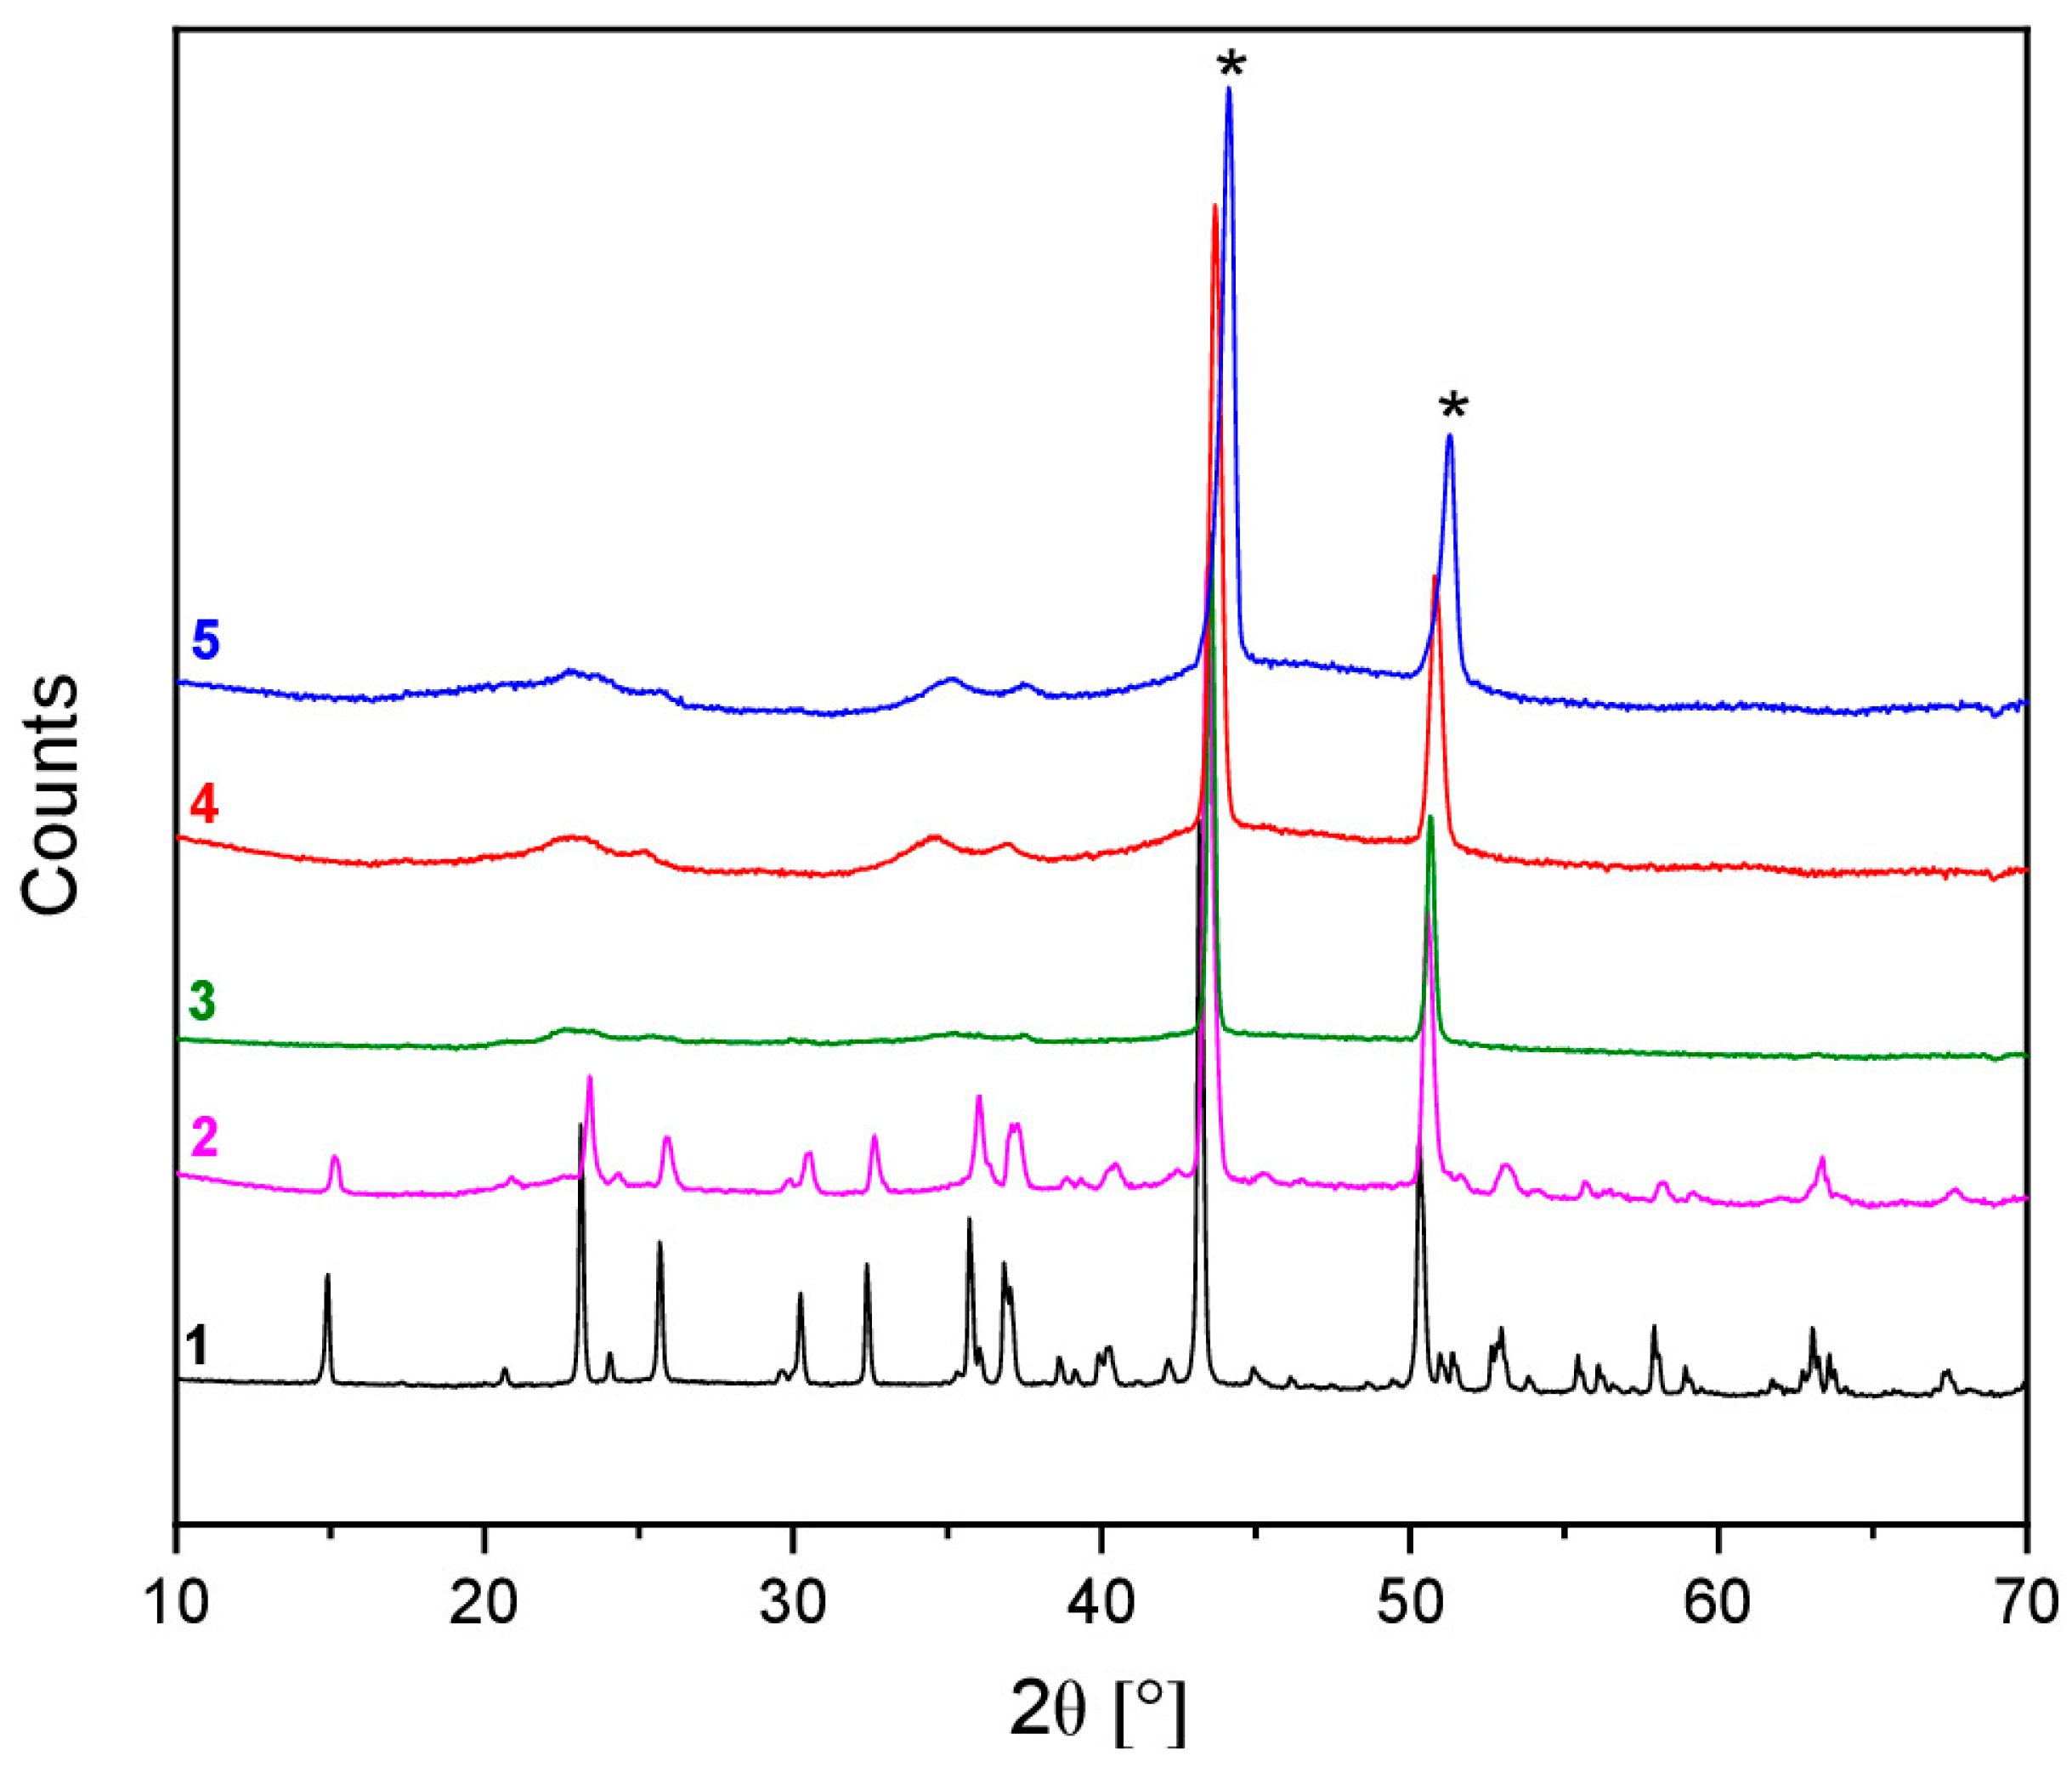
2.2.3. The Electrochemical Activity of MNP with Li+ Ions

To understand the potential charge storage mechanism of MNP with Li+ charge carriers and compare them to our observations for Mg2+, galvanostatic experiments (with C/10 cycling rate) combined with ex-situ XRD, XPS and ATR-FTIR were conducted using Li half cells. The discharge and charge curves for the first cycle against Li+/Li are shown in Figure 8. The discharge curve is characterised by a low gradient step between 1.1 and 0.8 V vs. Li+/Li with a specific capacity of 350 mA h g−1 (Point 3 in Figure 8), followed by a much stronger drop in potential from 0.8 to 0.01 V vs. Li+/Li with a final specific capacity of 600 mA h g−1 (Point 4 in Figure 8). The absence of steps in the voltage profile and the lower specific capacity upon charge indicate that the main discharge reaction is irreversible. A similar voltage profile was observed up to 0.2 V vs. Li+/Li when an Al current collector was used for the preliminary tests, as shown in Section 2.2.1 and Figure S6 in SI. However, the plateau at 0.2 V vs. Li+/Li, when the Al current collector is used, may be due to the formation of Al–Li alloys at such low potentials [60], thereby further reinforcing the unsuitability of Al as a current collector in this work.
The XRD patterns of electrodes corresponding to various points are shown in Figure 9, with the fitted patterns given in Figures S7–S10 and the tabulated results in Tables S4 and S5. Table 3 summarises the refined lattice parameters and cell volumes. Along with unreacted MNP, sarcopside-Mg3(PO4)2 and the Cu–Ni alloy phases could be identified, as observed when AC was employed as the counter electrode in the experiments with the Mg-based electrolyte. The fitted diffraction profile of the working electrode discharged up to 0.01 V vs. Li+/Li is shown in Figure S9. The assigned broad peaks were attributed to the reflections of Li3PO4, indicating that this phase has poor crystallinity [67].
Based on the Rietveld analysis of the measured XRD data, the lithiation of MNP is proposed to occur via a multistep conversion reaction mechanism involving three basic processes. At 1.0 V vs. Li+/Li (point 2 in Figure 8), the XRD data indicate the formation of sarcopside-Mg3(PO4)2, which is likely to be accompanied by the formation of Li3PO4, but as shown by the XRD data at 0.01 V (point 4), this phase is poorly crystalline and therefore cannot clearly be distinguished at lower concentrations. Together with the appearance of the sarcopside-Mg3(PO4)2 phase, a characteristic asymmetry in the (1 1 1) and (0 0 2) reflections of the Cu current collector was also observed in the diffraction profile of the electrode after discharging up to 1.0 V vs. Li+/Li (Figure S11). This effect can be associated with the extrusion of Ni species during Li+ intercalation and the following alloying reaction with the Cu current collector. Hence, the first process (reaction 2) can be summarised as follows:
(Mg0.5Ni0.5)3(PO4)2 + 3xLi+ + 3xe + yCu → (1−x)(Mg0.5Ni0.5)3(PO4)2 + x/2Mg3(PO4)2 + xLi3PO4 + Ni3x/2Cuy
In the second process (reaction 3) on discharging, sarcopside-Mg3(PO4)2 reacts with lithium to produce Li3PO4:
Mg3(PO4)2 + 6xLi+ + 6xe → (x−1)Mg3(PO4)2 + 2xLi3PO4 + 3xMg
The theoretical capacity for these two processes is 511.4 mA h g−1. However, a first-cycle discharge capacity of 600 mA h g−1 was measured (Figure 8), which corresponds to the storage of 7 moles of Li+ per formula unit of MNP (theoretical capacity of 597 mA h g−1). Therefore, a third process must occur during discharge to account for the additional lithium. As reported in the Li–Mg phase diagram, Li can react with Mg to form the α–Mg and β–Li solid solutions [68]. Based on the observed additional discharge capacity, the alloy corresponds to an approximate formula of Li0.4Mg0.6, placing it in the β-Mg (β-Li) solid solution region. The absence of reflections from this phase in the XRD data of the fully discharged electrode may be due to the low atomic X-ray scattering factors of Li and Mg and/or the amorphous character of the phase. Thus, the third process (reaction 4) can be summarised as:
Mg + xLi+ + xe → LixMg
Therefore, reaction 5 is associated with the lithiation of MNP active material:
(Mg0.5Ni0.5)3(PO4)2 + (6+3x/2)Li+ + (6+3x/2)e + yCu → 2Li3PO4 + 3/2LixMg + Ni1.5Cuy
According to the reaction above, based on the observed practical capacity of 600 mA h g−1, the value of x in Equation (5) is 2/3.
To understand the charge reaction, Rietveld analysis was performed on the measured XRD pattern of a working electrode which was discharged up to 0.01 V vs. Li+/Li and charged again up to 2.9 V vs. Li+/Li (Figure S10). Broad reflections of a poorly crystalline Li3PO4 phase can be seen in the low 2θ angle region (20°−40°), which were also observed in the XRD diffractogram obtained after discharging up to 0.01 V vs. Li+/Li. This suggests that once formed on discharge, Li3PO4 remains in an electrochemically inactive phase. Additionally, as observed after the discharging to 1.0 V vs. Li+/Li, the asymmetry in the Cu current collector reflections was also observed in the diffraction profiles for the electrodes at the selected states of charge (Figure S11). Since the poorly crystalline Li3PO4 phase is known to be electrochemically inactive (reaction 5) [69], it is assumed that only the metallic species (Ni and/or Mg alloys) are electrochemically active in the charge reaction. The electrochemical cycling of the MNP active material was assessed in a Li-half cell configuration to support this assumption (Figure S12). After a capacity fading of 76% at the second cycle, the MNP-Li cell exhibits relatively stable cycling capacities of 95 mA h g−1 throughout 50 cycles. Based on the mechanism suggested in reaction 5, this behaviour may be ascribed to the reversible–extraction of Li+ charged species in the in-situ formed LixMg alloy, as amorphous Li3PO4 is assumed to be electrochemically inactive (reaction 3).
To further characterise the extent of the electrochemical lithiation of MNP, XPS spectra were recorded on the fully discharged (0.01 V vs. Li+/Li) electrode monitoring the P 2p, Mg 2s, Ni 2p and Li 1s components (Figure S13). Similar to the experiments performed with the Mg-based electrolyte electrode (Figure S5), the P 2p3/2 component of the Li3PO4 orthophosphate structure is observed at 134.9 eV (light green in Figure S13a). However, an additional peak arises at a binding energy of ca. 139 eV, which can be assigned to the decomposition of the LiPF6 salt, as reported by Andersson et al. [70] (dark green in Figure S13a) [70]. A slight shift to higher binding energies (1305 eV) can be observed for the Mg 2s peak in Figure S13b. This might be correlated with the formation of Li–Mg alloys as in reaction 4; however, no clear conclusions can be drawn from these data due to the weak signal. On the other hand, the alloy reaction between Ni and Cu species (reaction 5) is supported by the Ni 2p spectrum in Figure S13c, where the peak at ca. 851 eV can be assigned to Ni in the metallic state (blue line in Figure S13c).52 The peaks at 871.3 eV and 859.5 eV are assigned to the characteristic 2p1/2 (lilac line in Figure S13c) and 2p3/2 (cyan line in Figure S13c) spin-orbit levels with their related shake-up satellites at 878.1 eV and 863.6 eV, respectively. The additional subpeaks detected after fitting are correlated to the complex main lines splitting due to multiple contributions, plasmon loss structures and charge transfer ligand effects [50,51]. Additionally, the peak at 56.4 eV in the Li 1s spectrum is assigned to Li3PO4 [71], confirming the conversion reaction hypothesised in reaction 5 (Figure S13d). An asymmetry can also be observed at ca. 55 eV, indicating that a fraction of Li could also be present as a Li–Mg alloy (reaction 4) [72].
The complexity of the electrochemical lithiation/de-lithiation reaction of MNP was also explored using ex-situ ATR-FTIR analysis on electrodes cycled to different states of charge (1–5), as shown in Figure 10. As already observed during the analysis of MNP working electrodes using an Mg-based electrolyte, all the spectra are characterised by the intramolecular stretching (ν3 + ν1) and bending (ν4 + ν2) vibrations of the basal orthophosphate units, as well as the asymmetric stretching of the P–O bond of the pyrophosphate impurity (724–726 cm−1). The small shift of the stretching bands in the (ν3 + ν1) region is consistent with the formation of sarcopside-Mg3(PO4)2 and Li3PO4 upon de-lithiation. Specifically, it is possible to correlate the stretching lines (cm−1) from the pristine (1) to the discharged electrode (4): (1085, 1077, 1061, 1046) cm−1 → (1066, 1056, 1044, 1027, 1014) cm−1 and (984, 906, 880) cm−1 → (875, 834) cm−1. Moreover, the shift of the bending line from 593 cm−1 to 577–556 cm−1 is detected for the bending modes of the selected electrodes. An interesting aspect is also the broadening of all the stretching and bending bands during the discharge reaction, which produce the loss of some lines, such as at 984 cm−1, and 633 cm−1 in the pristine electrode. This would be consistent with the formation of poorly crystalline Li3PO4.
A complex infrared spectrum is obtained for the electrode discharged up to 1.0 V vs. Li+/Li in the stretching (1075–1015 cm−1 and 902–820 cm−1) and bending (582–413 cm−1) regions. In fact, the splitting of the stretching and bending bands of the pristine electrode, as well as the presence of a fine pattern in the far-IR region, are the consequences of the change in the MNP structure. The electrochemical formation of sarcopside-Mg3(PO4)2 from the conversion of MNP induces the coupling of the fundamental stretching (ca. 1000 cm−1) and bending (ca. 450 cm−1) vibrations of the phosphate group with the Mg–O and Ni–O units (correlation effect) [73,74]. Additional bands are present at 1191 cm−1 and 771 cm−1 in the electrode discharged up to 0.01 V vs. Li+/Li. These new characteristic bands may be related to the vibrational modes of the P2O74– and P3O105– groups, which are indicative of a degree of condensation in the phosphate species and are often seen in amorphous phosphates.43 Considering the infrared spectrum of the fully charged electrode (5), shifting and broadening effects are also observed for the vibrational modes, suggesting that the poorly crystalline/amorphous phosphate does not participate in the electrochemical reaction. The formation of a poorly crystalline/amorphous phosphate phase is also confirmed by the bands at 1066–992 cm−1, as already observed for the electrode discharged up to 0.01 V vs. Li+/Li (4). Considering the far-IR region for all the analysed samples, the bands at 579–440 cm−1 (curve 3), 577–417 cm−1 (curve 4) and 557–417 cm−1 (curve 5) can also be assigned to the formation of the poorly crystalline/amorphous phosphate. In addition, the overlap between the fundamental vibrations of the Ni–Cu metal bond and the PO43– unit may be observed in the far-IR region for the working electrodes at different states of charge [65].
The experiments with the Li metal counter electrode show that a practical discharge capacity of 600 mAh/g was attained, which is in good agreement with the theoretical capacity of 597 mA h g−1 associated with the storage of 7 moles of Li+ per formula unit of MNP. However, when the Mg-electrolyte with AC as the counter electrode is used, a practical capacity of 92 mA h g−1 was attained, although the theoretical capacity is 255.7 mA h g−1 for the formation of sarcopside-Mg3(PO4)2 at the end of the discharge process. One might predict that if MNP could be cycled against pure Mg without passivation of the anode surface, a higher discharge capacity could be achieved in the first cycle, corresponding to the formation of Mg(PO4)2 as one of the end products after full discharge. In fact, the lower capacity of the cells with AC as the counter electrode is ascribed to different thermodynamic and kinetic properties of AC and not to the amount of charged species in the electrolyte. For example, using 175 µL of Mg-electrolyte, 8.8 × 10⁻² mmol of Mg2+ cations are available for the electrochemical reaction. The practical discharge capacity of 92 mA h g−1 corresponds to the consumption of 8.6 × 10⁻³ mmol of Mg2+, which is ca. 10% of the total amount of Mg2+ cations in the electrolyte. However, regardless of the choice of AC or Mg-metal as the counter electrode, the charge capacity of MNP is likely to be limited as the conversion reaction of MNP is irreversible, as in the case of Li.

3. Discussion

A mixed-cation, olivine-related compound, (Mg0.5Ni0.5)3(PO4)2, was synthesized via a solid-state method using MgO, NiO and NH4H2PO4 as precursors. A detailed structural, morphological and compositional characterization of the pristine MNP powder was performed in the first step. Electrochemical cells using activated carbon and lithium were constructed in order to investigate for the first time the electrochemical reaction mechanisms of both divalent (Mg2+) and monovalent (Li+) cations with MNP. Ex-situ characterization of the active electrode material cycled against Li showed that MNP reacts with Li+ cations via an irreversible multistep conversion reaction to produce amorphous Li3PO4 and Cu–Ni alloy phases. Although a conversion reaction could also be observed when the MNP active material is cycled against AC, the extent of the reaction is much less, which is likely due to the thermodynamic and kinetic properties of the AC counter electrode. MNP was also tested as an active electrode material for Mg2+ cations using the Mg-electrolyte and AC counter electrode. In these cells, a conversion reaction could also be confirmed with sarcopside-Mg3(PO4)2 and Cu–Ni alloy as the final reaction products, using ex-situ characterization techniques. The conversion reactions with Li and Mg occur as the result of an ionic exchange between Ni2+ and the respective charge carrier (Li+ or Mg2+). According to the proposed conversion mechanism, we believe that it would be possible to achieve a specific discharge capacity approaching 255.7 mA h g−1 after the first discharge cycle, which is significantly higher than the 92 mA h g−1 capacity that was achieved with the AC counter electrode when a non-passivating electrolyte (e.g., all phenyl complex) was used. Therefore, in order to further investigate the conversion reaction in Mg chemistry, research should focus on finding electrolytes that do not passivate the Mg-anode surface but which are, at the same time, stable against oxidation at the higher working potentials of the cathode. However, similar to the Li-cell case, a low initial coulombic efficiency is expected in the first charge cycle, as the conversion reaction is irreversible. Nevertheless, the dearth of studies of materials for potential MIBs means that there is much to explore before suitable materials with smaller particle sizes and higher performance characteristics can be found. Therefore, with this study on the fundamental working mechanisms of MNP, the authors hope to influence the design and discovery of better-performing systems.

4. Materials and Methods

4.1. MNP Synthesis

Samples of (Mg0.5Ni0.5)3(PO4)2 (MNP) were prepared by the solid-state reaction of MgO (Sigma Aldrich, Germany, ≥ 99% trace metals basis, 325 mesh), NH4H2PO4 (Sigma Aldrich, Germany, ACS reagent, ≥ 98%), and NiO (Sigma Aldrich, Germany, 99.99% trace metals basis). Before use, the MgO was heat-treated at 1000 °C for 2 days in air to convert surface hydroxides to pure oxide, as confirmed by the X-ray diffraction pattern shown in Figure S14. Stoichiometric amounts of the precursors were ball milled for 30 min at 300 rpm using a zirconia bowl and balls with ethanol as the dispersing medium. The mixtures were dried, then placed into a Pt crucible and heated at 650 °C for 12 h in air. After heating, the samples were cooled to room temperature over a period of ca. 12 h and then removed from the furnace. The resulting samples were ground in an agate mortar to a fine powder, pelletised (15 mm diameter) at 100 bar and heat-treated again at 1100 °C for 24 h in air.

4.2. Materials Characterisation

Structural characterisation was carried out by powder X-ray diffraction (XRD) using a PANalytical X’Pert Pro diffractometer with Cu-Kα radiation (λ = 1.5418 Å) in flat plate Bragg–Brentano geometry. The XRD measurements were performed in the 2θ range from 10° to 120°, with a step size of 0.0334° and an effective count time of 400 s per step. Rietveld method was used to refine the collected XRD patterns using the GSAS suite of programmes [75], using (Mg0.4Ni0.6)3(PO4)2 [36], NiO [76], Cu [57], farringdonite Mg3(PO4)2 [77], Mg2P2O7 [78] and Li3PO4 [67] phases as the initial models for the refinements. The crystal and refinement parameters for the pristine and all the cycled electrodes are included in the SI.
Scanning electron microscopy (SEM) was performed to investigate the morphology of the MNP powder using a Carl Zeiss Supra 40 instrument with Everhart–Thornley (ETD) and Through-Lens (TLD) detectors. A primary electron beam with an energy of 5 keV was selected for the imaging. Additionally, the particle size distribution of the final MNP powder was determined using a CILAS 1190 QUANTACHROME analyser. Before the measurement, the powder was dispersed in distilled water with Disperbyk-190 (BYK Additives & Instruments) and sonicated for 15 min.
Fourier transform infrared (FTIR) spectroscopy measurements on MNP were carried out using a PerkinElmer Spectrum Two spectrometer with the attenuated total reflectance (ATR) technique. The middle infrared spectrum was collected in the 1200–400 cm−1 range after 256 scans at 4 cm−1 resolution on the as-prepared orthophosphate.
X-ray photoelectron spectroscopy (XPS) was carried out using a Nexsa, Thermofisher spectrometer with an Al Kα radiation at 72 W. Samples were analysed prior to and after an etching step (monoatomic Ar beam, 4000 eV, 30 s, high current). High-resolution spectra (step size 0.1 eV) were collected with 40 passes at pass energies of 50 eV. Data were fitted with Avantage v5.9925 Build 06702 software, utilising the Simplex fitting algorithm with Gauss–Lorentz Product.

4.3. Electrochemical Tests

Working electrodes were prepared by mixing 75 wt.% of the MNP powder, 15 wt.% carbon black (Super C 45, TIMCAL) and 10 wt.% polyvinylidene fluoride as a binder (PVDF, SOLEF® 5130/1001) in 1-methyl-2-pyrrolidinone (Sigma Aldrich, Darmstadt, Germany, anhydrous, 99.5% purity) to produce a slurry. The slurry was homogenised by magnetic stirring overnight at room temperature and then deposited onto copper (Cu) current collectors using a blade gap of 120 µm. After coating, the electrodes were dried under vacuum at 80 °C for 12 h (dry thickness of 85 µm) and then at 120 °C for 2 h. The electrodes were then cut into discs with a diameter of 15 mm and dried again at 120 °C for 12 h under vacuum before being transferred to an Ar-filled glove box. Approximately 5 mg of active material was loaded on each electrode. Subsequently, CR2032 and CR2016 coin cells were assembled in order to investigate the reactions of the MNP active materials with Mg2+ and Li+ ions. The magnesium cells were assembled using activated carbon, AC (Kynol Europa Gmbh, Hamburg, Germany, ACC-5092-20, 0.55 mm of thickness with an average mass of 25 mg) as the counter electrode, a membrane separator (Celgard 2500, United States) and 0.5 M Mg(ClO4)2 (anhydrous, ACS, granular) in acetonitrile, (anhydrous, 99.8% purity) as the electrolyte, which from now on will be referred to as “Mg-electrolyte”. The Mg(ClO4)2 salt was dried at 70 °C under a vacuum overnight before the preparation of the electrolyte solution, while the acetonitrile was dried on a molecular sieve (4 Å) for one day. Li half cells were constructed using metallic Li (LTS Research) as the counter electrode, a membrane separator (Celgard 2500, United States) and 1 M LiPF6 in ethylene carbonate:ethyl methyl carbonate = 3:7 w/w with 2 wt% vinylene carbonate (Soulbrain, Toulouse, France, PuriEl Battery Electrolyte) as the electrolyte, which will now be referred to as “Li-electrolyte”. Additional cells were also constructed using AC as the counter electrode with the Li-based electrolyte.
Based on the work of Ruch et al. [79], the AC reference electrode potentials were estimated as 3.0 V vs. Li+/Li and 2.4 V vs. Mg2+/Mg. [79] As reported in that work, AC can store charged species via an electrolytic double-layer due to its large surface area (1800 m2 g−1) and electronic conductivity. This results in a change of the Galvani potential of the counter electrode during the course of the cell reaction [79,80,81,82]. The combination of an MNP working electrode, which may store charged species via Faradaic processes, with an AC anode, therefore, leads to a hybrid capacitive system. The proposed working mechanism for such a system is detailed below. During discharge, the AC counter electrode becomes electron-poor, thereby acquiring a net positive Galvani charge, and the ClO4 anions in the electrolyte migrate toward the AC/electrolyte interface to form an electrolytic double layer. Simultaneously, the MNP working electrode accepts Mg2+ cations from the electrolyte and electrons from the AC counter electrode for the Faradaic reaction. As the reaction proceeds, the measured cell potential E = φWorking electrodeφAC electrode becomes more negative as the electrochemical potential of the AC counter-electrode, φAC electrode, becomes increasingly positive and that of the working electrode, φWorking electrode, becomes increasingly negative. Considering the charge step, the electrons are removed from the working electrode via the external circuit, and, at the same time, Mg2+ ions diffuse across the working/electrolyte interface into the electrolyte. Simultaneously, the ClO4 anions of the electrolytic double layer re-enter the bulk electrolyte.
Cyclic voltammograms were recorded, after one hour of rest, for MNP in the potential range of −2.4 V- 0.0 V vs. AC and 0.01 V-2.9 V vs. Li+/Li at a scan rate of 70 µV s−1 on a Biologic P150 instrument. Galvanostatic cycling with potential limitation (GCPL) was carried out using MACCOR Series 4000 and Biologic P150 instruments, with metallic Li (0.01–2.9 V vs. Li+/Li with C/10 current rate) and AC (−2.4–−0.8 V vs. AC with specific current of 2 mA g−1) used as counter electrodes, respectively.

4.4. Ex-Situ Characterisation

After cycling, the cells were disassembled in an Ar-filled glove box to collect the electrodes. These cycled electrodes were washed with acetonitrile if cycled using the Mg-electrolyte or dimethyl carbonate when tested using the Li-electrolyte. After drying, the electrodes were transferred under Ar to the diffractometer for XRD measurements using an airtight half-dome sample holder equipped with a silicon mono-crystal substrate (Bruker). ATR-FTIR and XPS analyses were also performed on the pristine and cycled electrodes.

Supplementary Materials

The following are available online at https://www.mdpi.com/article/10.3390/batteries9070342/s1, Table S1. Crystal and refinement parameters for MNP at room temperature., Figure S1. P 2p X-ray photoelectron spectra for MNP powder (a) before and (b) after Ar-ion etching., Figure S2. Charge (red line) and discharge (black line) curves for MNP active material, coated on Al and cycled in a Li-half cell with Li-electrolyte between 4.5 V and 0.25 V vs. Li+/Li. The inset shows the poor charging behaviour of MNP (red line) up to 4.5 V vs. Li+/Li., Figure S3. Cyclic voltammograms of MNP (solid-line) and Cu (dashed) working electrodes were recorded at a scan rate of 0.07 mV s−1 using AC as the counter electrode and Mg-electrolyte. Irregular effects associated with an interaction between the Cu current collector and the electrolyte were observed at ca. −0.75 V vs. AC and −0.3 V vs. AC for the MNP and Cu working electrodes, respectively. Therefore, further galvanostatic discharge-charge cycling of the MNP working electrode was performed in the voltage window between −2.4 V and −0.8 V vs. AC., Figure S4. Charge and discharge curves with constant voltage step for MNP vs. AC-Mg electrolyte cell., Table S2. Crystal and refinement parameters for the MNP pristine electrode. Table S3. Crystal and refinement parameters for the MNP active material electrode after discharging up to −2.4 V vs. AC and after charging up to −0.8 V vs. AC using Mg-electrolyte. Table S3. Crystal and refinement parameters for the MNP active material electrode after discharging up to −2.4 V vs. AC and after charging up to −0.8 V vs. AC using Mg-electrolyte., Figure S5. P 2p, Mg 1s and Ni 2p X-ray photoelectron spectra of MNP active material in (a, c and e, respectively) pristine and (b, d and f, respectively) discharged up to −2.4 V vs. AC electrodes using Mg-electrolyte., Figure S6. Discharge curves for MNP active material coated on Cu (red line) and Al (green line) current collectors cycled in a Li-half cell with Li-electrolyte., Figure S7. Fitted ex-situ XRD pattern of MNP active material discharged up to 1.0 vs. Li+/Li in Li-electrolyte. Observed (black dots), calculated (red line), and difference (blue line) profiles are shown. Reflection positions for MNP (pink bars), Cu (orange bars), Cu–Ni alloy (blue bars) and sarcopside-Mg3(PO4)2 (dark yellow bars) are indicated., Figure S8. Fitted ex-situ XRD pattern of MNP active material discharged up to 0.8 vs. Li+/Li in Li-electrolyte. Observed (black dots), calculated (red line), and difference (blue line) profiles are shown. Reflection positions for Cu–Ni alloy (blue bars) are indicated., Figure S9. Fitted ex-situ XRD pattern of MNP active material discharged up to 0.01 vs. Li+/Li in Li-electrolyte. Observed (black dots), calculated (red line), and difference (blue line) profiles are shown. Refection positions for Li3PO4 (cyan bars), Cu (orange bars) and Cu–Ni alloy (blue bars) are indicated. The strongest reflections for the Li3PO4 phase are reported in brackets., Figure S10. Fitted ex-situ XRD pattern of MNP active material charged up to 2.9 vs. Li+/Li in Li-electrolyte. Observed (black dots), calculated (red line), and difference (blue line) profiles are shown. Reflection positions for Li3PO4 (cyan bars), Cu (orange bars) and Cu–Ni alloy (blue bars) are indicated., Table S4. Crystal and refinement parameters for the MNP active material discharged up to 1.0 vs. Li+/Li, discharged up to 0.8 vs. Li+/Li and fully discharged at 0.01 V vs. Li+/Li in Li-electrolyte., Table S5. Crystal and refinement parameters for the MNP active material charged up to 2.9 vs. Li+/Li in Li-electrolyte., Figure S11. Ex-situ XRD patterns comparing the (1 1 1) and (0 0 2) reflections of the Cu current collector for the MNP electrode at the open circuit voltage (3.0 V vs. Li+/Li, black curve), discharged up to 1.0 vs. Li+/Li (pink curve), discharged up to 0.8 vs. Li+/Li (green curve), fully discharged (0.01 V vs. Li+/Li) and fully charged (2.9 V vs. Li+/Li) states using Li-electrolyte., Figure S12. Specific discharge (green triangles) and charge (pink triangles) capacities over 50 cycles for discharge curves for MNP active material cycled in a Li-half cell with Li-electrolyte., Figure S13. (a) P 2p, (b) Mg 1s, (c) Ni 2p and (d) Li 1s X-ray photoelectron spectra for MNP active material discharged up to 0.01 V vs. Li+/Li in Li-electrolyte., Figure S14. Fitted XRD pattern of MgO precursor. Observed (black dots), calculated (red line), and difference (blue line) profiles are shown. Reflection positions for MgO (green bars) are indicated.

Author Contributions

Conceptualization, M.R., D.M.C. and I.A.; Methodology, M.R., D.M.C. and I.A.; Formal analysis, M.R., Y.S., A.M., D.M.C. and I.A.; Data curation, M.R., Y.S. and A.M.; Writing—original draft, M.R.; Writing—review & editing, M.R., Y.S., A.M., R.H., D.M.C. and I.A.; Supervision, M.J., D.M.C. and I.A. All authors have read and agreed to the published version of the manuscript.

Funding

This research was funded by the Austrian Ministry for Climate Action, Environment, Energy, Mobility, Innovation and Technology.

Data Availability Statement

New data were created or analyzed in this study. Data sharing is not applicable to this article.

Acknowledgments

The authors would like to acknowledge A. Paolella (AIT) for the fruitful discussions.

Conflicts of Interest

The authors declare no conflict of interest.

References

  1. Word Economic Situation and Prospects. Available online: https://unctad.org/system/files/official-document/wesp2019_en.pdf (accessed on 3 April 2023).
  2. Skundin, A.M.; Kulova, T.L.; Yaroslavtsev, A.B. Sodium-Ion Batteries (a Review). Russ. J. Electrochem. 2018, 54, 113–152. [Google Scholar] [CrossRef]
  3. Gummow, R.J.; Vamvounis, G.; Kannan, M.B.; He, Y. Calcium-Ion Batteries: Current State-of-the-Art and Future Perspectives. Adv. Mater. 2018, 30, 1801702. [Google Scholar] [CrossRef] [PubMed]
  4. Selvakumaran, D.; Pan, A.; Liang, S.; Cao, G. A review on recent developments and challenges of cathode materials for rechargeable aqueous Zn-ion batteries. J. Mater. Chem. A 2019, 7, 18209–18236. [Google Scholar] [CrossRef]
  5. Leisegang, T.; Meutzner, F.; Zschornak, M.; Münchgesang, W.; Schmid, R.; Nestler, T.; Eremin, R.A.; Kabanov, A.A.; Blatov, V.A.; Meyer, D.C. The Aluminum-Ion Battery: A Sustainable and Seminal Concept? Front. Chem. 2019, 7, 268. [Google Scholar] [CrossRef] [Green Version]
  6. United Nations Environment Programme, Recycling Rates of Metals: A Status Report. Available online: https://wedocs.unep.org/20.500.11822/8702 (accessed on 3 April 2023).
  7. Davidson, R.; Verma, A.; Santos, D.; Hao, F.; Fincher, C.; Xiang, S.; Van Buskirk, J.; Xie, K.; Pharr, M.; Mukherjee, P.P.; et al. Formation of Magnesium Dendrites during Electrodeposition. ACS Energy Lett. 2019, 4, 375–376. [Google Scholar] [CrossRef]
  8. Yoo, H.D.; Shterenberg, I.; Gofer, Y.; Gershinsky, G.; Pour, N.; Aurbach, D. Mg rechargeable batteries: An on-going challenge. Energy Environ. Sci. 2013, 6, 2265–2279. [Google Scholar] [CrossRef]
  9. Huie, M.M.; Bock, D.C.; Takeuchi, E.S.; Marschilok, A.C.; Takeuchi, K.J. Cathode materials for magnesium and magnesium-ion based batteries. Coord. Chem. Rev. 2015, 287, 15–27. [Google Scholar] [CrossRef] [Green Version]
  10. Kuang, C.; Zeng, W.; Li, Y. A review of Electrode for Rechargeable Magnesium Ion Batteries. J. Nanosci. Nanotechnol. 2019, 19, 12–25. [Google Scholar] [CrossRef]
  11. Aurbach, D.; Lu, Z.; Schechter, A.; Gofer, Y.; Gizbar, H.; Turgeman, R.; Cohen, Y.; Moshkovich, M.; Levi, E. Prototype systems for rechargeable magnesium batteries. Nature 2000, 407, 724. [Google Scholar] [CrossRef]
  12. Levi, M.D.; Lancry, E.; Gizbar, H.; Lu, Z.; Levi, E.; Gofer, Y.; Aurbach, D. Kinetic and Thermodynamic Studies of Mg2+ and Li+ Ion Insertion into the Mo6S8 Chevrel Phase. J. Electrochem. Soc. 2004, 151, A1044. [Google Scholar] [CrossRef]
  13. Ichitsubo, T.; Yagi, S.; Nakamura, R.; Ichikawa, Y.; Okamoto, S.; Sugimura, K.; Kawaguchi, T.; Kitada, A.; Oishi, M.; Doi, T.; et al. A new aspect of Chevrel compounds as positive electrodes for magnesium batteries. J. Mater. Chem. A 2014, 2, 14858–14866. [Google Scholar] [CrossRef]
  14. Novák, P.; Desilvestro, J. Electrochemical Insertion of Magnesium in Metal Oxides and Sulfides from Aprotic Electrolytes. J. Electrochem. Soc. 1993, 140, 140–144. [Google Scholar] [CrossRef]
  15. Sai Gautam, G.; Canepa, P.; Abdellahi, A.; Urban, A.; Malik, R.; Ceder, G. The Intercalation Phase Diagram of Mg in V2O5 from First-Principles. Chem. Mater. 2015, 27, 3733–3742. [Google Scholar] [CrossRef] [Green Version]
  16. Sai Gautam, G.; Canepa, P.; Richards, W.D.; Malik, R.; Ceder, G. Role of Structural H2O in Intercalation Electrodes: The Case of Mg in Nanocrystalline Xerogel-V2O5. Nano Lett. 2016, 16, 2426–2431. [Google Scholar] [CrossRef] [Green Version]
  17. Rasul, S.; Suzuki, S.; Yamaguchi, S.; Miyayama, M. Manganese oxide octahedral molecular sieves as insertion electrodes for rechargeable Mg batteries. Electrochim. Acta 2013, 110, 247–252. [Google Scholar] [CrossRef]
  18. Nam, K.W.; Kim, S.; Lee, S.; Salama, M.; Shterenberg, I.; Gofer, Y.; Kim, J.S.; Yang, E.; Park, C.S.; Kim, J.S.; et al. The High Performance of Crystal Water Containing Manganese Birnessite Cathodes for Magnesium Batteries. Nano Lett. 2015, 15, 4071–4079. [Google Scholar] [CrossRef]
  19. Jain, A.; Ong, S.P.; Hautier, G.; Chen, W.; Richards, W.D.; Dacek, S.; Cholia, S.; Gunter, D.; Skinner, D.; Ceder, G.; et al. Commentary: The Materials Project: A materials genome approach to accelerating materials innovation. APL Mater. 2013, 1, 11002. [Google Scholar] [CrossRef] [Green Version]
  20. Spahr, M.E.; Novák, P.; Haas, O.; Nesper, R. Electrochemical insertion of lithium, sodium, and magnesium in molybdenum(VI) oxide. J. Power Sources 1995, 54, 346–351. [Google Scholar] [CrossRef]
  21. Dueber, R.E.; Fleetwood, J.M.; Dickens, P.G. The insertion of magnesium into α-U3O8. Solid State Ion. 1992, 50, 329–337. [Google Scholar] [CrossRef]
  22. Levi, E.; Mikhael, L.; Chasid, O.; Aurbach, D. A review on the problems of the solid state ions diffusion in cathodes for rechargeable Mg batteries. J. Electroceramics 2009, 22, 13–19. [Google Scholar] [CrossRef]
  23. Levi, E.; Gofer, Y.; Aurbach, D. On the Way to Rechargeable Mg Batteries: The Challenge of New Cathode Materials. Chem. Mater. 2010, 22, 860–868. [Google Scholar] [CrossRef]
  24. Gregory, T.D.; Hoffman, R.J.; Winterton, R.C. Nonaqueous Electrochemistry of Magnesium: Applications to Energy Storage. J. Electrochem. Soc. 1990, 137, 775–780. [Google Scholar] [CrossRef]
  25. Canepa, P.; Sai Gautam, G.; Hannah, D.C.; Malik, R.; Liu, M.; Gallagher, K.G.; Persson, K.A.; Ceder, G. Odyssey of Multivalent Cathode Materials: Open Questions and Future Challenges. Chem. Rev. 2017, 117, 4287–4341. [Google Scholar] [CrossRef] [PubMed]
  26. Padhi, A.K. Effect of Structure on the Fe3+/Fe2+ Redox Couple in Iron Phosphates. J. Electrochem. Soc. 1997, 144, 1609. [Google Scholar] [CrossRef]
  27. Padhi, A.K.; Nanjundaswamy, K.S.; Goodenough, J.B. Phospho-olivines as Positive-Electrode Materials for Rechargeable Lithium Batteries. J. Electrochem. Soc. 1997, 144, 1188–1194. [Google Scholar] [CrossRef]
  28. Aziam, H.; Tamraoui, Y.; Manoun, B.; Alami, J.; Saadoune, I. Nickel Orthophosphate Ni3(PO4)2: New Conversion-type Anode Material for Lithium ion Batteries. In Proceedings of the 6th International Renewable and Sustainable Energy Conference (IRSEC), Rabat, Morocco, 5–8 December 2018; pp. 1–4. [Google Scholar] [CrossRef]
  29. Masquelier, C.; Croguennec, L. Polyanionic (Phosphates, Silicates, Sulfates) Frameworks as Electrode Materials for Rechargeable Li (or Na) Batteries. Chem. Rev. 2013, 113, 6552–6591. [Google Scholar] [CrossRef]
  30. Zhang, R.; Ling, C. Unveil the Chemistry of Olivine FePO4 as Magnesium Battery Cathode. ACS Appl. Mater. Interfaces 2016, 8, 18018–18026. [Google Scholar] [CrossRef] [PubMed]
  31. Makino, K.; Katayama, Y.; Miura, T.; Kishi, T. Electrochemical insertion of magnesium to Mg0.5Ti2(PO4)3. J. Power Sources 2001, 99, 66–69. [Google Scholar] [CrossRef]
  32. Zhong, G.; Bai, J.; Duchesne, P.N.; McDonald, M.J.; Li, Q.; Hou, X.; Tang, J.A.; Wang, Y.; Zhao, W.; Gong, Z.; et al. Copper Phosphate as a Cathode Material for Rechargeable Li Batteries and Its Electrochemical Reaction Mechanism. Chem. Mater. 2015, 27, 5736–5744. [Google Scholar] [CrossRef]
  33. Zhao, W.; Zhong, G.; Zheng, J.; Zheng, J.; Song, J.; Gong, Z.; Chen, Z.; Zheng, G.; Jiang, Z.; Yang, Y. Insights into the Electrochemical Reaction Mechanism of a Novel Cathode Material CuNi2(PO4)2/C for Li-Ion Batteries. ACS Appl. Mater. Interfaces 2018, 10, 3522–3529. [Google Scholar] [CrossRef]
  34. Väyrynen, A.; Salminen, J. Lithium ion battery production. J. Chem. Thermodyn. 2012, 46, 80–85. [Google Scholar] [CrossRef]
  35. Shannon, R.D. Revised effective ionic radii and systematic studies of interatomic distances in halides and chalcogenides. Acta Crystallogr. Sect. A 1976, 32, 751–767. [Google Scholar] [CrossRef]
  36. Nord, A.G.; Stefanidis, T. Crystallographic studies of some olivine-related (Ni, Mg)3(PO4)2 solid solutions. Phys. Chem. Miner. 1983, 10, 10–15. [Google Scholar] [CrossRef]
  37. Malik, M.; Chan, K.H.; Azimi, G. Review on the synthesis of LiNixMnyCo1-x-yO2 (NMC) cathodes for lithium-ion batteries. Mater. Today Energy 2022, 28, 101066. [Google Scholar] [CrossRef]
  38. Zhang, R.; Ling, C. Status and challenge of Mg battery cathode. MRS Energy Sustain. 2016, 3, 1. [Google Scholar] [CrossRef] [Green Version]
  39. Buvaneswari, G.; Varadaraju, U.V. Synthesis of New Network Phosphates with NZP Structure. J. Solid State Chem. 1999, 145, 227–234. [Google Scholar] [CrossRef]
  40. Łodziński, M.; Sitarz, M. Chemical and spectroscopic characterization of some phosphate accessory minerals from pegmatites of the Sowie Góry Mts, SW Poland. J. Mol. Struct. 2009, 924–926, 442–447. [Google Scholar] [CrossRef]
  41. Essehli, R.; El Bali, B.; Benmokhtar, S.; Fejfarová, K.; Dusek, M. Hydrothermal synthesis, structural and physico-chemical characterizations of two Nasicon phosphates: M0.50IITi2(PO4)3 (M=Mn, Co). Mater. Res. Bull. 2009, 44, 1502–1510. [Google Scholar] [CrossRef]
  42. Aatiq, A.; Marchoud, A.; Bellefqih, H.; Tigha, M.R. Structural and Raman spectroscopic studies of the two M0.50SbFe(PO4)3 (M = Mg, Ni) NASICON phases. Powder Diffr. 2017, 32, S40–S51. [Google Scholar] [CrossRef]
  43. Ait Salah, A.; Jozwiak, P.; Zaghib, K.; Garbarczyk, J.; Gendron, F.; Mauger, A.; Julien, C.M. FTIR features of lithium-iron phosphates as electrode materials for rechargeable lithium batteries. Spectrochim. Acta Part A Mol. Biomol. Spectrosc. 2006, 65, 1007–1013. [Google Scholar] [CrossRef]
  44. Salah, A.A.; Jozwiak, P.; Garbarczyk, J.; Benkhouja, K.; Zaghib, K.; Gendron, F.; Julien, C.M. Local structure and redox energies of lithium phosphates with olivine- and Nasicon-like structures. J. Power Sources 2005, 140, 370–375. [Google Scholar] [CrossRef]
  45. Felker, D.L.; Sherwood, P.M.A. Magnesium Phosphate (Mg3(PO4)2) by XPS. Surf. Sci. Spectra 2002, 9, 83–90. [Google Scholar] [CrossRef]
  46. Hart, J.N.; May, P.W.; Allan, N.L.; Hallam, K.R.; Claeyssens, F.; Fuge, G.M.; Ruda, M.; Heard, P.J. Towards new binary compounds: Synthesis of amorphous phosphorus carbide by pulsed laser deposition. J. Solid State Chem. 2013, 198, 466–474. [Google Scholar] [CrossRef]
  47. Liu, A.; Zhu, J.; Han, J.; Wu, H.; Gao, W. Influence of Phosphorus Doping Level and Acid Pretreatment on the Voltammetric Behavior of Phosphorus Incorporated Tetrahedral Amorphous Carbon Film Electrodes. Electroanalysis 2007, 19, 1773–1778. [Google Scholar] [CrossRef]
  48. Alla, S.K.; Verma, A.D.; Kumar, V.; Mandal, R.K.; Sinha, I.; Prasad, N.K. Solvothermal synthesis of CuO–MgO nanocomposite particles and their catalytic applications. RSC Adv. 2016, 6, 61927–61933. [Google Scholar] [CrossRef]
  49. Khairallah, F.; Glisenti, A.; Natile, M.M.; Galenda, A. CuO/MgO Nanocomposites by Wet Impregnation: An XPS Study. Surf. Sci. Spectra 2012, 19, 23–29. [Google Scholar] [CrossRef]
  50. Biesinger, M.C.; Payne, B.P.; Grosvenor, A.P.; Lau, L.W.M.; Gerson, A.R.; Smart, R.S.C. Resolving surface chemical states in XPS analysis of first row transition metals, oxides and hydroxides: Cr, Mn, Fe, Co and Ni. Appl. Surf. Sci. 2011, 257, 2717–2730. [Google Scholar] [CrossRef]
  51. Biesinger, M.C.; Payne, B.P.; Lau, L.W.M.; Gerson, A.R.; Smart, R.S.C. X-ray photoelectron spectroscopic chemical state quantification of mixed nickel metal, oxide and hydroxide systems. Surf. Interface Anal. 2009, 41, 324–332. [Google Scholar] [CrossRef]
  52. Grosvenor, A.P.; Biesinger, M.C.; Smart, R.S.C.; McIntyre, N.S. New interpretations of XPS spectra of nickel metal and oxides. Surf. Sci. 2006, 600, 1171–1779. [Google Scholar] [CrossRef]
  53. Mirghni, A.A.; Madito, M.J.; Oyedotun, K.O.; Masikhwa, T.M.; Ndiaye, N.M.; Ray, S.J.; Manyala, N. A high energy density asymmetric supercapacitor utilizing a nickel phosphate/graphene foam composite as the cathode and carbonized iron cations adsorbed onto polyaniline as the anode. RSC Adv. 2018, 8, 11608–11621. [Google Scholar] [CrossRef] [Green Version]
  54. Gu, Y.F.; Federici, J.F. Fabrication of a Flexible Current Collector for Lithium Ion Batteries by Inkjet Printing. Batteries 2018, 4, 42. [Google Scholar] [CrossRef] [Green Version]
  55. Muldoon, J.; Bucur, C.B.; Gregory, T. Fervent Hype behind Magnesium Batteries: An Open Call to Synthetic Chemists—Electrolytes and Cathodes Needed. Angew. Chem. Int. Ed. 2017, 56, 12064–12084. [Google Scholar] [CrossRef] [PubMed]
  56. Song, J.; Sahadeo, E.; Noked, M.; Lee, S.B. Mapping the Challenges of Magnesium Battery. J. Phys. Chem. Lett. 2016, 7, 1736–1749. [Google Scholar] [CrossRef] [PubMed]
  57. Rao, S.S.; Anantharaman, T.R. Accurate evaluation of lattice parameters of α-Brasses. Curr. Sci. 1963, 32, 262–263. [Google Scholar]
  58. Magnusson, H.; Lindberg, F.; Frisk, K. Validating Thermodynamic Description of Copper Oxides and Phosphates by Controlled Oxidation of OFP-Copper. 2015. Available online: https://skb.se/publikation/2485262/R-15-06.pdf (accessed on 3 April 2023).
  59. Annersten, H.; Nord, A.; Songstad, J.; Rundt, K.; Sjöblom, J.; Strand, T.; Sukhoverkhov, V. A High Pressure Phase of Magnesium Orthophosphate. Acta Chem. Scand. 1980, 34, 389–390. [Google Scholar] [CrossRef]
  60. Gulyaev, A.P.; Trusova, E.F. Some physical properties of some solid solutions of Al, Fe and Cu. Zh. Tekh. Fiz. 1950, 20, 66–78. [Google Scholar]
  61. Wagner, C.D.; Naumkin, A.V.; Kraut-Vass, A.; Allison, J.W.; Powell, C.J.; Rumble, J.R.J. NIST Standard Reference Database 20, Version 3.4. 2003. Available online: http:/srdata.nist.gov/xps/ (accessed on 3 April 2023).
  62. Li, Z.; Vinayan, B.P.; Jankowski, P.; Njel, C.; Roy, A.; Vegge, T.; Maibach, J.; Lastra, J.M.G.; Fichtner, M.; Zhao-Karger, Z. Multi-Electron Reactions Enabled by Anion-Based Redox Chemistry for High-Energy Multivalent Rechargeable Batteries. Angew. Chem. Int. Ed. 2020, 59, 11483–11490. [Google Scholar] [CrossRef]
  63. Harcharras, M.; Ennacici, A.; Assaaoudi, H. Vibrational spectra of double diphosphates M2SrP2O7 (M=Li, Na, K, Rb, Cs). Can. J. Anal. Sci. Spectrosc. 2001, 46, 83. [Google Scholar]
  64. Bih, H.; Saadoune, I.; Ehrenberg, H.; Fuess, H. Crystal structure, magnetic and infrared spectroscopy studies of the LiCryFe1−yP2O7 solid solution. J. Solid State Chem. 2009, 182, 821–826. [Google Scholar] [CrossRef]
  65. Nallasamy, P.; Mohan, S. Vibrational spectroscopic characterization of form II poly(vinylidene fluoride). Indian J. Pure Appl. Phys. 2005, 43, 821–827. [Google Scholar]
  66. Burba, C.M.; Frech, R. Local structure in the Li-ion battery cathode material Lix(MnyFe1−y)PO4 for 0<x≤1 and y=0.0, 0.5 and 1.0. J. Power Sources. 2007, 172, 870–876. [Google Scholar] [CrossRef]
  67. Belov, N.V.; Simonov, M.A.; Bondavera, O.S. Golden Book of Phase Transformation; OQMD: Wroclaw, Poland, 2002; pp. 1–123. [Google Scholar]
  68. Nayeb-Hashemi, A.A.; Clark, J.B.; Pelton, A.D. The Li-Mg (Lithium-Magnesium) system. Bull. Alloy Phase Diagr. 1984, 5, 365–374. [Google Scholar] [CrossRef]
  69. Julien, C.; Mauger, A.; Vijh, A.; Zaghib, K. Polyanionic Compounds as Cathode Materials. In Lithium Batteries: Science and Technology; Julien, C., Mauger, A., Vijh, A., Zaghib, K., Eds.; Springer International Publishing: Cham, Switzerland, 2016; pp. 201–268. [Google Scholar] [CrossRef]
  70. Andersson, A.M.; Abraham, D.P.; Haasch, R.; MacLaren, S.; Liu, J.; Amine, K. Surface Characterization of Electrodes from High Power Lithium-Ion Batteries. J. Electrochem. Soc. 2002, 149, A1358. [Google Scholar] [CrossRef]
  71. Nikam, R.D.; Kwak, M.; Lee, J.; Rajput, K.G.; Banerjee, W.; Hwang, H. Near ideal synaptic functionalities in Li ion synaptic transistor using Li3POxSex electrolyte with high ionic conductivity. Sci. Rep. 2019, 9, 18883. [Google Scholar] [CrossRef] [PubMed] [Green Version]
  72. Moulder, J.F.; Stickle, W.F.; Sobol, P.E.; Bomben, K.D. Handbook of X-ray Photoelectron Spectroscopy; Perkin-Elmer Corporation: Waltham, MA, USA, 1993; pp. 34–35. Available online: https://www.hic.ch.ntu.edu.tw/PES/file/%E5%8F%83%E8%80%83%E8%B3%87%E6%96%99/XPS%20handbook.pdf (accessed on 3 April 2023).
  73. Vijaya Babu, K.; Seeta Devi, L.; Veeraiah, V.; Anand, K. Structural and dielectric studies of LiNiPO4 and LiNi0.5Co0.5PO4 cathode materials for lithium-ion batteries. J. Asian Ceram. Soc. 2016, 4, 269–276. [Google Scholar] [CrossRef] [Green Version]
  74. Bellamy, L.J. The Infra-Red Spectra of Complex Molecules; Springer: Dordrecht, The Netherlands, 1975. [Google Scholar] [CrossRef]
  75. GSAS, General Strucuture Analysis System, (Report No. LAUR-86-748). Available online: https://permalink.lanl.gov/object/tr?what=info:lanl-repo/lareport/LA-UR-86-0748_REV (accessed on 3 April 2023).
  76. Rundlof, H.; Tellgren, R.; Kusigerski, V.; Spasojevic, V.; Rodic, D. Golden Book Phase Transit; OQMD: Wroclaw, Poland, 2002. [Google Scholar]
  77. Nord, A.G.; Kierkegaard, P. The crystal structure of Mg3(PO4)2. Acta Chem. Scand. 1968, 22, 1466–1474. [Google Scholar] [CrossRef]
  78. Calvo, C. Refinement of the crystal structure of beta-Mg2P2O7. Phase Transit. 1992, 38, 127–220. [Google Scholar]
  79. Ruch, P.W.; Cericola, D.; Hahn, M.; Kötz, R.; Wokaun, A. On the use of activated carbon as a quasi-reference electrode in non-aqueous electrolyte solutions. J. Electroanal. Chem. 2009, 636, 128–131. [Google Scholar] [CrossRef]
  80. Muldoon, J.; Bucur, C.B.; Gregory, T. Quest for Nonaqueous Multivalent Secondary Batteries: Magnesium and Beyond. Chem. Rev. 2014, 114, 11683–11720. [Google Scholar] [CrossRef]
  81. Yoo, H.D.; Han, S.-D.; Bayliss, R.D.; Gewirth, A.A.; Genorio, B.; Rajput, N.N.; Persson, K.A.; Burrell, A.K.; Cabana, J. “Rocking-Chair”-Type Metal Hybrid Supercapacitors. ACS Appl. Mater. Interfaces 2016, 8, 30853–30862. [Google Scholar] [CrossRef]
  82. Gershinsky, G.; Yoo, H.D.; Gofer, Y.; Aurbach, D. Electrochemical and Spectroscopic Analysis of Mg2+ Intercalation into Thin Film Electrodes of Layered Oxides: V2O5 and MoO3. Langmuir 2013, 29, 10964–10972. [Google Scholar] [CrossRef] [PubMed]
Figure 1. (a) Fitted XRD pattern of MNP powder calcined at 1100 °C. Observed (black dots), calculated (red line), and difference (blue line) profiles are shown. Reflection positions for MNP (violet bars) and NiO (light green bars) are indicated; (b) crystal structure of MNP: PO43– tetrahedra (blue), Mg/NiO6 octahedra (green). The unit cell axial directions are indicated.
Batteries 09 00342 g001
Figure 2. (a,b) SEM micrographs of the as-synthesized MNP powder, with a representative block shown in (b); (c) Particle size distribution of MNP powder calcined at 1100 °C; (d) ATR-FTIR spectrum (1200–400 cm−1) of MNP, with the stretching (ν3 + ν1) and bending (ν4 + ν2) vibrational bands for the P–O bond indicated.
Batteries 09 00342 g002
Figure 3. (a) P 2p; (b) O 1s; (c) Mg 1s; (d) Ni 2p X-ray photoelectron spectra of MNP powder.
Batteries 09 00342 g003
Figure 4. First discharge (orange line) and charge (purple line) galvanostatic curves for MNP cycled against activated carbon with Mg-electrolyte using a specific current of 2 mA g−1 as a measure of the intercalation rate.
Batteries 09 00342 g004
Figure 5. Fitted XRD pattern of the pristine MNP active material electrode. Observed (black dots), calculated (red line), and difference (blue line) profiles are shown. Reflection positions for MNP (violet bars), Cu (orange bars) and Mg2P2O7 (grey bars) are indicated.
Batteries 09 00342 g005
Figure 6. Fitted ex-situ XRD patterns of MNP active material electrodes: (a) discharged up to −2.4 V vs. AC and (b) charged up to −0.8 V vs. AC using Mg-electrolyte. Observed (black dots), calculated (red line), and difference (blue line) profiles are shown. Reflection positions for MNP (violet bars), Cu (orange bars), Cu–Ni species (blue bars), sarcopside-Mg3(PO4)2 (dark yellow bars) and Mg2P2O7 (grey bars) are indicated.
Batteries 09 00342 g006
Figure 7. Ex-situ ATR-FTIR spectra for active MNP materials with Mg-electrolyte: pristine (black), discharged up to −2.4 V vs. AC (red) and charged up to −0.8 V vs. AC (blue).
Batteries 09 00342 g007
Figure 8. Discharge (orange line) and charge (purple line) curves for MNP active material, coated on Cu and cycled in a Li-half cell with Li-electrolyte. The open-circuit voltage (1), discharged up to 1.0 V vs. Li+/Li (2), discharged up to 0.8 vs. Li+/Li (3), discharged up to 0.01 vs. Li+/Li (4) and charged up to 2.9 vs. Li+/Li (5) states are highlighted.
Batteries 09 00342 g008
Figure 9. Ex-situ XRD patterns of pristine (black curve), discharged up to 1.0 vs. Li+/Li (pink curve) and up to 0.8 vs. Li+/Li (green curve) MNP electrodes, using Li-electrolyte. The red and blue curves represent the diffraction patterns of the fully discharged (0.01 V vs. Li+/Li) and fully charged (2.9 V vs. Li+/Li) MNP active material using the same electrolyte. The black asterisks indicate the reflections of the Cu current collector.
Batteries 09 00342 g009
Figure 10. Ex-situ ATR-FTIR spectra for MNP electrodes in Li-electrolyte: pristine (black), discharged up to 1.0 V vs. Li+/Li (pink), discharged up to 0.8 V vs. Li+/Li (green), discharged up to 0.01 V vs. Li+/Li (red) and charged up to 2.9 V vs. Li+/Li (blue).
Batteries 09 00342 g010
Table 1. Refined atomic coordinates and isotropic thermal parameters for MNP at room temperature. Cell dimensions: a = 5.8860 (1) Å, b = 4.70841 (9) Å, c = 10.1717 (2) Å, β = 90.777 (1)°, space group P21/c.
AtomSitexyzOcc.Uiso (Å2)
Ni (1)2b0000.904(5)0.0241(6)
Mg (1)2b0000.096(5)0.0241(6)
Ni (2)4e0.2610(3)0.5165(6)0.2234(2)0.298(2)0.0241(6)
Mg (2)4e0.2610(3)0.5165(6)0.2234(2)0.702(2)0.0241(6)
P4e0.2457(5)0.0771(6)0.4042(3)10.0215(9)
O (1)4e0.7714(10)0.2535(10)0.1057(6)10.0139(9)
O (2)4e0.2421(12)0.3098(8)0.0447(8)10.0139(9)
O (3)4e0.4451(10)0.1926(10)0.3261(7)10.0139(9)
O (4)4e0.0374(11)0.2312(9)0.3398(7)10.0139 9)
Table 2. Summary of results from Rietveld analysis of ex-situ XRD patterns for the MNP active material cycled at different states of charge in Mg-electrolyte using AC as the counter electrode. Estimated standard deviations are given in parentheses.
Potential
[V vs. AC]
PhasesLattice ParametersCell VolumeRwpWt.%
pristine(Mg0.5Ni0.5)3(PO4)2, P21/ca = 5.8809(2) Å
b = 4.7060(3) Å
c = 10.1656(5) Å
β = 90.800(3)°
281.31(3) Å30.022642.71
Mg2P2O7, P21/ca = 6.720(4) Å
b = 8.347(5) Å
c = 9.032(5) Å
β = 113.40(4)°
464.9(2) Å33.68
Cu, Fm−3ma = 3.61438(8) Å 47.217(3) Å353.61
−2.4(Mg0.5Ni0.5)3(PO4)2, P21/ca = 5.8699(6) Å
b = 4.6995(5) Å
c = 10.150(1) Å
β = 90.76(1)°
279.96(1) Å30.034656.56
Sarcopside-Mg3(PO4)2, P21/ca = 5.844(6) Å
b = 4.770(6) Å
c = 10.54(1) Å
β = 91.80(9)°
293.7(4) Å3 4.47
Mg2P2O7, P21/ca = 6.734(8) Å
b = 8.333(9) Å
c = 9.01(1) Å
β = 113.21(8)°
464.6(4) Å34.53
Cu, Fm−3ma = 3.6118(2) Å 47.12(1) Å325.36
Cu–Ni, Fm−3ma = 3.6047(3) Å46.84(1) Å39.08
−0.8(Mg0.5Ni0.5)3(PO4)2, P21/ca = 5.8852(5) Å
b = 4.7120(4) Å
c = 10.1709(9) Å
β = 90.77(1)°
282.03(6) Å30.030856.94
Mg2P2O7, P21/ca = 6.735(6) Å
b = 8.387(7) Å
c = 9.003(8) Å
β = 113.18(7)°
467.5(3) Å35.12
Cu, Fm−3ma = 3.61334(3) Å 47.18(1) Å337.94
Table 3. Summary of results from Rietveld analysis of ex-situ XRD patterns for the MNP active material cycled at different states of charge in Li-electrolyte using Li metal as the counter electrode. Estimated standard deviations are given in parentheses.
PointPotential
[V vs. Li+/Li]
PhasesLattice ParametersCell VolumeRwpWt.%
1pristine(Mg0.5Ni0.5)3(PO4)2, P21/ca = 5.8809(2) Å
b = 4.7060(3) Å
c = 10.1656(5) Å
β = 90.800(3)°
281.31(3) Å30.022642.71
Mg2P2O7, P21/ca = 6.720(4) Å
b = 8.347(5) Å
c = 9.032(5) Å
β = 113.40(4)°
464.9(2) Å33.68
Cu, Fm−3ma = 3.61438(8) Å 47.217(3) Å353.61
21.0(Mg0.5Ni0.5)3(PO4)2, P21/ca = 5.878(2) Å
b = 4.707(2) Å
c = 10.157(3) Å
β = 90.75(2)°
281.0(2) Å30.02687.05
Sarcopside-Mg3(PO4)2, P21/ca = 5.869(7) Å
b = 4.841(6) Å
c = 10.34(1) Å
β = 92.2(1)°
293.4(4) Å343.32
Cu, Fm−3ma = 3.61800(2) Å47.36(1) Å348.00
Cu–Ni, Fm−3ma = 3.6003(2) Å46.67(2) Å31.63
30.8Cu–Ni, Fm−3ma = 3.62216(8) Å47.523(3) Å30.0170100
40.01Li3PO4, Pnmaa = 10.52(4) Å
b = 5.97(2) Å
c = 4.88(1) Å
306.(1) Å30.031314.87
Cu, Fm−3ma = 3.6156(4) Å47.27(1) Å384.37
Cu–Ni, Fm−3ma = 3.6293(7) Å47.80(3) Å30.76
52.9Li3PO4, Pnmaa = 10.49(3) Å
b = 6.13(2) Å
c = 4.93(1) Å
318.(1) Å30.03993.18
Cu, Fm−3ma = 3.6303(5) Å47.85(2) Å394.14
Cu–Ni, Fm−3ma = 3.6399(5) Å48.22(2) Å32.68
Disclaimer/Publisher’s Note: The statements, opinions and data contained in all publications are solely those of the individual author(s) and contributor(s) and not of MDPI and/or the editor(s). MDPI and/or the editor(s) disclaim responsibility for any injury to people or property resulting from any ideas, methods, instructions or products referred to in the content.

