1. Introduction
Enabling Extreme Fast Charging (XFC) is a key priority for increasing the adoption of Battery Electric Vehicles (BEVs) and decarbonizing the transportation sector. On the other hand, lithium ion (Li-ion) cell technology is currently limited in terms of charge rate capability by a side reaction known as lithium plating, in which solid metallic lithium forms in the anode, where its local potential falls below the potential of solid lithium [
1]. Lithium plating has been shown to be favored at low temperatures, high State of Charge (SOC) and high rates of charging, which leads to lower intercalation rates, larger overpotentials, values of the anode Open Circuit Potential (OCP) close to 0V (vs.
), and slower solid-phase diffusion [
2,
3,
4,
5]. While the plating reaction can be partially reversible, irreversibly plated lithium can form solid dendrites, leading to a loss in the accessible surface area of the anode active material and a loss of cyclable lithium through formation of a Solid Electrolyte Interface (SEI) [
6,
7,
8,
9].
Due to the practical challenges of measuring the onset of plating in a commercial cell in situ during fast charging, modeling and simulation resources have received considerable attention [
10,
11,
12]. Methods to predict the lithium plating and its effects on capacity loss have been created by postulating different mechanisms, rates, and locations of these phenomena [
1,
13,
14,
15,
16,
17,
18]. On the other hand, capturing the interactions between the side reactions and the lithium intercalation in the anode during the cell charging and subsequent relaxation is rather complex due to the dynamics and couplings inherent to this process. A lack of fidelity in modeling these effects ultimately limits the ability of models to predict the characteristic voltage response that can be observed from experimental tests when plating occurs.
This paper proposes a new model that predicts the cell voltage dynamics and capacity degradation induced by lithium plating and stripping via a single side reaction. Most plating models assume that the plating and stripping reaction kinetics are described by two separate equations. However, this assumption contrasts with the principles of equilibrium reactions, in that a cathodic and an anodic reaction are simultaneously present at the same electrode/electrolyte interface. According to this assumption, the lithium plating and stripping kinetics can be described using a single equation. In this study, a single equilibrium reaction is used to describe the deposition and dissolution of metallic lithium. The resulting model predicts the partial reversibility of the plating/stripping reaction, the characteristic voltage plateau during relaxation, and the capacity loss due to the Loss of Cyclable Lithium (LCL). The model is validated with experimental data to show the ability to correctly represent the process.
The paper is organized as follows:
Section 2 presents the experimental tests and data analysis for lithium plating detection and capacity loss analysis.
Section 3 illustrates the plating/stripping model.
Section 4 describes the integration of the model with a Doyle–Fuller–Newman (DFN) electrochemical model, the calibration process, and verification.
2. Experimental Tests and Results
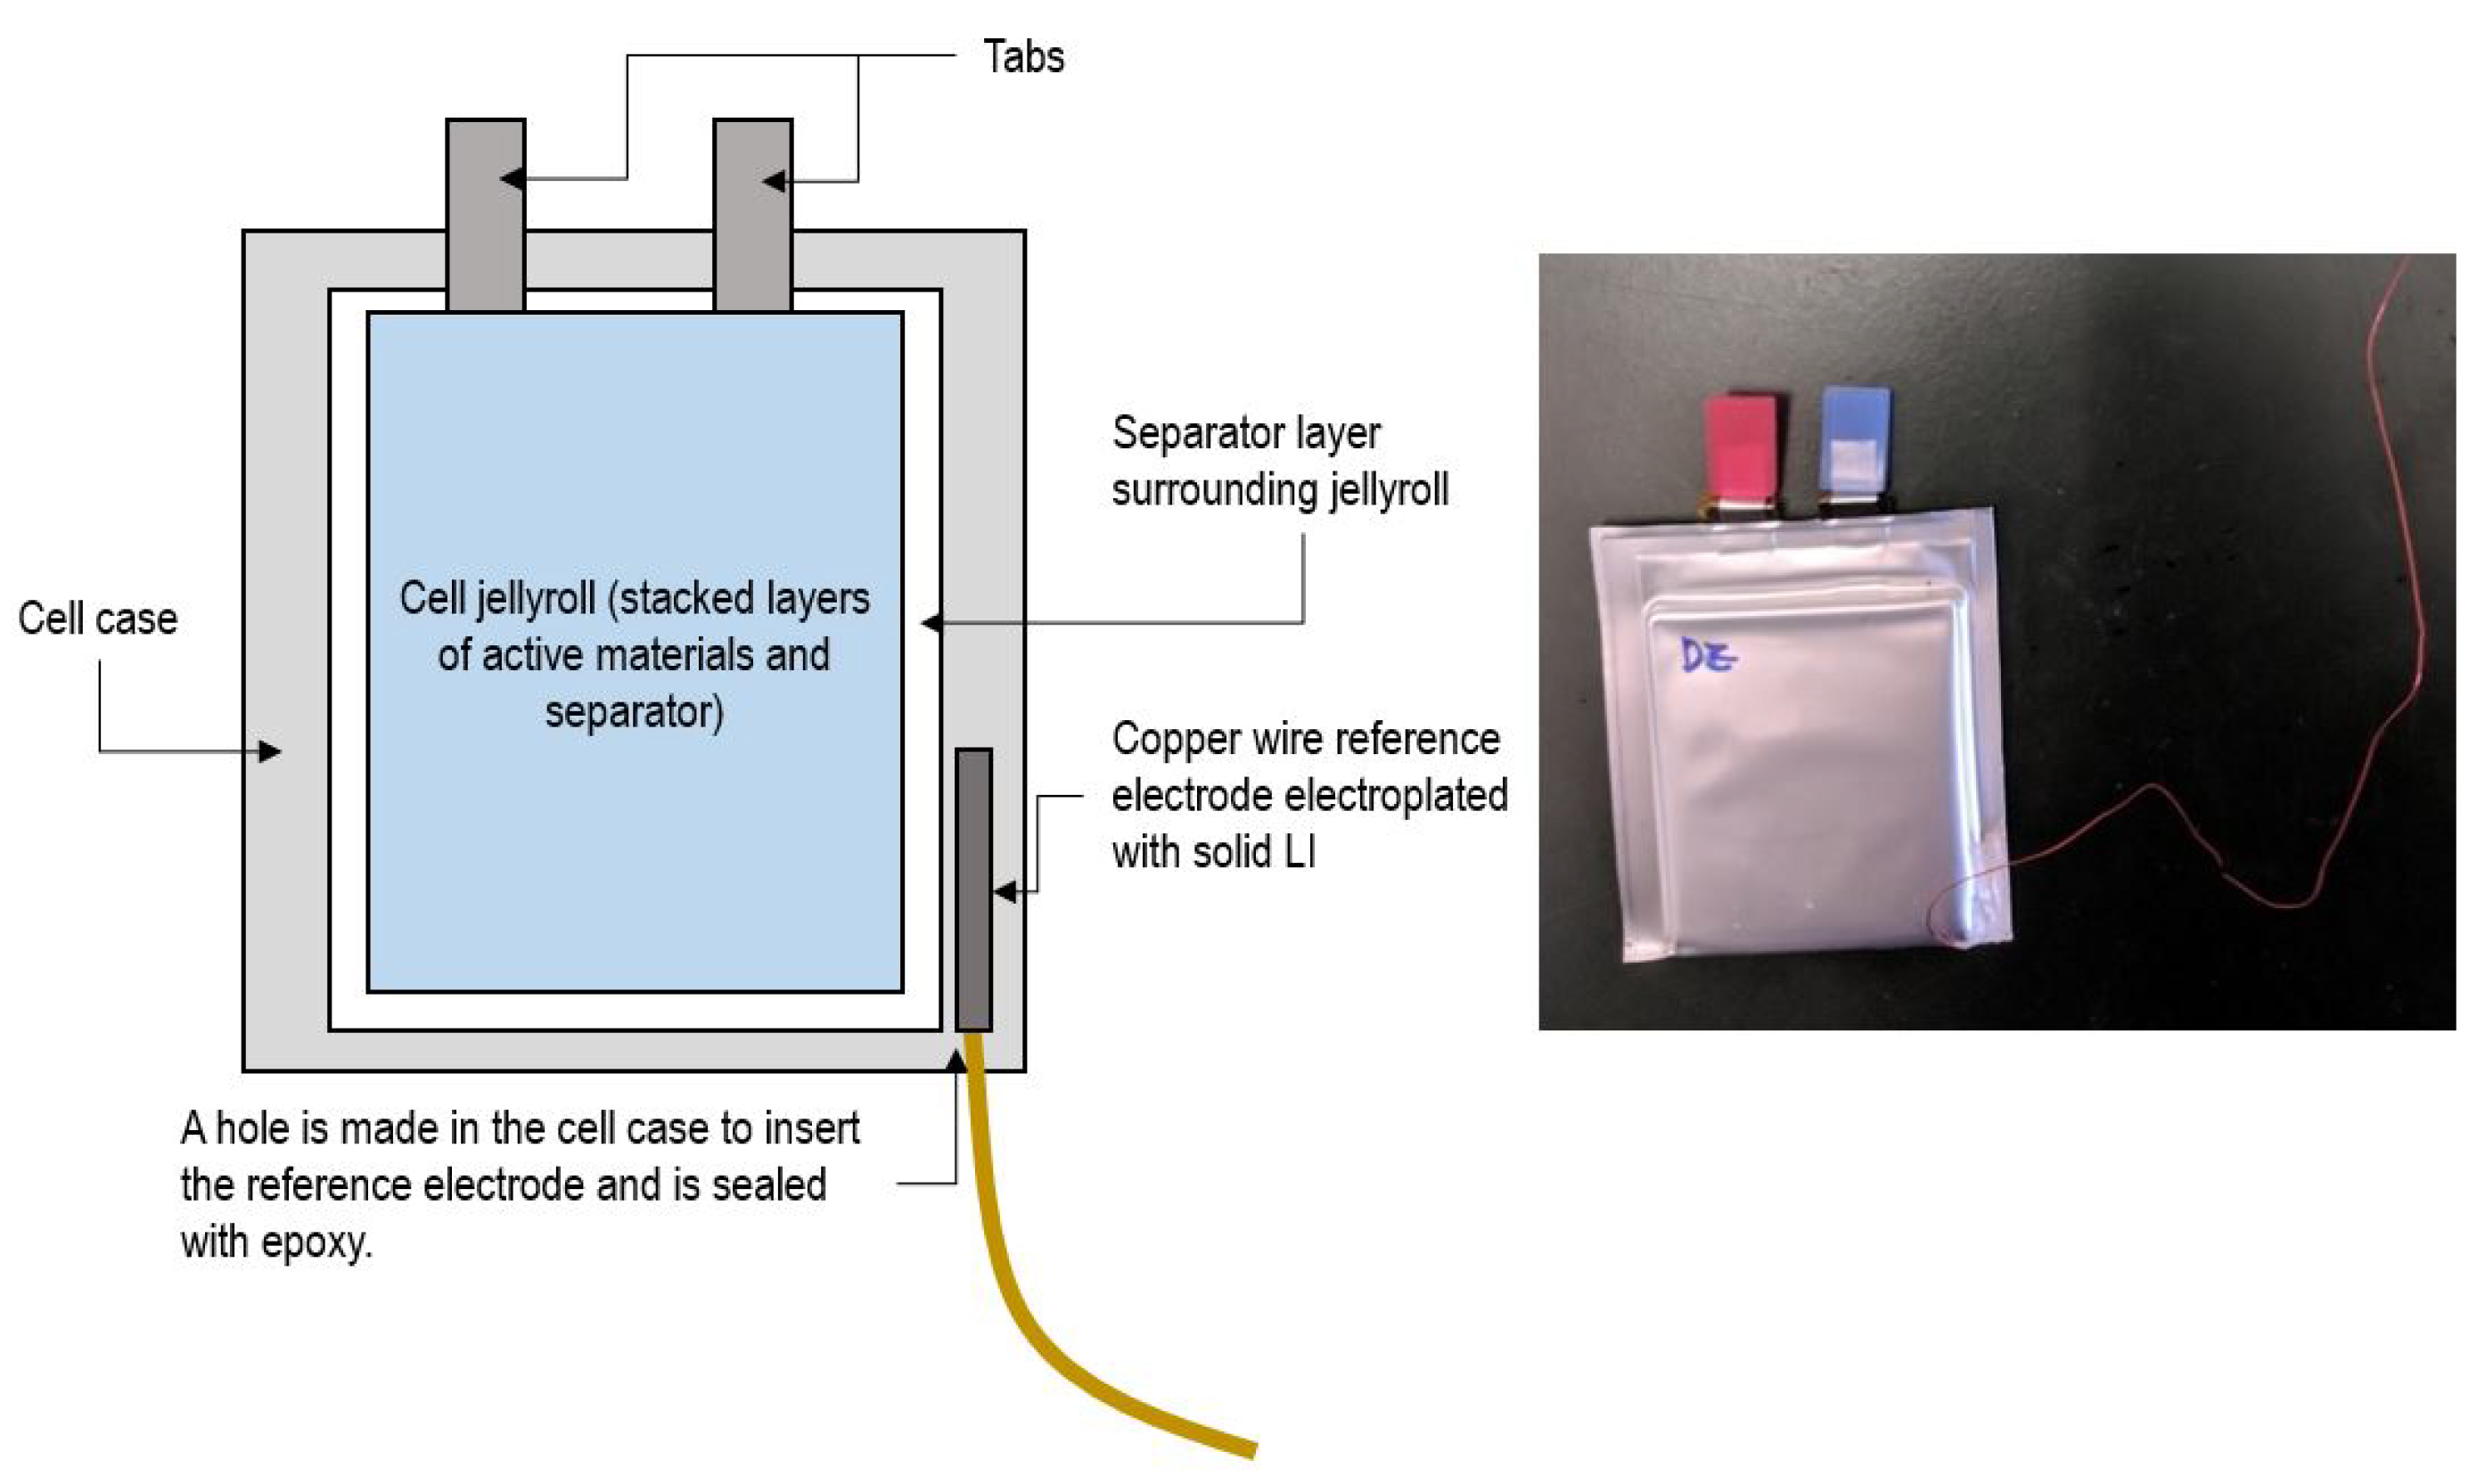
A small format, 1.6 Ah pouch cell with commercial-grade electrodes was selected for the experimental study. The 50 × 50 mm cell contains a blended NMC811 and NMC111 cathode and a blended artificial and natural graphite anode and utilizes a 1M LiPF6 electrolyte with a ceramic coated separator.
The pouch cells were retrofitted by inserting a reference electrode, providing an in-situ, non-destructive method to measure anode potential. After conducting initial tests for baseline capacity and internal resistance, the cells were pierced in one of the lower corners, and a 22 AWG copper wire was inserted into the cell. Prior to the insertion, the copper wire was coated in solid lithium using electroplating to ensure proper electrical contact and minimize noise in the measurements. After the insertion, electrolyte solvent was injected into the cell, and the hole was sealed with an epoxy resin [
19].
Figure 1 shows a schematic of the reference electrode insertion.
The retrofitted cells were then placed in an aluminum fixture to apply pressure (34 kPa) and temperature control via Peltier junctions. The cells were cycled with a 0–5 V Arbin Instruments LBT21044 eight-channel battery cycler, capable of a current range of 0-100/10/1/0.1A with 100 ppm precision.
After a baseline characterization, a series of fast charge tests was performed at three different temperatures (0
C, 10
C, 25
C). In this protocol, a cell is charged starting from a low SOC at a constant current (CC) until the terminal voltage of the cell reaches the maximum cell voltage cutoff (4.2V), and then the charge mode is switched to constant voltage (CV). As discussed in [
18,
20,
21,
22,
23,
24,
25,
26,
27], one of the most accessible detection methods in-situ for the presence of Li-plating in a charge cycle consists of a plateau in cell voltage during relaxation.
Figure 2 shows the difference in terminal voltage during cell relaxation between typical settling behavior and a voltage plateau indicative of the Li-stripping side reaction, which indirectly indicates that Li-plating has occurred during the preceding cell charging.
According to literature, plating can occur when the local anode potential falls below 0 V vs. Li/Li
[
1,
18,
23,
26,
28,
29]. If charging ends while Li-plating is still occurring, or if the overpotential is sufficiently small to cause the anode potential to rise above 0 V vs. Li/Li
, the plating reaction will reverse (stripping), leading to a characteristic plateau in the voltage [
15,
18,
21,
23,
26,
30,
31].
It is noteworthy to observe that plating may extend through the early phase of the CV portion during a CC-CV charging event. If charging ends while lithium is still plating, the stripping reaction will begin as soon as the anode potential rises above 0 V. This appears as a voltage plateau as the cell relaxes, as shown experimentally in
Figure 3. This figure (relative to a 5C charge with a 1C CV cutoff at 25
C) indicates the occurrence of Li-stripping by the presence of a peak in the rate change of the cell voltage profile (
) during relaxation, which is equivalent to the characteristic voltage plateau.
On the other hand, if the anode potential rises above 0V vs Li/Li
during the CV phase, the stripping process will begin while the cell is still charged. Because the voltage is held constant, the transition to stripping during the CV phase can be detected by monitoring the rate of change in current (dI/dt), which displays a characteristic peak when the stripping side reaction begins.
Figure 4 illustrates this behavior for a CC-CV charge at 4.2 V with a C/10 CV cutoff at 25
C).
It should be noted that while the plateau in the voltage profile during relaxation is commonly assessed in the literature as an indicator of Li-stripping [
22,
28,
32,
33,
34], the peak in the applied current during the CV phase under very low currents is a novel indicator of stripping in this study. The presence of a plating-to-stripping transition during CV charging is strongly dependent on the parameters of the CC-CV charge profiles. For the cells tested in this study, the transition occurred during the CV phase, when the target cell voltage was 4.2 V and the cutoff current was set lower than C/2 at 25
C.
The magnitude of the CC current and the CV cutoff voltage were varied to explore their effects on the onset of Li-plating in the cell. For each selected CC charge rate and CV current cutoff, the cell was charged to its maximum cutoff voltage, charged at CV until the set cutoff current, allowed to rest for 4 h, and then discharged at C/5 to its minimum cutoff voltage to perform a capacity test.
For each tested condition, the rate change of the voltage profile was analyzed for the indicative peak in the dV/dt profile. If a peak is present, this suggests that a voltage plateau has occurred during the relaxation after the charge, which indicates the presence of Li-stripping and, by consequence, of Li-plating. The current profile during the CV phase was also analyzed to detect a localized increase in the current decay profile (or the peak in the dI/dt profile), which may be indicative of an Li-stripping side reaction occurring during CV charge. If no voltage plateau was present in the relaxation voltage data or peaks present in the CV current profile, it was determined that there was no indicative sign of Li-stripping in the reaction. This investigation was repeated for multiple C-rates and cutoff currents for CV, and the presence of an Li-stripping plateau in each test is tabulated in
Table 1 for tests performed at 25
C.
A summary of the outcomes of all tests performed at the three chosen temperatures is shown in
Figure 5. Here, it can be seen that varying the C-rate for CC charging, the CV cutoff current, and the cell temperature changes the lithium stripping behavior in the cell, and that this behavior is sensitive to the charge conditions which include temperature, charge current, and CV current cutoff.
As documented in the literature and verified in these experiments, Li-plating increases with increased charge current and decreased temperature. At 0 C, there were signs of Li-stripping (and thus Li-plating) at charge rates as low as C/3, while Li-plating did not occur in the same charge cycles at 10 C until rates of 1C and at 25 C until rates of 3C.
The CV cutoff, which has an impact when the Li-stripping plateau occurs (during CV or during relaxation), can provide additional insight into the behavior of the anode during the plating/stripping portion of the charge cycle.
Figure 6 highlights how studying the effects of the CV cutoff at one fixed CC charge rate can give insight into the behavior of the anode potential in situ.
In the 4C charge test with no CV portion (CC only), there is a very small plateau associated with the occurrence of Li-stripping during the rest phase. In the 4C charge with a 1.5 A CV cutoff current, there is a more noticeable and distinct voltage plateau, which lasts longer after charge is cut off in the cell. When the cell is charged at 4C with a 0.1 A CV cutoff current, Li-stripping occurs during the CV phase.
From these conditions, it can be deduced that in all three charge conditions, the anode reaches a potential of less than 0 V vs. during the CC charge portion. In fact, even with the 4C charge with no CV, there are signs of Li-stripping, indicating that Li-plating has occurred. The 4C charge with a 1.5A CV cutoff current exhibits a longer and more distinct voltage plateau, indicating that more Li-stripping is occurring after this charge and implying that this is caused by more Li-plating. Because the voltage plateau happens after charge is stopped, the anode must be plating (at V vs. ) during the entire CV mode in this charge cycle. This indicates that the Li-plating starts in the CC region (as seen in the 4C charge with no CV) and continues through the CV region until the 1.5 A charge current cutoff. In the longer CV test (at which the CV current is cut off at 0.1 A), the plateau occurs around the point at which the cell is being charged at 0.5 A. Because the current peak indicates the occurrence of an Li-stripping side reaction, this represents the point at which the anode potential rises above 0 V to transition from the Li-plating to Li-stripping reaction.
These sequential charges at different rates, exemplified in
Figure 6, can shed further light on the anode behavior during different portions of the charge phase and can lend understanding to both the onset and stop of the Li-plating and allow the charge region to be broken into the regions shown in
Figure 7.
In region (a), the anode reaches the Li-plating favored potential lower than 0 V vs and maintains this condition through region (b). Region (c) indicates the final portions of the Li-plating condition being favored before the cell transitions into conditions of Li-stripping, when the anode rises to a potential greater than 0 V vs . This methodology of mapping various charge profiles to indicators of anode behavior can help to give insight into the underlying mechanisms and conditions favoring Li-plating. Additionally, this provides a useful data set for the model calibration explored in this work.
3. Modeling
The lithium plating side reaction is a local phenomenon that can occur in parallel with the intercalation and other degradation mechanisms. As pointed out in the literature—see for instance [
28]—plating often occurs in conjunction with other side reactions, such as SEI layer growth. On the other hand, for a low number of consecutive charge cycles at high C-rate conditions, as performed in the experiments described in this paper, it is reasonable to assume that the amount of capacity loss due to SEI layer growth is minimal compared to plating. This allows us to simplify the integration of the plating/stripping model into an electrochemical model.
If the local potential of the anode drops below the potential of solid Li (<0V vs.
), the lithium plating side reaction is favored [
1,
18,
23,
28]. The process of deposition and dissolution of the solid lithium can be implemented as a side reaction occurring at each location within the anode thickness. The reference reaction can be written as
The deposition and dissolution of metallic lithium is described by a single Butler–Volmer equation:
where
is the side reaction current density,
is the exchange current density,
and
are the respective anodic and cathodic transfer coefficients for the plating/stripping reaction,
is the concentration of Li metal,
is the concentration of
in the electrolyte,
and
are the bulk concentrations of Li metal and ions in the electrolyte respectively,
R is the universal gas constant,
T is the temperature, and
F is Faraday’s constant.
The lithium overpotential
is defined as
where
is the local solid phase potential,
is the local electrolyte potential, and
is the equilibrium potential of metallic lithium.
The exchange current density for the side reaction is calculated by
where
is the reaction rate constant of the plating/stripping reaction. Since the deposition/dissolution reaction is modeled as homogeneous along the surface, the lithium concentration is set to 1 when plated lithium is present, causing the amount of plated lithium to not affect the reaction rate. When plated lithium is not present, the concentration is set to 0 so that stripping does not occur. A correction term
on the anodic branch replaces this plated lithium concentration to bulk concentration ratio (
) to compute the stripping side reaction within the Butler–Volmer equation [
28].
where
is the quantity of reversibly plated lithium, and
is a large value to effectively make the
term equal 1 when
, and 0 when
. The inclusion of this term in Equation (
5) allows us to compute the current density for the stripping reaction while reversibly plated lithium is present and restricts stripping when the reversibly plated lithium is not present.
At each node, the amount of plated lithium is calculated by integrating the side reaction current:
where
is the quantity of plated lithium, and
is the surface area of the anode. It is assumed that a portion of the plated lithium becomes electrically inactive and no longer participates in the reaction. The reversibility of the plating reaction is governed by
which introduces a “reversibility factor”
as a function of current sign:
where
is the reversible fraction of plated lithium (tunable parameter), and
k is a large number.
During plating (
), the side reaction current leads to the accumulation of both irreversible and reversible plated lithium. When stripping is favored (
), the side reaction current contributes to removing only the reversibly plated lithium. The total quantity of plated lithium at each location within the anode thickness is the sum of the reversible and irreversible parts:
4. Integration with P2D Model
The plating and stripping model can be integrated into any electrochemical Li-ion cell model as a side reaction. In this work, the Doyle–Fuller–Newman (or Pseudo Two Dimensional, P2D) model was utilized as the source model due to its ability to predict the distribution of lithium concentration and potential through the thickness of the electrodes [
35,
36].
The P2D model assumes uniform use of the electrodes in the planar direction (i.e., uniform intercalation across anode surface). For this reason, this work assumes the same uniform Li plating/stripping on the anode surface.
The side reaction current density
represents both the forward lithium plating and reverse Li-stripping reactions. The lithium plating side reaction occurs in parallel with the intercalation/deintercalation of graphite. At each location within the anode, the net current density (
) is split between the side reaction current density (
) and the intercalation/deintercalation current density (
):
Figure 8 illustrates the concept. When any location in the anode reaches a potential favoring the plating side reaction, the amount of plated lithium
grows due to Equation (
6). This process occurs in parallel with the intercalation reaction, described by
. This net current density is the same magnitude of the current density that is subtracted from the electrolyte solution at each location through the electrode thickness.
When the local potential no longer favors the Li-plating side reaction and there is reversible plated lithium present on the particle (
), the amount of plated lithium decreases as described by Equations (
5) and (
7). The side reaction current density that dissolves the reversible lithium results in an increased local concentration of ionic lithium in the electrolyte solution, with successive intercalation into the graphite.
Since the magnitude of the plating reaction is dependent on the local value of the anode potential in both location and time, there can be different amounts of plated lithium at different locations within the anode domain as the cell is charged.
The model was integrated within PyBaMM, an open-source Python implementation of the P2D model [
36].
Figure 9 illustrates the essential equations of the P2D model and its interaction with the plating and stripping model, via block diagram representation.
5. Calibration and Verification
The plating and stripping model has two parameters for calibration, namely the reaction rate constant
and the degree of reversibility
. The reaction rate parameter affects the exchange current density for the plating and stripping reaction and is the main fitting parameter. The model behaviors for different
values are presented in
Figure 10.
While the parameter dictates the amount of lithium plating that occurs, the duration of the plating/stripping process is mainly dependent on the overpotential . For this reason, accurate prediction of the anode potential (which requires use of reference electrode data) during fast charging is critical to correctly capture the intercalation and plating reactions.
The voltage plateau associated with the stripping reaction during cell relaxation is commonly used to calibrate the reaction rate constant. When stripping induces a voltage plateau, the magnitude of the peak in the differential voltage is an indication of the quantity of lithium being stripped away, so the reaction rate constant can be tuned to match this peak.
Figure 11 shows how the voltage and differential voltage profiles during relaxation are affected by changes in the reaction rates for the formation/dissolution of metallic lithium.
One single fast charging test (5C CC fast charge) was used to calibrate the parameter
. The differential voltage profiles in
Figure 12 and
Figure 13 show good agreement between the model and the data for other test conditions.
In
Figure 12, the modeled 4C CC relaxation
has an early peak occurring at 90 s that is not observed in the data. This peak is caused by a characteristic cathode OCP slope change and is not related to the lithium stripping side reaction.
In
Figure 13, the model presents errors in capturing the relaxation
curves at 4C and 6C for the CC-CV test. The errors might be the result of an imperfect model calibration at Beginning of Life (BOL), rather than issues with the stripping model. In fact, although the predicted
profile does not exactly match the data, the time of occurrence of the stripping peak matches quite well, which indirectly proves that the model is correctly predicting the onset of the stripping behavior.
The reversibility parameter governs the fraction of reversible and irreversible plated lithium and can be calibrated to match capacity test data following a fast charging cycle. To this extent, the C/20 discharge test data were used to compute the capacity reduction after each fast charge cycle. Since severe capacity fade is observed within just a few charge cycles, it can be assumed that the main aging mechanism causing this degradation is lithium plating.
Simulations of consecutive fast charge cycles (4C, 5C, then 6C) were conducted to predict the quantity of irreversibly plated lithium, from which the capacity loss was computed via Faraday’s law:
The reversibility parameter
was tuned to match the capacity fade experienced due to CC fast charging (
Figure 14).
Note that changing the reversibility of the side reaction impacts the accuracy of the voltage plateau prediction, requiring further tuning after capacity loss data are matched. The final calibrated lithium plating parameters are provided in
Table 2. As previously mentioned, once the reaction rate parameter
is tuned to match the relaxation profile, the reversibility parameter
can be calibrated to match the capacity loss, which is measured in the C/20 discharge experiments.
Figure 14 shows how the model can match the capacity loss from lithium plating by calibrating the
parameter.
6. Simulation and Analysis
The model predictions can be further analyzed to understand the behavior of the cell during Li-plating and Li-stripping conditions.
Figure 15 illustrates the phenomenon of Li-stripping during relaxation, namely how the profile of plated lithium through the anode thickness changes as it is oxidized and returns to the electrolyte solution during the rest period.
The individual points in the Li-stripping plateau in time show that the amount of plated lithium decreases at each time step, with the peak of plated lithium located at the interface with the separator. As the stripping process continues, each location in the cell where plated lithium exists becomes progressively depleted.
Investigation of the net anodic current density (
) in
Figure 16 during Li-stripping shows a location-dependent net current. At the interface between the anode and separator, the net anodic current is positive, meaning the oxidation reaction is favored. This means that there is a positive contribution of lithium from the stripping reaction, since there is a larger quantity of accumulated lithium in these regions as confirmed in
Figure 15. Closer to the current collector, the net anodic current density is negative, meaning that the reduction reaction is favored. Here, the net reaction is the charge of the graphite from stripped Li intercalating back into the anode. Because lithium stripping is favored near the separator side of the anode but lithium intercalation is favored on the current collector side, this implies the net movement of lithium ions from the separator to current collector side of the anode as the stripping reaction occurs.
Figure 17 confirms that as lithium strips from the surface of the graphite particles, it moves towards the current collector side of the anode to re-intercalate back into the graphite material. As the concentration of lithium in the electrolyte increases, ionic diffusion drives the movement of lithium towards the current collector, where less lithium is in solution due to the lack of stripping in this region of the anode. Additionally, the potential gradient in the electrolyte solution after charge favors the migration of Lithium towards the current collector, as there is a higher potential in the liquid phase on the separator side of the anode.


 and
and 


