3.1. Constant Current Overcharge
The constant current overcharge tests have been carried out in the following way: a completely charged MJ1 cell equipped with a strain gauge and a pair of low-cost acoustic sensors has been discharged to a state of charge (SOC) equal to 0%, using 2 h rated current and a cut-off voltage limit of 2.5 V. After a 30 min long open circuit stay, the cell is recharged with constant current until the cell voltage exceeds a limit of 8.4 V (twice the prescribed maximum corresponding to 4.2 V). The overcharge process has been carried out with currents equal to C/10 h, C/5 h, C/2 h, C/1 h, 2 C and 3 C (C stands for the nominal cell capacity of 3400 mAh). This current range covers the most typical scenarios of EV charging, starting from overnight slow charge (C/10 h) and going up to a fast charge (2 C–3 C/6.8–10.2 A) which exceeds the recommended maximum charge current of C/1 h (3.4 A) by two or three times.
Figure 1 presents the results from multi-sensing monitoring during the constant current overcharge testing campaign in terms of evolution of the cell voltage (
Figure 1a), SOC (
Figure 1b), skin temperature (
Figure 1c), strain (
Figure 1d) and received acoustic signal strength (
Figure 1e). The parameter SOC has been calculated a posteriori using Ah counting [
17]. The results corresponding to the charge with a current equal to C/10 h are not shown due to their similarity with the case of C/5 h rated overcharge as well as in order to get a better view of the parameters’ evolution during faster charge regimes. It can be seen that the voltage evolution during the overcharge phase (i.e., when the voltage is higher than 4.2 V) is composed of two stages. The first one consists of a progressive increase to nearly 4.8 V, followed by a small voltage arrest ending with an instantaneous voltage increase above the limit of 8.4 V. The latter results from the activation of the CID (current interrupting device), which increases the cell resistance above 10 kΩ. This hypothesis has been confirmed via several teardown analyses of the positive terminal structure. The evolution of the SOC during the overcharge shows that the CID activation at low and moderate charge rates (C/1 h or lower) happens when the applied extra charge exceeds 20% of the cell capacity. At higher currents, the CID activation happens sooner. The evolution of the temperature during the charge and the overcharge allows the clear distinction of two stages. During the first stage, the temperature features a plateau correlating well with the applied charge current. This indicates a relation to the Joule heating effect. The temperature starts increasing very rapidly after SOC exceeds 100%, which clearly indicates the beginning of a thermal runaway process and the occurrence of exothermic reactions inside the cells. The activation of the CID terminates the overcharge process, thus limiting the temperature maximum at 112 °C at higher rates. After the termination of the overcharge, the cell temperature cools down to room temperature because the peak temperature is relatively far from the runaway point of 140 °C [
18]. These results show that the CID efficiently protects MJ1 cells against overcharge abuse.
The strain evolution data presented in
Figure 1d show that the overcharge coincides well with a process of over-swelling of the cell (it should be mentioned that the reference point of zero deformation corresponds to SOC = 100%, and the discharge process is causing a shrinkage of the cell volume). The comparison of the evolution of the cell skin temperature with the strain data presented in
Figure 1f for the case of the fastest charge rate (3 C) shows clearly that the over-swelling of the cell volume precedes the beginning of the overcharge-induced thermal runaway by a period of about 5–6 min. When the charge rate is lower, the “overcharge alert” moment of cell over-swelling appears even sooner. The latter can be seen in
Figure 1g, where the temperature and the strain are compared for the case of overcharge with a current equal to C/10 h (340 mA). In that case, the temperature increase is much smaller (less than 10 °C) and its beginning is more than 60 min after the beginning of the over-swelling process. This result shows that a sole measurement of the temperature as an early indicator of the thermal runaway hazard induced by an overcharge abuse can be very misleading due to the small temperature increment. In contrast, the measurements of the deformation as a function of the overcharged Amp-hours does not change markedly when the applied charge current is decreased from 10.2 A to 0.34 A (i.e., more than one order of magnitude). This result demonstrates that the strain measurements can provide reliable early alert of overcharge abuse, which can be very useful in the case of an absence of individual cell voltage monitoring. It should be noted that the overcharge with different currents also strongly impacts the relaxation phase following the activation of the CID. It can be seen that in the case of high-rate overcharge (1 C–3 C), the strain decreases from nearly +1000 ppm to −500 ppm, which indicates a shrinkage equivalent to a deep discharge. In the same time, the thermal contribution to the shrinkage is between 240 and 640 ppm considering a thermal coefficient of the stain gauge being between 3 and 8 ppm/°C (3 ppm/°C corresponds to the high temperature measurements during the ARC tests and 8 ppm/°C corresponds to the low temperature thermal cycling between −5 and 45 °C, as discussed in our previous work [
18]). Thus, if there is only a process of cooling down to room temperature, the strain should be in the range of +500 ppm, i.e., the cell should remain swollen, which is actually observed in all three cases of overcharge with current lower or equal to C/2 h. If we take into account the measurements of the pressure and the cell casing deformation, also discussed previously [
18], it can be concluded that the difference in the post-overcharge deformation pattern between the high current and the low current overcharge cases is due to the opening of the cell safety valve in the first case, leading to a decrease in the gas pressure in the cell down to atmospheric pressure.
In contrast, the cells overcharged with lower current remain sealed with high gas pressure inside. Taking into account the results for part 2 of this series [
18], indicating a pressure coefficient of the deformation close to 30 ppm/bar, it can be concluded that the gas pressure inside the overcharged cells is about 15–16 bar. The latter is about twice than the expected pressure due to the contribution of the swelling coming from the charge process. The abusive tests conducted in an Accelerating Rate Calorimeter (ARC) instrument showed that such cells (overcharged cells under pressure with activated CID) are more susceptible to thermal runaway, which makes the task of their identification particularly important [
18].
Figure 1e presents the evolution of the acoustic signal strength during the ultrasound interrogation monitoring of the charge/overcharge process. At lower overcharge rates, the signal strength drops to a rather steady value, while at higher rates, it fluctuates strongly. These results can be related to a rapid increase in the internal temperature accompanied by the accumulation of gaseous products due to the overcharge reactions that reduces the propagation of ultrasound waves through the battery cell. The data suggest that further analysis using more advanced methods such as data clustering and mapping could be much more useful [
17,
18].
The mechanism of cell deformation during the constant current overcharge is evaluated further via a parametric analysis transforming the signals from the three gauges (J1, J2, J3) of the rectangular rosette into the two-parameter plot r(D). More detailed description about the interpretation of this parametric analysis can be found in the monograph of Avril [
19], as well as in the
supplementary information in Figure S3. The corresponding results are presented in
Figure 2 for all six overcharge rates. The r(D) function has been fractioned into four segments with different colours:
“D1/r1” corresponding to Ucell < 4.2 V (safe charge process);
“D2/r2” corresponding to Ucell > 4.2 V and SOC < 100% (electric overcharge);
“D3/r3” corresponding to SOC > 100% until the CID activation (electrochemical overcharge);
“D4/r4” relaxation phase after the overcharge termination.
The results from this analysis show that the increase in the charge/overcharge current does not significantly change the mechanism of the deformation process. The preferred strain orientation during the low-rate charge and the overcharge remains the increase in the cell diameter, while the increasing current (1 C–3 C) leads also to the appearance of a pulling component (increase in the cell length). The latter can be attributed to the formation of gases inside the cell jellyroll and the corresponding mechanical force of unwinding it. The r(D) function allows relatively simple recognition of the overcharge abuse corresponding to points lying in the right-hand side of plot. The degree of the abusive process is nearly proportional to the growth of the right branch of the r(D) function. This result can be used as a quantitative methodology for overcharge abuse risk assessment in complement with existing methods based on thermal runaway modelling [
20].
3.2. Voltage-Limited Overcharge
Voltage-limited overcharge experiments have been carried out using a 2 h rated constant current/constant voltage (CC/CV) charge sequence with voltage limits of 4.6, 4.7, 4.8 and 4.9 V (each CC/CV overcharge experiment has been carried out on a “fresh” cell). The CV part of the experiment resembled the decreasing current transient observed during the regular CC/CV charge up to the voltage value of 4.8 V. The attempt to overcharge the cell with 4.9 V resulted in electrochemical behaviour similar to the case of the constant current overcharge with 1.7 A, discussed in the previous paragraph.
Figure 3 presents the evolution of the cell parameters during the charge and overcharge with the other mentioned voltage limits (4.6, 4.7 and 4.8 V). The constant voltage overcharge polarization has been kept over 30 h in order to wait for delayed battery safety breach events. Due to the absence of such events, the x-axis of the plots in
Figure 3 are limited to 300 min. The evolution of the cell voltage presented in
Figure 3a remains repeatable during both the regular charge stage and the overcharge stage. The current transients during the constant voltage overcharge stage (
Figure 1b) are very similar to those observed during the constant voltage charge with 4.2 V. The application of higher floating voltage increases the steady state value of the current exponentially (the current at 4.8 V is about 100 mA, while at 4.9 V it was in the range of 1700 mA). It should be noted that in the case of the overcharge with 4.8 V, there was a sudden drop of the current at the moment corresponding to 290 min since the beginning of the charge, which has been related to the activation of the CID. In the other two cases, the cells have been able to operate in charge/discharge mode after the tests. The evolution of SOC plotted in
Figure 3c also correlates very well with the applied overcharge voltage. The maximum SOC is about 122%, which is slightly higher than the values observed in the case of constant current overcharge (120–121%).
The limitation of the overcharge voltage, limiting also the overcharge current, leads to nearly negligible changes of the cell skin temperature (
Figure 3d). Such battery behaviour can be very misleading in terms of safety algorithms relying only on the measurement of the temperature, because the resulting overcharged cells are more susceptible to thermal runaway than the partially charged cells [
18].
Figure 3e presents the evolution of the strain during the charge and the overcharge with a CC/CV sequence. It can be seen that despite the differences of the strain evolution at low SOC, which has been already observed during previous experiments, the deformation returns to its reference point when SOC approaches 100% in a rather repeatable manner.
The repeatability is kept further during the overcharge stage, when the cell volume swells, following closely the increase of the SOC above 100%. These results indicate a proportionality between the gas pressure build-up and the quantity of the electricity spent for the proceeding of the parasitic reactions. This suggestion has been confirmed plotting the strain data vs. the SOC considering only the points corresponding to the overcharge process (SOC > 100%) until the end of the applied constant voltage overcharge (
Figure 3f,g).
The SOC vs. strain plot for the case of overcharge with 4.7 V is composed of two nearly linear segments: one up to SOC = 110–112%, and the second corresponding to SOC > 115%. In the case of the overcharge with 4.8 V, the strain increases also almost linearly with SOC again featuring two segments. The first segment is very similar to the case of the overcharge with 4.7 V; however, the slope of the second segment is higher, which indicates faster pressure build-up inside the cell. The linear relationship between the strain and the SOC in overcharge mode (SOC > 100%) can be explained combining the ideal gas law, Faraday’s law and the estimated linear relationship between the strain (ε) and the fluid pressure (p
gas) inside the casing of the MJ1 cell, estimated as follows [
18]:
where R is the molar gas constant, T is the temperature, V is the cell void volume, Q
ovch is the applied overcharge Amp-hours, F is Faraday’s constant, n
gas is the number of moles of gas formed due to the overcharge reactions and k
1 and k
2 are proportionality constants. Combining the three equations, it can be seen that at a constant temperature (
Figure 3d) and constant void volume inside the cell (the measured deformations correspond to negligible volume variation), the strain is proportional to the applied overcharge:
The evolution of the strength of the acoustic signal transmitted through the battery cell presented in
Figure 3h remains similar to that observed in
Figure 1e for the case of overcharge with lower current. Here, the signal strength decreases to a nearly steady state value.
Figure 4 presents the results from the parametric analysis of the strain data during the constant voltage overcharge experiments. Again, the r(D) function has been divided in several segments: one corresponding to the regular charge, a second corresponding to the time interval when the cell voltage is higher than 4.2 V but SOC is less than 100% and a third stage during which the cell is overcharged “electrochemically”. It can be seen that the results are very similar to the data shown in
Figure 2 for the case of constant current charge (especially those obtained at low-rate overcharge) except the very final stages. The predominant deformation mechanism remains the expansion of the cell diameter. In the case of overcharge with 4.8 V, the swelling continues up to a certain moment, after which there is a period of shrinkage followed by a torsion process, when the CID opens. The swelling of the other two cells continues until the end of the strain monitoring.
The overcharge tests performed on MJ1 cells using various current and voltage limits showed that the selected technology is protected rather well against overcharge abuse at the cell level. The protection device (CID) is activated by the pressure build-up, which results from electrochemical reactions forming gaseous products and heat. After activation, the electric resistance of the cells exceeds 10 kΩ and they can no longer be charged or discharged. Previous studies [
18] showed that overcharged cells are stable at room temperature (25 °C +/− 2 °C); however, they are more susceptible to thermal abuse than cells left at SOC = 100%.
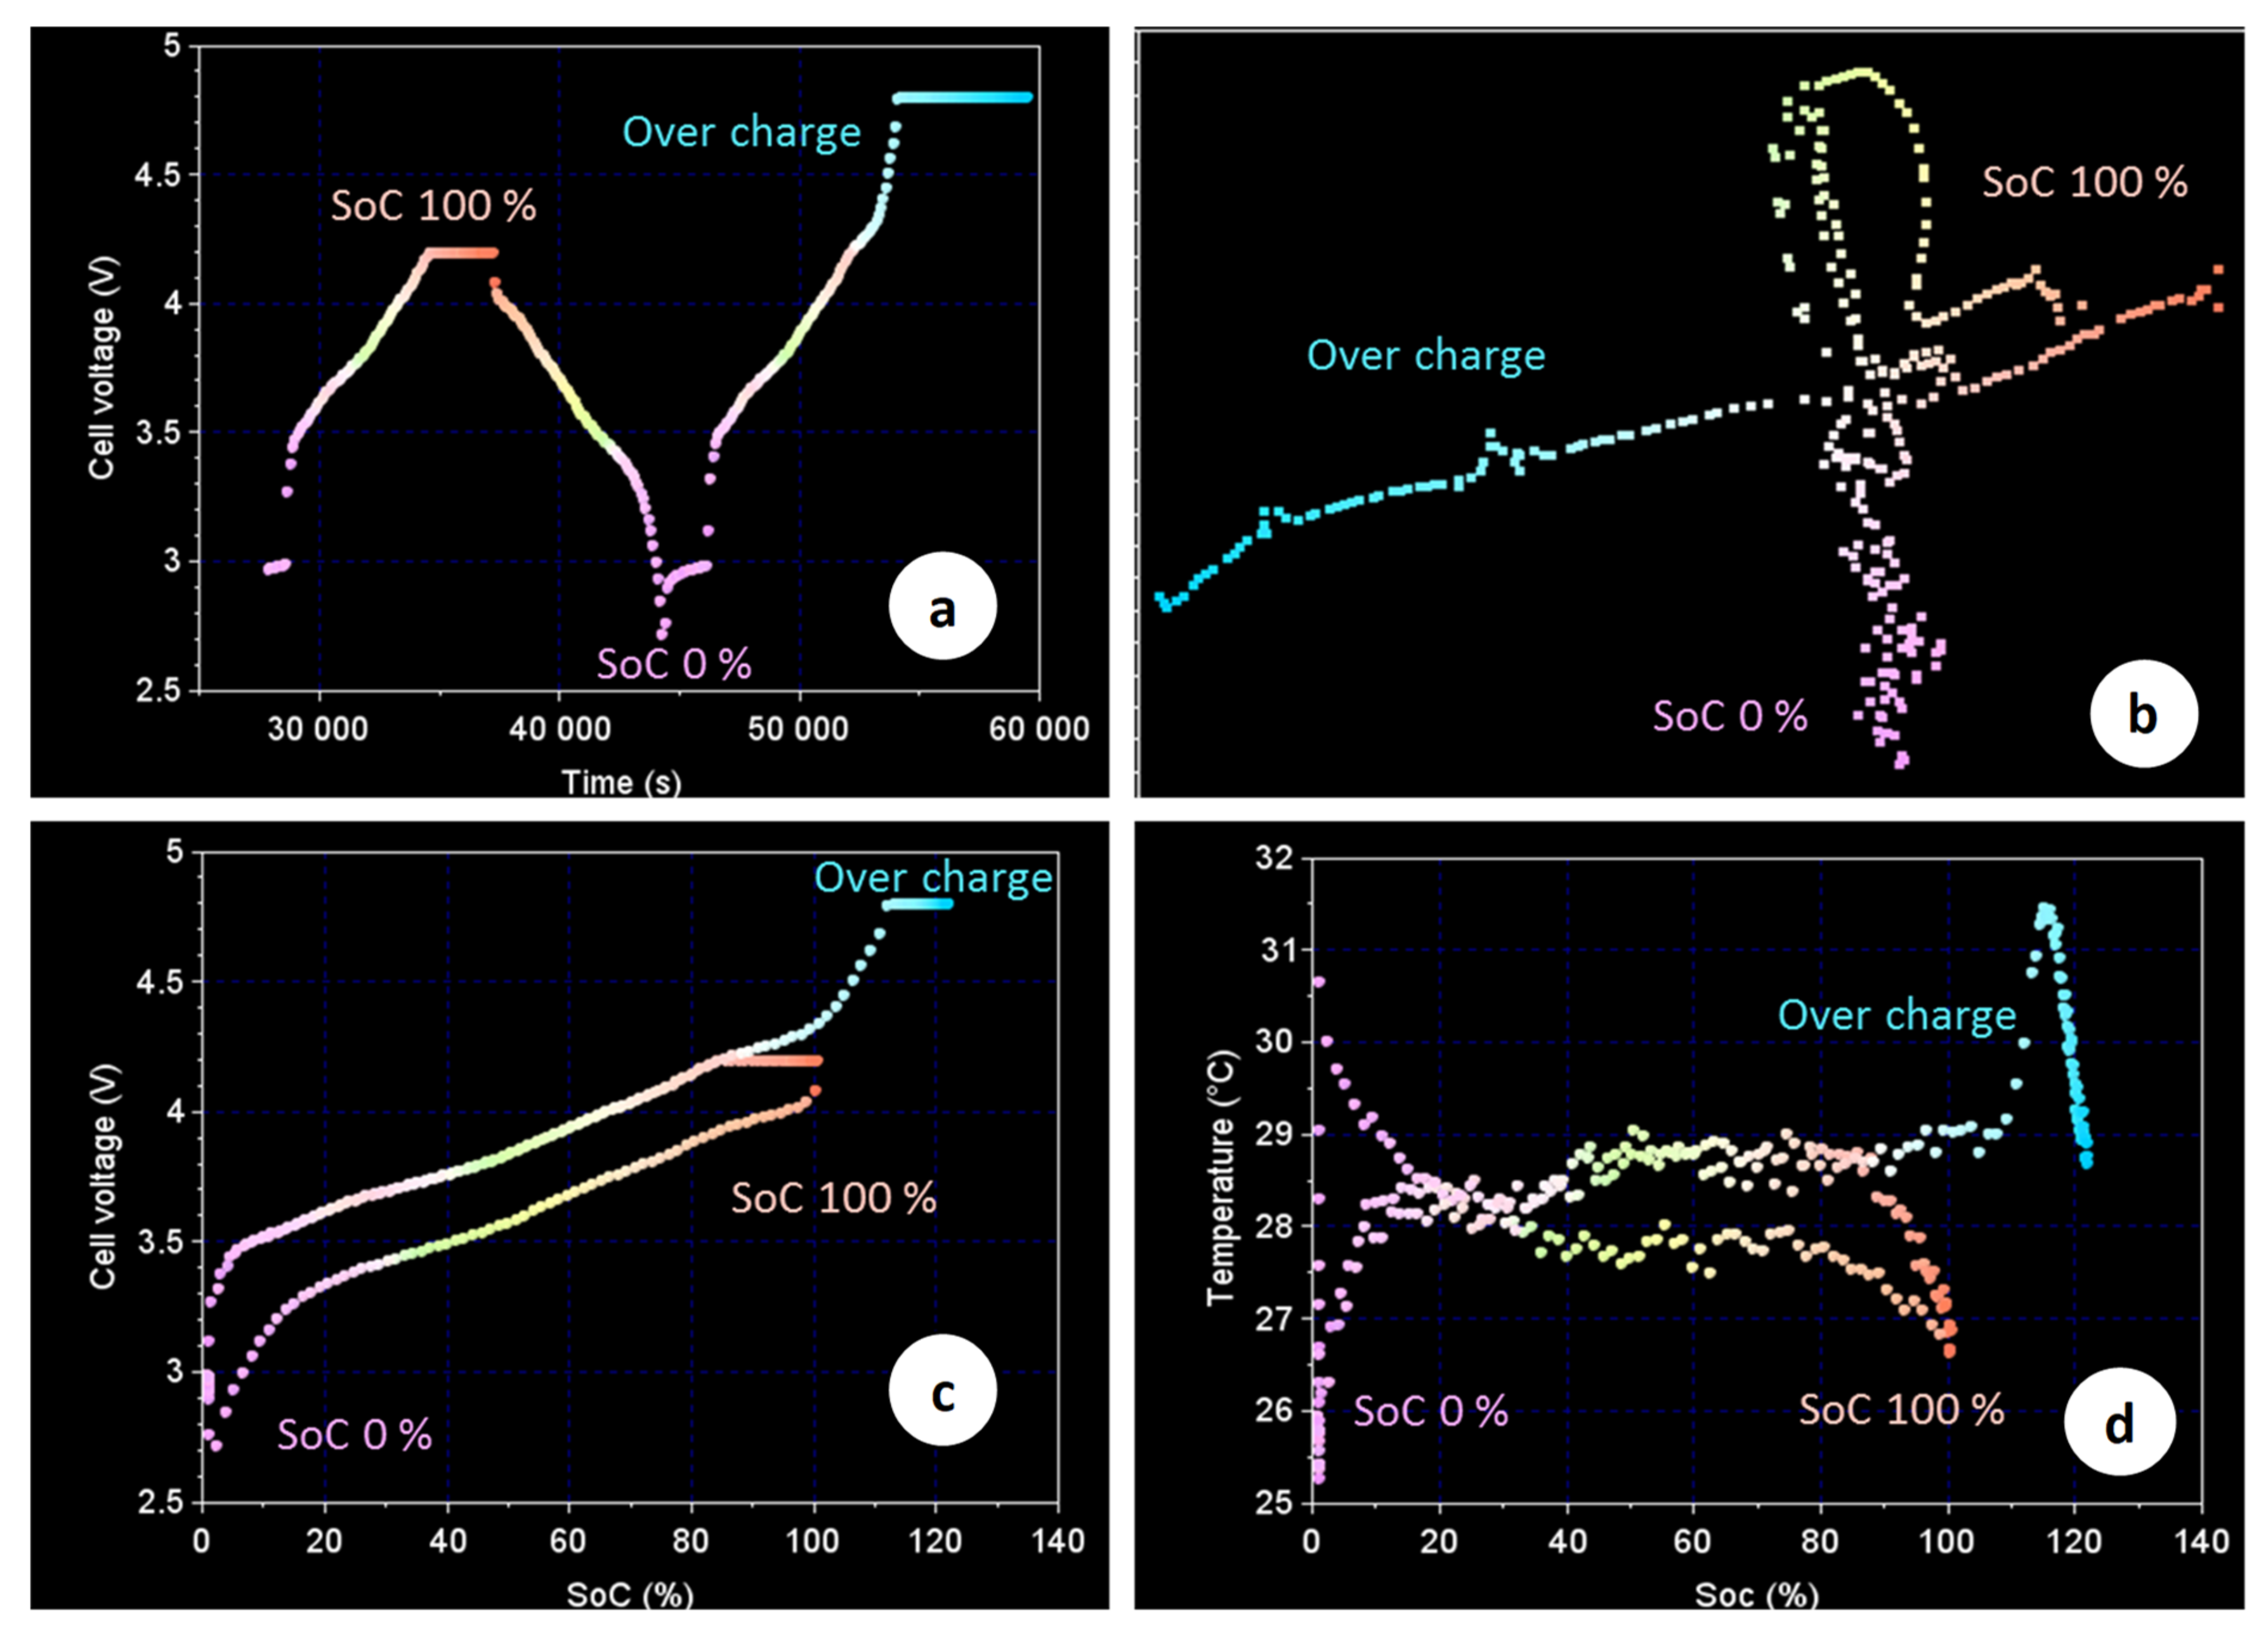
Figure 5 presents the evolution of the physical properties of the acoustic signal during a normal charge–discharge cycle followed by an overcharge up to 4.8 V. The corresponding data have been subjected to the same type of clustering and mapping analysis already presented in previous publications [
17,
18,
21]. In brief, the signal clustering and mapping tools are applied to analyse the power spectral density (PSD) of the ultrasound waves passing across the cell jellyroll diameter. It is then possible to identify different categories of PSD patterns that can be represented graphically on a 2D map and coloured depending on their position on that map. Acoustic signals presenting similar patterns (low Euclidean distance) are closely placed on the map and present the same colour. On the other hand, acoustic signals with very different patterns (large Euclidean distance) present very different colours.
Figure 5a shows that the normal charge/discharge operation proceeds with a repeatable cyclic change of the PSD patterns, which are also in good correlation with SOC (
Figure 5c). It can be seen that a voltage increase above 4.2 V causes notable changes in the acoustic signal despite the fact that the amp-hour-based SOC is below 100%. The effect is particularly evident when the acoustic data are presented in a 2D space for clustering and mapping (
Figure 5b). This result also coincides well with the over-swelling process observed in
Figure 4. The latter starts practically when the cell voltage exceeds the value of 4.2 V. This coincidence indicates that a voltage limit of 4.2 V prevents the occurrence of a parasitic reaction with the formation of gaseous products, which increase the cell pressure (seen as increased strain) and change the cell jellyroll microstructure (e.g., through the formation of gas pockets, delamination of active materials, lithium plating, etc.…) impeding the ultrasound passage.
Figure 5d illustrates further the potential benefit of acoustic ultrasound interrogation as a method for early detection of overcharge safety breach events. The latter occur with negligible changes of the cell skin temperature, making them hardly detectable with a classic battery monitoring data set.


