Article

Impedance Investigation of Silicon/Graphite Anode during Cycling

1
School of Automotive Studies, Tongji University, Shanghai 201804, China
2
Clean Energy Automotive Engineering Center, Tongji University, Shanghai 201804, China
*
Authors to whom correspondence should be addressed.
Batteries 2023, 9(5), 242; https://doi.org/10.3390/batteries9050242
Submission received: 7 March 2023 / Revised: 19 April 2023 / Accepted: 21 April 2023 / Published: 25 April 2023

Abstract

:
Silicon/graphite material is one of the most promising anodes for high-performance lithium-ion batteries. However, the considerable deformation occurring during the charge/discharge process leading to its degradation hinders its application. Research on the electrochemical performance of silicon/graphite anode have mainly focused on its cyclic performance and microscopic mechanism, whilst the correlation between electrochemical performance and the mechanical deformation of batteries at the cell level is in few numbers. In this study, the electrochemical performance and cycling performance of the cells in Ah-level silicon/graphite anode pouch cells with different SiO weight ratios (5 wt.%, 10 wt.%, and 20 wt.%) in the anode, and LiNi0.8Co0.1Mn0.1 as the cathode are investigated by quantitative analysis. It is found that cells with different SiO weight ratios in anodes under a different state of charge (SOC) and state of health (SOH) demonstrate remarkable differences in electrochemical impedance characteristics. The results show that SOC, SOH and the weight ratios of SiO are the main factors affecting the impedance characteristics for batteries with silicon/graphite anode, which is deeply related to the change in the thickness of the electrode during lithiation/delithiation. This research facilitates the application of EIS in battery management and the design of silicon/graphite anode lithium-ion batteries.

1. Introduction

To achieve zero carbon emissions, developing green energy, especially promoting the application of power cells in transportation and energy, is one of the solutions to alleviate the current energy and environmental crisis [1]. Lithium-ion batteries (LIBs) have an important role to play in the energy revolution, especially in reducing CO2 emissions in the transportation sector. For electric vehicles (EVs), the specific energy density is becoming one of the most focused concerns and is limiting further improvements in the cruising range [2,3], and the health evaluation of LIBs is also a matter of concern [4].
The current commercialization and research for negative electrode materials is mainly focused on graphite (Gr) with a layered structure, which has low electrode potential [5,6] (0.1 V vs. Li/Li+) and stable cycling performance to promote its large-scale application. However, the practical specific capacity of LIBs has increased from 100 Wh/kg to 300 Wh/kg, which gradually approaches the theoretical limit and further limits the energy density of LIBs [7]. Recently, LIBs with Si-based anodes have aroused academic and industrial interest owing to their potential as an alternative material for improving the energy density of LIBs. During lithiation, silicon (Si) exhibits ultrahigh volume expansion (~300%) which is a bottleneck problem limit its large-scale applications in LIBs [7]. As a feasible candidate anode material, silicon monoxide (SiO) exhibits smaller volume change (~160%), relatively high capacity (~1400 mAh/g), better cycling stability than Si, versatility and an inexpensive cost. Thus, lithium-ion battery with SiO/Gr anode should be further investigated by quantitative analysis.
During prolonged cycling, the SiO/Gr anode exhibits high inhomogeneity electrode deformation, whilst significant progress has been achieved in carbon coating [8], prelithiation [9], binder combination [10], etc. However, whilst most studies have focused on the cycle stability of the SiO/Gr anode and the related degradation mechanisms, a deep understanding of the management considering SOC and SOH is still lacking. Electrochemical impedance spectroscopy (EIS) is an important method to reflect the electrochemical properties of LIBs, which have been demonstrated by many researchers to quickly measure and diagnose the degradation and charge state changes in batteries [11,12,13,14]. Based on the charge transfer resistance (Rct), Wang et al. [15] proposed a dual time scale life prediction method for LIBs. Zhu et al. [16] studied the relationship between different aging states and the EIS parameter for commercial 18,650 batteries. It is found that the battery ohmic resistance (Rohm) and Rct gradually increase to a high value with the aging state of the battery. As the Rct and Rohm are directly affected by LIBs’ internal characteristics, the equivalent circuit model (ECM) parameters of EIS are directly related to the battery SOC [17]. Gui et al. [18] constructed an ECM based on EIS using fraction order theory, leading to the accurate estimation of LIBs’ SOC. Deng et al. [19] proposed an updating strategy based on EIS for SOC estimation, and the EIS method is integrated into the battery management system (BMS). Until now, for the SiO/Gr anode battery, a few works have been performed to explore the EIS properties correlating to SOC and SOH. Meanwhile, Xu et al. [20] established a multi-physics models to quantitatively investigate the interaction of SiO/Gr anode, the results demonstrated that an 8–10 wt.% of SiO is an optimal choice for the composite anode. Manthiram et al. [8] proposed that there is a crossover effect between silicon particles and graphite particles, which can have an impact on the performance of LIBs. This phenomenon is mainly owed to the lithiation mechanism, volume expansion, and electrochemical properties of silicon which are quite different from those of graphite [7]. Kim et al. [21] investigated the complex dynamics of a silicon–graphite electrode using operando optical microscopy, and demonstrated that the silicon–carbon–graphite anode exhibited higher homogeneity in the thickness direction during the lithiation phase. Kumar et al. [22] conducted an extensive analysis by utilizing advanced electron microscopy tools to understand the aging behavior of Si/Gr composite anodes, and the aged anode electrodes were performed by high-resolution FIB-SEM sectioning. They specifically monitored the electrode swelling from 1 to 700 cycles as well as the morphology, chemical changes, and formation/stability of the SEI layer, and finally the trapping of Li inside the Si particles. This work provides an insightful explanation of the mechanism and detailed data to support the aging of the silicon/carbon composite anode cells. Thus, a deep understanding of the electrochemical properties, especially the impedance mechanism coupled with the aging state for the SiO/Gr anode battery, needs to be further explored.
The present study focuses on the impedance properties of cells with the SiO/Gr anode and LiNi0.8 Co0.1Mn0.1O2 cathode. Cells with 10 wt.% SiO in the anode are found to be significantly different from other cells in terms of impedance characteristics. The experiment schedule and EIS test are presented in Section 2, whilst Section 3 mainly presents the difference in impedance characteristics between SiO cells with 10 wt.% SiO in the anode and other cells with the post mortem analysis. The conclusion is summarized in Section 4.

2. Experimental Section

This work focuses on the differing impedance properties between the graphite anode battery and silicon/graphite anode battery during cycling. The test pouch cells in this work are commercial wound-type structure batteries with a nominal capacity of 1 Ah. As shown in Table 1, the cells consisting of a graphite anode and LFP cathode are named LFP, and similarly, the cells with a LiNi0.5 Co0.2Mn0.3O2 cathode and graphite anode are named NCM523. Of particular note is the fact that the test cells with a silicon/graphite anode are the mainstay of our research, and these corresponding cells with a SiO/Gr anode and LiNi0.8Co0.1Mn0.1 cathode are named according to their SiO incorporation content, namely cell 5 wt.% SiO, cell 10 wt.% SiO, and cell 20 wt.% SiO. The SiO particles are of various sizes ranging from 2 μm to 10 μm, while the majority of SiO particles are concentrated between 6 and 7 μm. The nominal internal resistance for these cells ranges from 10 to 20 mΩ. All these pouch cells were purchased directly from Hunan Li-FUN technology Company Ltd., Zhuzhou, China and these batteries do not contain electrolyte.

2.1. Cyclic Aging Tests and Electrochemical Impedance Spectroscopy Tests

Before the electrolyte filling and cycling test, the pouch cells were dried in a vacuum drying oven to remove the residual water [23], after a 24 h drying step at 85 °C, these cells were removed to an Ar-filled glovebox, and kept inside the glovebox for a brief time until the cell was cooled down to room temperature. Then, the pouch cell was soaked with 6 mL electrolyte (1 M LiPF6 in a 1:1 (by weight) mixture of EC and EMC) with respect to the capacity and electrolyte consumption during cycling. The injection process was carried out in a vacuum injection machine, with reduced pressure being maintained throughout. The formation protocol was carried out at a C-rate of 0.05 C (1 C is defined as the current when the cell is fully discharged in one hour according to its nominal capacity).
The test cells implemented a steady cyclic protocol, wherein a complete cycle includes the charging of a constant current–constant voltage (CC-CV), the charging rate adopts 1C, and the cut-off current is 0.02 C followed by a 1 C CC discharging step. In each cycle, a 30 min rest period was set between the charging and discharging processes. Before the cyclic aging test, each cell had a capacity calibration that adopted a 200 mA CC-CV charging, in which the cut-off current was 20 mA; after a 30 min relaxation process, the cell was discharged at a constant current of 200 mA to the lower cut-off voltage. The discharging capacity in each calibration test was treated as the nominal capacity, and the calibration test was performed for all cells after every 100 cycles. During the capacity test, the EIS tests were employed at 100% SOC and 0% SOC, a 2 h relaxation process was set before each EIS test, and a potential electrochemical impedance spectroscopy was obtained within a frequency range of 10 kHz–0.01 Hz and a sinusoidal amplitude of 10 mV. The capacity calibration tests and impedance tests were performed by a Biologic VMP3 potentiostat, whilst all the measurements were conducted in a Binder climate chamber and the temperature was controlled at 25 °C. The experimental setup is shown in Figure 1a,b, the sample of the test pouch cell is presented in Figure 1c, and an overview of the battery cycling tests is shown in Figure 1d.

2.2. Investigating the Effect of SOC on Electromechanical Characterizations

Similarly to silicon (Si), SiO exhibits a tremendous volume change during lithiation, leading to anode electrode swelling, and the volume expansion is recovered during the de-lithiation process. This reversible expansion is closely related to the SOC, and the incorporation of SiO accelerates this change during the battery cycling. To quantify the impedance properties for the cell, 10 wt.% SiO during periodic cycling as well as the SOC, the cell was consecutively implied with EIS testing with the SOC levels of 100%, 80%, 60%, 40%, 20% and 0%, respectively. Throughout the testing period, a constant 200 mA current was chosen during the discharge period and relaxed for 2 h in the climatic chamber before the EIS tests.

2.3. Post Mortem Characterization Tests

In order to investigate the influence of SiO particles on the cycling performance and impedance properties of the cells with SiO/Gr composite anode, the tested cells were disassembled in an argon-filled glove box (MBRAUN-MB-200B, H2O < 0.1 ppm, O2 < 0.1 ppm) to obtain the cell anode electrodes. Before disassembling the battery, the cell was discharged to 3.0 V under a CC protocol with a 0.1 C discharge rate, the appearance images of cell electrodes were taken with a camera, following the sample collection, the electrodes were carefully rinsed with excess dimethyl carbonate (DMC) two times to remove residual electrolytes, and then the samples were encapsulated in aluminum-plastic film bags before proceeding with further characterization. Additionally, information on the microstructure of the anode samples was acquired by electron scanning microscopy (SEM, JEOL JSM-7610FPLUS), and the samples were tested under vacuum conditions. The energy-dispersive spectroscopy (EDS) technique was also employed to obtain the elemental maps of the SiO/Gr anode, which can examine in detail the evolution of the SiO component during the cycling test.

3. Results and Discussion

In this section, the capacity fade and impedance tests are conducted and analyzed in detail. During the cycling, the impedance spectra are in a distinguished relationship with SOC and SOH for the cell 10 wt.% SiO. Thus, this section first exhibits capacity degradation with the cycling test, and the EIS features based on the ECMs are fitted and quantitatively analyzed. Then, the morphology and scanning electron microscopy (SEM) images of the test cell electrodes are presented.

3.1. Battery EIS and Equivalent Circuit Model

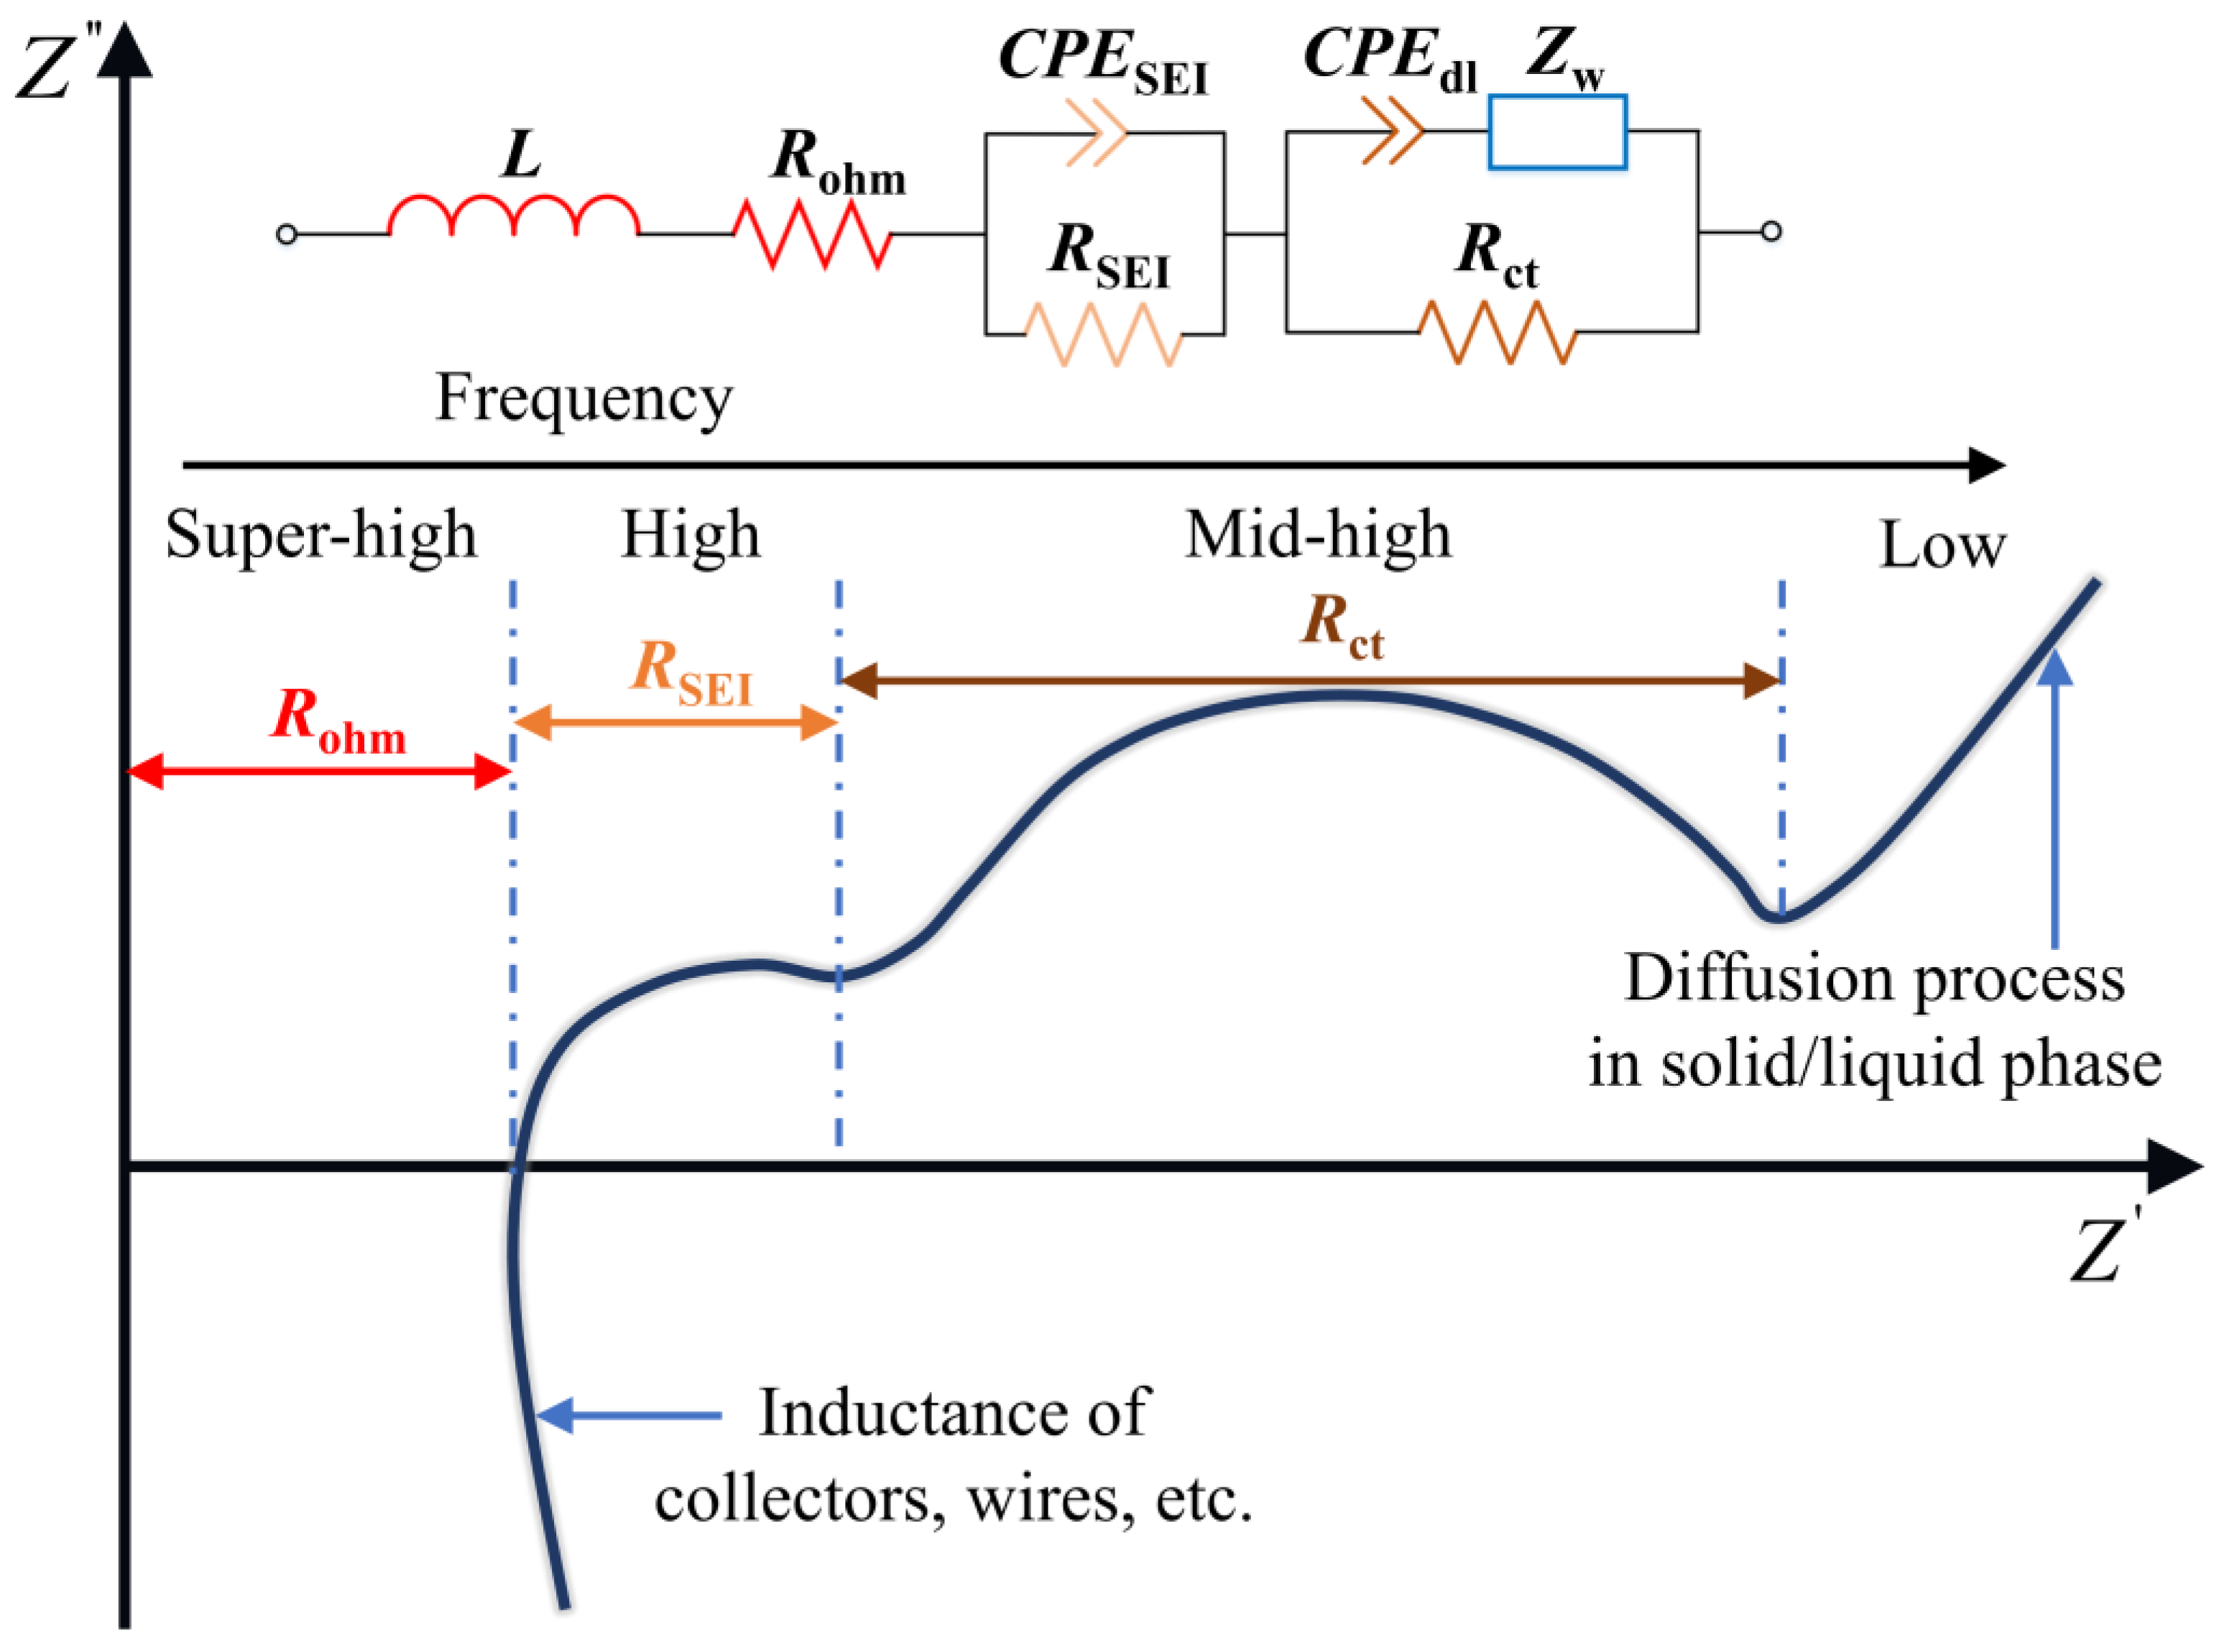
Battery impedance varies significantly with the aging state and charge state, and the impedance curves contain a lot of important electrochemical information inside the cell. Generally, the EIS test serves to inject a relatively small amplitude alternating with a current sinusoidal potential signal on a cell which under stable conditions [11,12]. By calculating the current response and the input signal in different frequencies, the impedance spectrum can be obtained and divided into four parts according to the frequency range. As shown in Figure 2, during the impedance test, the applied disturbance signal fell from high frequency to low frequency, and the impedance curves in the frequency domain can be divided into four parts: characterizing the L (represents the induction phenomenon) and Rohm, which is dominant in the super-high-frequency region; the high-frequency-region semicircular arc in response to the solid electrolyte interface (SEI) impedance, represented by RSEI/CPESEI in parallel; the mid-high-frequency-region, which represents the charge transfer process, as another semi-circle which can be represented by Rct/CPEdl; and the Warburg impedance (described as Zw), corresponding to a diffusion process in solid/liquid phase which is dominant in the low-frequency range. According to the elements mentioned above, an ECM in Figure 2 is employed to describe the battery impedance spectrum, and ZView is applied for ECM parameter identification.

3.2. Battery Degradation and Impedance Analysis

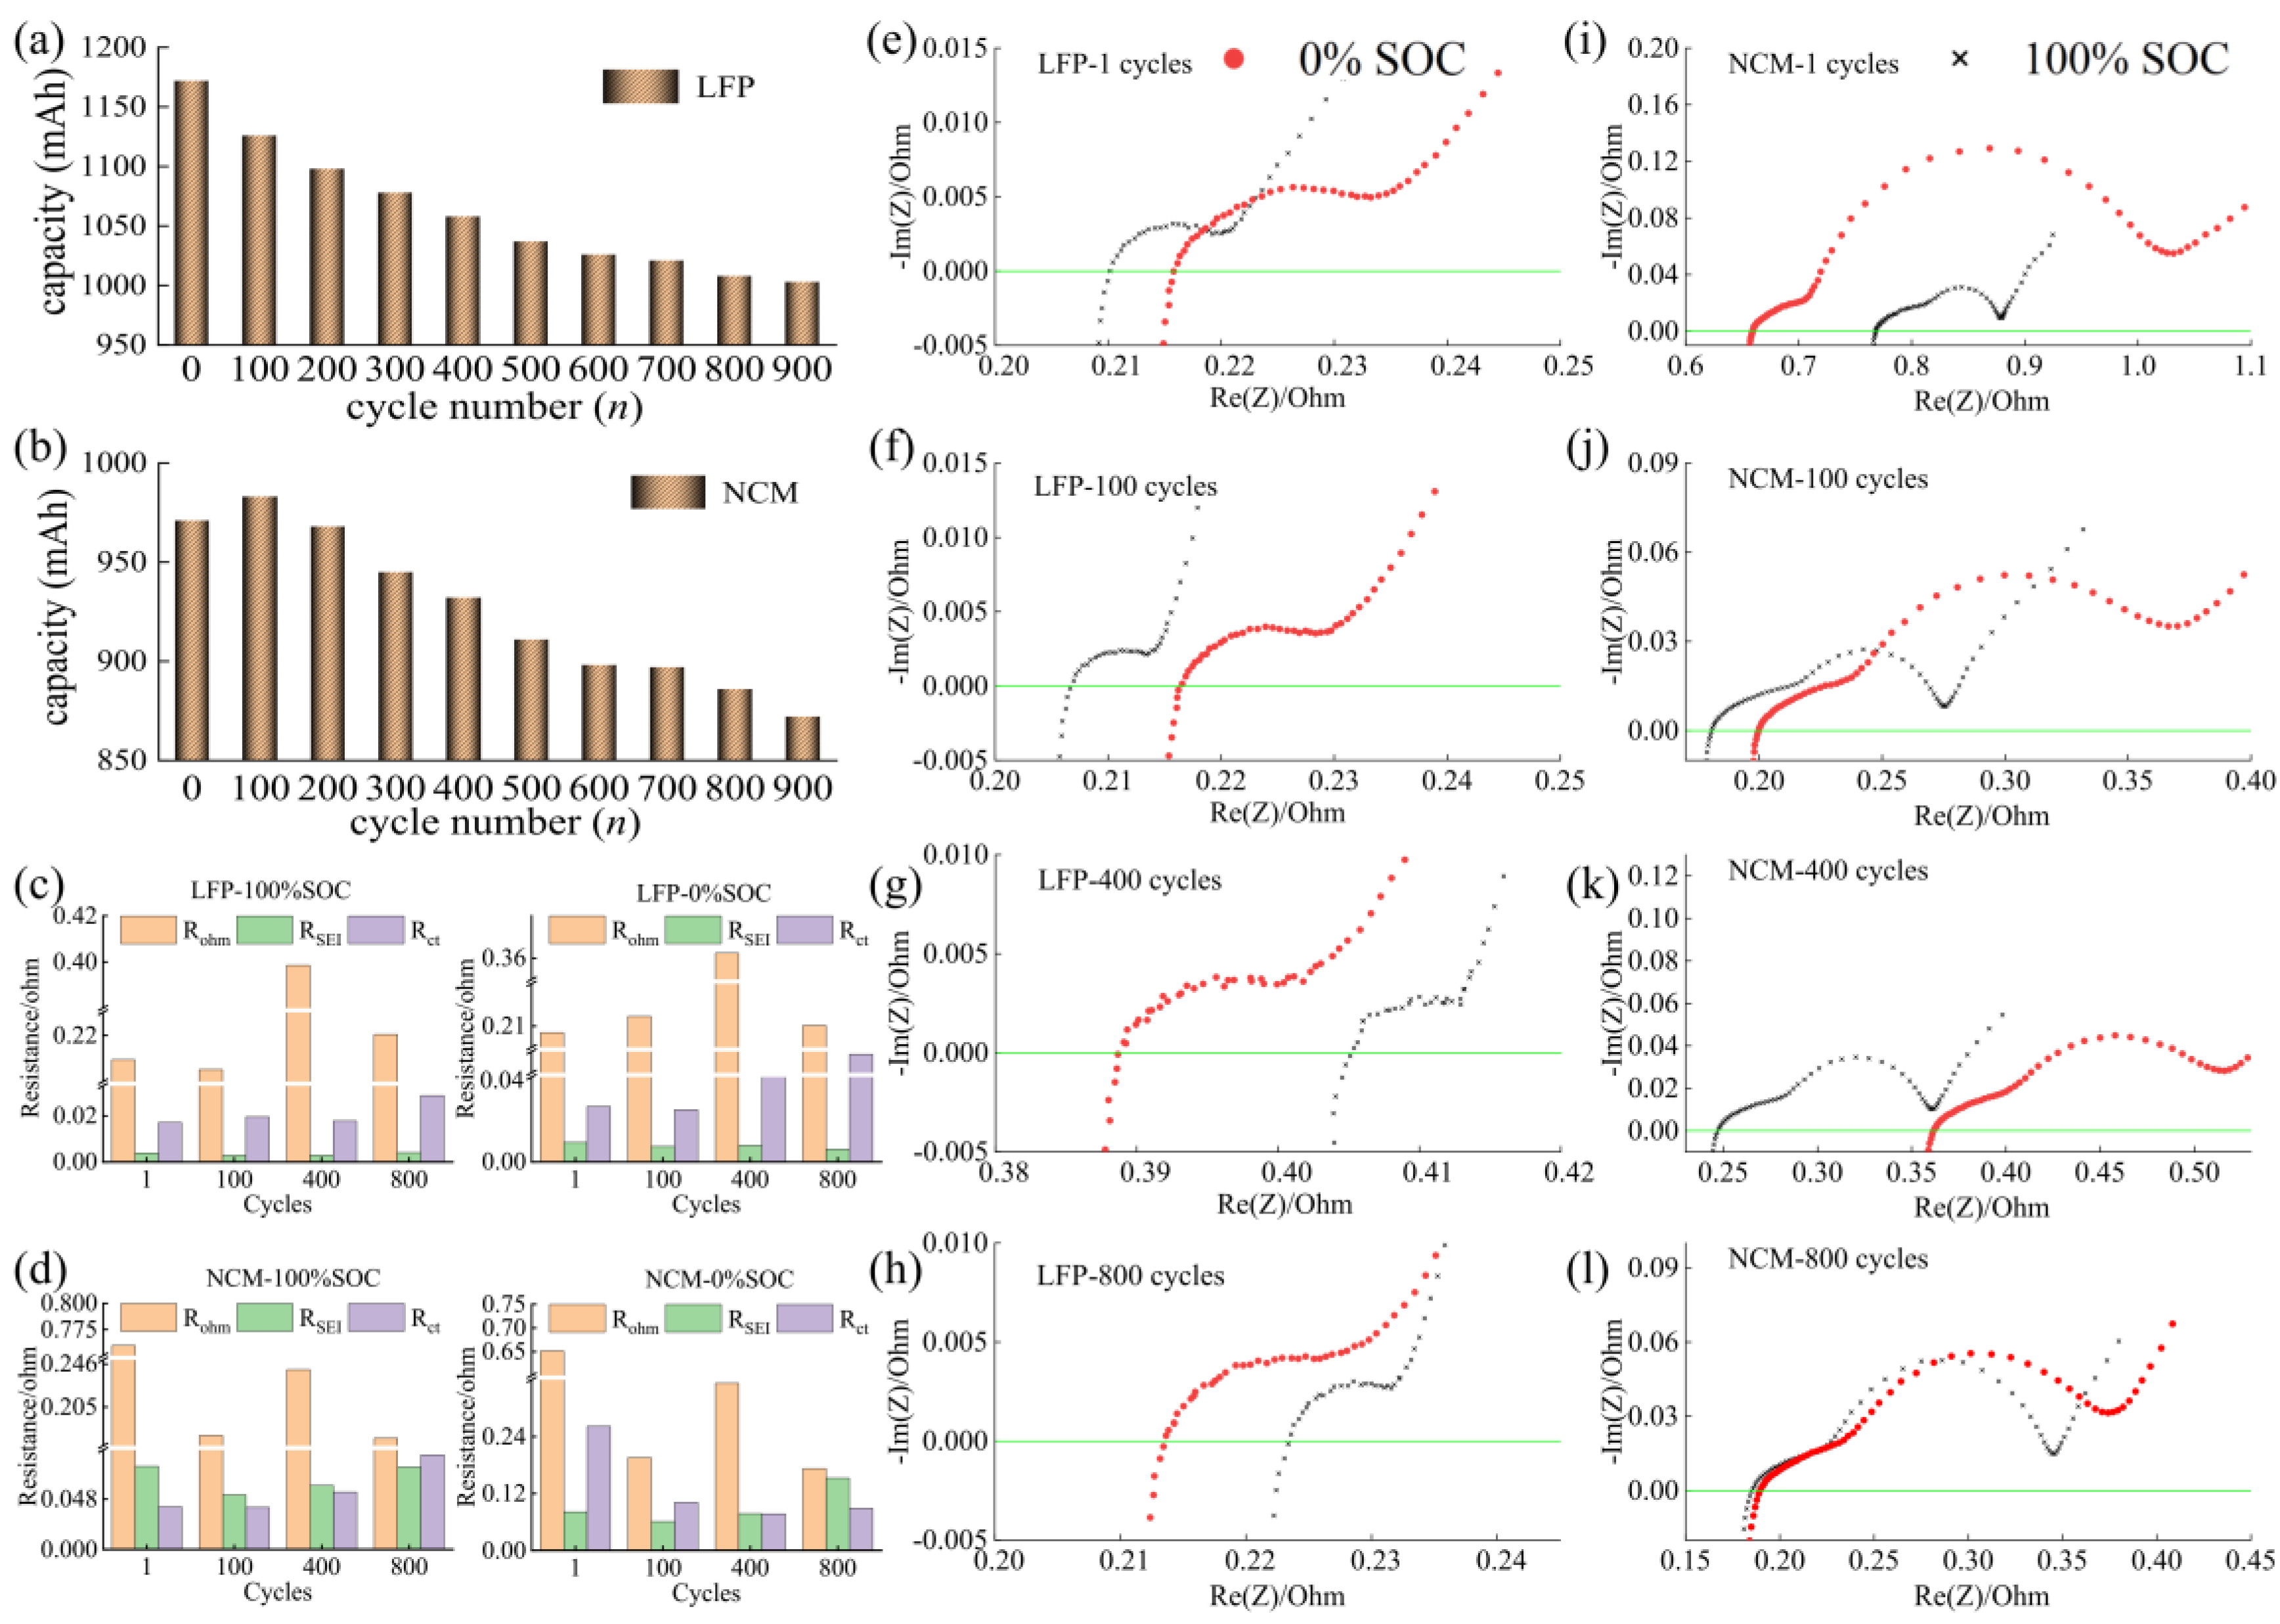
The capacity fade of the LFP and the NCM523 is in a nonlinear relationship with the cycle number, which is depicted in Figure 3a,b. For the LFP, after 900 cycles, the residual capacity decreases from 1172 mAh to 1003 mAh, while for the NCM523, the capacity decreases from 971 mAh to 886 mAh after 800 cycles. As a reference group, EIS is used to investigate the changes during the cyclic aging period for the LFP and NCM523, and the impedance spectra are measured at 0% SOC and 100% SOC for each cell (Figure 3e–l). It can be seen from Figure 3 that the Rohm does not have a significant relationship with battery aging or the charge state, which is related to the amount of electrolyte injection inside the cell, the electrode winding tension, the position of cell labs to fixture during measurement, and the cell packaging parameters of the pouch battery. Rct is confirmed to be an important parameter for characterizing the battery aging state [15], and it increases with the cycle number, which means that the electrochemical reactions gradually slow down with battery aging. Meanwhile, at 0% SOC, the cell of LFP and NCM523 witness significantly higher Rct values compared to 100% SOC during the early stage of the cycle aging test, and the results were confirmed by the fitting parameters, as illustrated in Figure 3c,d. As the cycling test proceeds, the difference between Rct at 0% SOC and 100% SOC of NCM523 lessens. The enlargement of RSEI indicates the growth of SEI, and it gradually increases to higher values and it is almost independent of the SOC [12,24].
The impedance properties of the SiO/Gr anode cell, a novel battery system, have not been extensively studied. We consider that the incorporation of SiO has a dramatic effect on the ohmic resistance, the solid electrolyte interface resistance, and charge transfer resistance, etc. Consequently, we undertake a comprehensive investigation of the impedance properties of cells with varying SiO concentrations, as well as examining and assessing the essential elements influencing the impedance parameters—the aging and charge state of the cell.
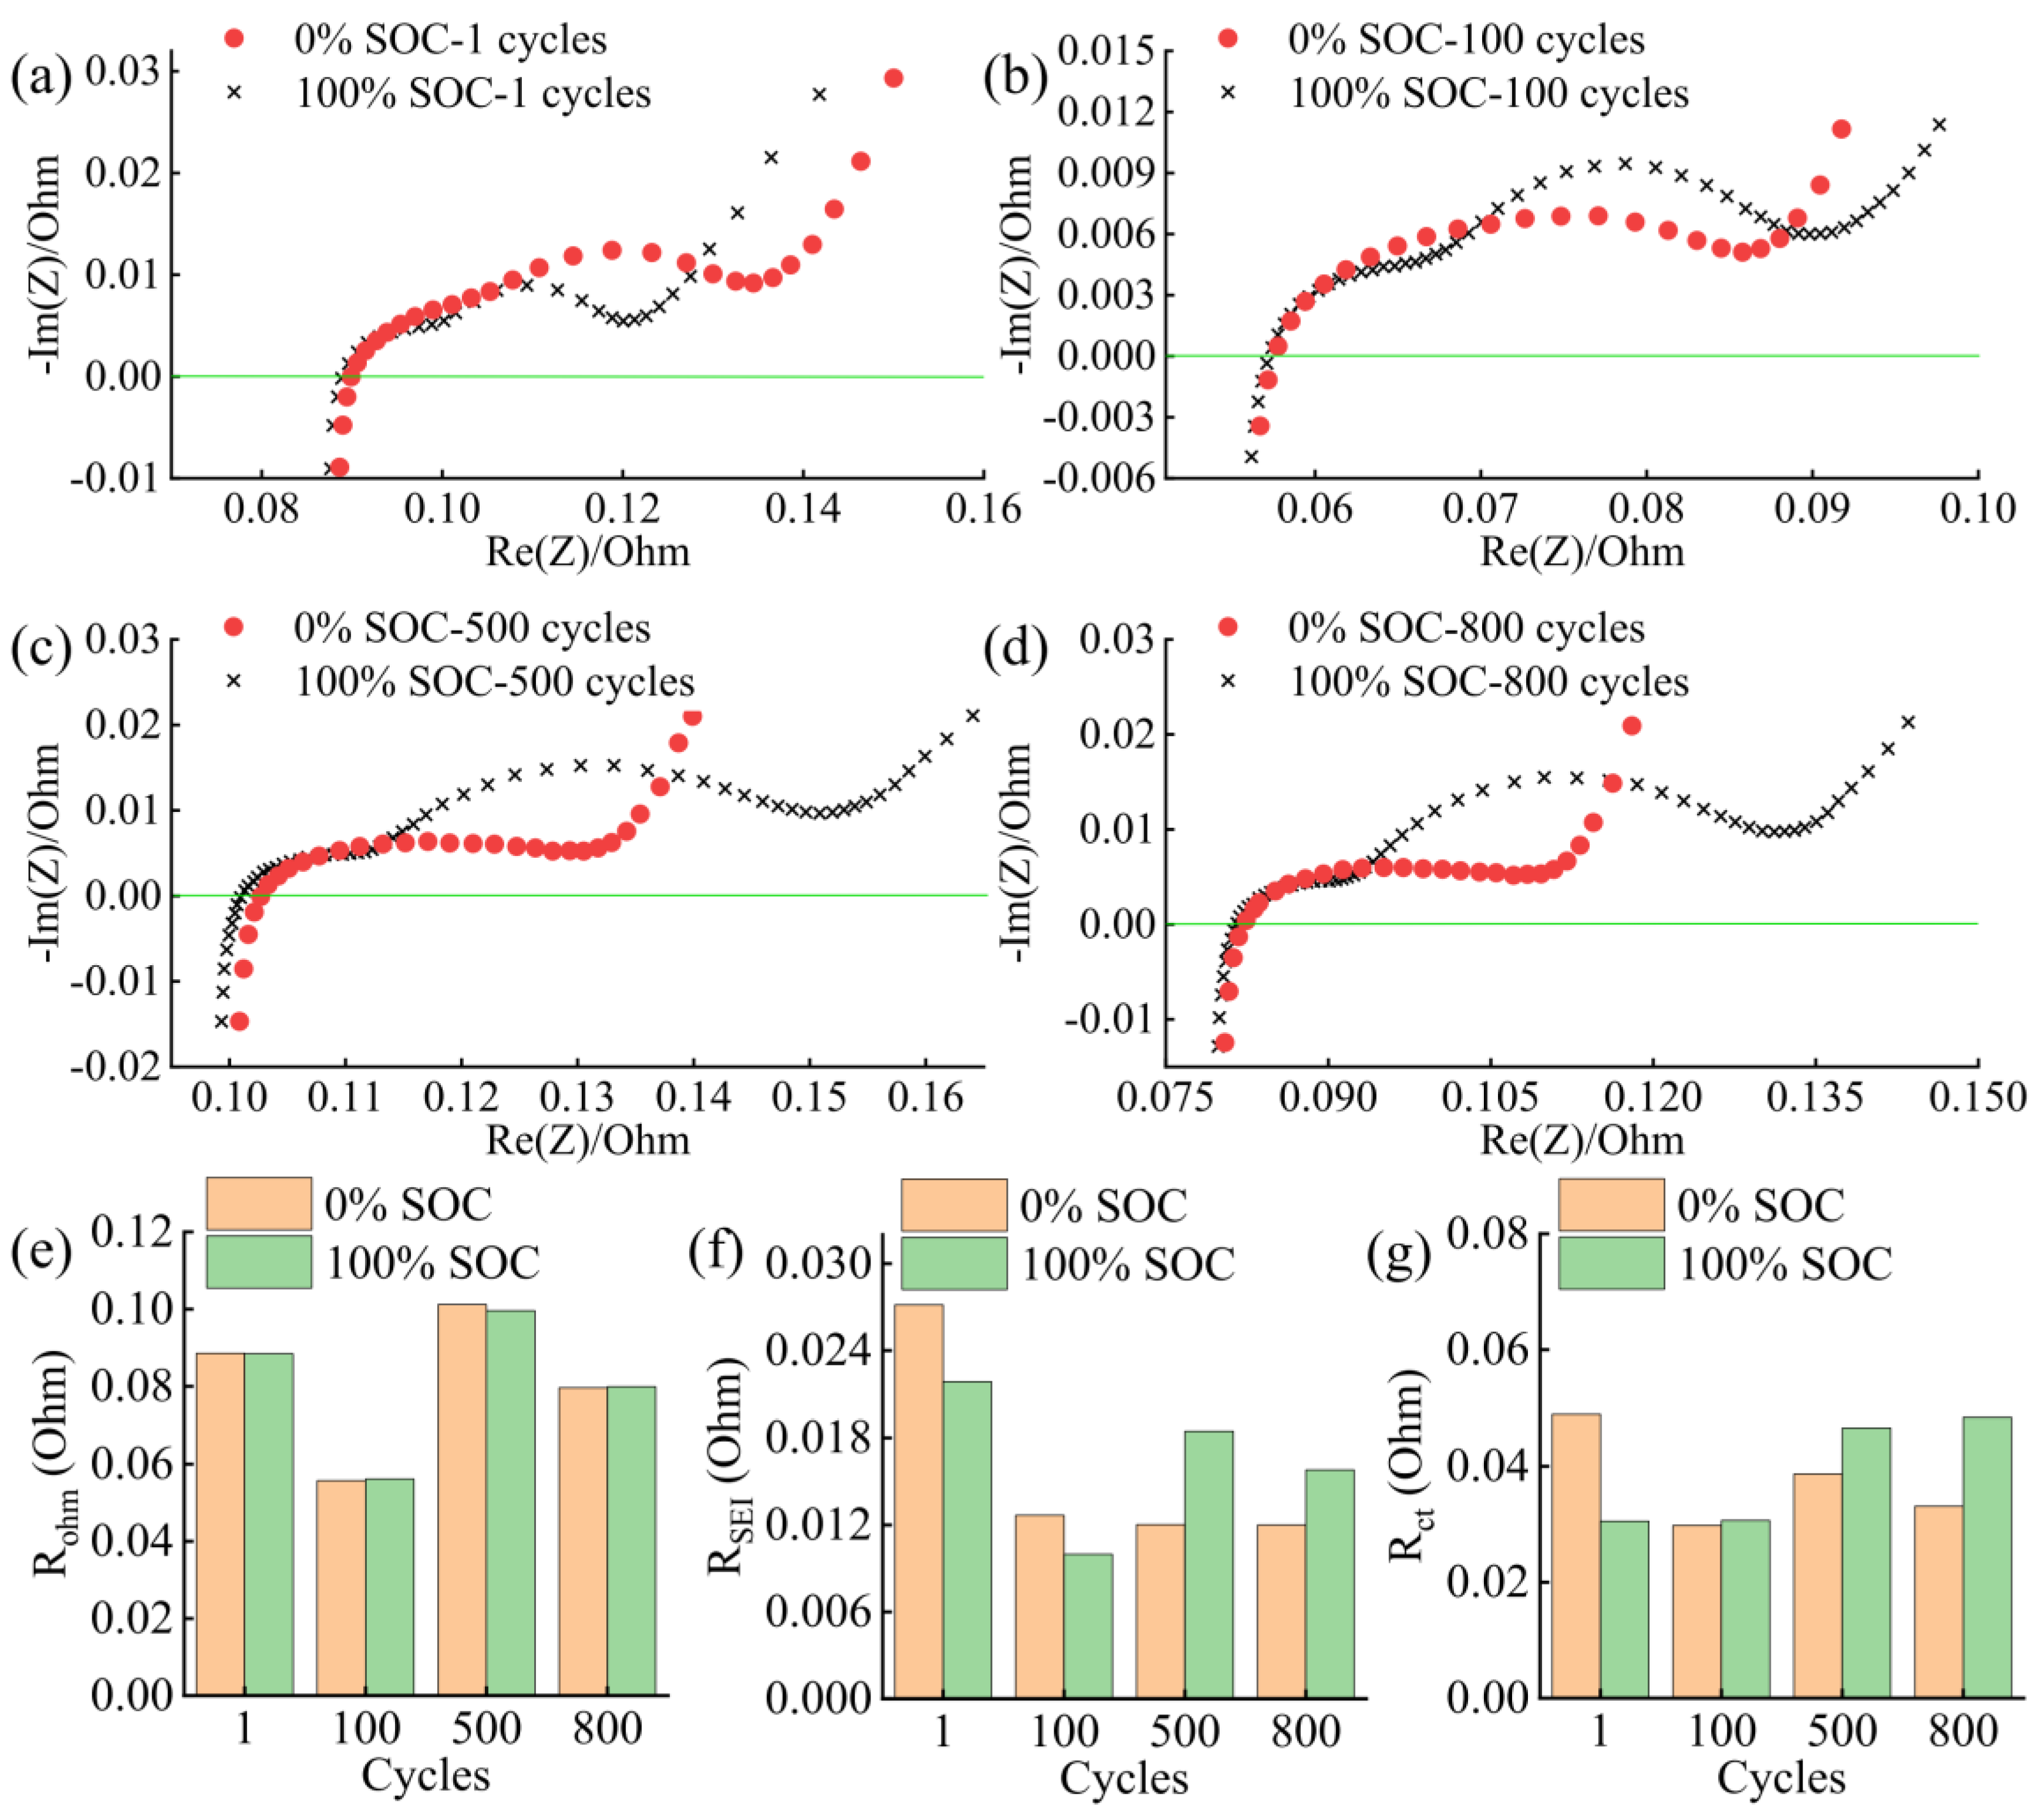
The physical and chemical properties within the cell can be reflected in the variation of the impedance curves [17], whilst the measurements of different cycles for the cell with 5 wt.% SiO are completed, as shown in Figure 4a–d. The value of Rohm does not show a correlation with the aging state and the state of charge, whilst Rohm at 0% SOC is slightly greater than that of the cell at 100% SOC (Figure 4e). Contrary to our expectation, the mid-high frequency semi-circle at 0% SOC is significantly larger than 100% SOC before the cycling test (the Rct corresponding to 0% SOC and 100% SOC are 0.049 Ω and 0.031 Ω, respectively). However, as the cells continuously age, Rct has a slightly lower value at 0% SOC than that of 100% SOC, as illustrated in Figure 4g. For example, after 800 cycles, the value of Rct at 0% SOC and 100% SOC are 0.048 Ω and 0.033 Ω, respectively. Moreover, in the early stages of battery aging, the RSEI of the cell at 0% SOC is larger than that of 100% SOC (the RSEI is 0.027 Ω at 0% SOC and a value of 0.022 Ω at 100% SOC), and as the number of cycles increases (>100 cycles), the RSEI at 0% SOC becomes significantly smaller than that at 100% SOC, and it shows a change in the relative position of the EIS curve in the mid-high-frequency region, as shown in Figure 4f.
Figure 5a–d show the Nyquist curves of the 10 wt.% SiO cell at the 1st, 100th, 500th, and 700th cycles. Comparing the EIS test data corresponding to multiple cycle numbers, it can be seen that the impedance curve corresponding to 0% SOC is summarized below the impedance curve measured at 100% SOC, and shifts to the right. This means that the Rohm and Rct of the cell change significantly as de-lithiation processes, and Figure 5e,g compare the fitting parameters from the EIS test data and quantify this difference. At 0% SOC, the value of Rohm at the 1st, 100th, 500th, and 700th cycle are 0.200 Ω, 0.129 Ω, 0.265 Ω, and 0.118 Ω, respectively, while at 100% SOC, the value of Rohm for the corresponding number of cycles is 0.180 Ω, 0.117 Ω, 0.217 Ω, and 0.105 Ω, respectively. In contrast to the above, at 0% SOC, the value of Rct at the 1st, 100th, 500th, and 700th cycle are 0.037 Ω, 0.029 Ω, 0.024 Ω, and 0.028 Ω, respectively, while at 100% SOC, the value of Rct for the corresponding number of cycles is 0.045 Ω, 0.042 Ω, 0.055 Ω, and 0.061 Ω, respectively. This specific phenomenon was brought to our attention and it is markedly distinct from the existing understanding of EIS applications. The value of RSEI at 0% SOC decreases and then increases with the number of cycles, while at 100% SOC, the value of RSEI fluctuates within a small range (Figure 5f).
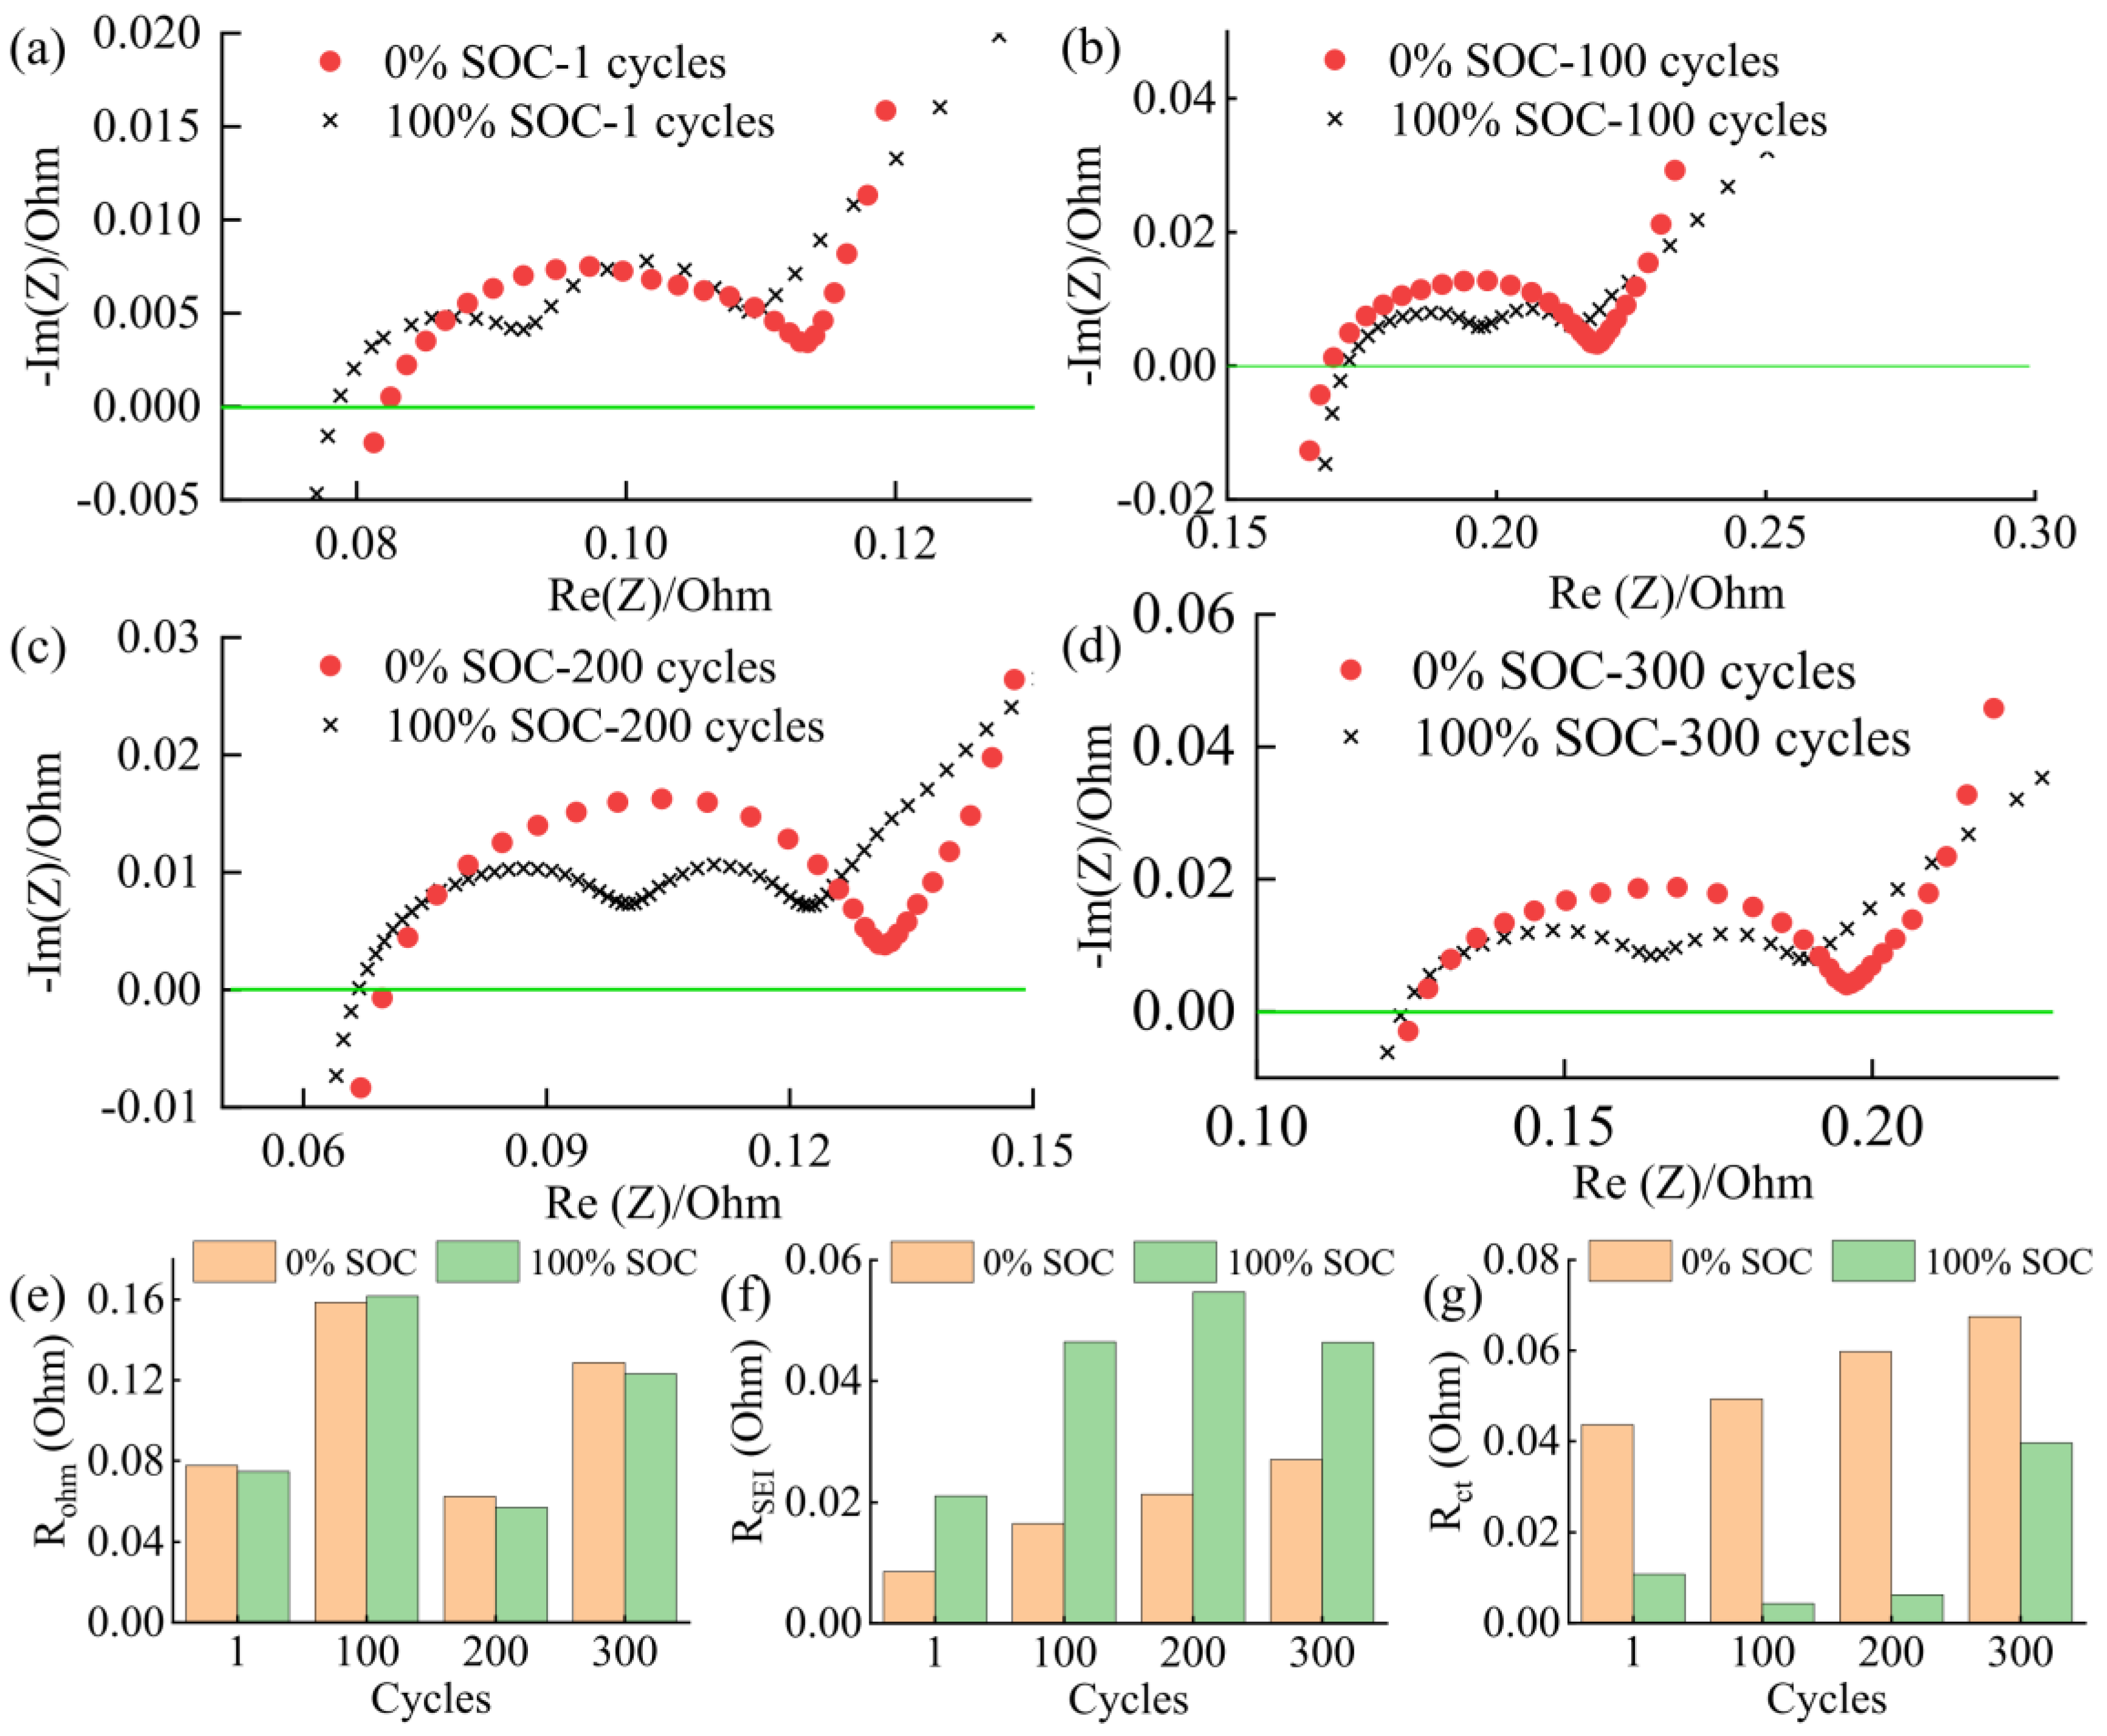
Similarly to the previous EIS test and analysis process, for the cell 20 wt.% SiO, the impedance spectra and model fitting data at the 1st, 100th, 200th, and 300th cycles are also tested and parametrically analyzed in detail. As shown in Figure 6a–d, the impedance results between 0% SOC and 100% SOC under four different cycle numbers are compared. The value of Rohm makes no significant difference between fully charged and fully discharged states, as shown in Figure 6e. Nevertheless, the RSEI and Rct demonstrate a more considerable disparity between the two SOCs (0% SOC and 100% SOC). During the cycling test, the side-reaction both in graphite and SiO particles interface leads to the ever thickening-SEI film, especially in the cell with SiO/Gr anodes [25]. Thus, the ever-growing RSEI of the cell 20 wt.% SiO always shows a significantly smaller value at 0% SOC than it does at 100% SOC, as illustrated in Figure 6f. At the first cycle, the values of RSEI at 0% SOC and 100% SOC are 0.009 Ω and 0.021 Ω, respectively. Following 300 cycles, the value of RSEI increased to 0.027 Ω and 0.046 Ω when the SOC was 0% and 100%, respectively. Based on the ECM fitting results, Rct increases with the number of cycles at 0% SOC and is always significantly greater than its value at 100% SOC (Figure 6g). At the 1st and 300th cycle, the value of Rct gradually increases from 0.044 Ω to 0.067 Ω at 0% SOC, while at 100% SOC, the value of Rct decreases and then increases as the cycle progresses (Rct at the 1st, 100th, 200th, and 300th cycle are 0.011 Ω, 0.004 Ω, 0.006 Ω, and 0.040 Ω, respectively).
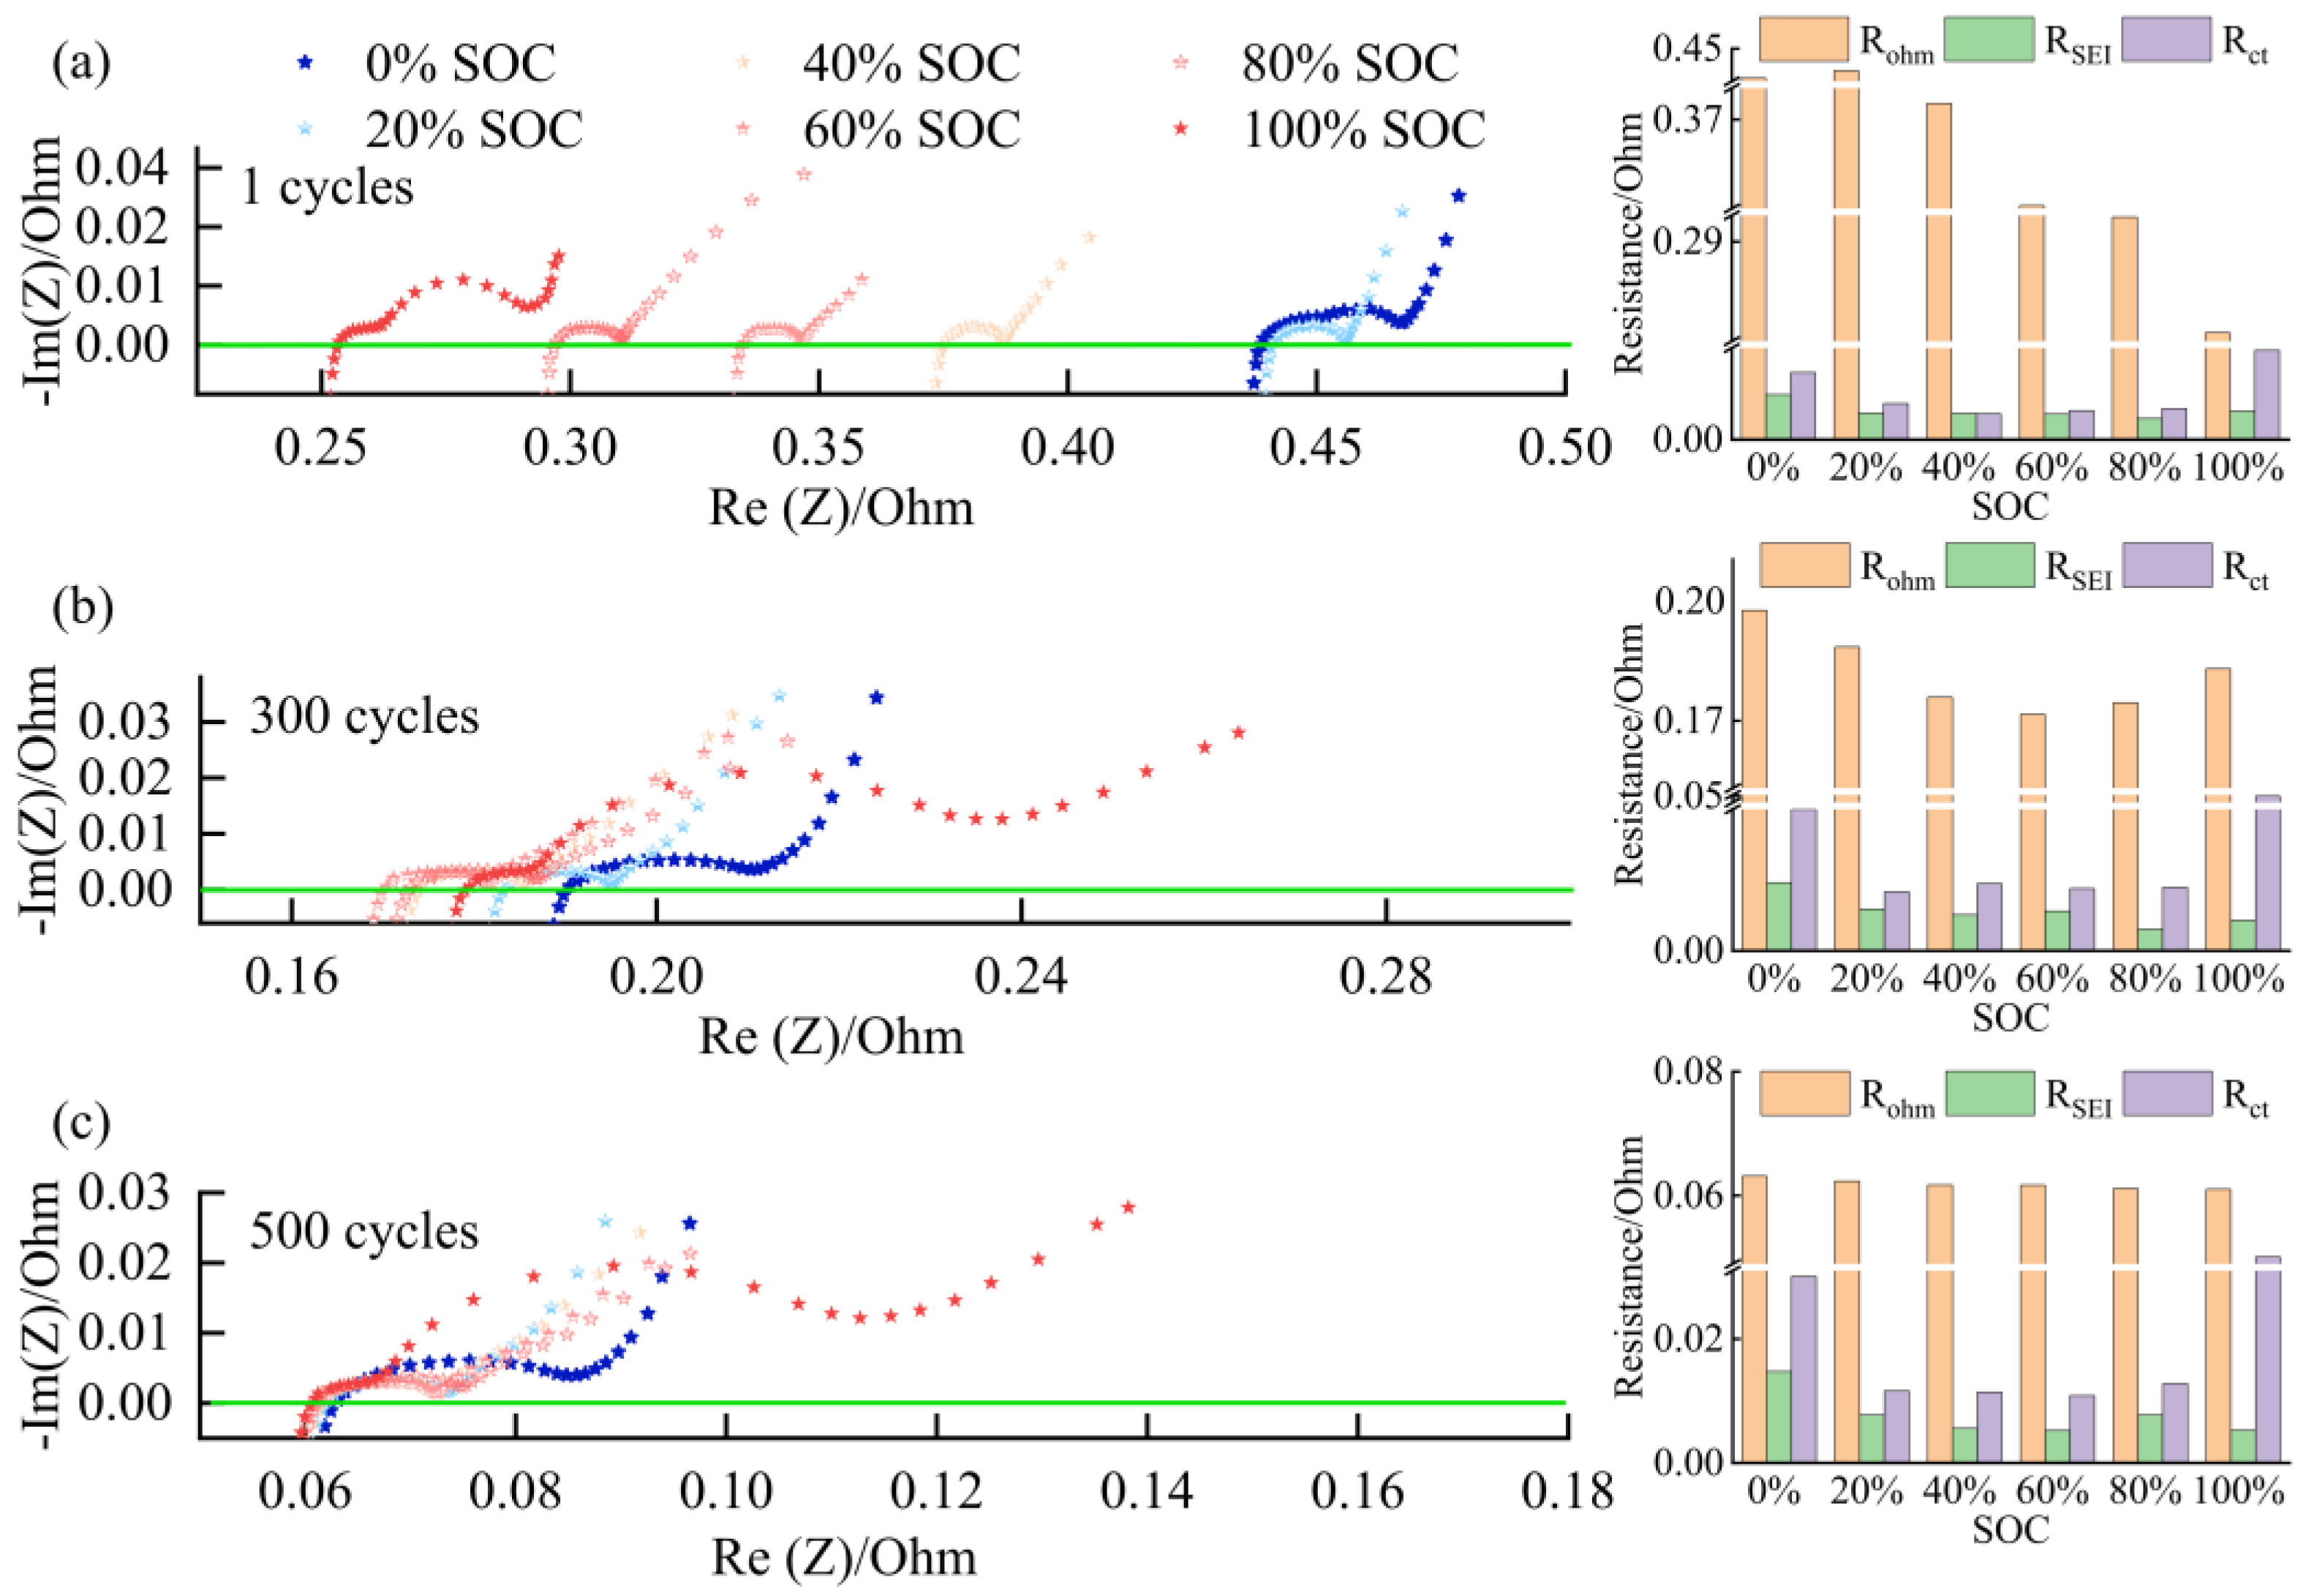
To examine the exact impedance characteristics of cell 10 wt.% SiO in greater detail, EIS experiments were carried out at various SOCs (with a gradient of 20% SOC), and the corresponding impedance fitting parameters are plotted in Figure 7. This presents in detail the gradual change in the EIS curves of a fresh battery from a full charge state to a fully discharged state (Figure 7a). The EIS curves clearly show that the SOC can significantly affect the impedance properties for the cell 10 wt.% SiO. During the discharge period (from 100% SOC to 20% SOC), the expansion pressure between the cell electrodes gradually decreases, the curves shift to the right and the diminishing arcs signify a decline in charge transfer impedance and the increment of Rohm. When the fresh cell is completely discharged, there is a small difference in Rohm compared with the 20% SOC condition, however, Rct is significantly increased, as a result of the internal polarization of the cell and concentration of Li+ in the electrolyte [26]. In Figure 7b, with the cell discharged, Rohm shows a pattern of decreasing and then increasing, which is the same trend as Rct. With the cycle numbers increasing, Rohm is no longer sensitive to the SOC, while Rct still shows a declining and then ascending pattern, as shown in Figure 7c. RSEI always slowly increases with the discharge process during the different stages of degradation, with the cell performance advancing degradation, RSEI slowly increases under the same SOC of the cell during subsequent cycle charge/discharge tests.
Combining the above EIS test and ECM fitting data, the differences in the impedance properties of cells with a different weight percentage of SiO can be summarized as:
  • In this work, each cell is filled with a sufficient quantity of electrolyte, and the effect of electrolyte consumption on ohmic resistance is ignored. In contrast, the active lithium loss and the SiO particles volume expansion of the electrode have a more pronounced and direct effect on the conductivity and diffusivity properties [27].
  • For the cell 5 wt.% SiO and the cell 10 wt.% SiO, Rohm decreases during charging due to the moderate swelling of the anode electrodes. However, the volume expansion of the SiO particles and the continued growth of SEI film significantly affect the diffusion of Li+ in the electrode particles and electrolyte, especially when the cell is fully charged. As the mechanical force responds, the effective electrolyte conductivity and diffusivity decrease, causing a gradual increase in charge transfer resistance. For the cell 20 wt.% SiO, the irreversible change of the fracture of SiO particles and the formation of the solid-electrolyte interphase are completed in the early stage during cyclic aging. Therefore, the SOC has no significant effect on Rohm after a few cycles for cell 20 wt.% SiO. On the contrary, incorporating a surplus of SiO particles resulted in significant crack extensions and the flaking of the active material in the anode. The significant swelling of the anode electrode when the cell finished charging will instead precisely fit the electrode to the active material, thus reducing the value of Rct.
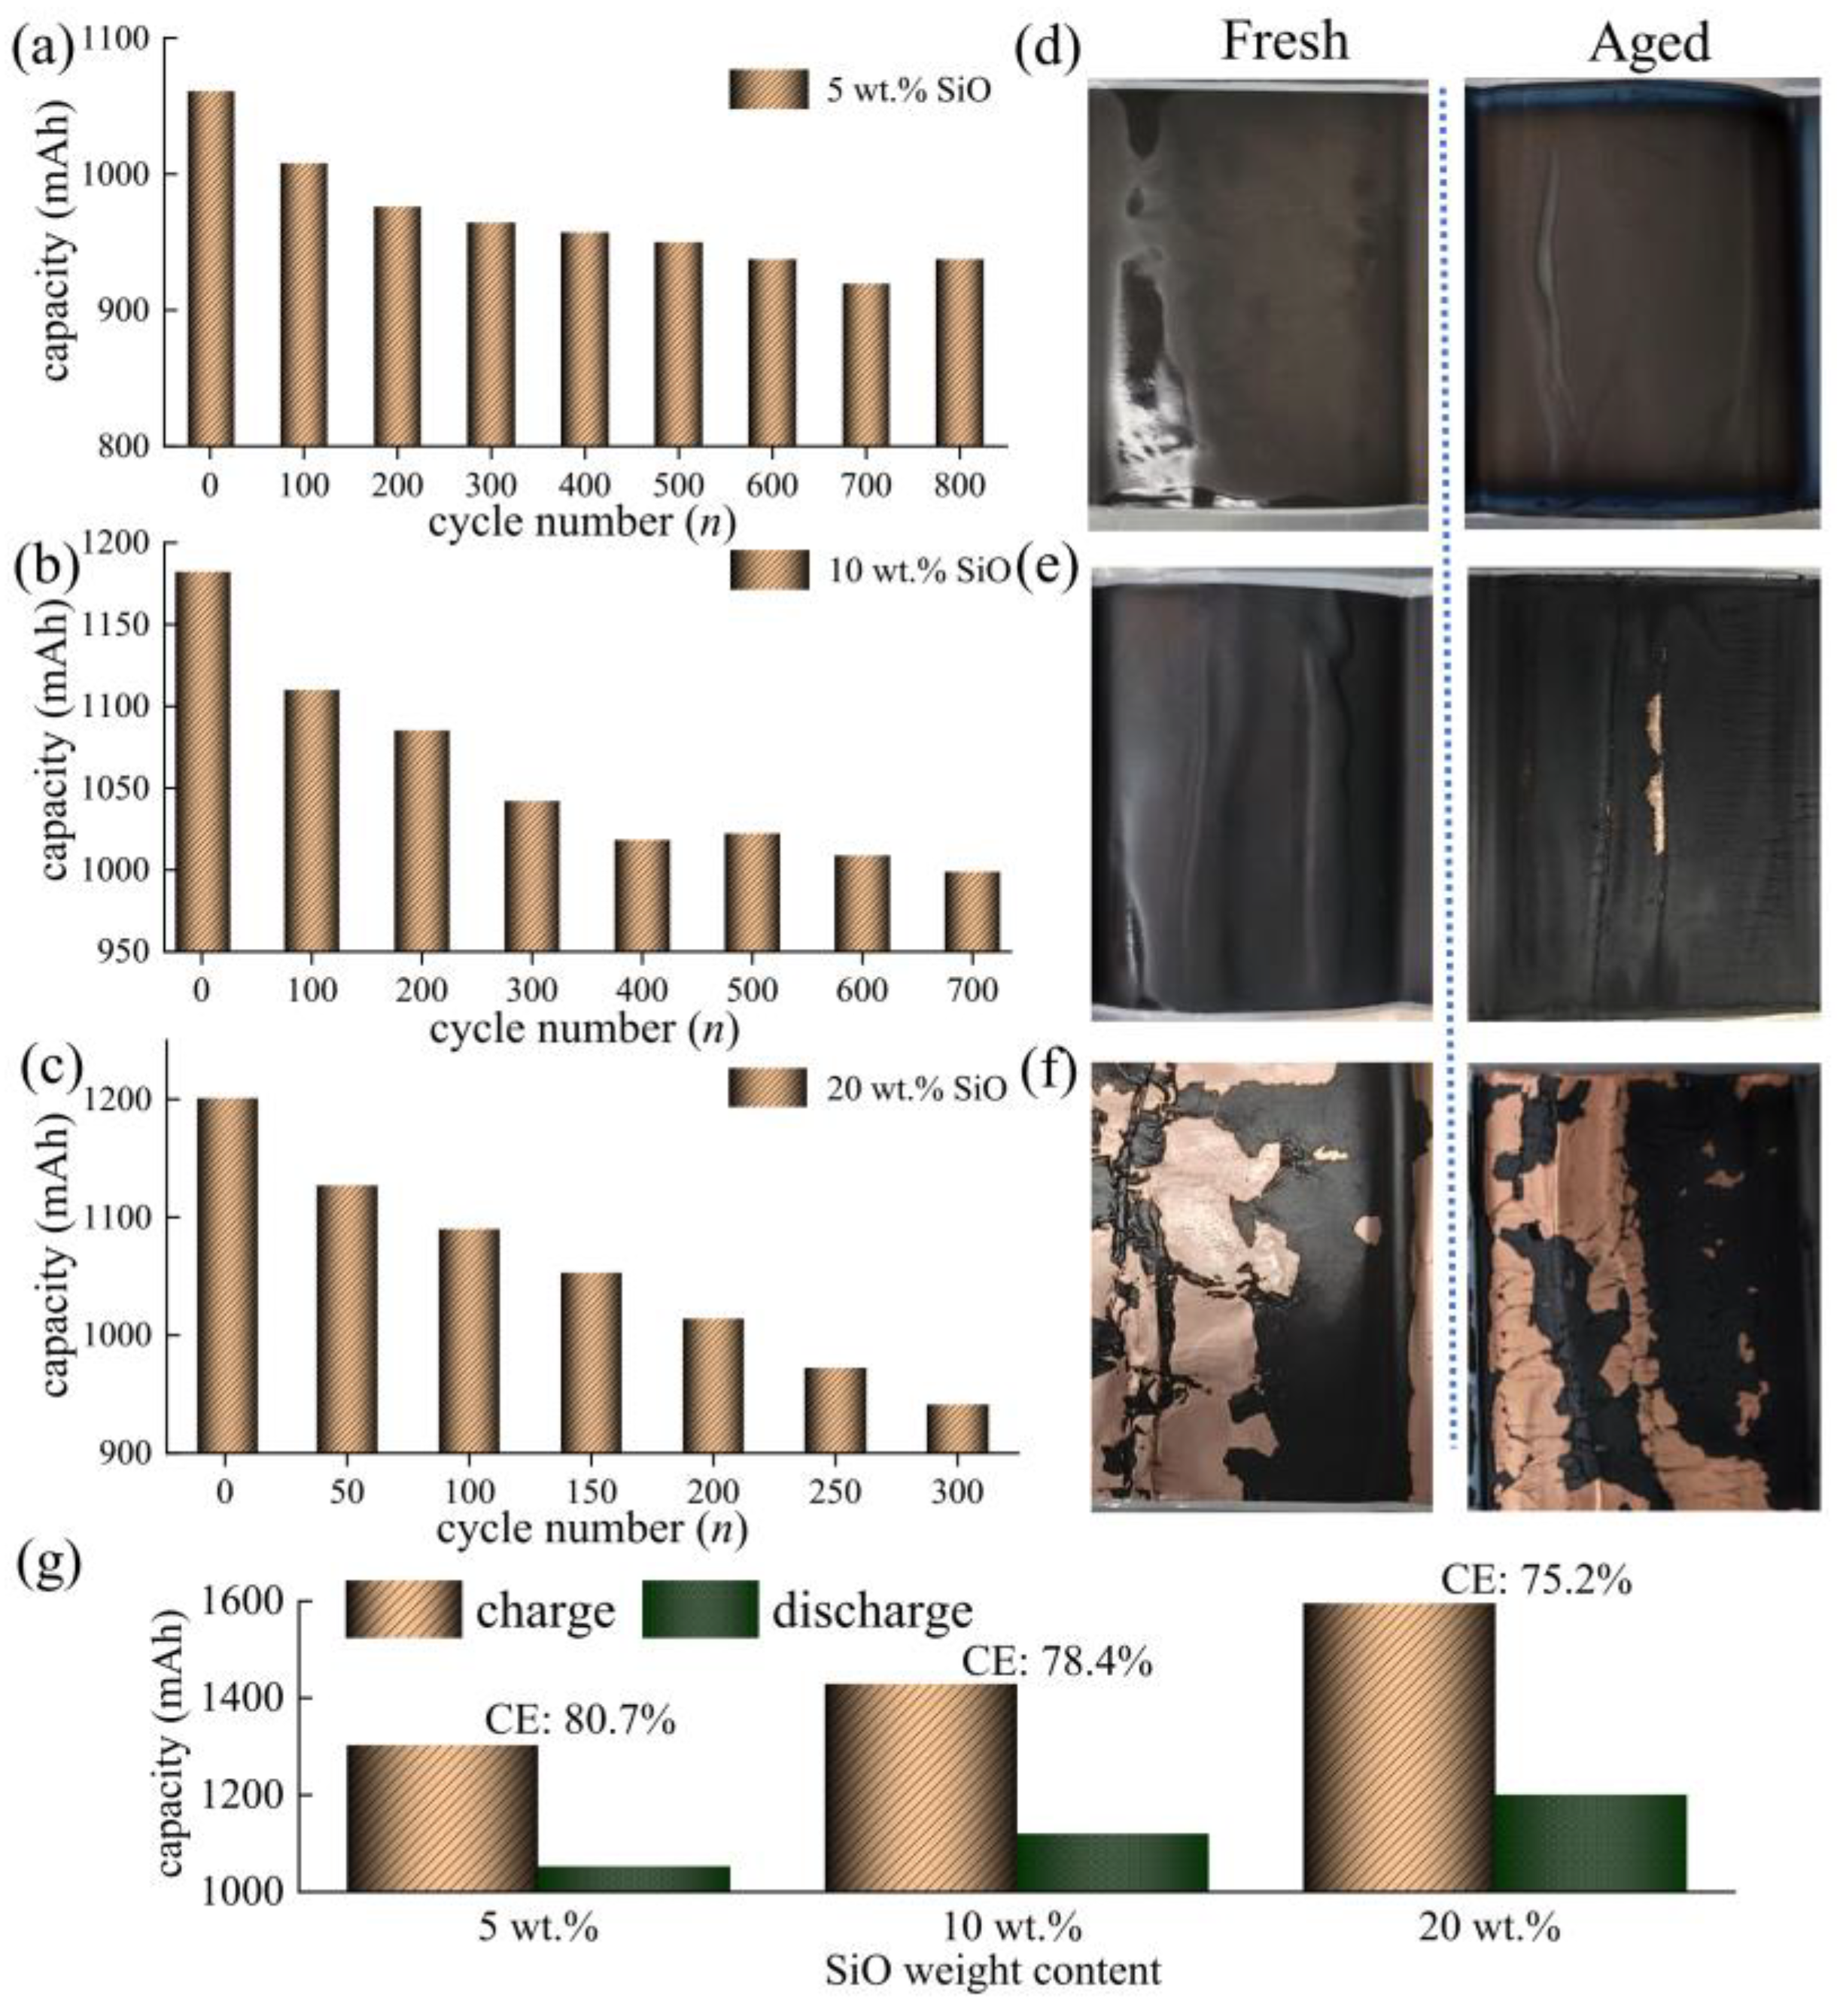
To verify the results of the above discussion, further electrochemical performance experiments were performed and a post mortem analysis was conducted. As shown in Figure 8a–c, the residual capacity results of SiO/Gr anode cell with different SiO weight ratios (5 wt.%, 10 wt.%, and 20 wt.%) are presented. It can be concluded that there is a significant difference in rate of capacity fade before the end of life (EoL) for these cells, the addition of excess SiO particles leads to the rapid capacity degradation of cell 20 wt.% SiO, and the capacity fade rate of cell 5 wt.%SiO is slightly lower than that of cell 10 wt.%SiO. The above conclusions are also supported by the optical microscopy images of the anode electrodes, which are shown as a schematic in Figure 8d–f. By comparing the appearance of the pristine anode and the cycled anode electrodes, we notice that the weight ratio of the SiO particles has a significant effect on the degradation performance. During the lithiation stage, the SiO particles will experience an ultra-large volume expansion, resulting in significant mechanical stress evolution, particle fractures, and the depletion of active material. Thus, the non-uniformity of the particle volume expansion between SiO and graphite will accelerate the battery degradation and contribute to the electrode swelling. For example, as displayed in Figure 8f, the high weight ratio (~20 wt.%) of the SiO particles mixed in the anode leads to particle exfoliation and delamination between the active layers and current collectors, even in the beginning of life. However, for cell 5 wt.% SiO, the aged anode does not show a fracture of active layers (Figure 8d), and cell 10 wt.% SiO shows the slight delamination of the active materials after cyclic aging (Figure 8e). Figure 8g shows the Coulombic efficiency during the formation cycle for SiO/Gr anode cells. As the SiO particles weight content increases, the Coulomb efficiency of the cell decreases. The lithiation mechanism of the dual-phase a-Si/c-FeSi2 alloy particles during the formation cycles and the subsequent extended cycling has been reported in detail by Kumar et al. [22]. The post mortem characterization using STEM-EDX was conducted by Kumar et al. [22], wherein the overwhelming amounts of F and carbonates indicated the decomposition of the electrolyte and the formation of SEI film, suggesting that the SiO/Gr anode consumes a part of electrolyte and Li-ions, and the thickness will increase after the formation cycles for the anode electrodes [22]. Due to particle fractures and crack expansion caused by the large volumetric variations faced by the SiO particles during the prolonged cycling, leading to the continuous growth of SEI films and the constant consumption of electrolyte and triggering a reduction in residual capacity, more details can be confirmed and explained by the research results of Kumar et al. [22].
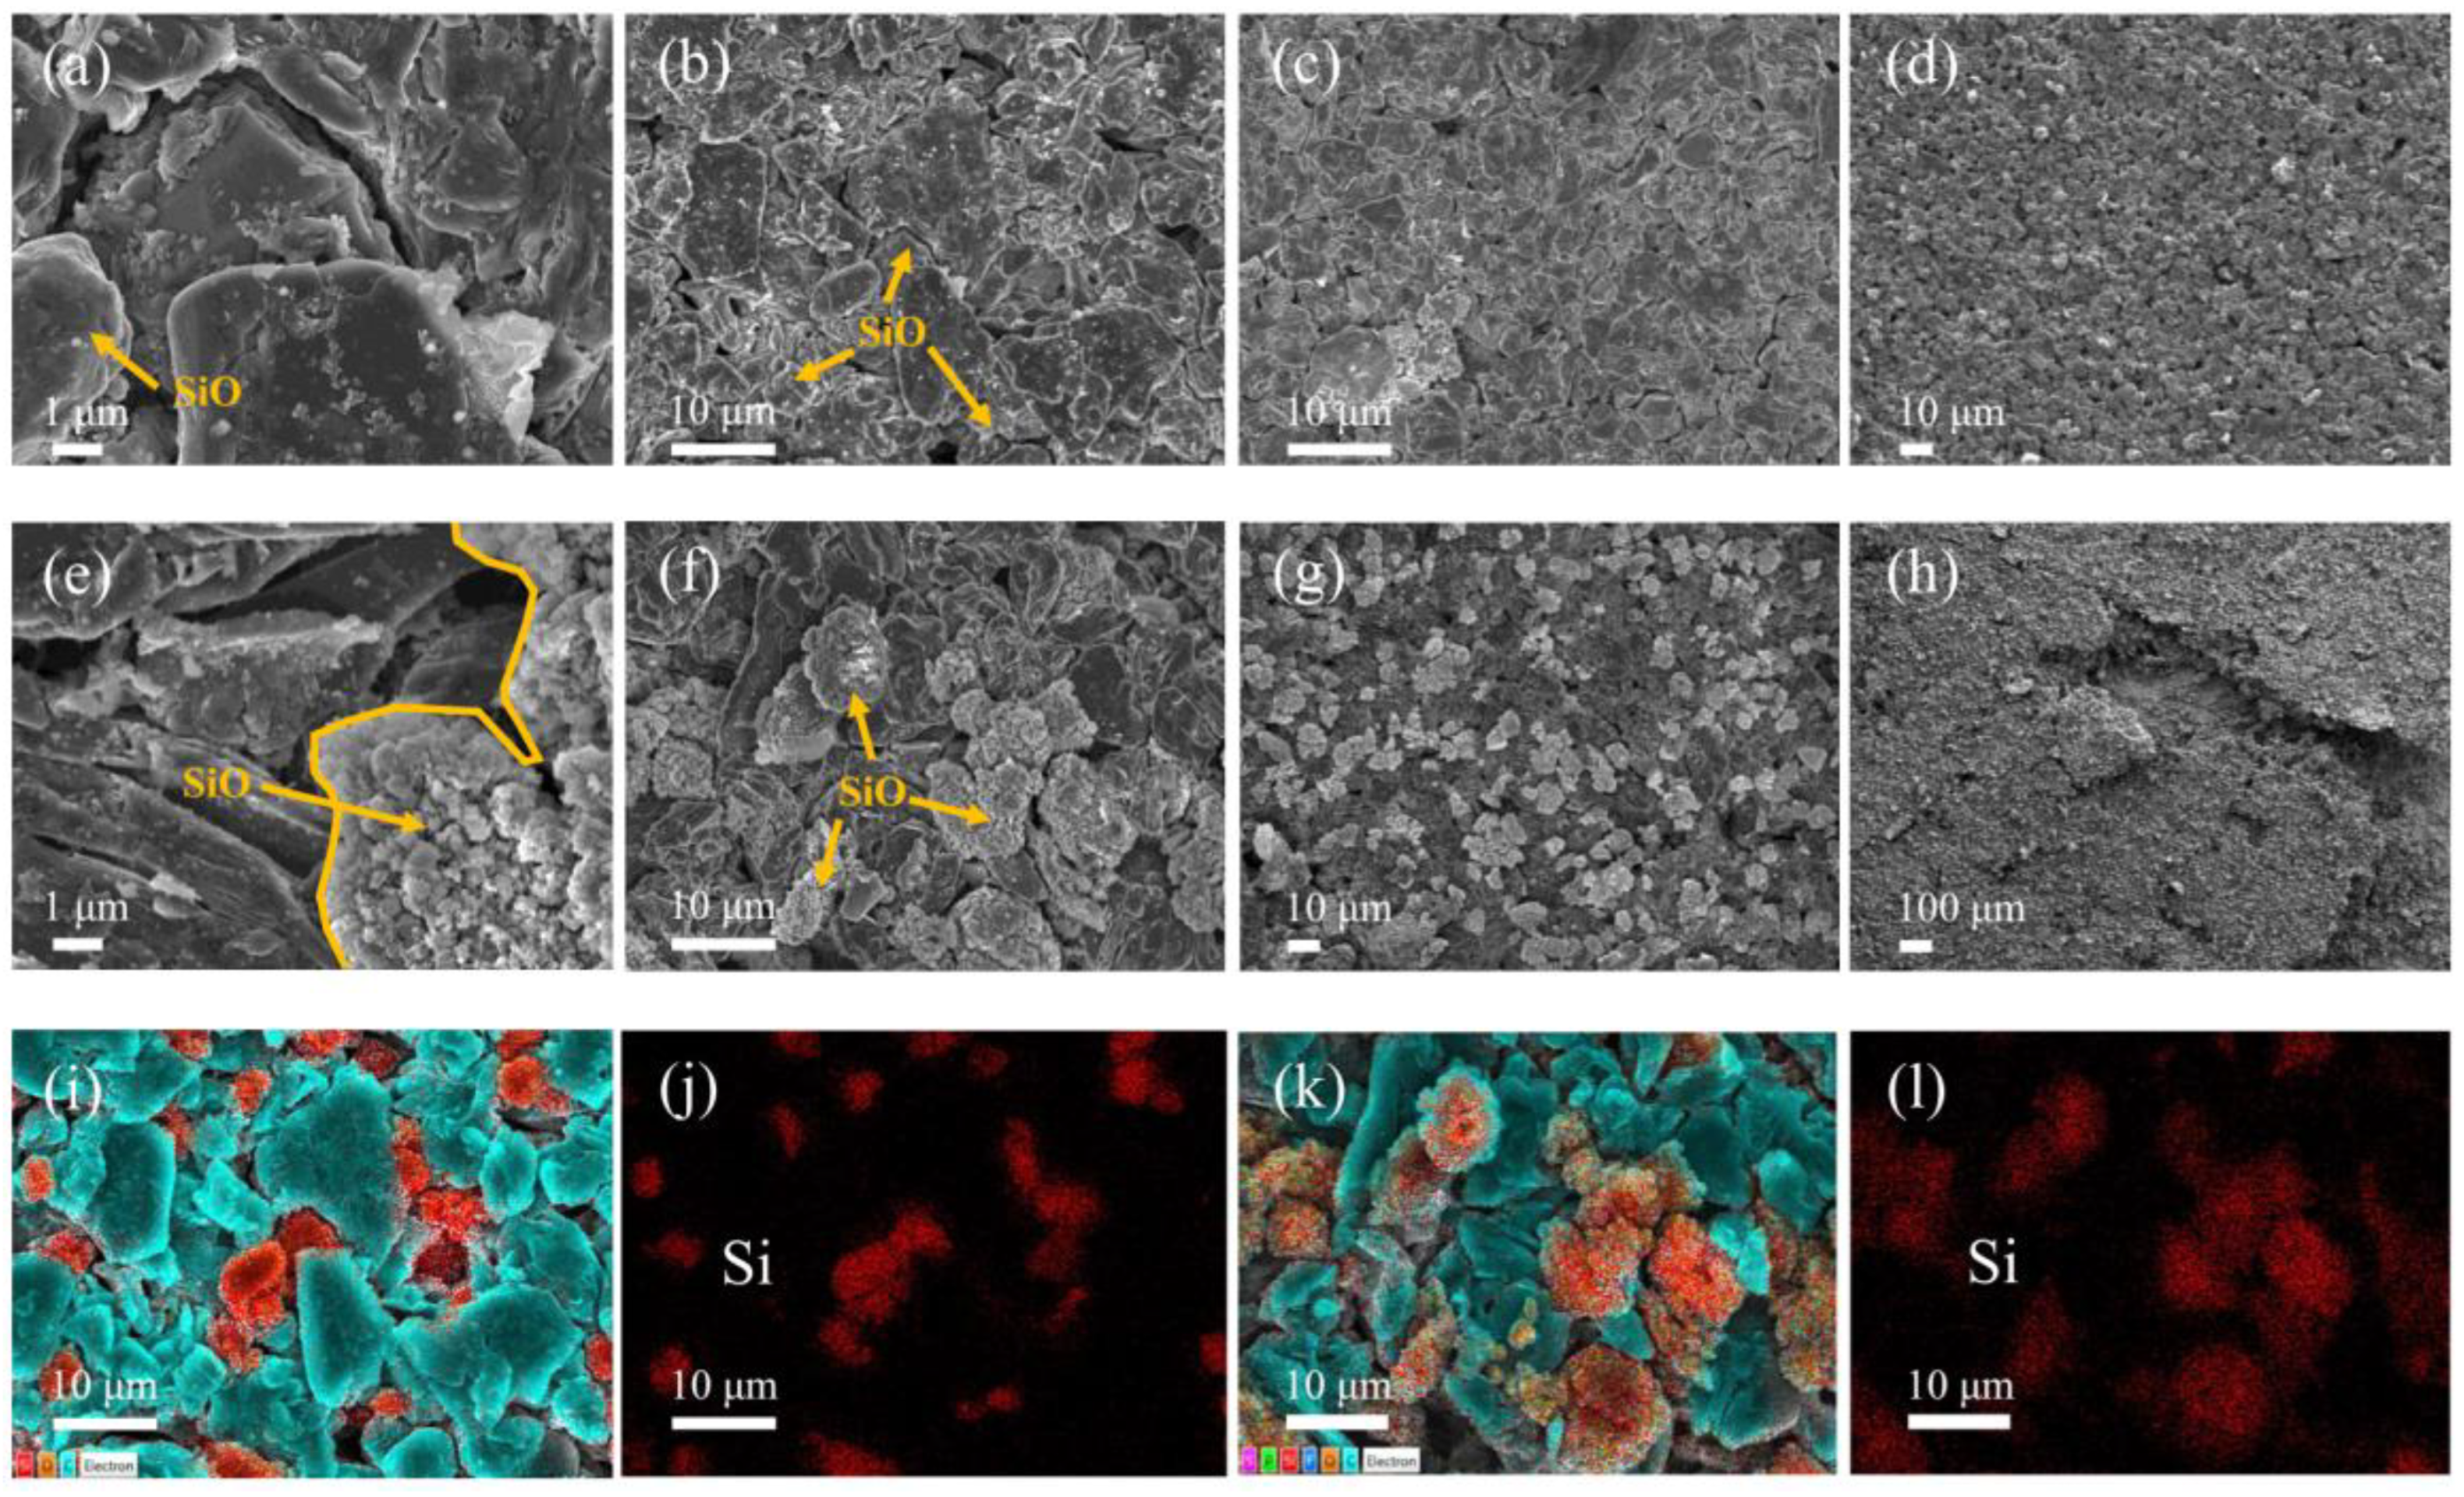
The anode surfaces of the cell 10 wt.% SiO were investigated by SEM, and the morphology changes and SiO particles evolution during the cyclic aging process are compared in Figure 9a–h. The SiO particles were randomly distributed amongst the graphite particles and are slightly slimmer in diameter, as presented in Figure 9b,f. Compared to the fresh SiO/Gr anode in Figure 9a,b, concomitant with cracking in the SiO particles after 800 cycles, as observed in Figure 9e,f, respectively. The degradation effects are reflected in the anode such as particle cracking, the growth of SEI, and the cracks of active layers (as shown in Figure 9h). The EDS images of Figure 9i–l demonstrate the presence of SiO particles at BoL and EoL. In the maps, red regions represent SiO domains while the grey-green regions correspond to graphite. The SiO/Gr electrode coating contains some individual SiO particles that are uniformly distributed, with clear particle edges (Figure 9i). In contrast, as presented in Figure 9k,l, the SiO particles become increasingly amorphous, and the fragments of the particles are fragmented. This particulate morphology evolution of SiO can be attributed to the results of repeated lithiation/delithiation processes, which induce the cumulative mismatch stresses at the interface between the active layer and the current collector. The above phenomenon is consistent with the observations of other researchers [28,29].
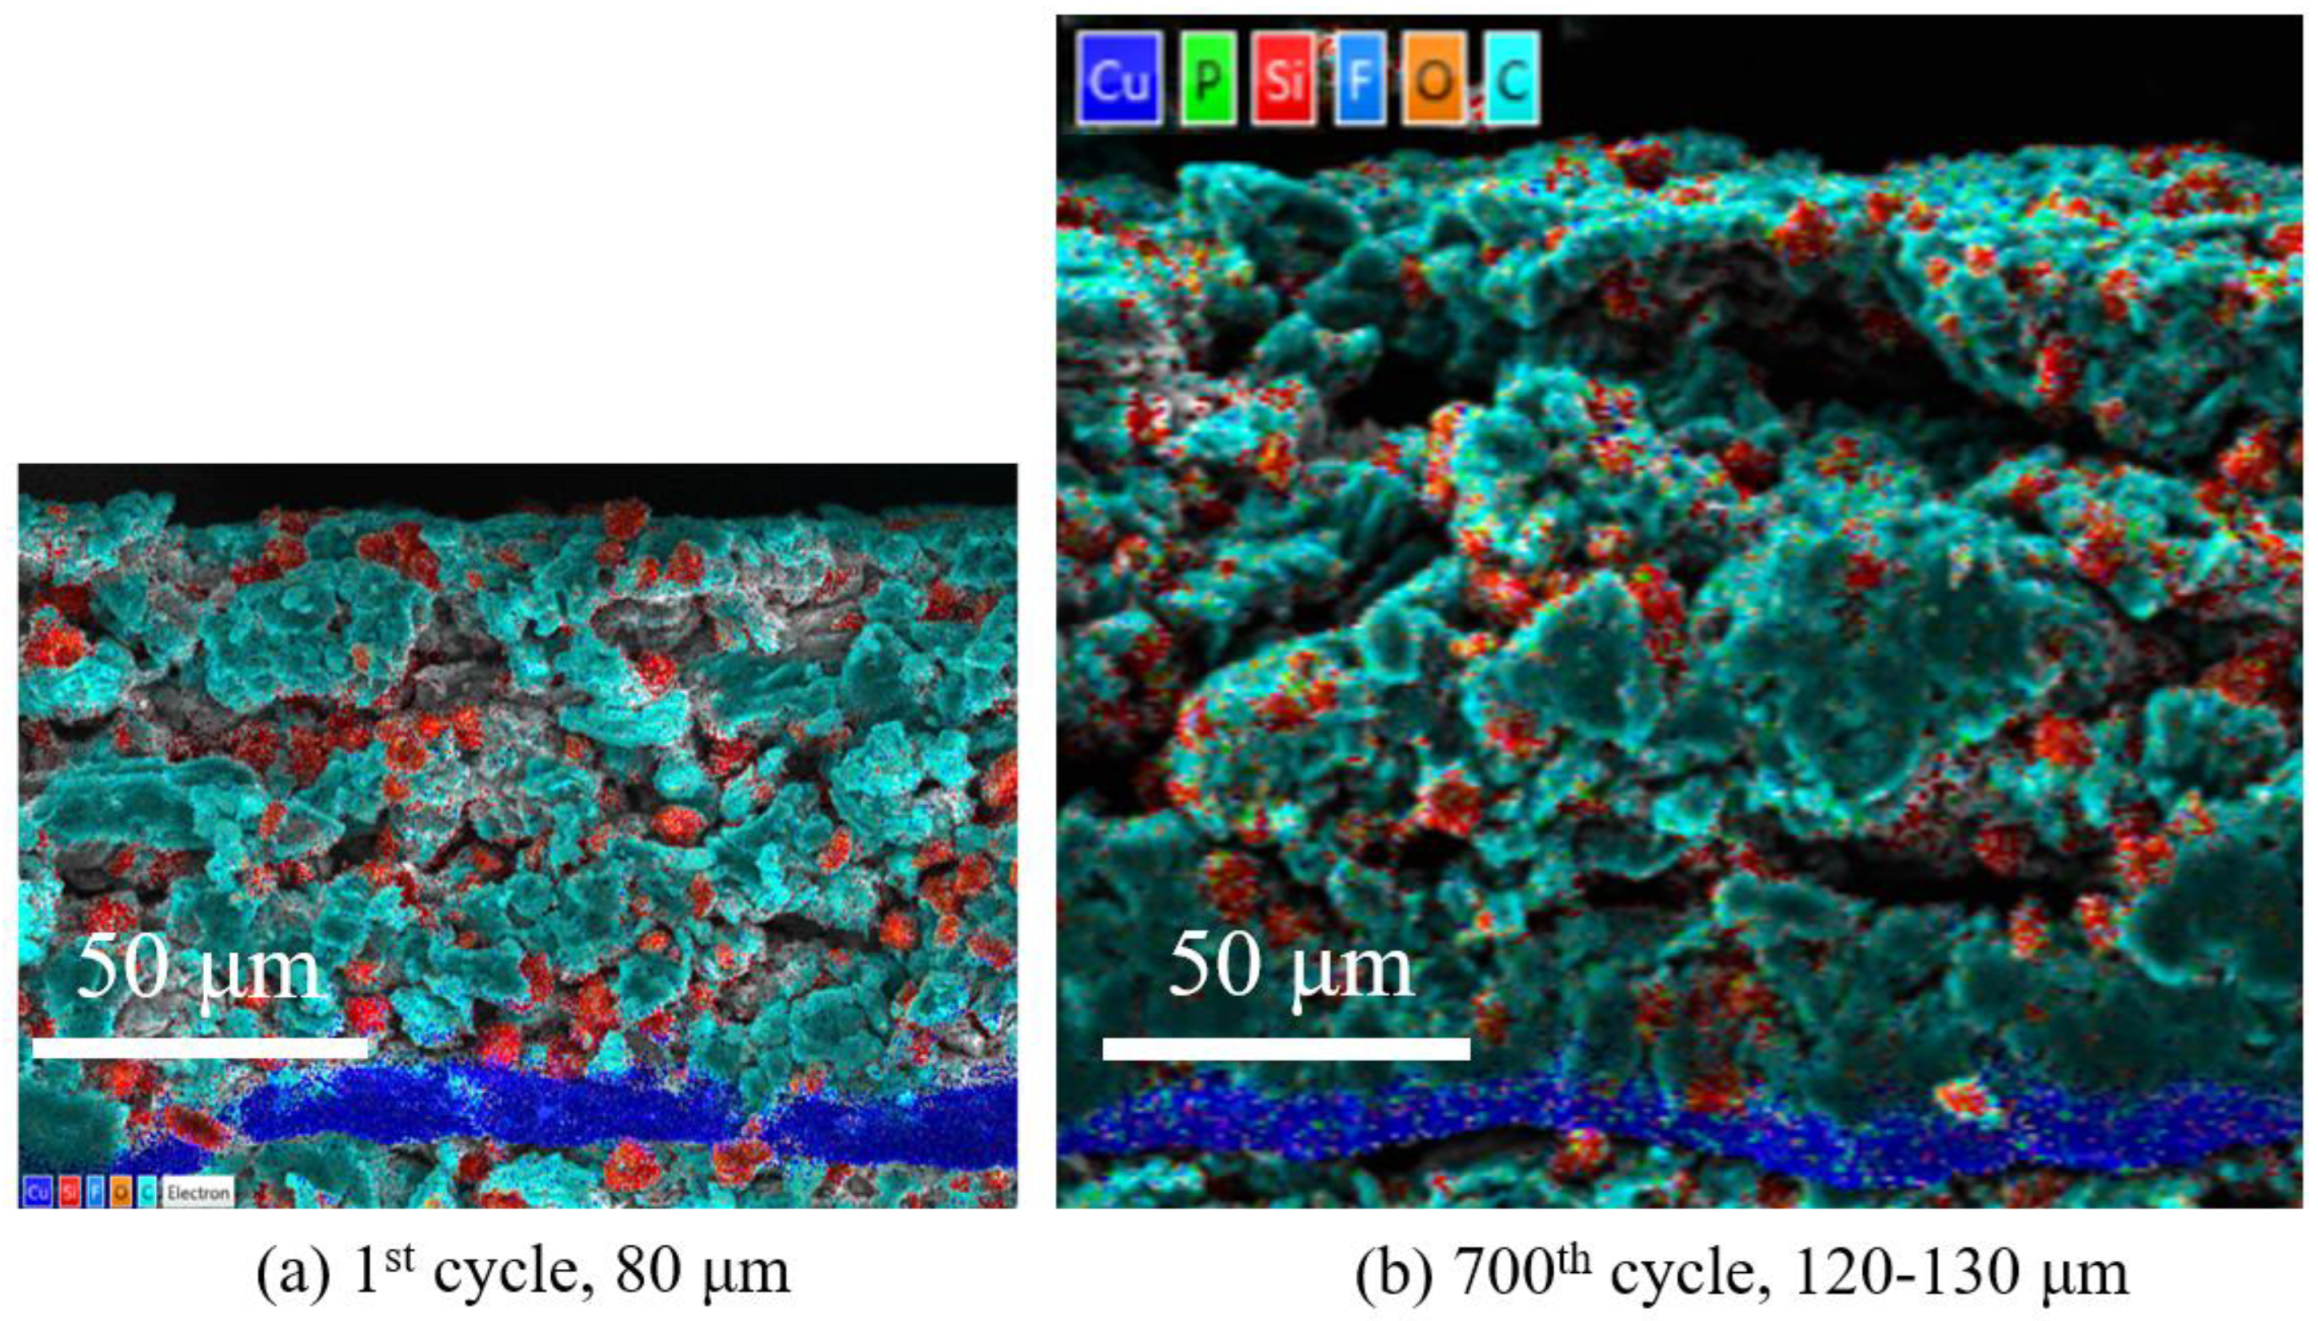
The cross-sectional comparison of the anode electrodes for cell 10 wt.%SiO upon delithiation was estimated using SEM-EDS, as presented in Figure 10. After the formation cycle, the thickness of the pristine electrode was measured to be 80 μm and the electrode swelled to an overall thickness of 120–130 μm after 700 cycles, an increase of nearly 50% in thickness, which is similar to the results reported in Ref. [22]. This confirms the increase in thickness of the electrode after cycling and this electrode swelling phenomenon is associated with the pulverization of the SiO particles and the growth of the SEI film. A few works have been performed trying to explore the mechanism of stress evolution and capacity fade in lithium-ion pouch cells, as well as the relationship between stack stress and battery internal resistance [30,31]. Literature research shows that a small amount of mechanical compression can reduce the internal resistance of the battery while delaying the capacity fading of the battery. However, further increase in the stack pressure does not improve the battery performance: it will lead to a rapid decrease in battery capacity and an increase in internal resistance.
Figure 11 schematically depicts the transformation of activity particles during the lithiation and cycling of the SiO/Gr anode. Compared to graphite anodes, SiO/Gr continuously consumes more active lithium inventory during the formation process and the subsequent cycles. This is mainly due to the continuous expansion and rupture of the SiO particles leading to the continuous formation of additional SEI films on their surfaces. Based on this, we suggest a simple model for describing the expansion impact during lithiation of SiO/Gr anode, electrode swelling, and SEI overgrowth as illustrated in Figure 11. At the pristine state, the edges of the SiO/Gr particles are relatively visible, and the porosity of the electrode is kept at a reasonable level. After charging the battery, the active particles of the composite anode, especially the SiO particles, showed a significant expansion. Typically, SiO particles suffer from large volumetric changes during cycling and subsequently large stresses, leading to surface and intergranular cracking and the continuous consumption of active lithium and electrolyte. As a result, the thickness of the electrode gradually increases and the stack pressure between them keeps increasing, whilst the porosity of the anode suffers a considerable reduction. Eventually, the Rohm, RSEI, and Rct of the battery will be affected. The anode with a moderate silicon content, e.g., approximately 5 wt.% SiO, can promote the specific capacity and ensure that the negative electrode will not undergo drastic volume changes. As the weight percentage of SiO reaches 10 wt.%, the volume effect of SiO becomes more significant, resulting in Rohm being strongly related to SOC at the beginning of the cycle, while Rohm continuously decreases at the end of the cycling test. When the SiO content is particularly high (e.g., 20 wt.%), the anode suffers from large volumetric changes during cycling, leading to crack propagation, active material exfoliation and SEI growth at the beginning of the cycle and contributing to rapid capacity degradation. Thus, the incorporation of SiO should not exceed 10 wt.% from the above discussion.

4. Conclusions

This study comprehensively investigates the impedance properties and evolution of lithium-ion batteries with different weight ratios of SiO particles in the anode. As a reference group, the LFP cell and NCM523 cell were investigated. First, long-term cycling experiments were conducted to compare the battery degradation behaviors. For LFP and NCM523, they present good cycling performance at the rate of 1C rate. Nonetheless, the incorporation of SiO particles amplified the energy density of the battery while concurrently escalating the degradation rate of the anode electrode. For cells with a SiO/Gr composite anode, a 5 wt.% of SiO presented the best cyclability, and the capacity loss rate gradually increased with an increasing silicon content. The results indicate that, whilst a larger weight content ration of SiO (e.g., 20 wt.%) severely hinders the battery cyclability, an optimal SiO wt.% of approximately 5 wt.% in the present study might be a favorable proportion of the SiO/Gr anode battery.
To summarize, the proportion of SiO results has a significant effect on the impedance characteristics of the cell. For the cell 5 wt.% SiO and the cell 10 wt.% SiO, Rct has a lower value at 0% SOC than that of 100% SOC after a few cycles, and this anomaly is more pronounced in the cell 10 wt.% SiO. A more detailed impedance test was carried out for the cell 10 wt.% SiO with a gradient of 20% SOC. The cell with 10 wt.% SiO in the anode presents a specific phenomenon in impedance property. For the cell 20 wt.% SiO, the incorporation of a surplus of SiO particles resulting in Rohm is insensitive to changes in aging and the charge state, while the RSEI and Rct demonstrate considerably more disparity between the two states of charge (0% SOC and 100% SOC).
To further investigated the anode evolution after more extended cycling, the post mortem analysis is used to analyze the degradation of SiO/Gr composite anode. The microstructure and element distribution of the anode are investigated by SEM and EDS which provide the direct evidence of SiO particles evolution and distribution. The volumetric changes during cycling and subsequently the particle cracking of the SiO/Gr anode electrode, resulting in the coupling with the electrochemical-mechanical coupling behaviors, are the main reasons for the difference in impedance characteristics of the SiO/Gr anode cells.
Particularly, the impedance performance of cell 10 wt.% SiO thus shows a special pattern. Upon the formation and testing of EIS, Rohm was found to decrease with the number of cycles under the same SOC. For pristine cell 10 wt.% SiO, the thickness of the electrode decreases due to the discharge of the cell, resulting in a gradual increase in Rohm. However, changes in the SOC have a weak effect on Rohm after more extended cycling, which indicates that the change in thickness of the anode during discharge becomes smaller. The electrode swells to an overall thickness of 120–130 μm after 700 cycles, an increase of nearly 50% in thickness. Meanwhile, the value of Rct at 0% SOC is always less than the value at 100% SOC, and Rct is correlated to the anode at higher SOC conditions [27].
Therefore, it is essential to intensively investigate the volume effect and impedance property due to SiO incorporation and put forward effective strategies to establish an effective strategy for estimating the SiO/Gr anode battery aging and charge states using impedance characteristics. This paper identifies the particular impedance property of an SiO/Gr anode battery and provides a fundamental understanding and initial guidance for the interesting impedance characteristics.

Author Contributions

Conceptualization, X.W. (Xiuwu Wang) and J.Z.; methodology, X.W. (Xiuwu Wang); software, C.Y.; validation, X.W. (Xiuwu Wang); formal analysis, X.W. (Xiuwu Wang); investigation, X.W. (Xiuwu Wang) and J.Z.; resources, J.Z. and H.D.; data curation, X.W. (Xiuwu Wang); writing—original draft preparation, X.W. (Xiuwu Wang); writing—review and editing, J.Z.; visualization, H.D.; supervision, X.W. (Xuezhe Wei); project administration, X.W. (Xuezhe Wei); funding acquisition, J.Z., X.W. (Xuezhe Wei) and H.D. All authors have read and agreed to the published version of the manuscript.

Funding

This research was funded by the National Natural Science Foundation of China (NSFC, Grant No. 52107230), the Fundamental Research Funds for the Central Universities and the Major State Basic Research Development Program of China (973 Program, Grant No. 2022YFB2502304, Grant No. 2022YFB2502302).

Data Availability Statement

The authors are unable or have chosen not to specify which data has been used.

Acknowledgments

Xiuwu Wang would like to thank the assistance of Rong Wang (Jiangsu Donghua Analytical Instrument Co., Ltd., Taizhou, 214500, China) and Lingyun Cui (Jiangsu Donghua Analytical Instrument Co., Ltd., Taizhou, 214500, China) for their assistance in the analysis of the EIS.

Conflicts of Interest

The authors declare that they have no known competing financial interests or personal relationships that could have appeared to influence the work reported in this paper.

References

  1. Li, M.; Lu, J.; Chen, Z.; Amine, K. 30 Years of Lithium-Ion Batteries. Adv. Mater. 2018, 30, 1800561. [Google Scholar] [CrossRef] [PubMed]
  2. Tian, Y.; Zeng, G.; Rutt, A.; Shi, T.; Kim, H.; Wang, J.; Koettgen, J.; Sun, Y.; Ouyang, B.; Chen, T.; et al. Promises and Challenges of Next-Generation “Beyond Li-ion” Batteries for Electric Vehicles and Grid Decarbonization. Chem. Rev. 2021, 121, 1623–1669. [Google Scholar] [CrossRef]
  3. Lin, C.; Burggraf, P.; Liu, L.; Adlon, T.; Mueller, K.; Beyer, M.; Xu, T.; Kammerer, V.; Hu, J.; Liu, S.; et al. Deep-Dive analysis of the latest Lithium-Ion battery safety testing standards and regulations in Germany and China. Renew. Sustain. Energy Rev. 2023, 173, 113077. [Google Scholar] [CrossRef]
  4. You, H.; Zhu, J.; Wang, X.; Jiang, B.; Sun, H.; Liu, X.; Wei, X.; Han, G.; Ding, S.; Yu, H.; et al. Nonlinear health evaluation for lithium-ion battery within full-lifespan. J. Energy Chem. 2022, 72, 333–341. [Google Scholar] [CrossRef]
  5. Sun, S.; Yao, N.; Jin, C.; Xie, J.; Li, X.; Zhou, M.; Chen, X.; Li, B.; Zhang, X.; Zhang, Q. The Crucial Role of Electrode Potential of a Working Anode in Dictating the Structural Evolution of Solid Electrolyte Interphase. Angew. Chem. Int. Ed. 2022, 61, 202208743. [Google Scholar] [CrossRef] [PubMed]
  6. Zhang, Y.; Huang, J.; Saito, N.; Zhang, Z.; Yang, L.; Hirano, S. Search for Stable Host Materials as Low-voltage Anodes for Lithium-ion Batteries: A Mini-review. Energy Storage Mater. 2023, 55, 364–387. [Google Scholar] [CrossRef]
  7. Lee, B.; Oh, S.; Choi, Y.; Yi, M.; Kim, S.; Kim, S.; Sung, Y.; Shin, S.; Lee, Y.; Yu, S. SiO-induced thermal instability and interplay between graphite and SiO in graphite/SiO composite anode. Nat. Commun. 2022, 14, 150. [Google Scholar] [CrossRef]
  8. Xu, S.; Hou, X.; Wang, D.; Zuin, L.; Zhou, J.; Hou, Y.; Mann, M. Insights into the Effect of Heat Treatment and Carbon Coating on the Electrochemical Behaviors of SiO Anodes for Li-Ion Batteries. Adv. Energy Mater. 2022, 12, 2200127. [Google Scholar] [CrossRef]
  9. Li, D.; Chu, F.; He, Z.; Cheng, Y.; Wu, F. Single-material aluminum foil as anodes enabling high-performance lithium-ion batteries: The roles of prelithiation and working mechanism. Mater. Today 2022, 58, 80–90. [Google Scholar] [CrossRef]
  10. Choi, S.; Kwon, T.; Coskun, A.; Choi, J. Highly elastic binders integrating polyrotaxanes for silicon microparticle anodes in lithium ion batteries. Science 2017, 357, 279–283. [Google Scholar] [CrossRef]
  11. Carthy, K.; Gullapalli, H.; Ryan, K.; Kennedy, T. Review—Use of Impedance Spectroscopy for the Estimation of Li-ion Battery State of Charge, State of Health and Internal Temperature. J. Electrochem. Soc. 2021, 168, 080517. [Google Scholar] [CrossRef]
  12. Xiong, R.; Pan, Y.; Shen, W.; Li, H.; Sun, F. Lithium-ion battery aging mechanisms and diagnosis method for automotive applications: Recent advances and perspectives. Renew. Sust. Energy Rev. 2020, 131, 110048. [Google Scholar] [CrossRef]
  13. Tanim, T.; Yang, Z.; Finegan, D.; Chinnam, P.; Lin, Y.; Weddle, P.; Jansen, A. A Comprehensive Understanding of the Aging Effects of Extreme Fast Charging on High Ni NMC Cathode. Adv. Energy Mater. 2022, 12, 2103712. [Google Scholar] [CrossRef]
  14. Zhu, J.; Wang, Y.; Huang, Y.; Gopaluni, R.; Cao, Y.; Heere, M.; Mühlbauer, M.; Mereacre, L.; Dai, H.; Liu, X.; et al. Data-driven capacity estimation of commercial lithium-ion batteries from voltage relaxation. Nat. Commun. 2022, 13, 2261. [Google Scholar] [CrossRef] [PubMed]
  15. Wang, X.; Li, R.; Dai, H.; Zhang, N.; Chen, Q.; Wei, X. A novel dual time scale life prediction method for lithium-ion batteries considering effects of temperature and state of charge. Int. J. Energ. Res. 2021, 45, 14692–14709. [Google Scholar] [CrossRef]
  16. Zhu, J.; Darma, M.; Knapp, M.; Sørensen, D.R.; Heere, M.; Fang, Q.; Wang, X.; Dai, H.; Mereacre, L.; Senyshyn, A.; et al. Investigation of lithium-ion battery degradation mechanisms by combining differential voltage analysis and alternating current impedance. J. Power Sources 2020, 448, 227575. [Google Scholar] [CrossRef]
  17. Rodrigues, S.; Munichandraiah, N.; Shukla, A. A review of state-of-charge indication of batteries by means of a.c. impedance measurements. J. Power Sources 2000, 87, 12–20. [Google Scholar] [CrossRef]
  18. Chen, N.; Zhang, P.; Dai, J.; Gui, W. Estimating the state-of-charge of lithium-ion battery using an h-infinity observer based on electrochemical impedance model. IEEE Access 2020, 8, 26872–26884. [Google Scholar] [CrossRef]
  19. Wang, L.; Zhao, X.; Deng, Z.; Yang, L. Application of electrochemical impedance spectroscopy in battery management system: State of charge estimation for aging batteries. J. Energy Storage 2023, 57, 106275. [Google Scholar] [CrossRef]
  20. Gao, X.; Li, S.; Xue, J.; Hu, D.; Xu, J. A Mechanistic and Quantitative Understanding of the Interactions between SiO and Graphite Particles. Adv. Energy Mater. 2022, 13, 2202584. [Google Scholar] [CrossRef]
  21. Kim, J.; Kim, M.; Kim, Y.; Kim, M.; Choi, A.; Jeong, K.; Lee, H. Unveiling the role of electrode-level heterogeneity alleviated in a silicon-graphite electrode under operando microscopy. Energy Storage Mater. 2023, 57, 269–276. [Google Scholar] [CrossRef]
  22. Kumar, P.; Berhaut, C.; Dominguez, D.; Vito, E.; Tardif, S.; Pouget, S.; Lyonnard, S.; Jouneau, P. Nano-Architectured Composite Anode Enabling Long-Term Cycling Stability for High-Capacity Lithium-Ion Batteries. Small 2020, 16, 1906812. [Google Scholar] [CrossRef]
  23. Heidrich, B.; Pritzlaff, L.; Börner, M.; Winter, M.; Niehoff, P. Comparative X-ray Photoelectron Spectroscopy Study of the SEI and CEI in Three Different Lithium Ion Cell Formats. J. Electrochem. Soc. 2022, 169, 030533. [Google Scholar] [CrossRef]
  24. Han, X.; Lu, L.; Zheng, Y.; Feng, X.; Li, Z.; Li, J.; Ouyang, M. A review on the key issues of the lithium ion battery degradation among the whole life cycle. eTransportation 2019, 1, 100005. [Google Scholar] [CrossRef]
  25. Wahl, M.; Spitthoff, L.; Muri, H.; Jinasena, A.; Burheim, O.; Lamb, J. The Importance of Optical Fibres for Internal Temperature Sensing in Lithium-ion Batteries during Operation. Energies 2021, 14, 3617. [Google Scholar] [CrossRef]
  26. Sabet, P.; Stahl, G.; Sauer, D. Non-invasive investigation of predominant processes in the impedance spectra of high energy lithium-ion batteries with Nickel-Cobalt-Aluminum cathodes. J. Power Sources 2018, 406, 185–193. [Google Scholar] [CrossRef]
  27. Yuan, C.; Hahn, Y.; Lu, W.; Oancea, V.; Xu, J. Quantification of electrochemical-mechanical coupling in lithium-ion batteries. Cell Rep. Phys. Sci. 2022, 3, 101158. [Google Scholar] [CrossRef]
  28. Pidaparthy, S.; Luo, M.; Rodrigues, M.; Zuo, J.; Abraham, D. Physicochemical Heterogeneity in Silicon Anodes from Cycled Lithium-Ion Cells. ACS Appl. Mater. Interfaces 2022, 14, 38660–38668. [Google Scholar] [CrossRef]
  29. Dai, C.; Li, C.; Huang, H.; Wang, Z.; Zhu, X.; Liao, X.; Chen, X.; Pan, Y.; Fang, D. In situ strain measurements and stress analysis of SiO@C composite electrodes during electrochemical cycling by using digital image correlation. Solid State Ionics 2019, 331, 56–65. [Google Scholar] [CrossRef]
  30. Cannarella, J.; Arnold, C. Stress evolution and capacity fade in constrained lithium-ion pouch cells. J. Power Sources 2014, 245, 745–751. [Google Scholar] [CrossRef]
  31. Li, R.; Ren, D.; Wang, S.; Xie, Y.; Hou, Z.; Lu, L.; Ouyang, M. Non-destructive local degradation detection in large format lithium-ion battery cells using reversible strain heterogeneity. J. Energy Storage 2021, 40, 102788. [Google Scholar] [CrossRef]
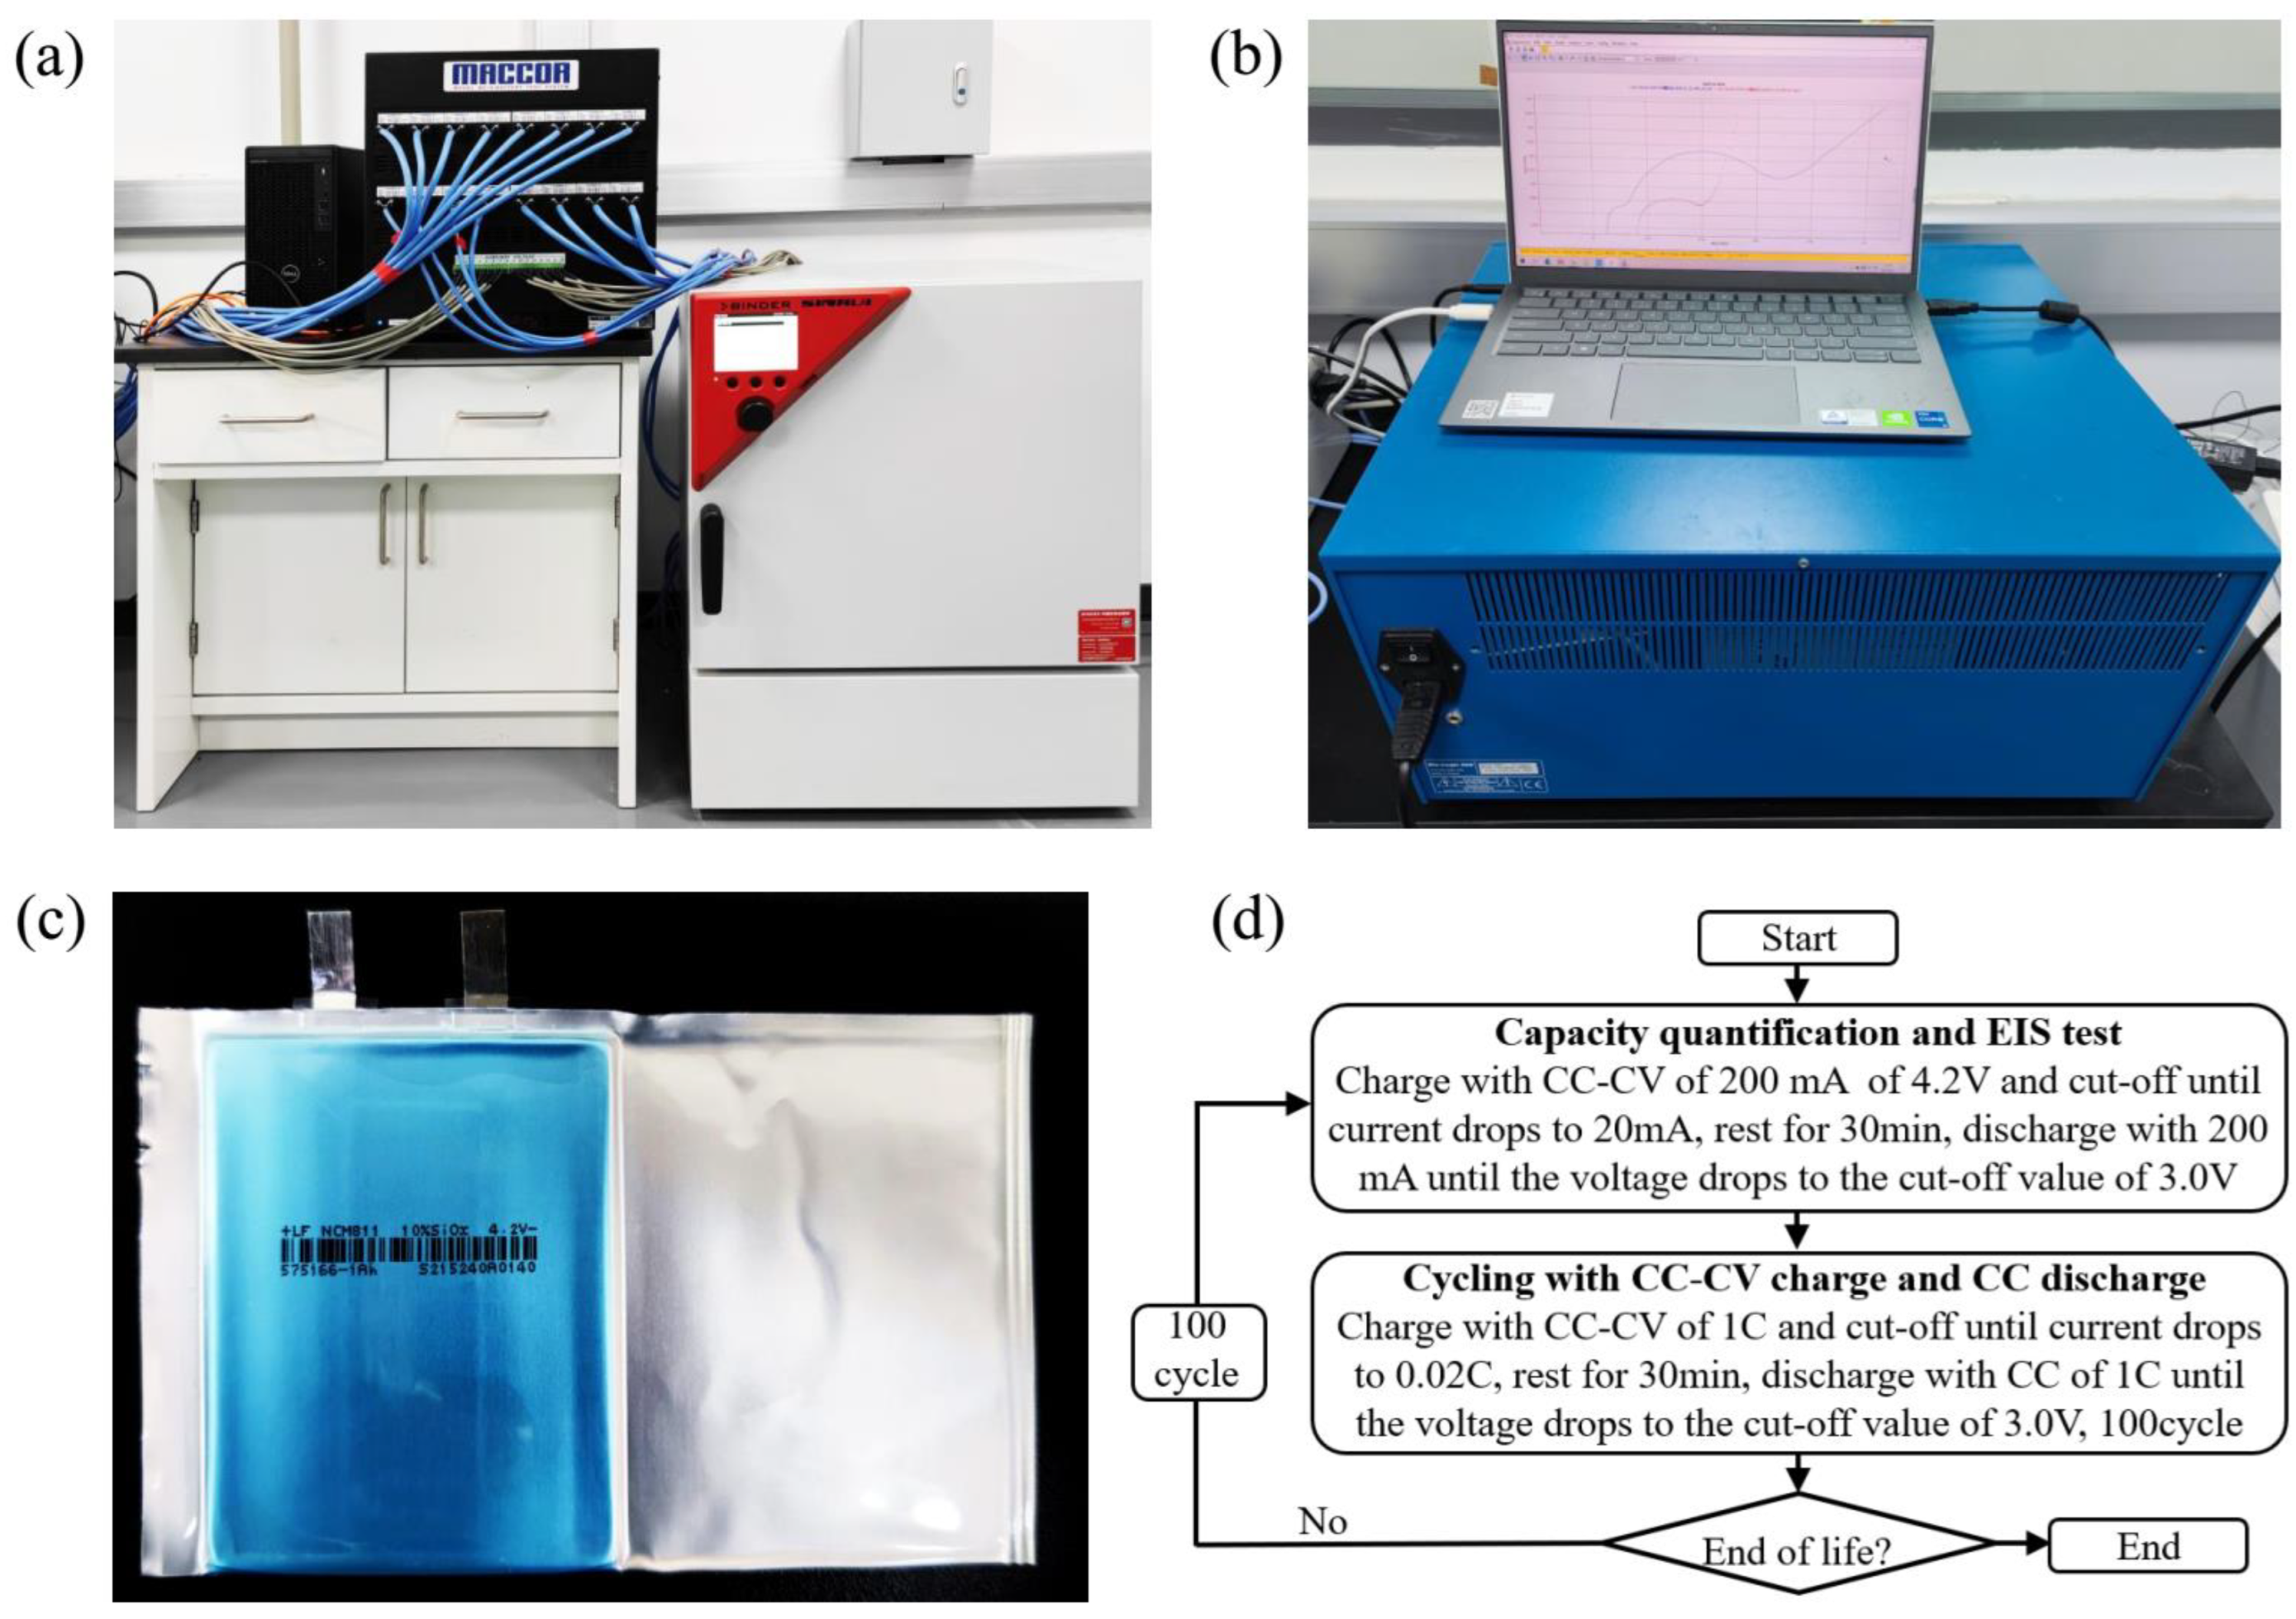
Figure 1. Battery test equipment and the experimental flow chart: (a) battery test system (Maccor); (b) multichannel impedance spectrum measurement system typed of Biologic VMP3; (c) 1 Ah pouch cell sample; and (d) a battery test procedure.
Batteries 09 00242 g001
Figure 2. Electrochemical impedance spectrum and the equivalent circuit model of a lithium-ion battery.
Batteries 09 00242 g002
Figure 3. Electrochemical performance and impedance spectrum change during cycling. Battery residual capacity: (a) LFP and (b) NCM 523. The impedance spectra parameters obtained by ECM fitting: (c) LFP and (d) NCM523. EIS measured at 0% SOC and 100% SOC: (eh) represents the LFP and (il) represent the NCM523.
Batteries 09 00242 g003
Figure 4. Comparison of the electrochemical impedance spectra and model fitting data of the cell 5 wt.% SiO. EIS test curve at the 1st (a), the 100th (b), the 500th (c), and the 800th (d). ECM fitting parameters under 0% SOC and 100% SOC: (e) Rohm, (f) RSEI, and (g) Rct.
Batteries 09 00242 g004
Figure 5. Comparison of the electrochemical impedance spectra and model fitting data of the cell 10 wt.% SiO. EIS test curve at the 1st (a), 100th (b), 500th (c), and 700th (d). ECM fitting parameters under 0% SOC and 100% SOC: (e) Rohm, (f) RSEI, and (g) Rct.
Batteries 09 00242 g005
Figure 6. Comparison of the electrochemical impedance spectra and model fitting data of the cell 20 wt.% SiO. EIS test curve at the 1st (a), 100th (b), 200th (c), and 300th (d). ECM fitting parameters under 0% SOC and 100% SOC: (e) Rohm, (f) RSEI, and (g) Rct.
Batteries 09 00242 g006
Figure 7. Electrochemical impedance spectroscopy and the ECM fitting of cell 10 wt.% SiO from 0% SOC to 100% SOC at the 1st (a), 300th (b), and 500th (c).
Batteries 09 00242 g007
Figure 8. Capacity fade during cycling and Coulombic efficiency during formation cycles: (a) 5 wt.% SiO, (b) 10 wt.% SiO, and (c) 20 wt.% SiO. Optical images of the anode for the beginning of life and cycling aged (d) 5 wt.% SiO, (e) 10 wt.% SiO, and (f) 20 wt.% SiO. (g) Coulombic efficiency of SiO/Gr anode cells.
Batteries 09 00242 g008
Figure 9. Post mortem results of the anodes for cell 10 wt.%SiO through the cycling test. (ad): SEM images of fresh SiO/Gr anode; (eh): aged anode surface. EDS chemical composition maps of anode surface: (i) fresh anode and (k) aged anode. SiO maps: (j) before cycling and (l) after cycling.
Batteries 09 00242 g009
Figure 10. Cross-sectional comparison of the anode electrodes for cell 10 wt.%SiO upon delithiation by SEM–EDS: (a) 1 cycle and (b) 700 cycles.
Batteries 09 00242 g010
Figure 11. Schematic comparison of the SiO/Gr anode during lithiation and cycling to the initial state.
Batteries 09 00242 g011
Table 1. Overview of the characteristics for the three types of pouch cell in the impedance study.
Cell TypeVoltage WindowCharge (CC-CV)Discharge (CC)EIS
Test
Test Temperature
LFP2.4–3.65 V1 C with upper cut-off voltage until 0.02 C1 C10 kHz–10 mHz25 °C
NCM 5233.0–4.2 V
5 wt.% SiO3.0–4.2 V
10 wt.% SiO
20 wt.% SiO
Disclaimer/Publisher’s Note: The statements, opinions and data contained in all publications are solely those of the individual author(s) and contributor(s) and not of MDPI and/or the editor(s). MDPI and/or the editor(s) disclaim responsibility for any injury to people or property resulting from any ideas, methods, instructions or products referred to in the content.