Article

Fast Ion Transfer Associated with Dehydration and Modulation of Hydration Structure in Electric Double-Layer Capacitors Using Molecular Dynamics Simulations and Experiments

1
Graduate School of Science, Chiba University, 1-33 Yayoi, Inage, Chiba 263-8522, Japan
2
Laboratoire des Ecoulements Geophysiques et industriels, Université Grenoble Alpes, Centre National de la Recherche Scientifique, 38000 Grenoble, France
3
Center for Interdisciplinary Chemistry Research—CICR, Dhaka 1236, Bangladesh
*
Author to whom correspondence should be addressed.
Batteries 2023, 9(4), 212; https://doi.org/10.3390/batteries9040212
Submission received: 9 February 2023 / Revised: 3 March 2023 / Accepted: 29 March 2023 / Published: 1 April 2023

Abstract

:
Carbon materials, such as graphite and activated carbon, have been widely used as electrodes in batteries and electric double-layer capacitors (EDLCs). Graphene, which has an extremely thin sheet-like structure, is considered as a fundamental carbon material. However, it was less investigated as an electrode material than graphite and activated carbons. This is because graphene is a relatively new material and is difficult to handle. However, using graphene electrodes can enhance the performance of nanodevices. Here, the performance of EDLCs based on single-layer and bilayer graphene electrodes in LiCl, NaCl, and KCl aqueous electrolyte solutions was evaluated using cyclic voltammetry, and the charging mechanism was evaluated using molecular dynamics simulations. KCl aqueous solution provided the highest capacitance compared to LiCl and NaCl aqueous solutions in the case of single-layer graphene electrodes. In contrast, the dependence of the capacitance on the ion species was hardly observed in the case of bilayer graphene. This indicates that Li and Na ions also contributed to the capacitances. The high EDLC performance can be attributed to the fast ion transfer promoted by the dehydration and modification of the second hydration shell on the bilayer graphene because of the relatively strong interaction of ions with the bilayer graphene.

1. Introduction

The development of renewable energy sources has received significant attention in the energy and environmental sciences [1]. Solar and wind energies, which produce low or no carbon dioxide, are promising renewable energy sources. However, the storage of the electric energy generated by these systems is critical because they are affected by weather conditions such as the strength of sunlight as well as wind speed and direction. Energy storage systems, such as electric double-layer capacitors (EDLCs) and batteries, can store huge amounts of renewable energy to mitigate undesirable fluctuations in energy production and act as a buffer for electricity generation [2]. Moreover, energy storage is significantly important in daily life to satisfy the increasing demands for personal electronic devices. Thus, efficient, portable, and lightweight electrochemical energy storage technologies with high energy and power densities should be established by developing innovative materials and improving cell design. Among energy storage systems, EDLCs exhibit high power densities and long cycle life, whereas batteries exhibit high energy densities [3]. Both technologies should still be enhanced to fulfill the demands of high energy and power densities; hence, the electrodes and electrolytes used in these technologies should be improved. To enhance the performance of these systems, the fundamental aspects and properties of aqueous electrolytes and their interaction with electrodes, especially graphene electrodes in EDLC systems, should be deeply investigated. Simon and Gogotsi reviewed the EDLC performances using various carbon materials [4]. Carbide-derived carbons and activated carbons had considerably high performance when the pore sizes were smaller than 1 nm. The wedge-shaped nano-porous carbons had high EDLC performances through the high capacitances and fast relaxation time of ions [5,6]. However, the complex structures of carbon materials and electrolyte solutions veiled the storage mechanism. A fundamental understanding of ion adsorption during charging and discharging cycles is essential for applications and technologies.
Aqueous electrolytes are the most common electrolytes because of their abundance, stability, low cost, and environmental friendliness [7,8]. Although adsorption processes in porous carbons play a central role in those technologies, we should first shed light on simpler adsorption processes on surfaces. Graphene and its derivatives are promising electrode materials owing to their simple geometries as well as unique physical and chemical properties [9,10]. Two-dimensional graphene has the thinnest thickness and is suitable for electron transport devices [11]. Hybrid and curved graphene are used in EDLC devices to efficiently store electric charges without chemical reactions [12,13]. Simon and coworkers demonstrated that graphene exhibited high capacitance (550 F g−1) in EDLC devices because of its large specific surface area [14]. Ke and coworkers reported gravimetric capacitances of 70–120 and 100–270 F g−1 for aqueous and organic electrolytes, respectively [15,16]. Those capacitances were significantly different from each other. The discrepancy can probably be attributed to the different graphene structures, such as the number of graphene layers and defects in electrodes, because the EDLC performance mainly depends on the structure and morphological properties of electrodes [17,18,19,20]. Moreover, the physicochemical properties measured on solid–liquid interfaces during the application of potential are different from those measured in the bulk material [21]. Interfacial properties have been extensively investigated through experimental, theoretical, and simulation studies [22,23,24]. However, despite the simple geometry of graphene interfaces, comprehensive and concrete understandings of ion behaviors and dynamics on graphene are still inevitable for gaining high EDLC performances. It is thus essential to shed light on the fundamental interfacial properties of aqueous solutions on graphene electrodes during charge–discharge cycles to improve the performance of EDLCs and batteries.
In this work, single-layer and bilayer graphene were prepared as electrodes to demonstrate the performance of EDLC systems employing LiCl, NaCl, and KCl aqueous electrolyte solutions. The mechanism of ion adsorption and dynamics in aqueous electrolyte solution between single-layer or bilayer graphene was evaluated using molecular dynamic (MD) simulations. The number of graphene layers significantly affects its adsorption properties. Thus, herein, we focused on the effect of the number of graphene layers on the EDLC performance.

2. Materials and Methods

Two types of graphene, i.e., single-layer graphene and bilayer graphene, were prepared. The layer numbers were determined by Raman scattering spectroscopy. Both graphene types were synthesized via chemical vapor deposition [23,25]. Single-layer graphene was synthesized through chemical vapor deposition on a 1 × 1 cm2-Cu foil with a 25 μm thickness (99.8%, Alfa Aesar 46365, Lancashire, UK) at 1300 K using a flow of CH4 (0.5 cm3 min−1) and H2 (20 cm3 min−1) for 30 min. Polycarbonate was spin-coated on the synthesized graphene, and the Cu foil was chemically dissolved using an ammonia persulfate solution (0.1 M) for 3 h. The polycarbonate-coated graphene was then transferred to a gold substrate. Polycarbonate was finally dissolved by overnight soaking in a chloroform solution. Bilayer graphene was synthesized by the same method on a quartz substrate at 1230 K using a flow of CH4 (40 cm3 min−1) and H2 (60 cm3 min−1) for 5 h. Here, a Cu foil was placed on the side of the 1.0 × 1.0 cm2-quartz substrate as a catalyst. A bilayer graphene on a quartz substrate was used for the subsequent EDLC measurement without any graphene transfer process, leading to high stability during cyclic voltammetry measurements. The different substrates for single-layer and bilayer graphene were here used for easier preparation and transfer processes and higher stability during cyclic voltammetry measurements. Raman scattering spectroscopy (NRS-3000, JASCO, Tokyo, Japan) was used to evaluate the number of graphene layers and the level of defects in its structures. Transmission electron microscopy was conducted for bilayer graphene (JEM-2100F, JEOL, Tokyo, Japan). Aqueous KCl, NaCl, and LiCl electrolyte solutions (0.1 M) were used to evaluate the electrochemical interfacial properties using single-layer and bilayer graphene electrode systems. Here, the purities of KCl, NaCl, and LiCl regents were 99.5%, 99.5%, and 99.0%, respectively (Wako, Pure Chemical Industries, Ltd., Osaka, Japan). Deionized water was obtained from a Millipore-Q-water purifier (Merck Millipore Elix-UV3, Merck Millipore, MA, USA). The graphene prepared on a substrate was used as a working electrode, whereas Ag/AgCl and Pt wires were used as reference and counter electrodes, respectively, in a three-electrode electrochemical cell. Electrochemical cyclic voltammetry was performed using graphene and Ag/AgCl electrodes within 0.0–0.4 V for single-layer graphene and 0.0–0.8 V for bilayer graphene at a scan rate of 100 mV s−1 at ambient temperature. This relatively small potential range is to avoid any electrochemical reaction and breakage of graphene as well as the electrolysis of water in the aqueous electrolyte solution–graphene system [26,27]. The capacitances of graphene electrodes were calculated using Equation (1) as follows:
C =   I   d V ν .   A .   Δ V   ,
where C, I, A, ΔV, and ν are the capacitance (µF cm−2), current (µA), area (cm2) of the electrode, potential window (mV), and scan rate (mV s−1), respectively. All electrochemical measurements were performed by using an automatic polarization control system with a frequency response analyzer (HZ 5000, Hokuto Denko, Tokyo, Japan, and FRA 5022, NF, Kanagawa, Japan). Graphene electrodes were refreshed by washing with deionized water and repeatedly available without any ion contamination in the cyclic voltammetry. However, graphene electrodes were separated from substrates in several cyclic voltammetry measurements, because of weak contact between graphene and substrate.
MD simulations were conducted to reveal the molecular mechanism of the aqueous electrolyte solution used in the experiments. The MD simulations of the aqueous solution containing Li, Na, K, and Cl ions were performed in an area held between two single-layer or bilayer graphenes using software that was developed in our laboratory based on a leapfrog Verlet integration algorithm in an NVT ensemble coupled to a thermal bath at 300 ± 1 K. The constant partial charges of the carbon atoms were set at ±0.02 e as well as 0.00 e. Graphene walls of single-layer and bilayer graphene were placed 4 nm apart and located on the center of the x-axis. The interlayer distance of the bilayer graphene was 0.4 nm. An aqueous electrolyte was placed between the single-layer and bilayer graphene. A unit cell of 20.0 × 3.197 × 2.982 nm3 was used. The number of water molecules, cations, and Cl ions was 1000, 15, and 15, respectively. The cations include five of each Li, Na, and K ions. The molecular trajectory was obtained every 50 fs with a time step of 2 fs. Intermolecular interactions were calculated using Lennard–Jones and Coulomb interactions [28,29], in which εLi/kB = 9.20 K, σLi = 0.213 nm, qLi/e = +1.0 C; εNa/kB = 1.40 K, σNa = 0.333 nm, qNa/e = +1.0 C; εK/kB = 0.165 K, σK = 0.493 nm, qK/e = +1.0 C; εCl/kB = 59.3 K, σCl = 0.442 nm, qCl/e = −1.0 C; and εC/kB = 28.0 K, σC = 0.34 nm, and qC/e = ±0.00, ±0.01, ±0.02, and ±0.03 to calculate the potential well depth, collision diameter, and partial charge. Lorentz–Berthelot mixing rules and the Ewald summation were adopted to calculate the Lennard–Jones interactions between different molecular species and the long-range coulomb interactions, respectively. The stability of graphene with partial charges was evaluated at the Hartree–Fock level based on a 6–31 G basis set using a small graphene unit with 216 carbon atoms and 36 hydrogen atoms in the Gaussian16 program [30]. The capacitance was calculated based on the ion adsorption on graphene electrodes within two water layers and the potential between two graphene electrodes. The hydration number of an ion was calculated based on a distance shorter than the collision diameter between an ion and a water layer.

3. Results and Discussion

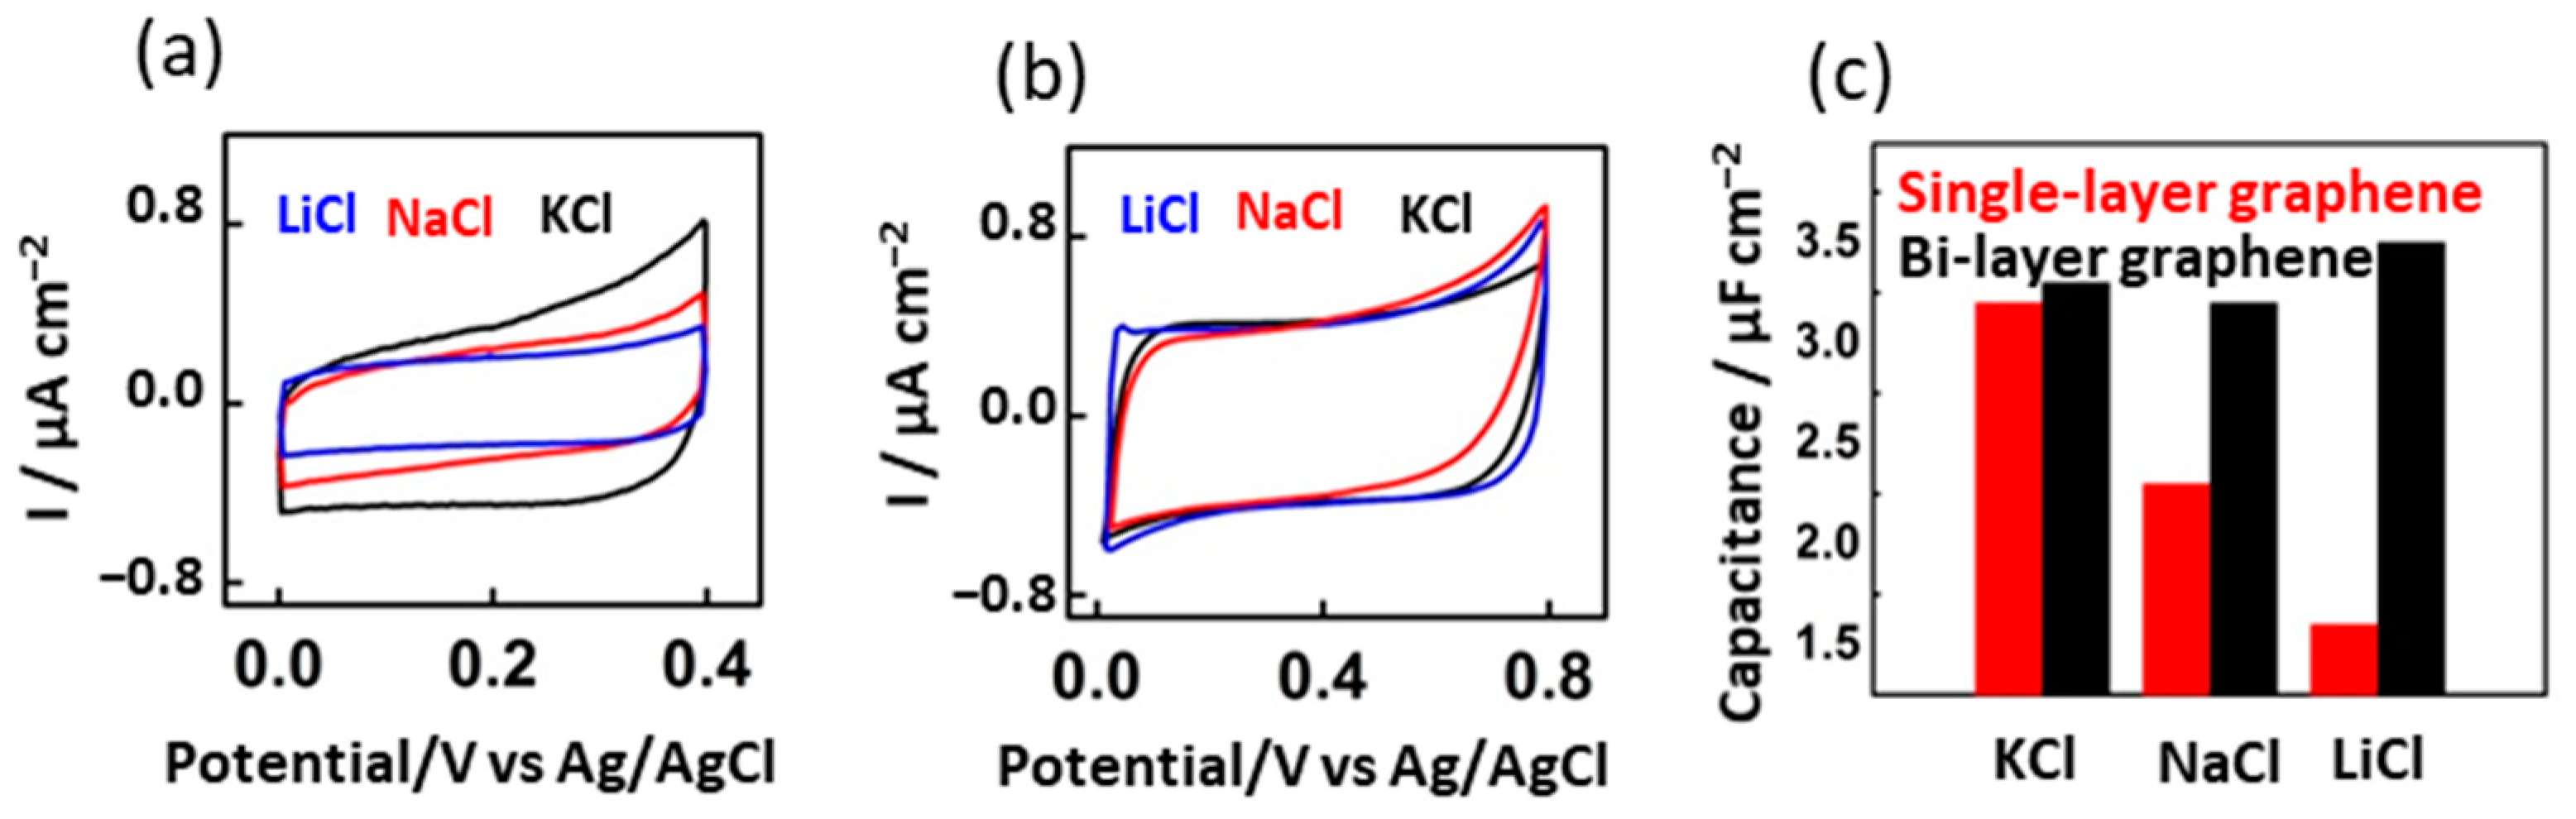
3.1. Performance of EDLCs Containing Aqueous Electrolyte and Graphene

Figure 1a shows the transmission electron microscopic image of bilayer graphene. Graphene sheet structure was clearly observed for bilayer graphene. A similar structure was observed for single-layer graphene as well, although it is not shown here. Figure 1b shows the Raman scattering spectra of graphene electrodes, which were obtained from at least five points averages and reproduced well for different samples. The D, G, and 2D bands of graphene and graphitic structures occurred at approximately 1350, 1600, and 2700 cm−1, respectively. The sp2 in-plane stretching vibration mode and breathing mode of carbon were represented as a G band and a D band, respectively. The intensity ratios of the 2D band to the G band for the single-layer and bilayer graphene were 2.5 and 0.98, respectively. The number of graphene layers was determined as single-layer and two layers according to the relationship between the 2D/G intensity ratio and the number of graphene layers [31]. The D band is associated with the structural defects of graphene. Thus, bilayer graphene contained a relatively larger number of defects than single-layer graphene, whose defects were caused by different substrates used in the preparation processes. Other structure properties of graphene were reported elsewhere [32,33,34].
Figure 2a,b show the cyclic voltammetry results conducted on single-layer and bilayer graphene, respectively. The cyclic voltammetry on single-layer graphene was reported previously [33]. The capacitance values on single-layer and bilayer graphene in the different potential ranges could not be directly compared with each other, although the capacitances were standardized by their potential windows. The dependences of ion species were then mainly discussed here. The cyclic voltammetry curves mainly exhibited rectangular shapes. The rectangular shapes were caused by the formation of double layers on the graphene interface. Although the different defect structures were observed in single-layer and bilayer graphene in Figure 1b, the capacitances were equivalent in the KCl solutions, caused by the same mechanism and slight influence on the amounts of defects. The cyclic voltammetry curve of the single-layer graphene strongly depended on the cation species (Figure 2a). In the LiCl aqueous solution, the cyclic voltammetry curve exhibited the most rectangular shape and the current considerably increased to approximately 0.2–0.4 V during the anodic reaction in the KCl aqueous solution, which can be attributed to the pseudo-capacitance. The pseudo-capacitance was caused by the irreversible ion adsorption on functional groups such as hydroxyl and carboxylic groups. On the other hand, the cyclic voltammetry curves of the bilayer graphene were less dependent on the cation species and were larger than those of the single-layer graphene at the same potentials. Figure 2c indicated that the capacitances of the single-layer graphene in KCl, NaCl, and LiCl aqueous solutions were 3.2, 2.3, and 1.6 µF cm−2, respectively, and those of the bilayer graphene were 3.3, 3.2, and 3.5 µF cm−2, respectively. Ji and co-workers reported that the capacitances on single-layer to five-layer graphene had 2–10 µF cm−2 and the mean minimum was 2.5–3.5 µF cm−2, which agreed with highly oriented pyrolytic graphite [35]. A similar minimum value of 4.5 µF cm−2 was reported in NaCl aqueous solution [36]. The capacitances 2–3.5 µF cm−2 in this work were in the same order as the above work even for much different scan speeds and agreed with pristine graphene [37] and graphite [38]. The similar capacitances on graphene to graphite proposed that ions were captured only on the basal plane of graphene without any specific adsorption sites such as pores and functional groups. The capacitances of the single-layer graphene were in this order: KCl > NaCl > LiCl, whereas similar capacitances were obtained for the bilayer graphene in these solutions. These differences in the capacitances could have been induced by the different adsorption mechanisms of Li and Na ions on the single-layer and bilayer graphene.

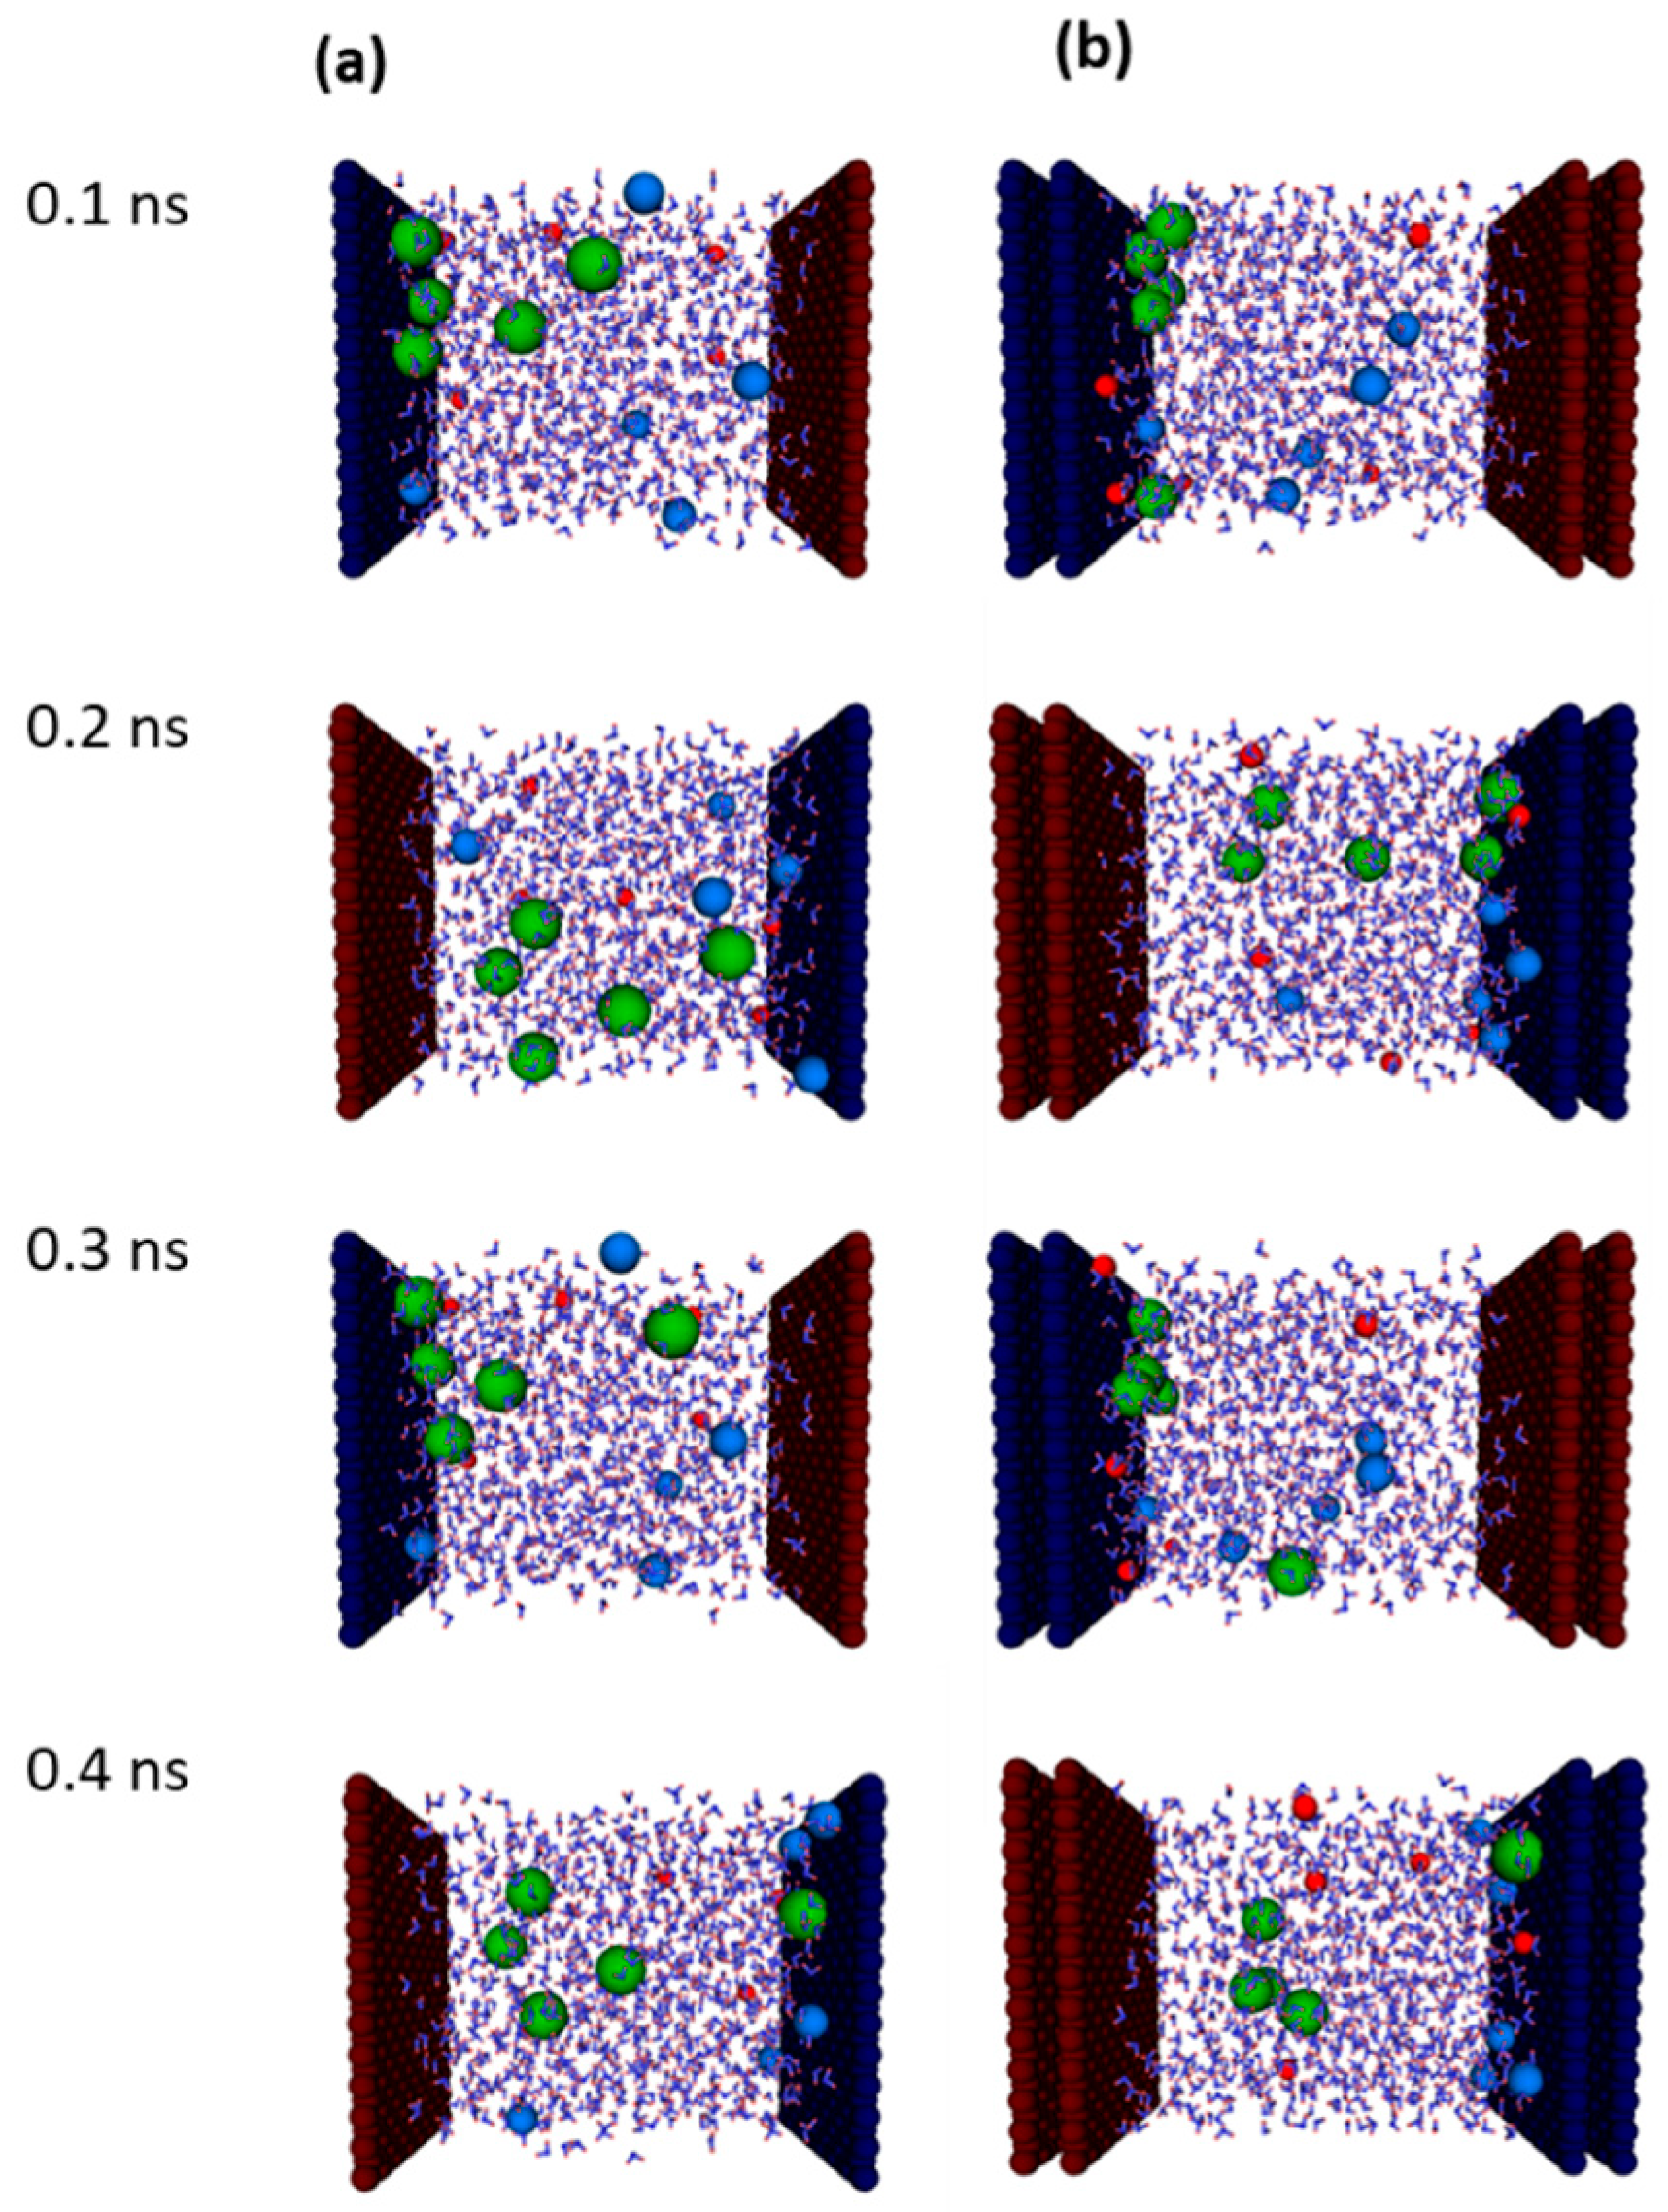
3.2. Ion Dynamics in MD Simulations

The stability of graphene with partial charges was evaluated based on Hartree–Fock calculations (Figure 3). The stability of graphene with a partial charge smaller than 0.03 e was mostly maintained (>99.9%) by donating the partial charges on the graphene with the partial charges of 0.00, ±0.01, ±0.02, and ±0.03 e in which charged graphene was slightly unstable. The graphene structure was thus maintained during the charge–discharge cycles in the less absolute partial charges than 0.03 e, and the structures of graphene were then fixed in the subsequent MD simulations. In contrast, the graphene stability with a partial charge of ±0.04 e could not be calculated in the Hartree–Fock calculations, probably oxing to severely unstable structure of graphene. Figure 4a shows a snapshot obtained after 0.1 ns of the MD simulations as well as the charging conditions of carbon atoms on the graphene walls. Figure 4b shows the conditions of partial charges on graphene. The partial charges of carbon atoms were alternately set to neutral and ±0.02-e charged. Here, the partial charges on graphene were exchanged during the charge–discharge cycles. The left-side graphene in Figure 4a exhibited negative charges at 0.05–0.10 and 0.25–0.30 ns and positive charges at 0.15–0.20 and 0.35–0.40 ns, whereas the right-side graphene in Figure 4a exhibited positive charges at 0.05–0.10 and 0.25–0.30 ns, and negative charges at 0.15–0.20 and 0.35–0.40 ns.
Figure 5 shows snapshots of aqueous electrolytes during charging at 0.1, 0.2, 0.3, and 0.4 ns. Ions are adsorbed on the oppositely charged graphene with a carbon partial charge of ±0.02 e, especially on bilayer graphene. Positive and negative ions were attracted to the negatively and positively charged graphene, respectively, whereas water was dispersed between the graphene. In particular, K and Cl ions relatively quickly moved to the oppositely charged graphene, whereas Li and Na ions gradually moved to the oppositely charged graphene. This can be attributed especially to the formation of a strong ion pair of small ions such as Li and Na ions with Cl ions, and the anomalous ion pair formation was probably caused by the small dimensions of the simulation box in comparison with the actual system [6]. Although it is much better to observe ion dynamics using huge simulation box at the micrometer level, it is severely time-consuming to obtain enough statistical data from small numbers of ions. The same MD simulation without the Cl ions was therefore conducted to avoid unexpected ion pair formation in MD simulations.
Figure 6 shows snapshots of the cations and water molecules in electrolytes containing cations only on single-layer or bilayer graphene electrodes during charging and discharging cycles. The cations moved to the negatively charged graphene more efficiently than in the aqueous electrolytes with both cations and anions, as shown in Figure 5. However, some cations continued not to be adsorbed on the negatively charged graphene after 0.05 ns. This phenomenon was clearly observed in the average trajectories of the cations (Figure 7a,b). The average trajectories of the cations indicated that, despite being the largest ion, more K ions were closely adsorbed on the negatively charged single-layer graphene except for the last cycle at 0.35–0.4 ns, whereas Li ions were hardly adsorbed on the graphene (Figure 6a and Figure 7a). Thus, the type of ion significantly affects the ion adsorption on oppositely charged single-layer graphene. Similar to the cations, the average water positions were slightly shifted to the negatively charged graphene. On the other hand, in the aqueous electrolyte system with cations and anions (Figure 5), the average water positions were constantly at the center. This can be attributed to the dynamics of ions and hydrated water molecules, which affect the ion transfer; i.e., some ions and hydrated water moved together. In other words, hydrated water molecules moved to both sides of single-layer graphene when both cations and anions existed as shown in Figure 5, whereas hydrated water molecules were slightly shifted only to the negatively charged single-layer graphene. Those phenomena were the same as in the case of bilayer graphene, whereas the ion transfers were considerable rather than single-layer graphene (Figure 7b). The self-diffusion coefficients in Figure 7c indicated that cations moved slowly between the single-layer graphene walls during the charging and discharging cycles. In contrast, high self-diffusion coefficients were observed for cations during the charging of the bilayer graphene (Figure 7d), whereas the self-diffusion coefficients observed during the discharging stage were similarly small to those of single-layer graphene. The rapid transfer of cations in the case of the bilayer graphene was also observed from the average trajectories shown in Figure 7b. The ion-species-dependence, which was observed in the case of the single-layer graphene, was hardly observed in the case of bilayer graphene; i.e., Li, Na, and K ions moved at a similar speed to the oppositely charged single-layer graphene during charging. On the other hand, the transfer speeds of ions on bilayer graphene during charging were different by ion species; the self-diffusion coefficients were in the following order: K > Na > Li. Surprisingly, K ions were transferred the most quickly despite being the largest ion species. This was caused because K ions solely moved to the oppositely charged bilayer graphene associated with dehydration, whereas the Li ion was accompanied by hydrated water, as mentioned later in Figure 8d. The faster ion transfer for the bilayer graphene than the single-layer graphene can explain the high experimental capacitance in the bilayer graphene (Figure 2b). Therefore, the quick cation transfer and subsequent cation adsorption on the oppositely charged bilayer graphene probably result in high capacitance because of the higher self-diffusion coefficients of the cations in the case of the bilayer graphene than those in the case of the single-layer graphene as well as the unchanged water self-diffusion coefficients. The features of capacitance changes are also suggested from the capacitance changes related to hydration structures, as discussed later.
The capacitances were calculated based on the number of adsorbed cations on the oppositely charged graphene (Figure 8a,b). The capacitances were considerably maintained even during the discharging cycles between 0.10–0.15, 0.20–0.25, and 0.30–0.35 ns, especially for Li ions. The maintenance of the capacitances was in good agreement with the rectangular shape of the experimentally obtained cyclic voltammogram shown in Figure 2a,b. A higher capacitance was observed in the case of K ions on the single-layer graphene than in the cases of Li and Na ions, except for the last cycle between 0.35 and 0.4 ns. In contrast, the capacitances for all ion species on bilayer graphene were similar. These results were also in good agreement with the experimental capacitances. A partial charge of ±0.02 e per a carbon atom induced stronger potential fields of bilayer graphene than single-layer graphene, and ion transfers in the bilayer graphene were faster than single-layer graphene, as mentioned above. The maintenance of the capacitance is probably a result of the hydrogen bonding network of water preventing an ion from having high mobility [39]. The self-diffusion coefficients were slightly increased when the partial charges of carbon atoms were switched to neutral at 0.10, 0.20, and 0.30 ns, as mentioned above in Figure 7c,d. On the other hand, the high self-diffusion coefficients at 0.05, 0.15, 0.25, and 0.35 ns, when the partial charges were switched to ±0.02 e, induced a rapid ion transfer and resulted in high capacitances. The high mobility of hydrated ions at charging is a result of hydrated water molecules participating in ion transfer and quick exchange between hydrogen bonding and hydration forms, reported elsewhere [39]. The changes in the hydration structure during the charging and discharging cycles were evaluated based on the hydration numbers shown in Figure 8c,d. The hydration numbers of the Li, Na, and K ions were 4, 5, and 7, respectively [25]. The hydration numbers of the Li and Na ions slightly changed during the charge–discharge cycles in the case of the single-layer graphene. However, the hydration numbers of the K ions exhibited a considerable change compared to those of the Li and Na ions. The changeable hydration numbers of the K ions were caused by their weak hydration. In contrast, the hydration numbers of all the ion species obviously changed in the case of the bilayer graphene, inducing similar capacitances on bilayer graphene. Thus, decreasing hydration numbers, i.e., dehydration, is necessary to gain high capacitances on graphene electrodes.
The radial distribution functions between Li and water, Na and water, and K and water were calculated to assess the hydration shell during charging and non-charging cycles (Figure 9). The peak intensities were standardized by molecular numbers in systems. The nearest-neighbor distances between the Li ion and water, the Na ion and water, and the K ion and water were 0.2, 0.24, and 0.27 nm, respectively, regardless of the state of charging or non-charging for both single-layer and bilayer graphene. This indicated that hydration was obviously formed in all the systems and the strength of hydration could be estimated by the peak height because a high peak indicated a rigid hydration structure. The strength of hydration was determined from the above point: Li ion > Na ion > K ion, as expected. On the other hand, the second-nearest neighbor distances were changed by the layer number of graphene and charging. The second-nearest neighbor distances in the case of the bilayer graphene were longer than those in the case of the single-layer graphene regardless of the state of charging or non-charging. The second-nearest neighbor distances of Li-O and Na-O were rarely changed by the layer number of graphene and the state of charging and non-charging; the Li-O and Na-O distances were 0.45 ± 0.01 and 0.50 ± 0.01 nm, respectively. On the other hand, K ion–water distributions were considerably changed by those conditions. The second-nearest neighbor peak for the single-layer graphene and the state of non-charging was clearly observed at 0.50 nm, whereas the peak for the single-layer graphene during charging was broadened. Those for the bilayer graphene were hard to observe regardless of charging and non-charging. Those results of K ions indicated the formation of a weak hydration shell, and K ions hardly affected the second- and higher-nearest neighbor structures. A weakened hydration structure for bilayer graphene promoted a fast transfer during charging, which is associated with high capacitances, as similarly mentioned above in Figure 8c,d, which became the advantage of higher capacitances.

4. Conclusions

In this work, we prepared single-layer and bilayer graphene to adapt graphene electrodes for the usage of EDLCs. EDLCs with aqueous electrolyte solutions containing Li, Na, K, and Cl ions were then measured using single-layer and bilayer graphene electrodes. The cyclic voltammograms had a rectangular shape with pseudo-capacitance. The highest capacitance was observed in the system of KCl aqueous solution for the single-layer graphene in comparison with LiCl and NaCl aqueous solutions. On the other hand, for the bilayer graphene, the capacitances were similar in LiCl, NaCl, and KCl aqueous solutions, showing rectangular cyclic voltammograms. To evaluate the mechanism of those capacitance properties, the ion dynamics associated with charging on graphene were evaluated using MD simulations. Cation dynamics were mainly evaluated to avoid unexpected ion pair formation. Cations transferred onto negatively charged graphene during charging. Water was also attracted to the graphene in the aqueous electrolyte system only with cations, whereas water was dispersed in the system with cations and anions. The water localization indicated that hydrated water molecules were moved with cations, which was more clearly observed for the bilayer graphene than single-layer graphene owing to the stronger interaction between the cation and the bilayer graphene. The MD simulations also indicated that with the dehydration and modification of the second hydration shell, cations can be rapidly transferred during charging. K ions were transferred most quickly despite being the largest ion species owing to the easiest dehydration, especially for the bilayer graphene. The changes in the hydration shell structure were promoted by the strong interaction of ions with bilayer graphene, leading to the high capacitances in the bilayer graphene as well as the experiment. The quick cation transfer and subsequent cation adsorption with dehydration result in high capacitances on bilayer graphene. Therefore, multilayer graphene is a candidate for developing EDLCs with excellent performance rather than single-layer graphene. Thus, this work provides clarifications that can help develop efficient graphene-based electrochemical energy storage devices.

Author Contributions

Conceptualization, T.O.; investigation, S.H., S.I., Y.S., S.F., M.S.K., and T.O.; writing—original draft preparation, S.H., S.F., and T.O.; supervision, T.O. All authors have read and agreed to the published version of the manuscript.

Funding

This research was funded by the Kurita Water and Environment Foundation.

Data Availability Statement

Data available on request due to restrictions, e.g., privacy or ethical.

Acknowledgments

Transmission electron microscopic measurement was conducted at the Center for Analytical Instrumentation at Chiba University.

Conflicts of Interest

The authors declare no conflict of interest.

References

  1. World Commission on Environment and Development. Our Common Future; Oxford University Press: Oxford, UK, 1987. [Google Scholar]
  2. Dunn, B.; Kamath, H.; Tarascon, J.-M. Electrical Energy Storage for the Grid: A Battery of Choices. Science 2011, 334, 928–935. [Google Scholar] [CrossRef] [PubMed] [Green Version]
  3. Afif, A.; Rahman, S.M.H.; Tasfiah Azad, A.; Zaini, J.; Islan, M.A.; Azad, A.K. Advanced materials and technologies for hybrid supercapacitors for energy storage—A review. J. Energy Storage 2019, 25, 100852. [Google Scholar] [CrossRef]
  4. Simon, P.; Gogotsi, Y. Capacitive Energy Storage in Nanostructured Carbon-Electrolyte Systems. Acc. Chem. Res. 2012, 46, 1094–1103. [Google Scholar] [CrossRef]
  5. Takamatsu, H.; Khan, M.S.; Araki, T.; Urita, C.; Urita, K.; Ohba, T. Sequential and simultaneous ion transfer into carbon nanopores during charge–discharge cycles in electrical double layer capacitors. Sustain. Energy Fuels 2022, 6, 2001–2009. [Google Scholar] [CrossRef]
  6. Ohba, T. Fast Ion Transportation Associated with Recovering Hydration Shells in a Nanoelectrolyte between Conical Carbon Nanopores during Charging Cycles. J. Phys. Chem. C 2017, 121, 10439–10444. [Google Scholar] [CrossRef]
  7. Etacheri, V.; Marom, R.; Elazari, R.; Salitra, G.; Aurbach, D. Challenges in the development of advanced Li-ion batteries: A review. Energy Environ. Sci. 2011, 4, 3243–3262. [Google Scholar] [CrossRef]
  8. Sato, T.; Masuda, G.; Takagi, K. Electrochemical properties of novel ionic liquids for electric double layer capacitor applications. Electrochim. Act. 2004, 49, 3603–3611. [Google Scholar] [CrossRef]
  9. Castro Neto, A.H.; Guinea, F.; Peres, N.M.R.; Novoselov, K.S.; Geim, A.K. The electronic properties of graphene. Rev. Mod. Phys. 2009, 81, 109–162. [Google Scholar] [CrossRef] [Green Version]
  10. Zhu, Y.; Murali, S.; Cai, W.; Li, X.; Suk, J.W.; Potts, J.R.; Ruoff, R.S. Graphene and Graphene Oxide: Synthesis, Properties, and Applications. Adv. Mater. 2010, 22, 3906–3924. [Google Scholar] [CrossRef]
  11. Hirata, M.; Gotou, T.; Horiuchi, S.; Fujiwara, M.; Ohba, M. Thin-film particles of graphite oxide 1: High-yield synthesis and flexibility of the particles. Carbon 2004, 42, 2929–2937. [Google Scholar] [CrossRef]
  12. Zhang, F.; Zhang, T.; Yang, X.; Zhang, L.; Leng, K.; Huang, Y.; Chen, Y. A high-performance supercapacitor-battery hybrid energy storage device based on graphene-enhanced electrode materials with ultrahigh energy density. Energy Environ. Sci. 2013, 6, 1623–1632. [Google Scholar] [CrossRef]
  13. Tanabe, Y.; Ito, Y.; Sugawara, K.; Koshino, M.; Kimura, S.; Naito, T.; Johnson, I.; Takahashi, T.; Chen, M. Dirac Fermion Kinetics in 3D Curved Graphene. Adv. Mater. 2020, 32, 2005838. [Google Scholar] [CrossRef] [PubMed]
  14. Wu, Y.-C.; Ye, J.; Jiang, G.; Ni, K.; Shu, N.; Taberna, P.-L.; Zhu, Y.; Simon, P. Electrochemical Characterization of Single Layer Graphene/Electrolyte Interface: Effect of Solvent on the Interfacial Capacitance. Angew. Chem. Int. Ed. 2021, 60, 13317–13322. [Google Scholar] [CrossRef]
  15. Ke, Q.; Liu, Y.; Liu, H.; Zhang, Y.; Hu, Y.; Wang, J. Surfactant-modified chemically reduced graphene oxide for electrochemical supercapacitors. RSC Adv. 2014, 4, 26398–26406. [Google Scholar] [CrossRef]
  16. Ke, Q.; Wang, J. Graphene-based materials for supercapacitor electrodes—A review. J. Mater. 2016, 2, 37–54. [Google Scholar] [CrossRef] [Green Version]
  17. Elliott, J.D.; Papaderakis, A.A.; Dryfe, R.A.W.; Carbone, P. The electrochemical double layer at the graphene/aqueous electrolyte interface: What we can learn from simulations, experiments, and theory. J. Mater. Chem. C 2022, 10, 15225–15262. [Google Scholar] [CrossRef]
  18. Liang, M.; Luo, B.; Zhi, L. Application of graphene and graphene-based materials in clean energy-related devices. Int. J. Energy Res. 2009, 33, 1161–1170. [Google Scholar] [CrossRef]
  19. Cai, M.; Outlaw, R.A.; Quinlan, R.A.; Premathilake, D.; Butler, S.M.; Miller, J.R. Fast Response, Vertically Oriented Graphene Nanosheet Electric Double Layer Capacitors Synthesized from C2H2. ACS Nano 2014, 8, 5873–5882. [Google Scholar] [CrossRef]
  20. Simon, P.; Gogotsi, Y. Perspectives for electrochemical capacitors and related devices. Nat. Mater. 2020, 19, 1151–1163. [Google Scholar] [CrossRef]
  21. Papageorgiou, D.G.; Kinloch, I.A.; Young, R.J. Mechanical properties of graphene and graphene-based nanocomposites. Progress Mater. Sci. 2017, 90, 75–127. [Google Scholar] [CrossRef]
  22. Fukaya, Y.; Entani, S.; Sakai, S.; Mochizuki, I.; Wada, K.; Hyodo, T.; Shamoto, S.-I. Spacing between graphene and metal substrates studied with total-reflection high-energy positron diffraction. Carbon 2016, 103, 1–4. [Google Scholar] [CrossRef]
  23. Lecce, V.D.; Gnudi, A.; Gnani, E.; Reggiani, S.; Baccarani, G. Simulations of Graphene Base Transistors with Improved Graphene Interface Model. IEEE Electron Device Lett. 2015, 36, 969–971. [Google Scholar] [CrossRef]
  24. Fathzadeh, M.; Fahrvandi, H.; Nadimi, E. Electronic properties of graphene-ZnO interface: A density functional theory investigation. Nanotechnology 2020, 31, 025710. [Google Scholar] [CrossRef]
  25. Varma, S.; Rempe, S.B. Coordination numbers of alkali metal ions in aqueous solutions. Biophys. Chem. 2006, 124, 192–199. [Google Scholar] [CrossRef]
  26. Zhu, J.; Xu, Y.; Wang, J.; Lin, J.; Sun, X.; Mao, S. The effect of various electrolyte cations on electrochemical performance of polypyrrole/RGO based supercapacitors. Phys. Chem. Chem. Phys. 2015, 17, 28666–28673. [Google Scholar] [CrossRef] [PubMed]
  27. Yuan, W.; Zhou, Y.; Li, Y.; Li, C.; Peng, H.; Zhang, J.; Liu, Z.; Dai, L.; Shi, G. The edge- and basal-plane-specific electrochemistry of a single-layer graphene sheet. Sci. Rep. 2013, 3, 2248. [Google Scholar] [CrossRef] [Green Version]
  28. Shao, Q.; Huang, L.; Zhou, J.; Lu, L.; Zhang, L.; Lu, X.; Jiang, S.; Gubbins, K.E.; Shen, W. Molecular simulation study of temperature effect on ionic hydration in carbon nanotubes. Phys. Chem. Chem. Phys. 2008, 10, 1896–1906. [Google Scholar] [CrossRef]
  29. Doll, J.J.; Steele, W.A. The physical interaction of gases with crystalline solids: III. Heat capacity and the localized-to-mobile transition. Surf. Sci. 1974, 44, 449–462. [Google Scholar] [CrossRef]
  30. Frisch, M.J.; Trucks, G.W.; Schlegel, H.B.; Scuseria, G.E.; Robb, M.A.; Cheeseman, J.R.; Scalmani, G.; Barone, V.; Petersson, G.A.; Nakatsuji, H.; et al. Gaussian 16 Rev. A.03; Gaussian Inc.: Wallingford, CT, USA, 2016. [Google Scholar]
  31. Ferrari, A.C.; Meyer, J.C.; Scardaci, V.; Casiraghi, C.; Lazzeri, M.; Mauri, F.; Piscanec, S.; Jiang, D.; Novoselov, K.S.; Roth, S.; et al. Raman Spectrum of Graphene and Graphene Layers. Phys. Rev. Lett. 2006, 97, 187401. [Google Scholar] [CrossRef] [Green Version]
  32. Kitayama, H.; Shimizu, K.; Ohba, T. Graphene-laminated architectures obtained by chemical vapor deposition: From graphene to graphite. Chem. Phys. Lett. 2017, 687, 303–306. [Google Scholar] [CrossRef]
  33. Faraezi, S.; Khan, M.S.; Ohba, T. Dehydration of Cations Inducing Fast Ion Transfer and High Electrical Capacitance Performance on Graphene Electrode in Aqueous Electrolytes. Ind. Eng. Chem. Res. 2020, 59, 5768–5774. [Google Scholar] [CrossRef]
  34. Kitayama, H.; Ekayev, M.C.; Ohba, T. Piezoresistive and chemiresistive gas sensing by metal-free graphene layers. Phys. Chem. Chem. Phys. 2020, 22, 3089–3096. [Google Scholar] [CrossRef] [PubMed]
  35. Ji, H.; Zhao, X.; Qiao, Z.; Jung, J.; Zhu, Y.; Lu, Y.; Zhang, L.L.; MacDonald, A.H.; Ruoff, R.S. Capacitance of carbon-based electrical double-layer capacitors. Nat. Commun. 2014, 5, 3317. [Google Scholar] [CrossRef] [PubMed] [Green Version]
  36. Zhong, J.-H.; Liu, J.-Y.; Li, Q.; Li, M.-G.; Zeng, Z.-C.; Hu, S.; Wu, D.-Y.; Cai, W.; Ren, B. Interfacial capacitance of graphene: Correlated differential capacitance and in situ electrochemical Raman spectroscopy study. Electrochim. Act. 2013, 110, 754–761. [Google Scholar] [CrossRef]
  37. Qorbani, M.; Esfandiar, A.; Mehdipour, H.; Chaigneau, M.; Irajizad, A.; Moshfegh, A.Z. Shedding Light on Pseudocapacitive Active Edges of Single-Layer Graphene Nanoribbons as High-Capacitance Supercapacitors. ACS Appl. Energy Mater. 2019, 2, 3665–3675. [Google Scholar] [CrossRef]
  38. Zou, Y.; Walton, A.S.; Kinloch, I.A.; Dryfe, R.A. Investigation of the Differential Capacitance of Highly Ordered Pyrolytic Graphite as a Model Material of Graphene. Langmuir 2016, 32, 11448–11455. [Google Scholar] [CrossRef] [Green Version]
  39. Ohba, T. Water Assistance in Ion Transfer during Charge and Discharge Cycles. J. Phys. Chem. C 2015, 119, 15185–15194. [Google Scholar] [CrossRef]
Figure 1. (a) Transmission electron microscopic image of bilayer graphene. (b) Raman scattering spectra of the graphene electrodes. Single-layer and bilayer graphene are represented by red and black curves, respectively.
Batteries 09 00212 g001
Figure 2. Cyclic voltammograms of LiCl (blue), NaCl (red), and KCl (black) aqueous solutions on (a) single-layer graphene and (b) bilayer graphene electrodes. (c) Capacitances of KCl, NaCl, and LiCl aqueous solutions on single-layer (red) and bilayer graphene (black) [33]. Copyright © 2020, American Chemical Society.
Batteries 09 00212 g002
Figure 3. (a) Model graphene fragment for Hartree–Fock calculations. Carbon and hydrogen atoms are represented by black and white spheres, respectively. CC and CH bonds are represented by a black stick. (b) Relative stability of graphene with partial charges when E0 is set to the graphene stability at neutral charge.
Batteries 09 00212 g003
Figure 4. (a) Snapshot of aqueous electrolytes between single-layer graphene and bilayer graphene. Li, Na, K, and Cl ions are represented by red, blue, green, and yellow spheres, respectively. O and H atoms in H2O are illustrated by blue and red sticks, respectively. A carbon atom is represented by a large black sphere. (b) Conditions of the applied partial charges (±0.02 e) of carbon atoms on the right- and left-side graphene.
Batteries 09 00212 g004
Figure 5. Snapshots of aqueous electrolytes between (a) single-layer graphene and (b) bilayer graphene electrodes. Li, Na, K, and Cl ions are represented by red, blue, green, and yellow spheres. H2O is illustrated by blue and red sticks. The graphene wall with positive and negative partial charges is shown by dark red and blue spheres, respectively, representing carbon atoms.
Batteries 09 00212 g005
Figure 6. Snapshots of Li, Na, and K aqueous electrolytes between (a) single-layer graphene and (b) bilayer graphene. Li, Na, and K ions are represented by red, blue, and green spheres, respectively. H2O is illustrated by blue and red sticks. Graphene walls with positive and negative partial charges are shown by dark red and blue spheres representing carbon atoms, respectively.
Batteries 09 00212 g006
Figure 7. Average ion and water positions over time in the case of (a) single-layer graphene and (b) bilayer graphene. Self-diffusion coefficients in the case of (c) single-layer graphene and (d) bilayer graphene. Li, Na, and K ions, and H2O are represented by red, blue, green, and black curves, respectively.
Batteries 09 00212 g007
Figure 8. Capacitance changes on the graphene electrodes for (a) single-layer graphene and (b) bilayer graphene. Hydration numbers of ions for (c) single-layer graphene and (d) and bilayer graphene. Li, Na, and K ions are represented by red, blue, and green curves, respectively.
Batteries 09 00212 g008
Figure 9. Radial distribution functions between (a) Li ion and water, (b) Na ion and water, and (c) and K ion and water during charging and discharging. Charging and non-charging cycles for single-layer graphene are illustrated by dark and light blue, respectively. Charging and non-charging cycles for bilayer graphene are illustrated in red and orange, respectively.
Batteries 09 00212 g009
Disclaimer/Publisher’s Note: The statements, opinions and data contained in all publications are solely those of the individual author(s) and contributor(s) and not of MDPI and/or the editor(s). MDPI and/or the editor(s) disclaim responsibility for any injury to people or property resulting from any ideas, methods, instructions or products referred to in the content.

