Article

Experimental Investigation for the Phase Change Material Barrier Area Effect on the Thermal Runaway Propagation Prevention of Cell-to-Pack Batteries

1
College of Mechanical Engineering, University of Shanghai for Science and Technology, Shanghai 200093, China
2
State Key Laboratory of Automotive Safety and Energy, Tsinghua University, Beijing 100084, China
3
School of Criminal Investigation, China People’s Police University, Langfang 065000, China
4
School of Automotive Studies, Tongji University, Shanghai 201804, China
*
Authors to whom correspondence should be addressed.
Batteries 2023, 9(4), 206; https://doi.org/10.3390/batteries9040206
Submission received: 30 November 2022 / Revised: 16 March 2023 / Accepted: 28 March 2023 / Published: 30 March 2023
(This article belongs to the Special Issue Battery Energy Storage in Advanced Power Systems)

Abstract

:
Thermal runaway propagation (TRP) is a primary safety issue in lithium-ion battery (LIB) applications, and the use of a thermal barrier is considered to be a promising solution for TRP prevention. However, the operating conditions of the battery are extremely complicated, such as fast charging, low-temperature heating and thermal runaway. To date, there is no consistent answer as to how to choose the appropriate thermal barrier for such a complicated working environment. In this study, the characteristics of hydrogel based on sodium polyacrylate are explored, and the impact of thermal barrier area on TRP is investigated through experiments. Due to the prismatic battery structure, thermal barriers placed between cells are designed with different areas (148 × 98 mm, 128 × 88 mm, and 108 × 78 mm). The results indicate that test 1 without a placed thermal barrier quickly completes the TRP process, and the thermal runaway (TR) behavior is more violent. With a thermal barrier that does not have full area coverage placed between cells (test 2 and test 3), the propagation time is prolonged, but TRP still occurs. Compared with test 1, the triggered temperature of T2 F (the front surface of cell 2) is reduced by 207.6 °C and 295.2 °C, respectively. The complete area coverage thermal barrier successfully prevents TRP, and the T2 F of cell 2 only reaches 145.4 °C under the phase change by the hydrogel. This study may suggest a safety design for battery modules and prevent propagation among batteries.

1. Introduction

The demand for energy storage systems has enhanced the application of lithium-ion batteries (LIBs) [1,2], as a result of their outstanding stability, high energy density, low self-discharge rate, and long-life cycle [3,4,5]. With the innovation of various technologies, battery capacity and energy density have been greatly improved [6]. The increase in energy density is accompanied by a higher possibility of thermal runaway (TR). In recent years, there have been many reports about the TR of LIBs. On Day Month Year, the battery energy storage of a family in southern Germany exploded. At the end of February, a fire broke out in Nigeria’s Ministry of Finance [7]. Therefore, it is significant to restrain the TR of LIBs [8,9].
The trigger of battery TR is always caused by various abuse conditions, including mechanical abuse, electrical abuse, and thermal abuse [10,11,12,13,14,15]. In addition, there is a particular situation named sudden death, which is mainly caused by the internal manufacturing defects of the battery [16]. TR will engender enormous heat, high-temperature gas, and flame, which will cause TR for adjacent batteries and will further cause system-level damage. The extent of harm is on the small side, but the hazard extent will be inestimable when it expands to system-level propagation [2,3,17,18,19]. The TR of a cell is inevitable because of various uncontrollable factors. However, a thermal barrier can prevent the propagation between cell to cell. Therefore, setting phase-change material (PCM) with a low thermal conductivity between batteries is an economical and effective solution to prevent thermal runaway propagation (TRP) under extreme conditions.
There are many kinds of battery safety protection schemes, and some commonly used protection schemes are introduced in Table 1. PCM, as a cutting-edge material, is widely used in various fields [20]. Especially in battery thermal management systems (BTMSs), research has provided abundant results [21,22,23,24,25]. At the same time, some research on PCM as the thermal barrier between cells was carried out continuously. Lee et al. [26] designed an integrated PCM and micro-channel plate cooling system and verified that the system could prevent TRP under a water flow of 3.9 L/min. Gao et al. [27] discussed the effect of using silica aerogel and paraffin as a thermal barrier on preventing TRP. Wang et al. [28] collaboratively used paraffin and flame retardant to prevent TRP, and the influence of the mass fraction of Al(OH) on the composite material was also discussed. Xu et al. [29] invented a composite ceramic fiber with low thermal conductivity to prevent TRP. The experimental results show that the material has excellent temperature resistance, extrusion resistance, heat absorption and heat insulation properties. Extinguishing can weaken the flame to a certain extent, but it is difficult to take away the amount of heat generated by a high temperature, and TRP will still occur [30]. The liquid-cooling plate can only work under normal working conditions, but it cannot prevent the occurrence of TRP, so it needs to be used with other heat insulation materials [31]. In recent years, hydrogels have also been used to prevent the TRP [32].
In this paper, the common properties of hydrogels based on sodium polyacrylate were explored. A series of TRP tests were carried out on 153 Ah capacity prismatic LIBs with three types of area thermal barrier and a blank control group. The variations in temperature, voltage, propagation time, TR behavior, and heat transfer path were comprehensively analyzed and compared. It was found that a thermal barrier placed between the batteries has an intuitive effect on TRP. A smaller area of the thermal barrier increases the triggered temperature of the front surface, and the TR behavior is more violent. Furthermore, the heat transfer paths of each group of experiments were analyzed, and reasons for the influence of different areas of thermal barriers on TRP were revealed, which can enhance the understanding of the safety design of a battery module.

2. Experiment

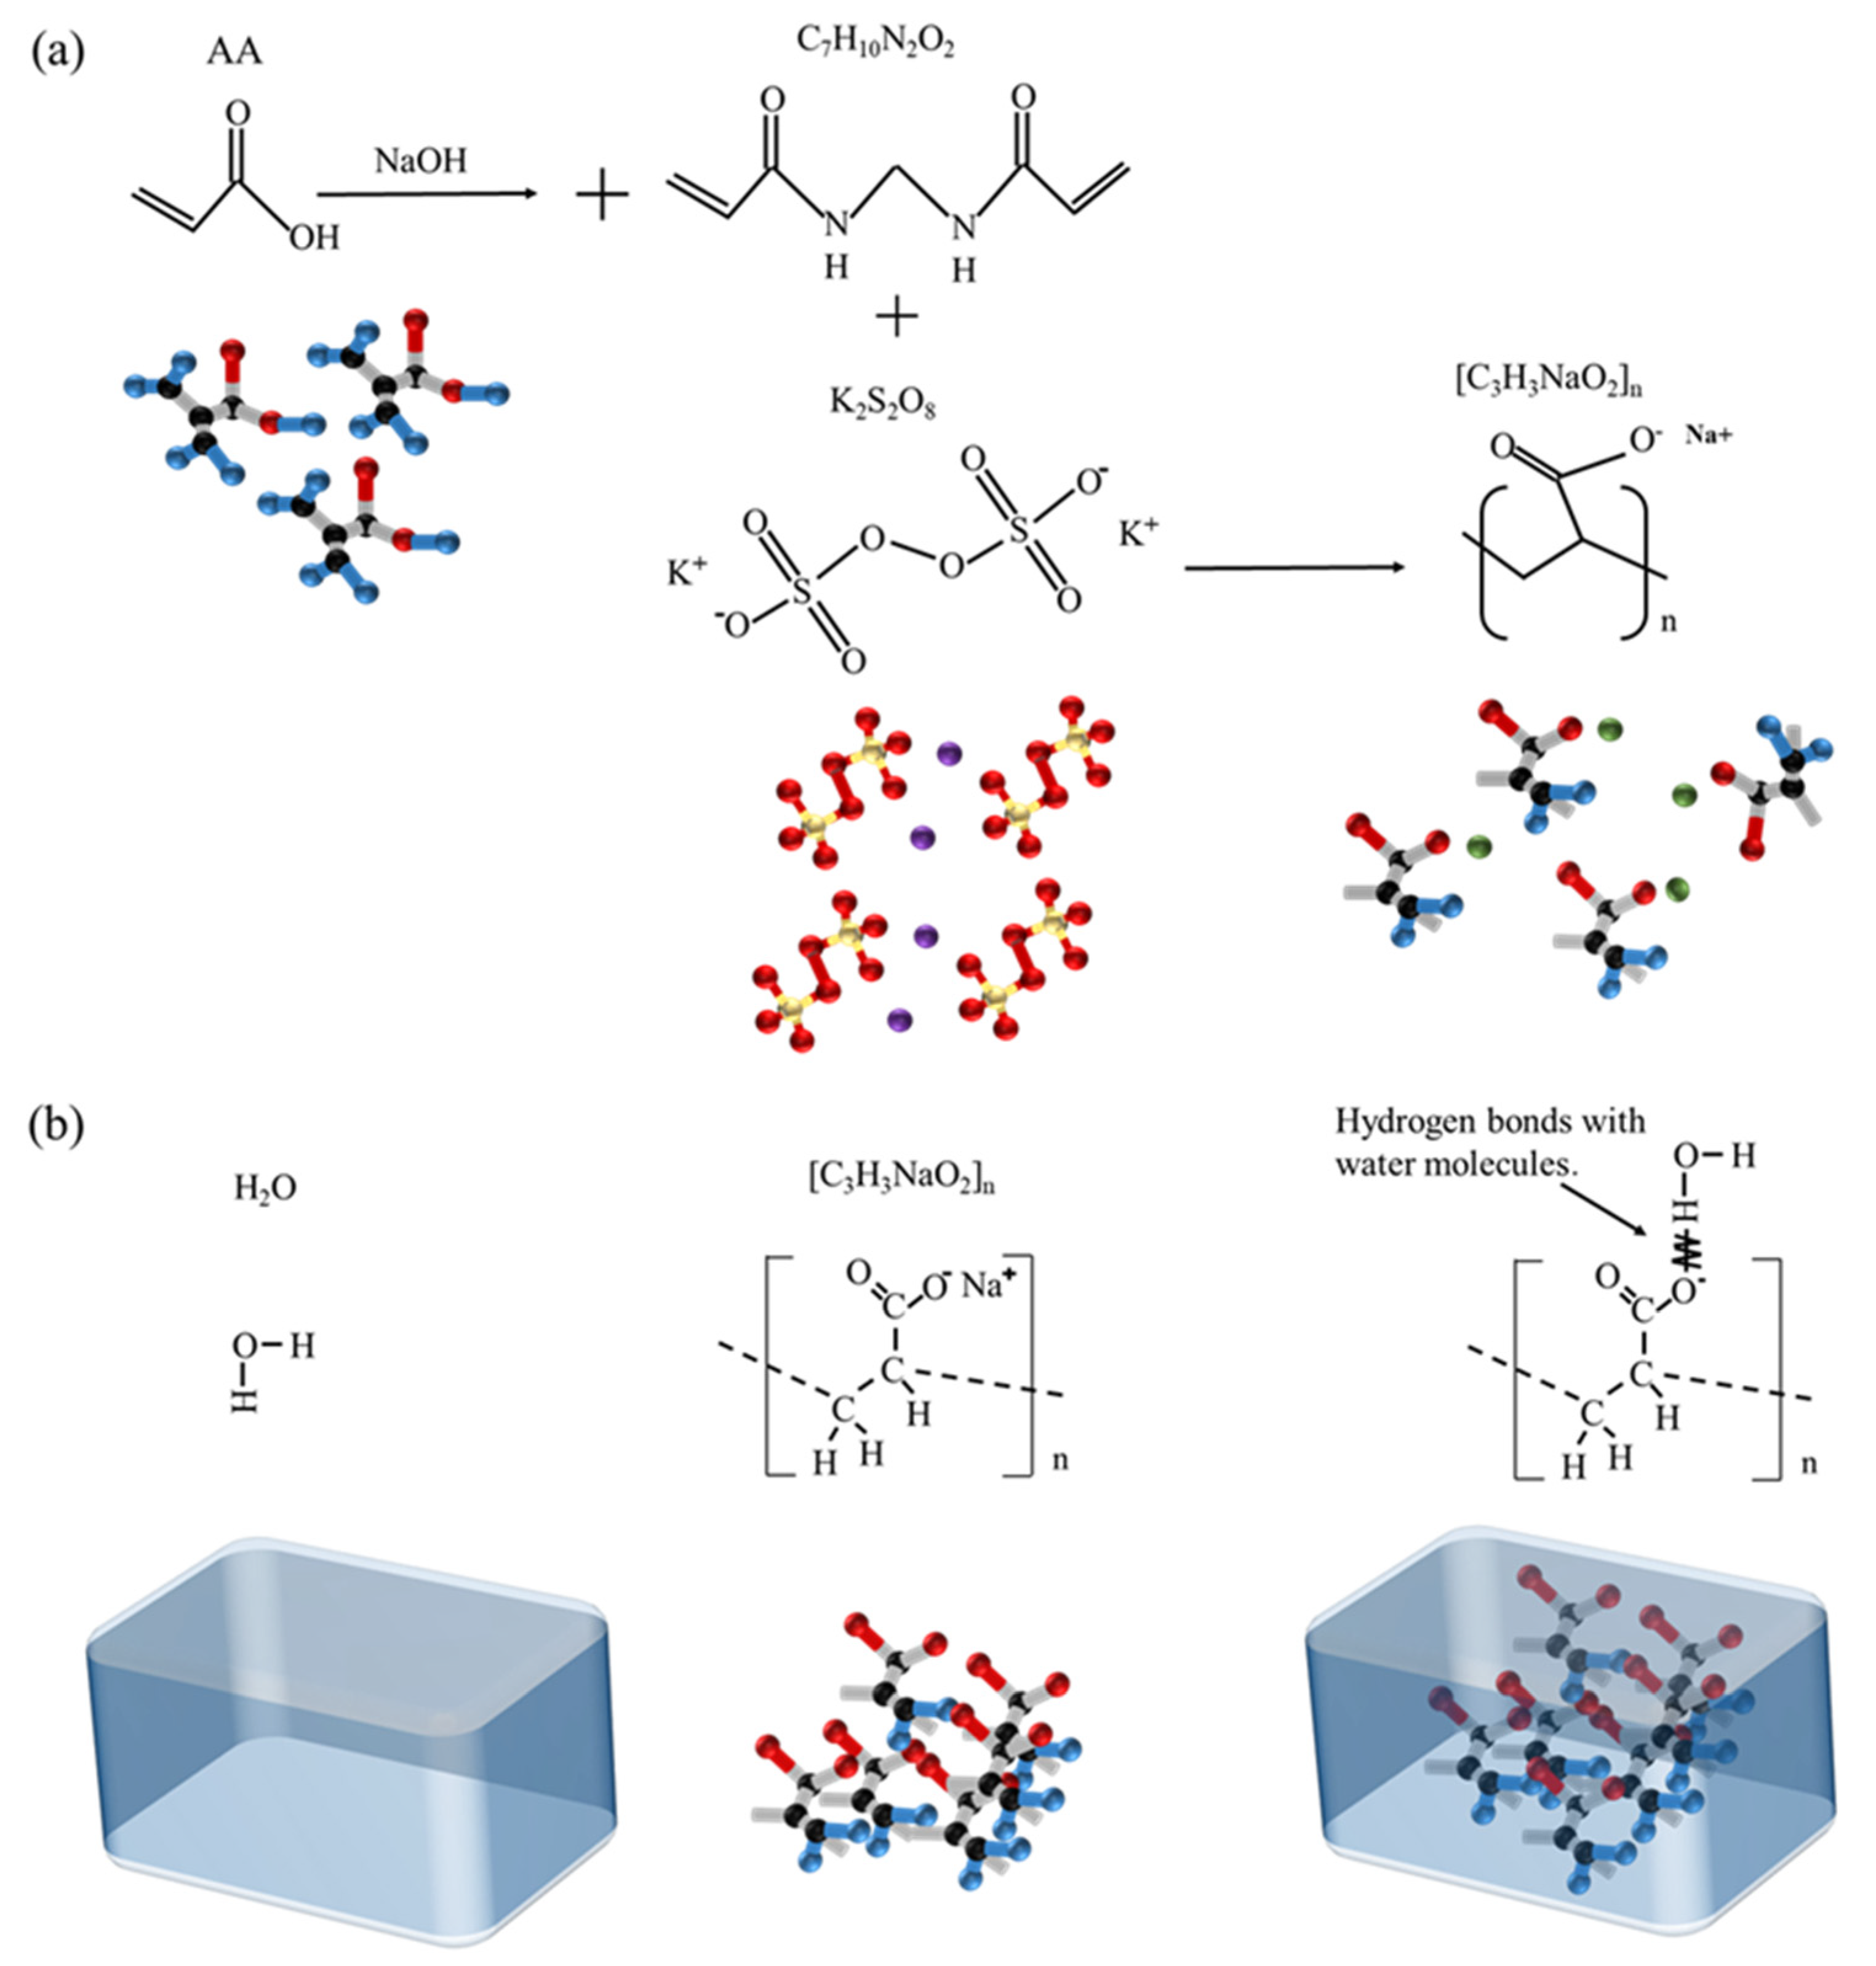
2.1. Material of Heat Insulation Barrier

The thermal barrier consists of hydrogel, aramid fiber and aluminum–plastic film. The hydrogel can absorb much heat by its latent heat of phase change. From the perspective of bionics, porous aramid fiber can provide enough support strength for the heat insulation barrier, which can resist the extrusion caused by the pre-tightening force of the battery and respiratory effects. The aluminum–plastic film is used for encapsulation to prevent hydrogel leakage from causing a short circuit between batteries. Taking sodium polyacrylate (SP) as the primary material, through the hydrogen bond formed with water, reduces the fluidity of water molecules and results in a hydrogel. SP is a macromolecule polymer material; each gram of SP can absorb about 100–300 times more water than itself. The preparation process of SP is by adding acrylic acid (AA) and Na (OH) to the cross-linking agent N, N′-methylenebisacrylamide (N, N′-M), and initiator potassium persulfate (PP). The synthesis of sodium polyacrylate and the formation principle of hydrogel is shown in Figure 1.

2.2. Preparation Process

To start with, the SP was dried in a drying oven at 100 °C for 6 h to remove water. Then, 1 g SP was added to a beaker and distilled water was slowly added to a water bath heater at 50 °C. After 100 g of water was mixed, it was found that there were no noticeable white SP particles in the beaker, which was still for 3 h. The hydrogel was filled into the pores of aramid fibers symmetrically, and the aluminum–plastic film was tightly packaged under the action of a heat-sealing machine.

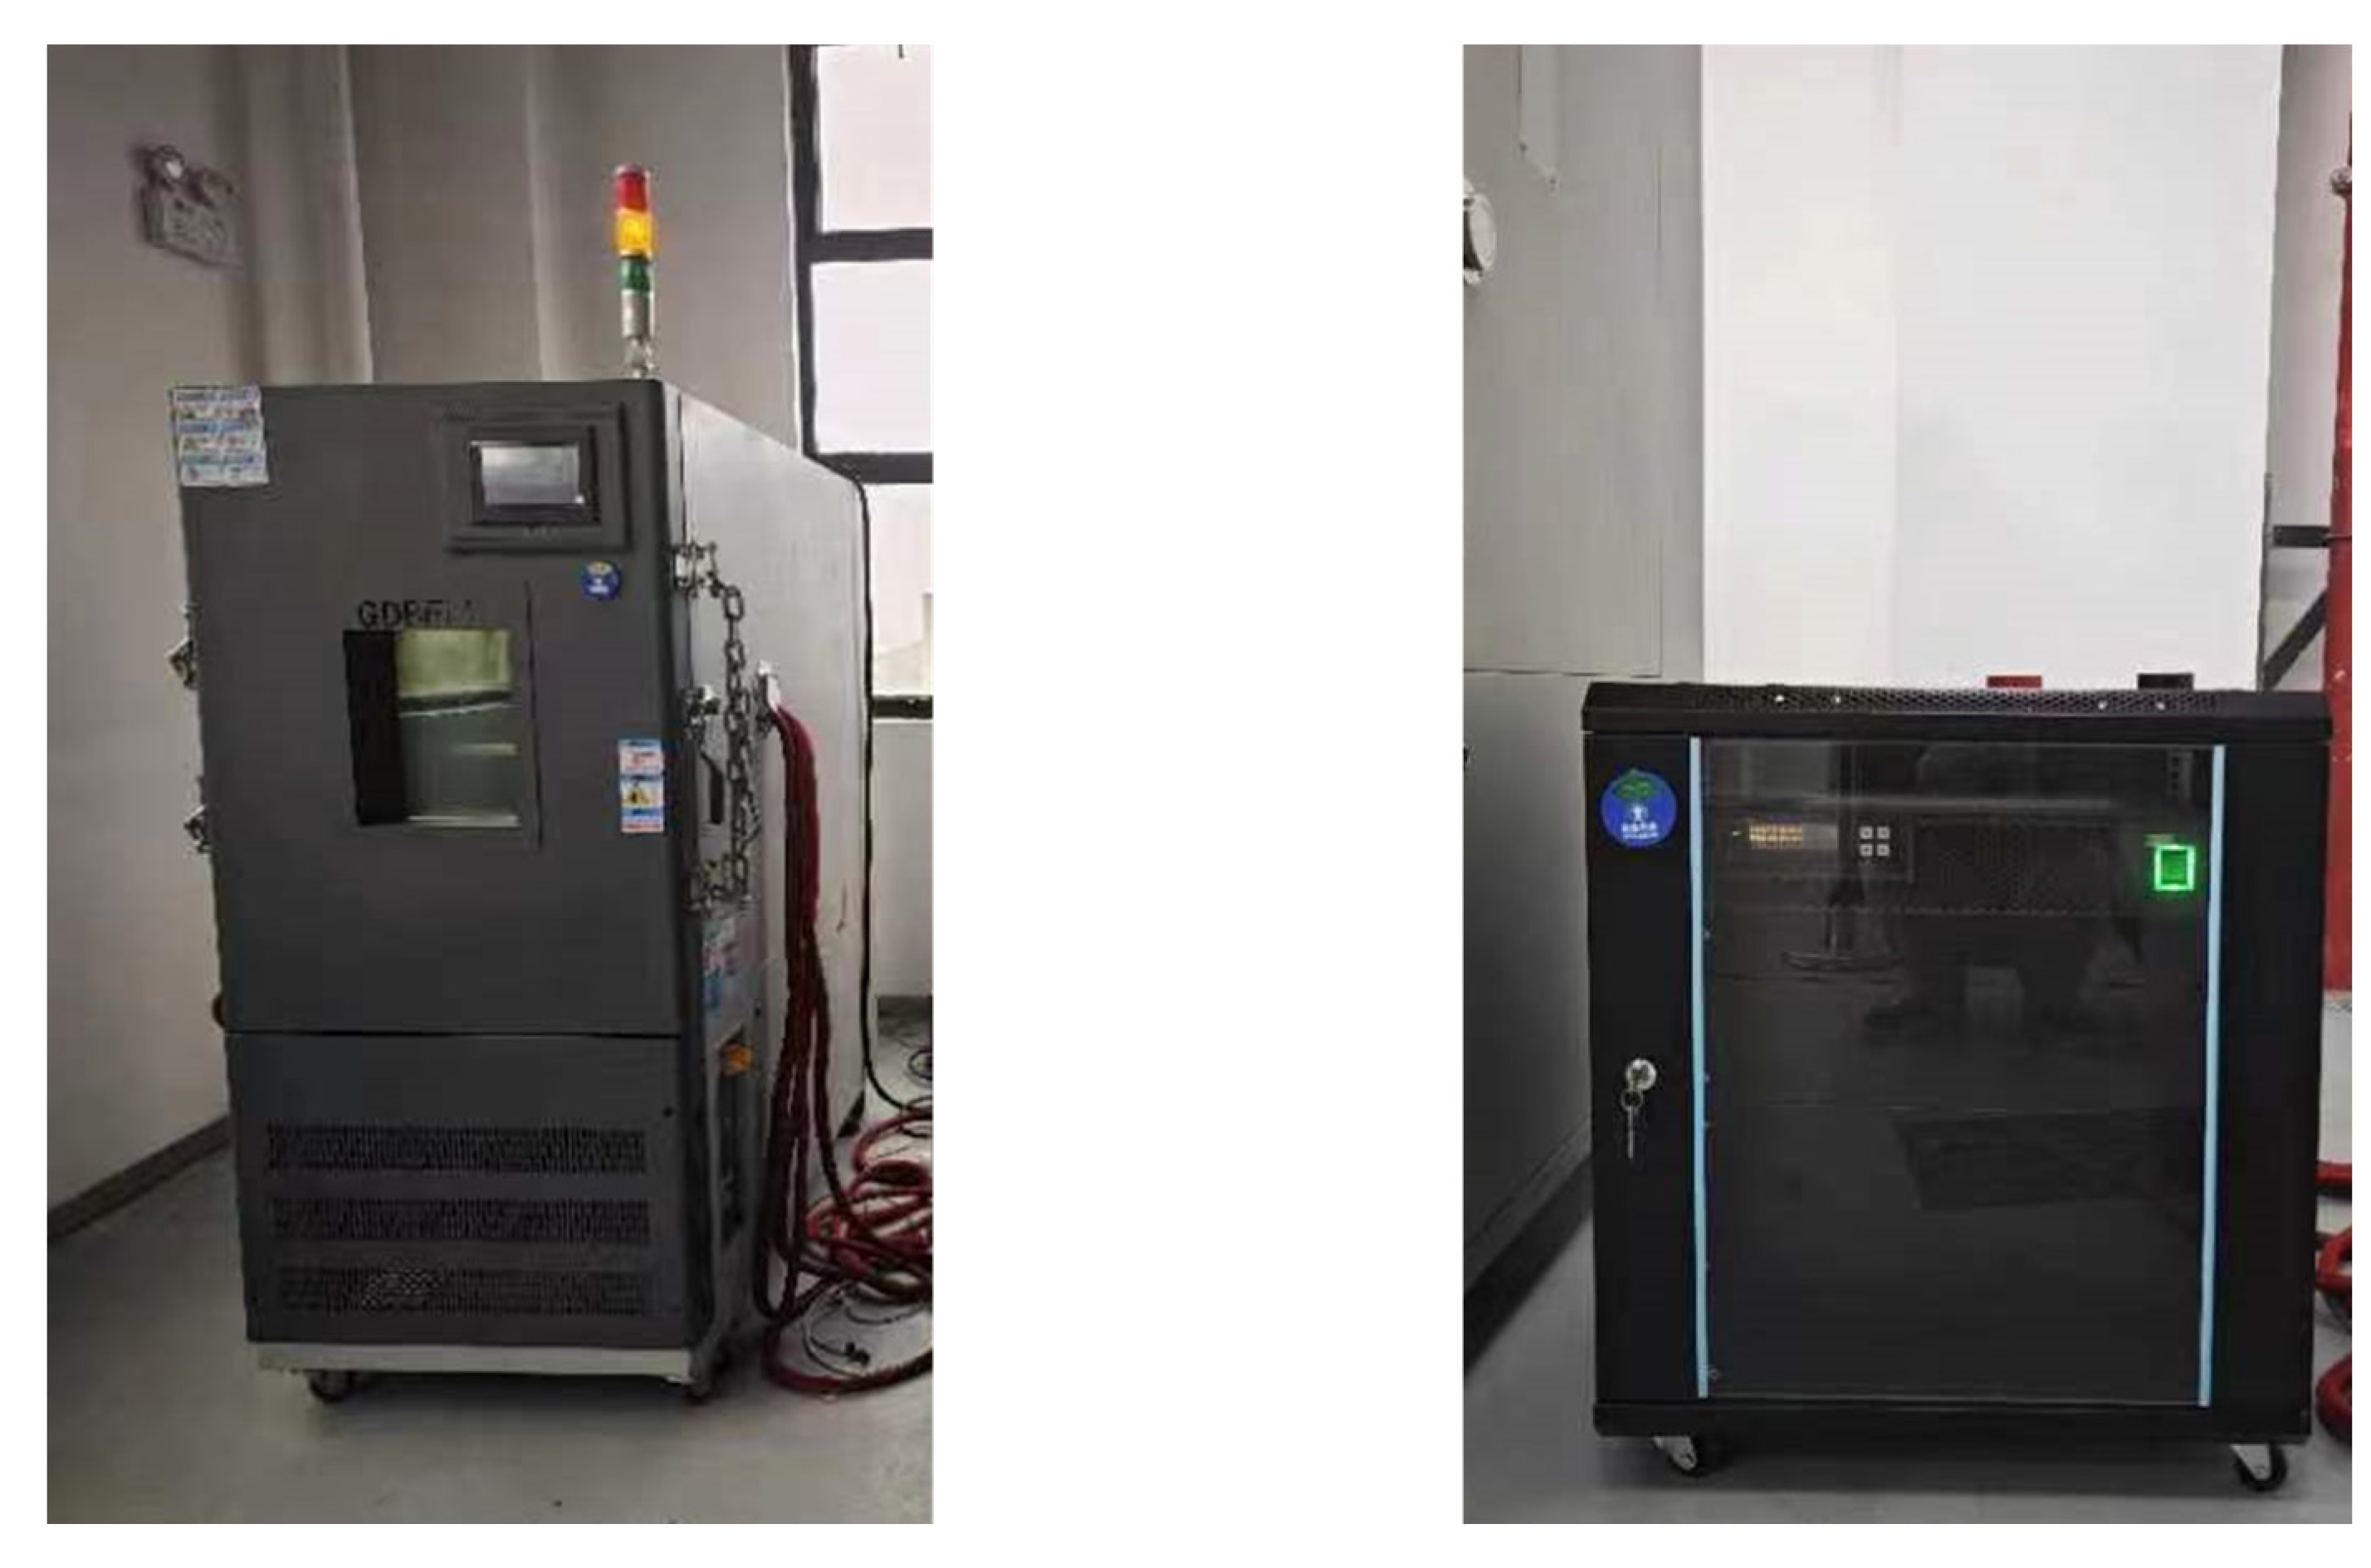
2.3. Experimental Installation

A commercial Li(Ni0.5Co0.2Mn0.3)O2 (NCM523) 153 Ah battery was selected for this study. Before conducting the test, it was necessary to release the energy initially stored in the battery through 1/3C (51A) current until the voltage decreased to 2.7 V. Each battery was placed still for 3 h, then charged to 4.2 V with the same current and circulated three times in the same step to ensure each battery had the same capacity.
Figure 2 depicts the experimental platform and experimental device. All the TR experiments were carried out in an anti-explosion box, as shown in Figure 2a. The equipment used in the experiment includes an elaborate bespoke steel plate fixture, mica plate, ceramic heater, battery, and insulation barrier. Mica plate is an elevated temperature-resistant and heat-insulating material. Its function is to separate the battery from the steel plate fixture to prevent the additional heat loss of the battery, affecting the experimental results. Four fixing bolts are required to fix the whole device and a constant pre-tightening force is loaded on the steel plate. It is necessary to ensure that the same pre-tightening force is loaded in each experiment to decrease the influence on the experiment. In this paper, we select the maximum torque that can be provided by using the torque wrench to apply it to the bolt. The heater is linked to the regulated power supply. After the power supply is turned on, the heater continuously inputs energy into the first battery, causing the battery temperature to rise rapidly, which leads to a short circuit and a series of exothermic reactions, and eventually triggers TR. The heating method is more straightforward than needling and overcharge, and TR can be stably triggered. Furthermore, with more energy input, the TR process is more violent, which can better test the performance of the heat insulation barrier. The trigger is a ceramic heater with 600 W and is turned off after hearing a loud sound. The selection of heater power is shown in Table 2 [11]. A differential scanning calorimeter (DSC) is used to test the latent heat. A butane flame gun is used to test the performance at elevated temperatures. The test method is shown in Figure 2b.
In order to comprehensively explore the influence of thermal barriers in a different area on the TRP process, four groups of comparative tests were set up. The sizes of thermal barrier used are 148 × 98, 128 × 88, and 108 × 78, as shown in Figure 2c. Moreover, the testing configuration and conditions are listed in Table 3.

3. Result

Before analyzing the results, it is necessary to conduct an uncertainty analysis for the experiments. The experimental error is mainly caused by the precision error of the measuring instruments. Table 4 shows the model and accuracy of the equipment used in the experiments. For the instrument error, the thermocouple type we used was OMEGA GG-K-30, with an accuracy of about ±0.5 °C, so there were some errors in temperature measurement. In addition, the heating power may change with the increase in temperature, which is unavoidable.

3.1. Phase Change Properties
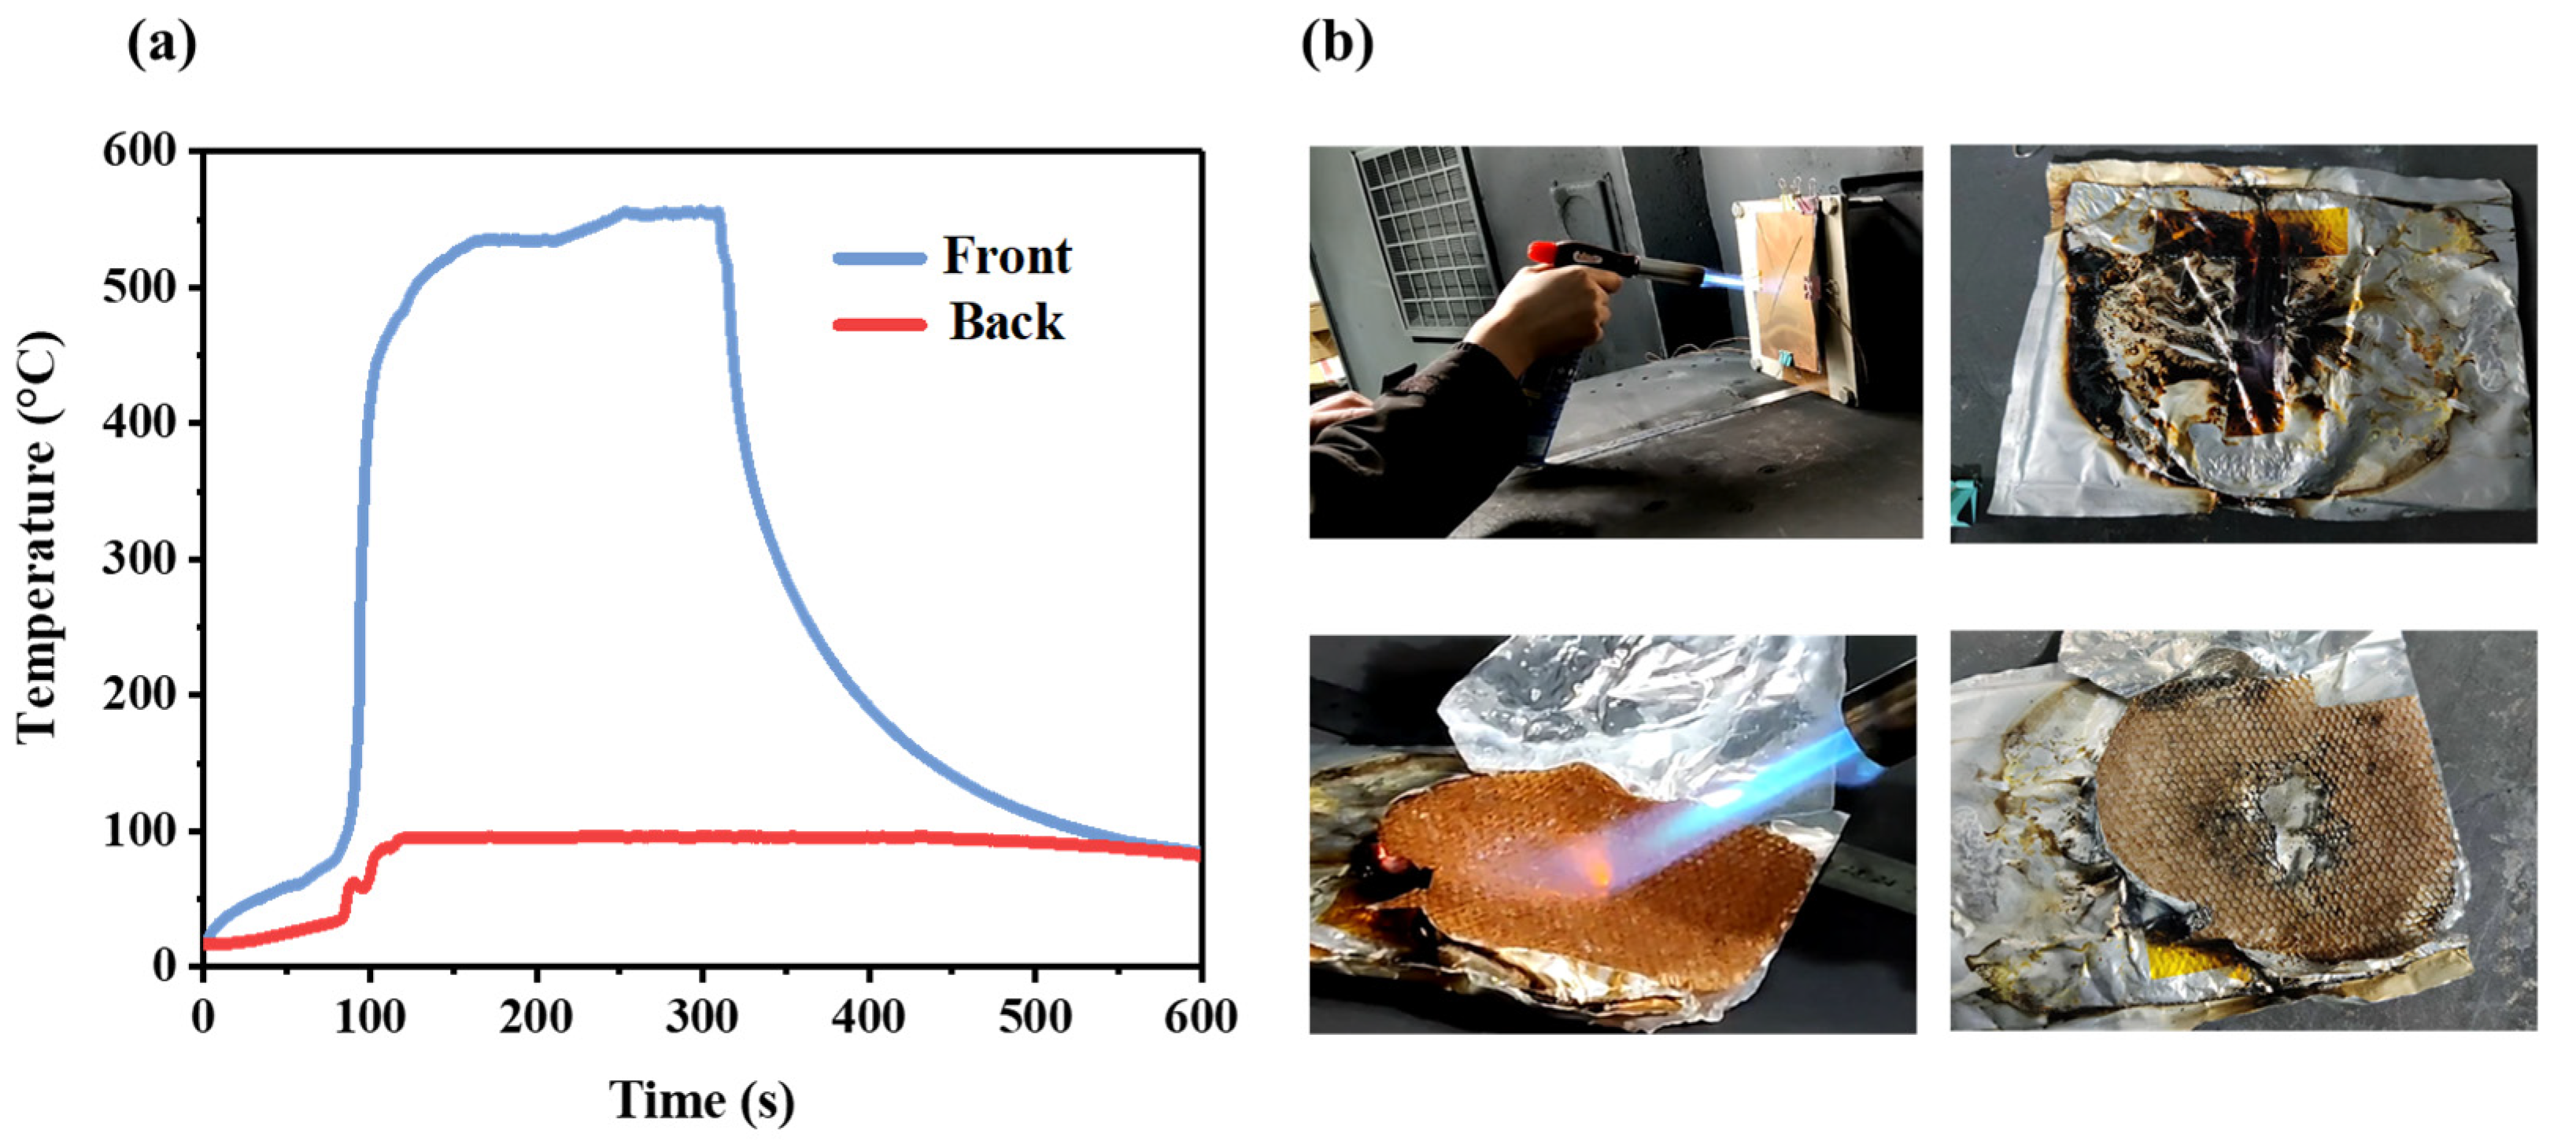
The phase change behaviors of hydrogel with different water absorption ratios are shown in Figure 3. Meanwhile, paraffin is compared with hydrogel in Figure 3a. Compared with paraffin (50–70 °C), the hydrogel has a higher phase change temperature (80–120 °C) and latent heat, which means it could absorb more heat in the process of phase change. Compared with the mixing ratio of 1:75, an increase in the water content could also increase the latent heat. Finally, we chose the water absorption ratio of 1:100 and carried out a repeatability check, as shown in Figure 3b.

3.2. Flame Gun Test

The bottom of the flame gun was 25 mm away from the copper plate, and the gunpoint was tilted to align with the center of the copper plate; the back of the copper plate was an appressed thermal barrier. As shown in Figure 4a, the copper plate was heated for about 5 min, and the front surface of the thermal barrier reached 550 °C, but the rear surface temperature was maintained at 100 °C. Figure 4b shows the experiment process; the aluminum–plastic film was slightly melted, but on the whole, it was still in good condition. In order to observe the appearance of the hydrogel in aramid board after short heating, the aluminum–plastic film on the outer layer was removed. There was no apparent change in aramid fiber and hydrogel. The core material was heated directly with a flame gun and was burned through after about 2 min 2 s.

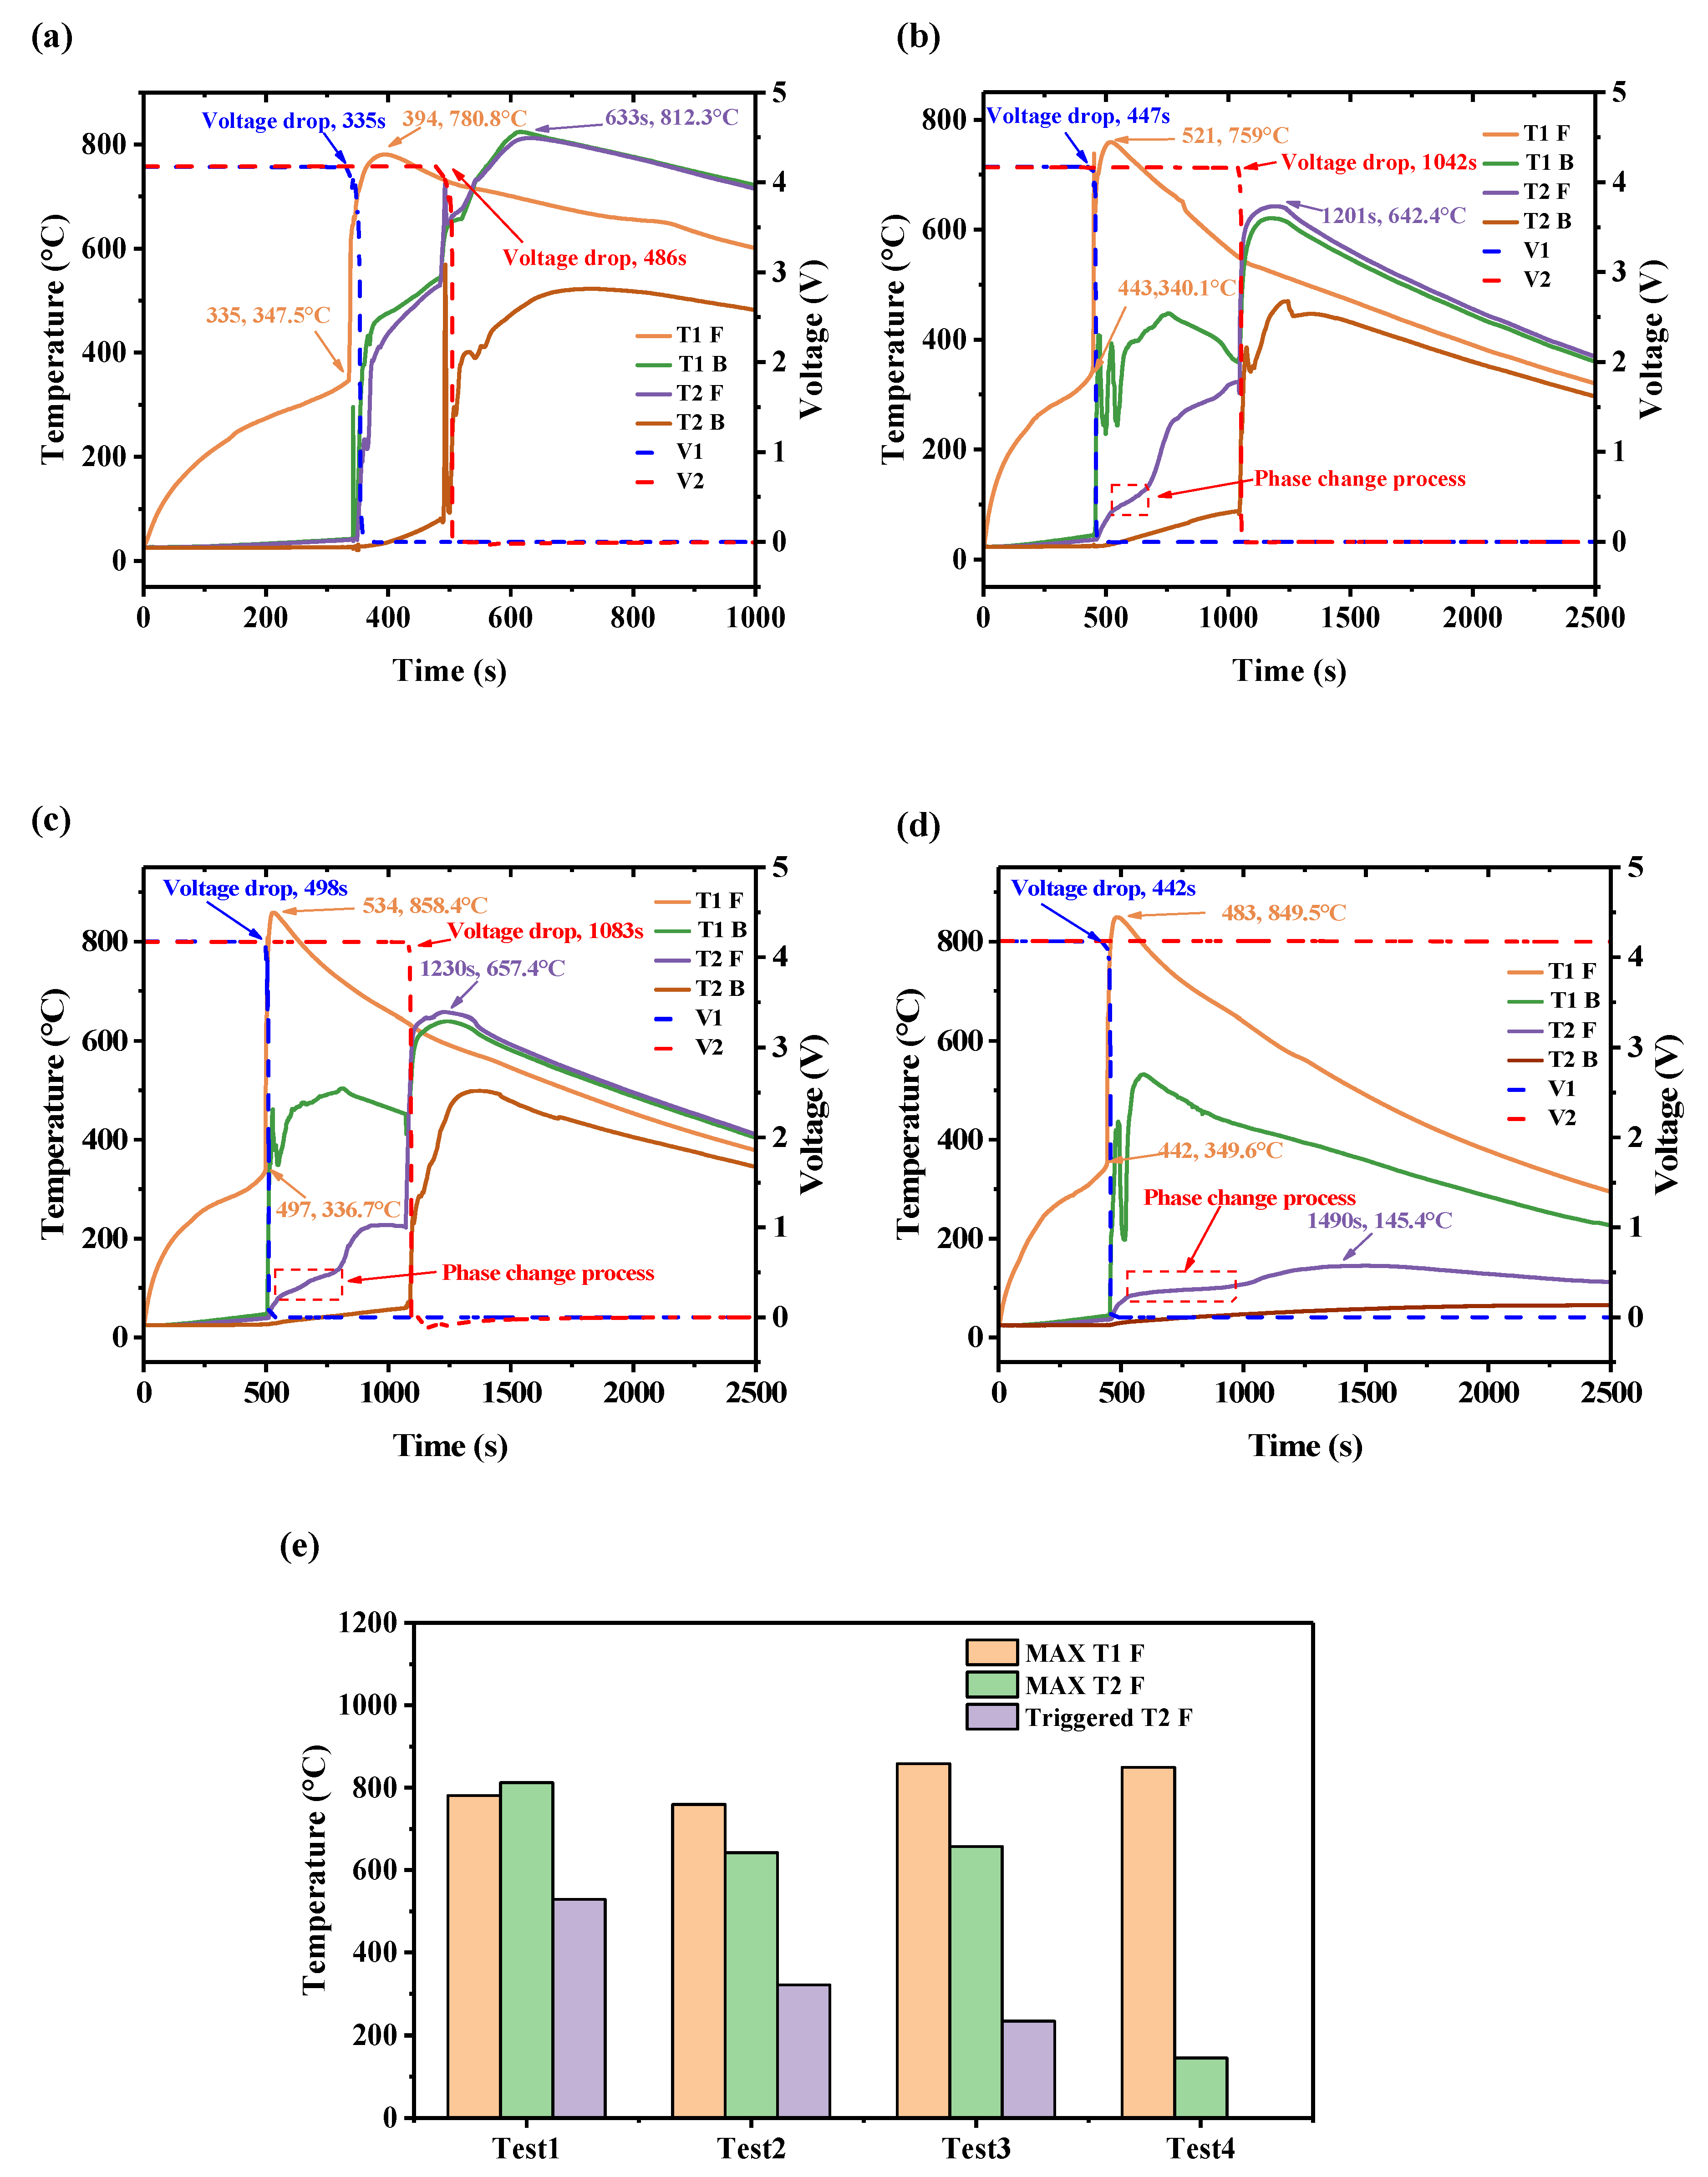
3.3. Temperature and Voltage of Thermal Barriers with Different Areas

The battery temperature and voltage for various areas of thermal barrier are summarized in Figure 5. Figure 5a shows test 1, without a thermal barrier between the cells. Before TR was triggered, the front surface temperature (T1 F) of cell 1 increased rapidly, and the back surface temperature (T1 B) increased slowly. At 335 s, when the T1 F was 347.5 °C, the safety valve opened, accompanied by a loud sound. Meanwhile, a fierce short circuit occurred, which caused the temperature to increase quickly, and the voltage dropped to 0 in seconds, indicating that TR was triggered. Generally, the onset temperature of TR is identified as the temperature with an increase rate higher than 1 °C/s. At 394 s, T1 F reached a peak of 780.8 °C and began to drop due to the residual reactions inside the battery being lower than the heat dissipation rate of the environment. As cell 1 was in direct contact with cell 2, the T2 F increased when TR was triggered for cell 1. At 484 s, when T2 F went to 528.7 °C, the voltage dropped, and TR happened. The temperature increased to 812.3 °C after 149 s and began to decline.
According to the results in Figure 5c,d, the thermal barrier has different temperature characteristics in different coverage areas. In test 2, the area of the thermal barrier is 108 × 88 mm; compared with the time taken to reach thermal runaway propagation without a thermal barrier, the triggering to TR of the second battery in test 2 is delayed by 453 s, and the maximum temperature is reduced by 207.6 °C. After TR was triggered for the first battery, by observing the experiment video corresponding to test 2 and test 3, it was found that there was always a jet fire, so the data monitored by the T1 F thermocouple fluctuated. T2 F had a decrease in the rate of temperature increase for about 140 s during the process of rapid temperature increase before thermal runaway occurred, and this decrease in the rate of temperature increase was caused by the phase change material. In test 3, the second cell was triggered at 1071 s and propagation occurred at 571 s, which is basically the same as test 2. However, it is worth noting that in test 2, when the thermal runaway of cell 2 occurred, the temperature of T2 F was only 223.5 °C. Comparing the temperature of the front surface of the second battery in test 1 and test 2, it was lowered by 295.2 °C and 87.6 °C, respectively. The reason for this extended phase change process is due to the increase in hydrogel content in the thermal barrier. When the insulation material completely covered the surface of the battery, the process of thermal runaway spread was successfully stopped, as shown in the results of test 4, when the amount of hydrogel added was 53.4 g, the whole phase change process lasted 408 s, and the maximum temperature of T2 F was only 154.4 °C. Figure 5e shows the summary of the characteristic temperature comparison of the four groups of tests.

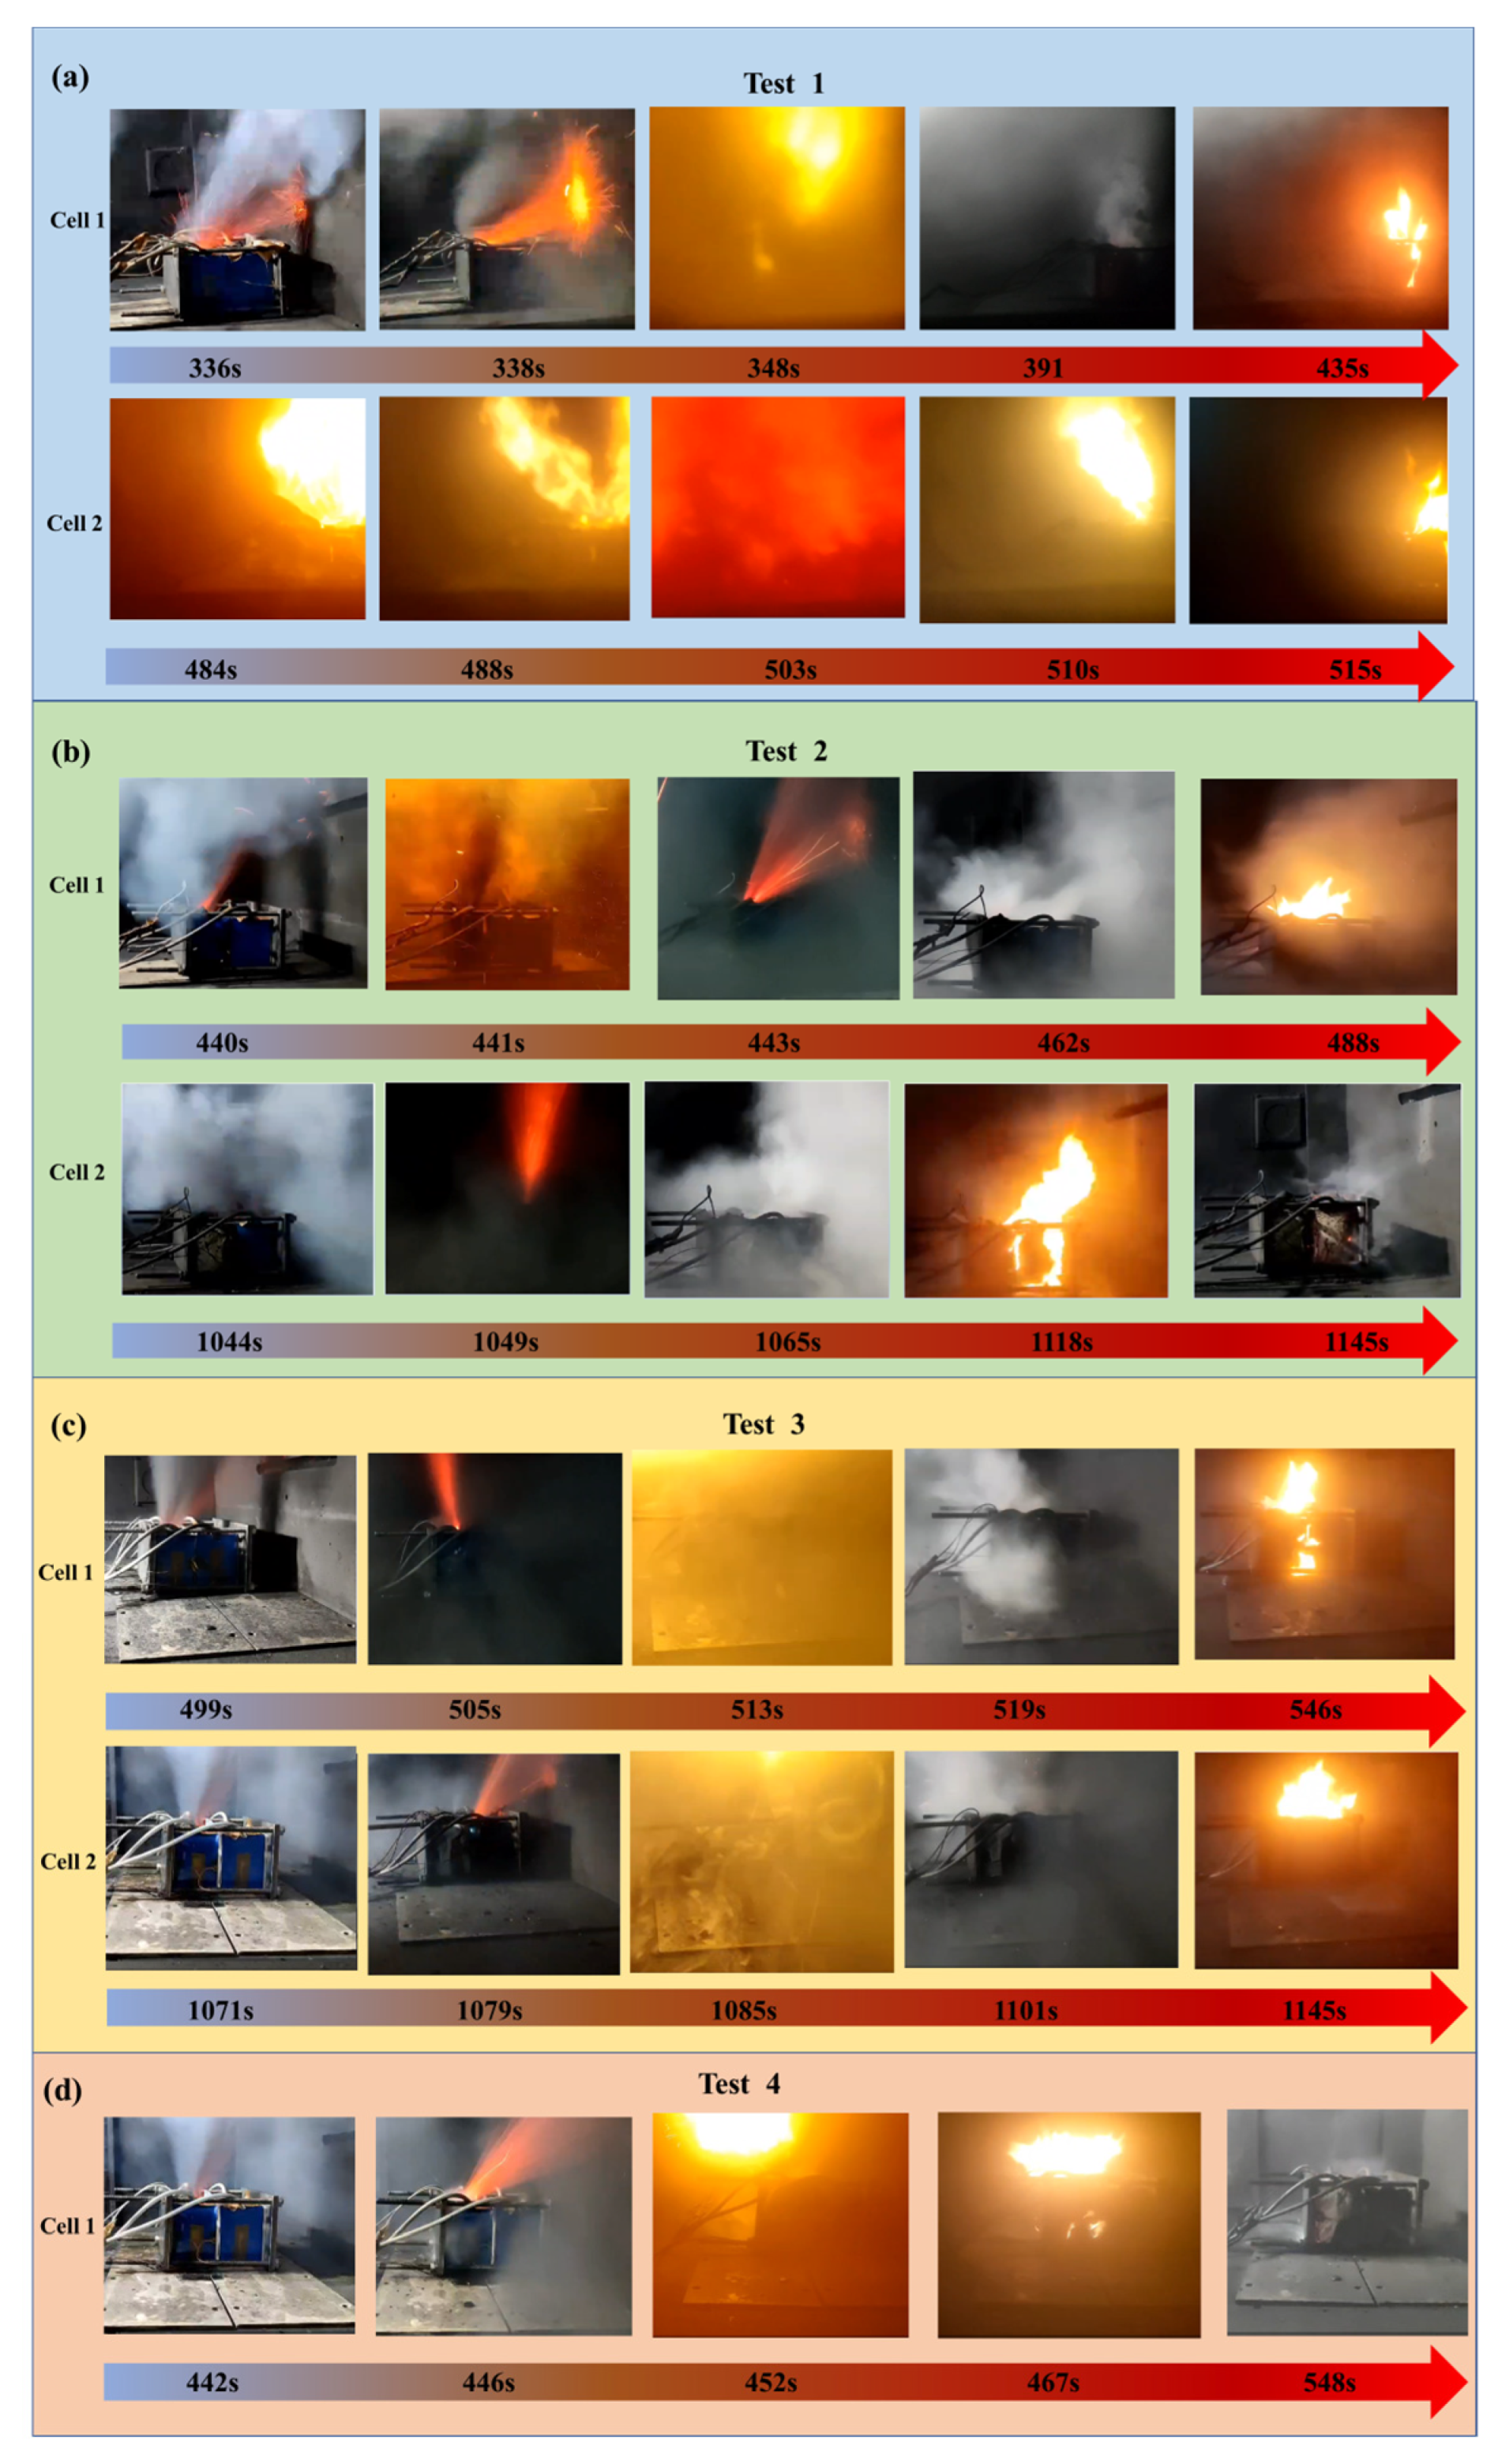
3.4. TR Behavior of Thermal Barriers with Different Areas

Generally speaking, the TR behavior in a single cell is similar. The TR process can be divided into the following stages: (1) heating, (2) jetting, (3) deflagrating, and (4) stable burning. With the continuous input of heater energy, the battery temperature rapidly increased, accompanied by an exothermic chemical reaction. Many electrolytes and high-temperature flammable gases were produced and accumulated continuously inside the shell.
As a consequence, the internal pressure increased until venting occurred. After the safety valve was opened, the flammable gases and electrolytes formed a jet, which reacted with the air and deflagrated after reaching the explosion limit. White smoke was emitted continuously and was ignited after a while, and stable burning occurred. Figure 6 shows the TR behavior for each test. In test 1, the TR process was much more violent than others without a heat barrier between the battery, and the deflagration phenomenon was more serious with increasing duration. TR was quickly triggered for the adjacent cell, and the flammable gas was directly ignited by the flame of cell 1 when venting occurred. The TR processes of batteries with a thermal barrier are similar to those of test 1. The thermal barrier with a 100% insulation area successfully prevented the TRP process. As the mass of hydrogel absorbed heat, the TR process of cell 1 in test 4 was more moderate than the previous tests.

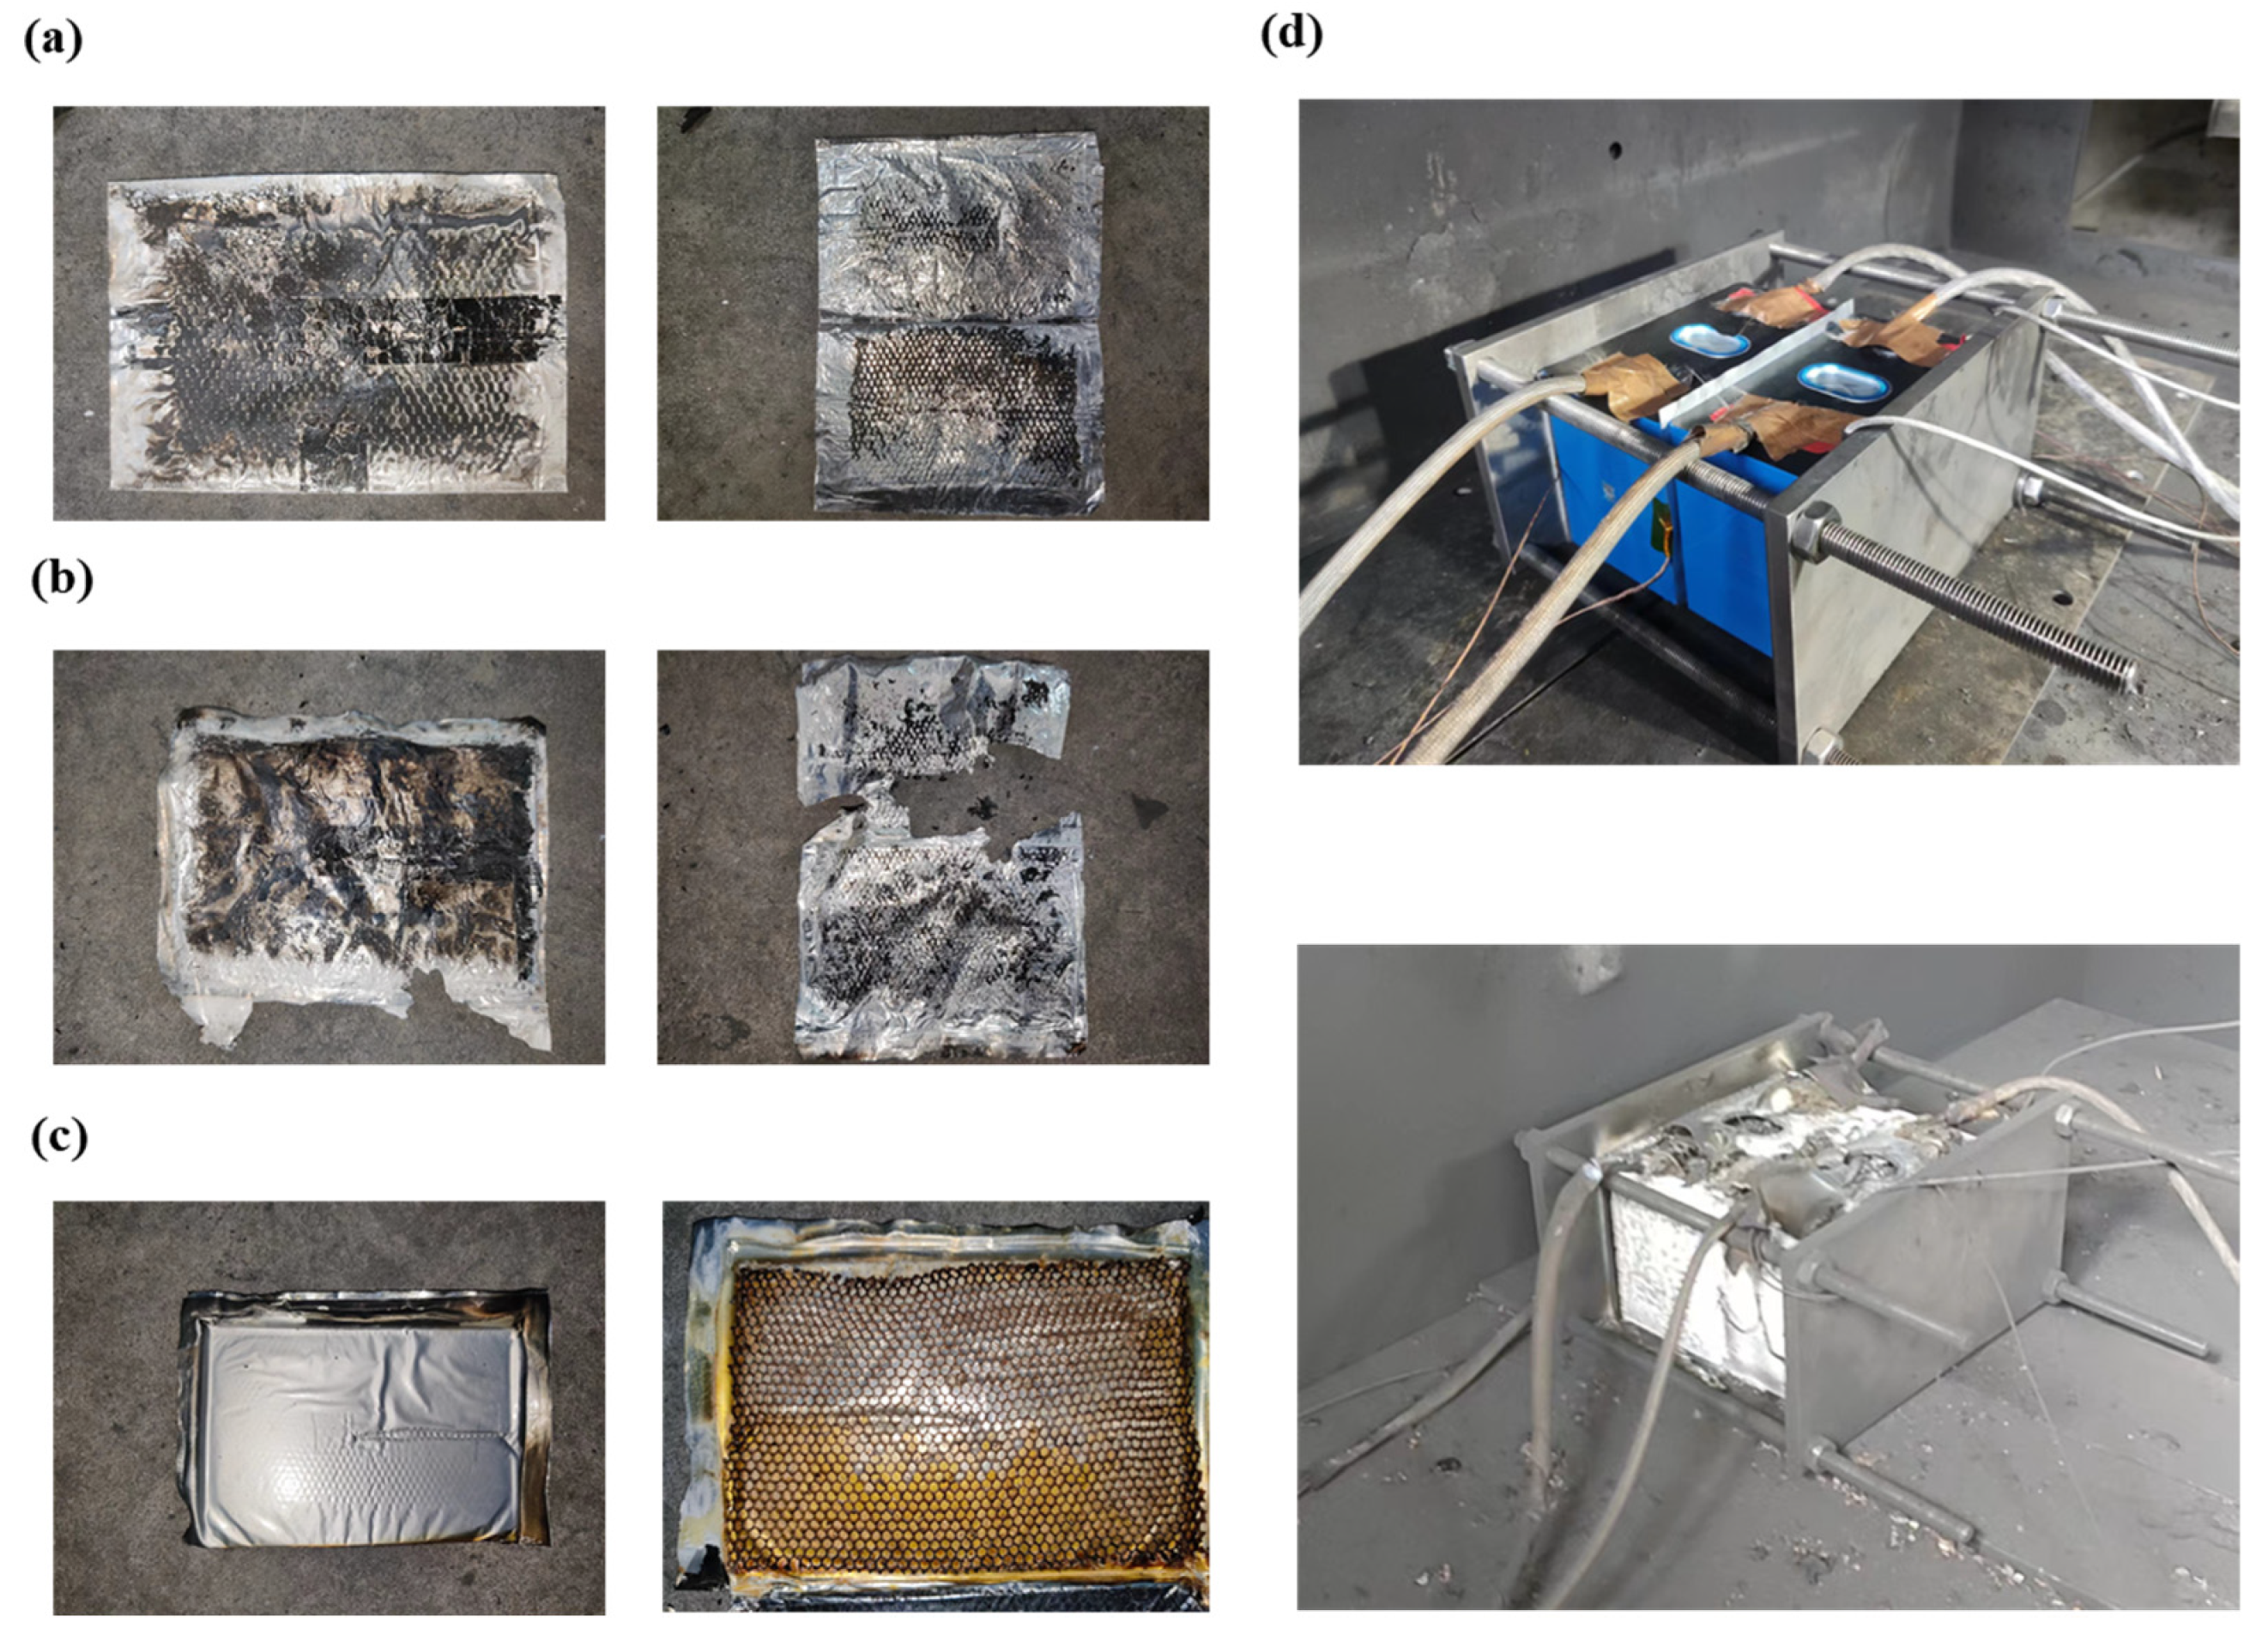
3.5. Wreckage of Thermal Barriers with Different Areas

Observing the wreckage of the thermal barrier after TRP in Figure 7 could provide insights into understanding the thermal barrier. Figure 7a,b depict that the thermal barriers placed in tests 2 and 3 were seriously damaged, and all the hydrogels completed the phase change. Due to the occurrence of TRP, the porous aramid fiber inside the thermal barrier was completely burned at high temperatures. In contrast, in test 4, shown in Figure 7c, the aramid fiber is well preserved, although the hydrogel completes the phase change. After TR, many particles were scattered, including aluminum shells, positive and negative electrodes, and some products after combustion.

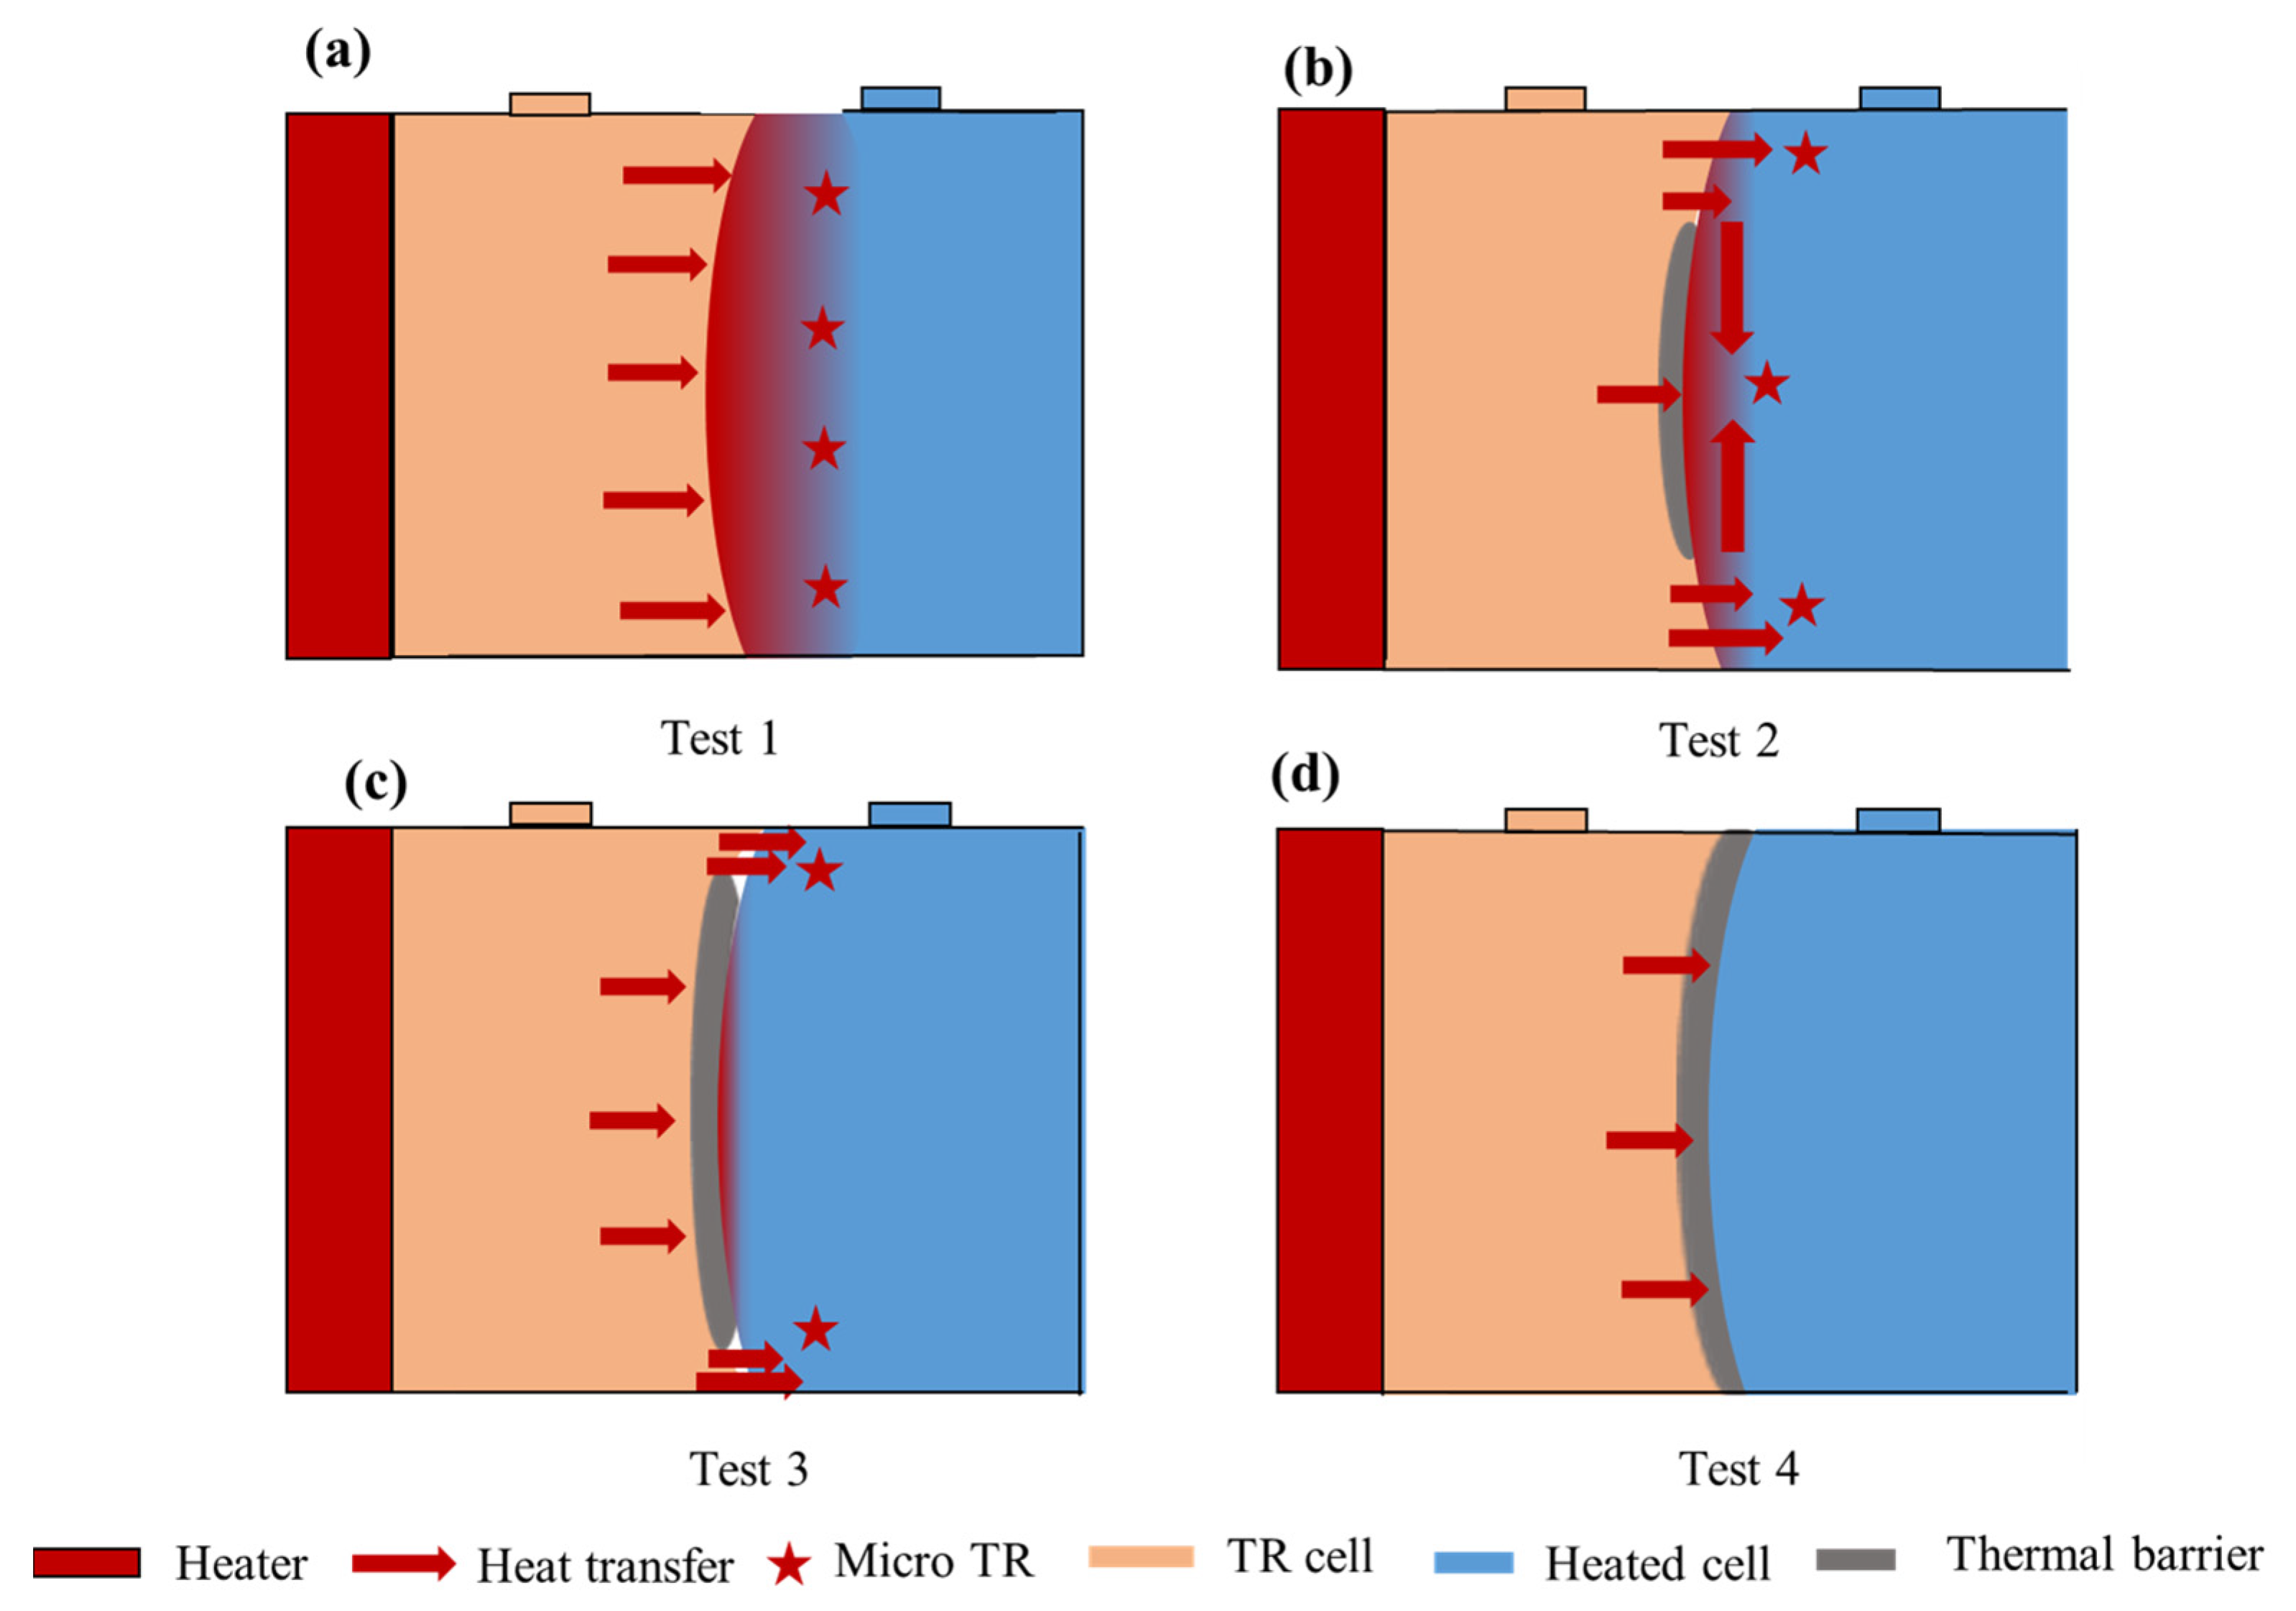
3.6. Heat Transfer Path

As described above, direct contact between batteries will cause rapid TR in adjacent batteries and a more violent TRP process. However, even if the thermal barrier was added in the middle of the cells, the TRP could not be prevented if it is not complete on the surface. Observing the wreckage after TR, the contact surface of cell 1 was compressed, but cell 2 expanded. When cell 1 reached TR, the internal temperature could reach thousands of degrees. The aluminum shell was quickly melted and softened at such a high temperature. At the same time, cell 2 was heated; the increase in internal pressure caused the aluminum shell to expand and squeeze cell 1. As shown in Figure 8, there is no thermal barrier between cells, with the TR cell directly heating the adjacent cell. The wide heating area accelerates the TR of cell 2, and all temperatures on the front surface of the battery were the same. As shown in Figure 8b,c, although a thermal barrier was placed in the middle of the two cells, due to the compression and expansion of the aluminum shell, there was still a slight contact between the upper and down gaps of the aluminum shell, forming a local hot spot. Most T2 F came from the upper and lower contact surfaces. However, when the upper and down contact surfaces reached the TR temperature, a micro-TR was formed locally, thus triggering TR for the whole battery. Therefore, the T2 F of test 2 is slightly lower than that of test 1 with an increase in thermal barrier area, as shown in Figure 8d. The smaller the direct contact area, the less heat is transferred to T2 F from the contact surface, so the lower the T2 F when the micro-TR occurs in cell 2. For test 4, the thermal barrier was placed on the whole battery surface, which prevented local direct contact, completely cut off the heat transfer, and successfully prevented TRP. Figure 9 shows the wreckage of the contact surface of the second battery after each group of experiments. Test 4 successfully prevented the occurrence of TRP, so it is not shown. As shown in Figure 9, (a) is test 1 without a thermal barrier. Due to the concentration of heat in the center of the battery, the central part was seriously damaged and gradually expanded outward, which means that the thermal runaway of the battery starts from the center and gradually extends to the outer ring. However, (b) and (c) with a thermal barrier show contrary results, with the outer part being more damaged than the central part. This means that the thermal runaway of the battery starts from the outside and gradually expands to the center.

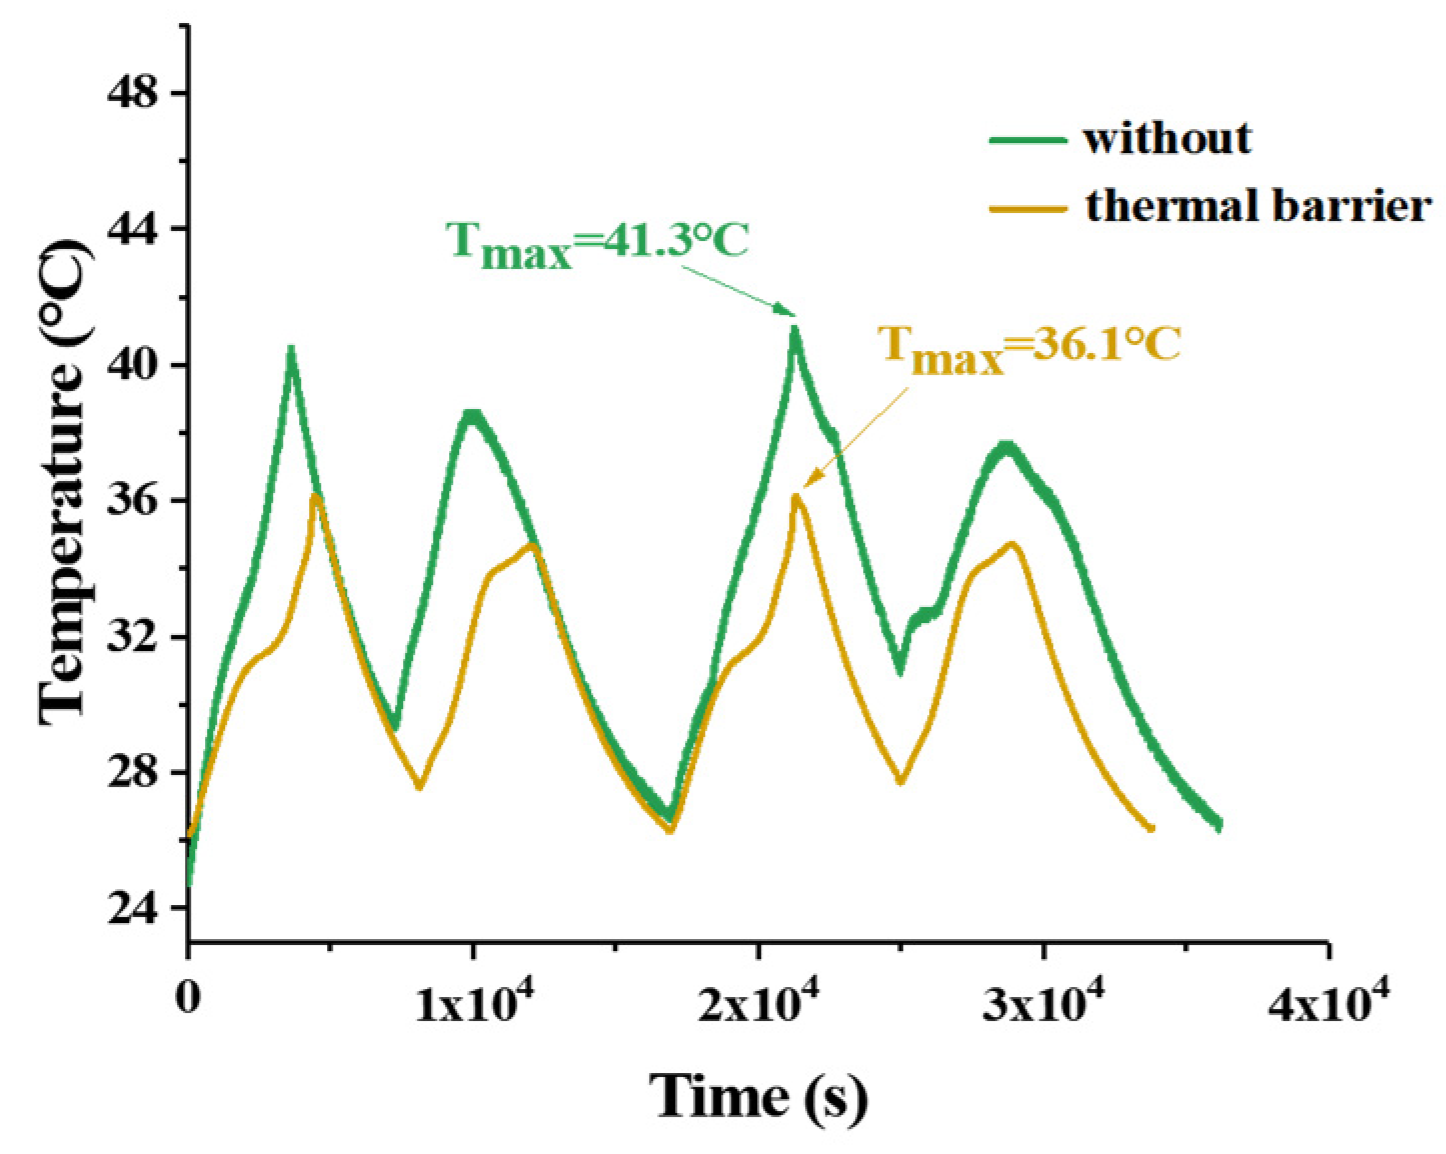
3.7. Temperature Test of Charge–Discharge Cycle

In addition to facing extreme thermal runaway conditions, the thermal barrier also needs to solve the problem of excessive temperature under fast charging conditions. Therefore, a new experiment was designed to verify the cooling effect of the thermal barrier. The thermal barrier was placed between two batteries, the batteries were charged and discharged with a circulating current of 100 A, and the batteries were cooled by standing for 30 min at the intervals of each working cycle. The maximum charging current of the equipment we used was 100 A. At the same time, for the sake of safety, excessive current can lead to a high temperature, which will cause safety accidents. Therefore, we fixed the battery with the same fixture as before, and placed the fixture in the thermostat. We set a constant temperature of 25 °C, and let the battery stand for 6 h to ensure that the temperature of the battery was consistent with the thermostat. Figure 10 shows the equipment used in the charge–discharge cycle.
The temperature of the battery at a charging current of 100 A is shown in Figure 11. In the process of charging and discharging, the temperature rise can be clearly observed, and the temperature rise in the charging stage is obviously higher than that in the discharging stage. During the cycle, the maximum temperature can reach 41.3 °C without a thermal barrier between the batteries, but it can reduce to 36.1 °C if a thermal barrier is set.

4. Conclusions

This paper presents a comprehensive investigation of the thermal abuse characteristics of LIB thermal barriers with different areas. All of the critical parameters, including the temperature, voltage, TR behavior, and heat transfer path, were measured and analyzed. This investigation can provide deep insights into the TRP mechanism of thermal barriers and provide guidance for the safety design of battery modules, preventing propagation among batteries. The following conclusions can be drawn:
(1)
Hydrogel was synthesized with sodium polyacrylate as the base material, and the thermal barrier was obtained by adding this base material to aramid fiber.
(2)
Hydrogels with different water absorption ratios were compared. Hydrogels with higher water absorption had a higher phase change temperature and longer phase change interval.
(3)
The thermal barrier had a significant impact on the TRP behavior. A thermal barrier with complete area coverage prevents TRP, whereas a thermal barrier with gaps can prolong the propagation time, but it cannot wholly prevent TRP. The thermal barrier with smaller area coverage fails to prevent TRP.
(4)
The battery deforms during the TRP process, opposite to the propagation direction.
(5)
The thermal barrier can not only solve the problem of the TRP of battery heat, but can also reduce the temperature of the battery during charging and discharging.
Based on the above conclusions, TRP prevention can be achieved with the complete coverage of the battery surface area while using a thermal barrier to prevent TRP.

Author Contributions

Conceptualization, J.S. and K.S.; methodology, C.X. and S.K.W.; validation, J.S. and K.S.; formal analysis, C.J.; investigation, H.W.; resources, X.F. and C.X.; writing—original draft preparation, J.S.; writing—review and editing, X.F.; visualization, J.S. and S.C.; supervision and project administration, X.F. and Y.Z.; funding acquisition, K.S. and X.F. All authors have read and agreed to the published version of the manuscript..

Funding

This research is supported National Natural Science Foundation of China (NSFC) under the Grant number of 52277222, 52277223, 52076121; Shanghai Science and Technology Development Fund 22ZR1444500.

Data Availability Statement

Not applicable.

Conflicts of Interest

The authors declare that they have no known competing financial interests or personal relationships that could have appeared to influence the work reported in this paper.

References

  1. Yu, W.; Guo, Y.; Shang, Z.; Zhang, Y.; Xu, S. A review on comprehensive recycling of spent power lithium-ion battery in China. eTransportation 2022, 11, 100155. [Google Scholar] [CrossRef]
  2. Hu, G.; Huang, P.; Bai, Z.; Wang, Q.; Qi, K. Comprehensively analysis the failure evolution and safety evaluation of automotive lithium ion battery. eTransportation 2021, 10, 100140. [Google Scholar] [CrossRef]
  3. Han, X.; Lu, L.; Zheng, Y.; Feng, X.; Li, Z.; Li, J.; Ouyang, M. A review on the key issues of the lithium ion battery degradation among the whole life cycle. eTransportation 2019, 1, 100005. [Google Scholar] [CrossRef]
  4. Chen, S.; Wei, X.; Garg, A.; Gao, L. A comprehensive flow rate optimization design for a novel air-liquid cooling coupled battery thermal management system. J. Electrochem. Energy Convers. Storage 2020, 18, 1–16. [Google Scholar] [CrossRef]
  5. Chen, S.; Zhang, G.; Zhu, J.; Feng, X.; Wei, X.; Ouyang, M.; Dai, H. Multi-objective optimization design and experimental investigation for a parallel liquid cooling-based Lithium-ion battery module under fast charging. Appl. Therm. Eng. 2022, 211, 118503. [Google Scholar] [CrossRef]
  6. Feng, X.; Zheng, S.; Ren, D.; He, X.; Wang, L.; Liu, X.; Li, M.; Ouyang, M. Key Characteristics for Thermal Runaway of Li-ion Batteries. Energy Procedia 2019, 158, 4684–4689. [Google Scholar] [CrossRef]
  7. Report on the Accident of Battery Thermal Runaway. Available online: https://chuneng.bjx.com.cn/news/20220315/1210164.shtml (accessed on 16 October 2022).
  8. Feng, X.; Ren, D.; He, X.; Ouyang, M. Mitigating Thermal Runaway of Lithium-Ion Batteries. Joule 2020, 4, 743–770. [Google Scholar] [CrossRef]
  9. Chen, S.; Zhang, G.; Wu, C.; Huang, W.; Xu, C.; Jin, C.; Wu, Y.; Jiang, Z.; Dai, H.; Feng, X.; et al. Multi-objective optimization design for a double-direction liquid heating system-based Cell-to-Chassis battery module. Int. J. Heat Mass Transf. 2021, 183, 122184. [Google Scholar] [CrossRef]
  10. Lai, X.; Jin, C.; Yi, W.; Han, X.; Feng, X.; Zheng, Y.; Ouyang, M. Mechanism, modeling, detection, and prevention of the internal short circuit in lithium-ion batteries: Recent advances and perspectives. Energy Storage Mater. 2020, 35, 470–499. [Google Scholar] [CrossRef]
  11. Jin, C.; Sun, Y.; Wang, H.; Lai, X.; Wang, S.; Chen, S.; Rui, X.; Zheng, Y.; Feng, X.; Wang, H.; et al. Model and experiments to investigate thermal runaway characterization of lithium-ion batteries induced by external heating method. J. Power Sources 2021, 504, 230065. [Google Scholar] [CrossRef]
  12. Jin, C.; Sun, Y.; Wang, H.; Zheng, Y.; Wang, S.; Rui, X.; Xu, C.; Feng, X.; Wang, H.; Ouyang, M. Heating power and heating energy effect on the thermal runaway propagation characteristics of lithium-ion battery module: Experiments and modeling. Appl. Energy 2022, 312, 11876. [Google Scholar] [CrossRef]
  13. Ren, D.; Hsu, H.; Li, R.; Feng, X.; Guo, D.; Han, X.; Lu, L.; He, X.; Gao, S.; Hou, J.; et al. A comparative investigation of aging effects on thermal runaway behavior of lithium-ion batteries. eTransportation 2019, 2, 100034. [Google Scholar] [CrossRef]
  14. Yin, H.; Ma, S.; Li, H.; Wen, G.; Santhanagopalan, S.; Zhang, C. Modeling strategy for progressive failure prediction in lithium-ion batteries under mechanical abuse. eTransportation 2020, 7, 100098. [Google Scholar] [CrossRef]
  15. Wang, H.; Xu, H.; Zhao, Z.; Wang, Q.; Jin, C.; Li, Y.; Sheng, J.; Li, K.; Du, Z.; Xu, C.; et al. An experimental analysis on thermal runaway and its propagation in Cell-to-Pack lithium-ion batteries. Appl. Therm. Eng. 2022, 211, 118418. [Google Scholar] [CrossRef]
  16. Peralta, D.; Salomon, J.; Reynier, Y.; Martin, J.-F.; De Vito, E.; Colin, J.-F.; Boulineau, A.; Bourbon, C.; Amestoy, B.; Tisseraud, C.; et al. Influence of Al and F surface modifications on the sudden death effect of Si-Gr/Li1.2Ni0.2Mn0.6O2 Li-Ion cells. Electrochim. Acta 2021, 400, 139419. [Google Scholar] [CrossRef]
  17. Spotnitz, R.; Franklin, J. Abuse behavior of high-power, lithium-ion cells. J. Power Sources 2003, 113, 81–100. [Google Scholar] [CrossRef]
  18. Wu, H.; Chen, S.; Chen, J.; Jin, C.; Xu, C.; Rui, X.; Hsu, H.; Zheng, Y.; Feng, X. Dimensionless normalized concentration based thermal-electric regression model for the thermal runaway of lithium-ion batteries. J. Power Sources 2022, 521, 230958. [Google Scholar] [CrossRef]
  19. Jones, C.; Li, B.; Tomar, V. Determining the effects of non-catastrophic nail puncture on the operational performance and service life of small soft case commercial Li-ion prismatic cells. eTransportation 2021, 8, 100109. [Google Scholar] [CrossRef]
  20. Wang, Y.; Luo, J.; Wang, S.; Ma, Q.; Zou, D. Shape-stabilized phase change material with internal coolant channel coupled with phase change emulsion for power battery thermal management. Chem. Eng. J. 2022, 438, 135648. [Google Scholar] [CrossRef]
  21. Rajan, J.T.; Jayapal, V.S.; Krishna, M.; Firose, K.M.; Vaisakh, S.; John, A.K.; Suryan, A. Analysis of Battery Thermal Management System for Electric Vehicles using 1-Tetradecanol Phase Change Material. Sustain. Energy Technol. Assess. 2022, 51, 101943. [Google Scholar] [CrossRef]
  22. Sun, M.; Liu, T.; Li, M.; Tan, J.; Tian, P.; Wang, H.; Chen, G.; Jiang, D.; Liu, X. A deep supercooling eutectic phase change material for low-temperature battery thermal management. J. Energy Storage 2022, 50, 104240. [Google Scholar] [CrossRef]
  23. Peng, P.; Wang, Y.; Jiang, F. Numerical study of PCM thermal behavior of a novel PCM-heat pipe combined system for Li-ion battery thermal management. Appl. Therm. Eng. 2022, 209, 118293. [Google Scholar] [CrossRef]
  24. Huang, Q.; Li, X.; Zhang, G.; Kan, Y.; Li, C.; Deng, J.; Wang, C. Flexible composite phase change material with anti-leakage and anti-vibration properties for battery thermal management. Appl. Energy 2022, 309, 118434. [Google Scholar] [CrossRef]
  25. Chen, S.; Garg, A.; Gao, L.; Wei, X. An experimental investigation for a hybrid phase change material-liquid cooling strategy to achieve high-temperature uniformity of Li-ion battery module under fast charging. Int. J. Energy Res. 2020, 45, 6198–6212. [Google Scholar] [CrossRef]
  26. Kshetrimayum, K.S.; Yoon, Y.-G.; Gye, H.-R.; Lee, C.-J. Preventing heat propagation and thermal runaway in electric vehicle battery modules using integrated PCM and micro-channel plate cooling system. Appl. Therm. Eng. 2019, 159, 113797. [Google Scholar] [CrossRef]
  27. Niu, J.; Deng, S.; Gao, X.; Niu, H.; Fang, Y.; Zhang, Z. Experimental study on low thermal conductive and flame retardant phase change composite material for mitigating battery thermal runaway propagation. J. Energy Storage 2021, 47, 103557. [Google Scholar] [CrossRef]
  28. Weng, J.; Xiao, C.; Ouyang, D.; Yang, X.; Chen, M.; Zhang, G.; Yuen, R.K.K.; Wang, J. Mitigation effects on thermal runaway propagation of structure-enhanced phase change material modules with flame retardant additives. Energy 2021, 239, 122087. [Google Scholar] [CrossRef]
  29. Li, L.; Xu, C.; Chang, R.; Yang, C.; Jia, C.; Wang, L.; Song, J.; Li, Z.; Zhang, F.; Fang, B.; et al. Thermal-responsive, super-strong, ultrathin firewalls for quenching thermal runaway in high-energy battery modules. Energy Storage Mater. 2021, 40, 329–336. [Google Scholar] [CrossRef]
  30. Yuan, S.; Chang, C.; Yan, S.; Zhou, P.; Qian, X.; Yuan, M.; Liu, K. A review of fire-extinguishing agent on suppressing lithium-ion batteries fire. J. Energy Chem. 2021, 62, 262–280. [Google Scholar] [CrossRef]
  31. Yang, X.; Duan, Y.; Feng, X.; Chen, T.; Xu, C.; Rui, X.; Ouyang, M.; Lu, L.; Han, X.; Ren, D.; et al. An Experimental Study on Preventing Thermal Runaway Propagation in Lithium-Ion Battery Module Using Aerogel and Liquid Cooling Plate Together. Fire Technol. 2020, 56, 2579–2602. [Google Scholar] [CrossRef]
  32. D Becher, M.; Bauer, H.; Döring, O.; Böse, B.; Friess, M.A. Danzer, Preventing thermal propagation in battery packs using enthalpy supported thermal barriers. J. Energy Storage 2021, 42, 103057. [Google Scholar] [CrossRef]
  33. Fregolente, L.V.; Gonçalves, H.L.; Fregolente, P.B.L.; Maciel, M.R.W.; Soares, J.B. Sodium polyacrylate hydrogel fixed bed to treat Water-Contaminated cloudy diesel. Fuel 2023, 332, 125953. [Google Scholar] [CrossRef]
Figure 1. Spatial structure of materials. (a) Synthesis of sodium polyacrylate. (b) Formation principle of hydrogel [33].
Batteries 09 00206 g001
Figure 2. Schematic of the experimental setup: (a) thermal runaway platform and thermocouple; (b) testing equipment for PCM; and (c) different areas of thermal barrier.
Batteries 09 00206 g002
Figure 3. DSC test of hydrogel: (a) hydrogel compared with paraffin; (b) repeatability check.
Batteries 09 00206 g003
Figure 4. Flame gun test of thermal barrier: (a) variations in temperature; (b) process of the experiment.
Batteries 09 00206 g004
Figure 5. The variation in the temperature and voltage of the TR process: (a) test 1; (b) test 2; (c) test 3; (d); test 4; and (e) characteristic temperature of each test.
Batteries 09 00206 g005
Figure 6. TR behavior of thermal barriers with different areas: (a) test 1; (b) test 2; (c) test 3; and (d) test 4.
Batteries 09 00206 g006
Figure 7. Wreckage after thermal runaway. (a) Thermal barrier of test 2; (b) thermal barrier of test 3; (c) thermal barrier of test 4; and (d) battery before and after TRP.
Batteries 09 00206 g007
Figure 8. Heat transfer path: (a) test 1; (b) test 2; (c) test 3; and (d) test 4.
Batteries 09 00206 g008
Figure 9. Battery wreckage: (a) test 1; (b) test 2; and (c) test 3. (d) Photos of battery surface after TR.
Batteries 09 00206 g009
Figure 10. Equipment temperature cycle test.
Batteries 09 00206 g010
Figure 11. Temperature of the battery at a 100 A charging current.
Batteries 09 00206 g011
Table 1. Commonly used protection schemes.
Protection SchemeBatteryMaximum TemperatureDrop Rate
Aerogel [27]Prism cell691 °C0.4 °C/s
Extinguishant [30]18650840 °C0.4 °Cs
Liquid-cooling plate [31]Prism cell563.3 °C0.3 °C/s
Table 2. The heating power selection for the heater in GB 38031.
Title 1Title 2
Energy of the triggered battery: E (W∙h)Heating power: P (W)
E < 10030~300
100 ≤ E ≤ 400300~1000
400 ≤ E ≤ 800300~2000
Table 3. Different areas of thermal barrier.
ExperimentSize of Thermal Barrier (mm)Area of Thermal Barrier (mm2)Percentage of Covered Surface
NO.1000%
NO.2108 × 78842458.1%
NO.3128 × 8811,20477.2%
NO.4148 × 9814,504100%
Table 4. Equipment models used in the experiment.
DeviceProduct ModelMeasuring RangeAccuracy
ThermocouplesETA GG-K-300~1250 °C±0.5 °C
Data acquisitionHIOKI_LR 8410−200~2000 °C±1.5 °C
Battery test cyclerNEWARE CT-4016-5 V 100 A0.025~5 VBattery test cycler
HeaterCeramic heater220 V 600 W±5%
Disclaimer/Publisher’s Note: The statements, opinions and data contained in all publications are solely those of the individual author(s) and contributor(s) and not of MDPI and/or the editor(s). MDPI and/or the editor(s) disclaim responsibility for any injury to people or property resulting from any ideas, methods, instructions or products referred to in the content.

