Article

SOC Estimation Based on Combination of Electrochemical and External Characteristics for Hybrid Lithium-Ion Capacitors

1
Huadian Electric Power Research Institute Co., Ltd., Hangzhou 310030, China
2
School of Electronics and Information Engineering, Tongji University, Shanghai 201804, China
3
Clean Energy Automotive Engineering Centre, Tongji University, Shanghai 201804, China
4
School of Automotive Studies, Tongji University, Shanghai 201804, China
*
Authors to whom correspondence should be addressed.
Batteries 2023, 9(3), 163; https://doi.org/10.3390/batteries9030163
Submission received: 17 December 2022 / Revised: 18 February 2023 / Accepted: 4 March 2023 / Published: 9 March 2023

Abstract

:
Hybrid lithium-ion capacitors (HyLICs) have received considerable attention because of their ability to combine the advantages of high-energy lithium-ion batteries and high-power supercapacitors. State of charge (SOC) is the main factor affecting the practical application of HyLICs; therefore, it is essential to estimate the SOC accurately. In this paper, a partition SOC-estimation method that combines electrochemical and external characteristics is proposed. The discharge process of the HyLICs was divided into three phases based on test results of electrochemical characteristics. To improve the estimation accuracy and reduce the amount of calculation, the Extended Kalman Filter (EKF) method was applied for SOC estimation at the interval where the capacitor energy storage characteristics dominated, and the Ampere-hour (Ah) method was used to estimate the SOC at the interval where battery energy storage characteristics dominated. The proposed method is verified under different operating conditions. The experimental results show good agreement with the estimation results, which indicates that the proposed method can estimate the SOC of the HyLICs accurately.

1. Introduction

Hybrid Lithium ion Capacitors (HyLICs) are a new type of devices combined with the battery-type negative electrodes and capacitor-type positive electrodes [1,2,3]. HyLICs have the characteristics of traditional lithium-ion batteries and supercapacitors [4]. State of charge (SOC) is a significant parameter that indicates the level of charge in the HyLICs [5,6]. However, the SOC is an inner state of the HyLICs that depends on temperature, material degradation, electrochemical reactions and aging cycles [7,8]. In addition, HyLICs have typically nonlinear and time-varying characteristics [9]. Consequently, based on the traditional SOC estimation method, it is difficult to estimate SOC for HyLICs [10].
The methods for the estimation of the SOC can be mainly classified into three categories: direct-measurement methods, data-driven methods and model-based methods [11,12]. Direct measurement methods include the ampere-hour counting method and the open-circuit voltage (OCV) method. The ampere-hour counting method is easy to implement, but the initial value is difficult to find and the error may accumulate [13,14]. Considering the relationship between OCV and SOC is simple and straight; the OCV method can meet the requirements [15]. However, this highly depends on the temperature, chemistry, state of health (SOH) and other factors that can easily affect how their relationship works, and it also varies when batteries age [16].
The data-driven method, such as neural networks [17], extreme learning machine [18] and support vector machine [19], takes advantage of advanced machine learning algorithms to achieve SOC estimation with available historic data, and it is not dependent on a model featuring degradation-dependent parameters [10,20]. Hussein et al. [21] presented two artificial neural networks (ANNs) for SOC estimation of an Li ion battery. However, the implementation cost rises due to the strictly necessary advanced hardware. Malkhandi et al. [22] estimated the SOC of an Li ion battery using the fuzzy logic without thoroughly eliminating the impact of incomplete charging. Yang et al. [23] proposed a stacked Long Short-Term Memory (LSTM) network for SOC estimation that can capture the nonlinear relationship among measured current, voltage, temperature and SOC. Xia et al. [24] proposed a hybrid intelligent method based on a Wavelet Neural Network (WNN) to estimate the SOC of lithium-ion batteries. The discrete wavelet transform and Levenberg–Marquardt are used in the data-training operations.
Nowadays, more work has focused on developing the SOC estimation methods to improve their accuracy based on different models. The model-based method usually starts with the construction of the battery degradation models. Input parameters such as load current, terminal voltage and temperature were taken into calculation for the equivalent model to estimate the SOC of a lead battery [25]. The electrochemical and equivalent circuit model are common equivalent models for batteries [26,27]. They are used to simulate the dynamic characteristics of batteries. Based on various types of battery models, some filtering algorithms derived from control theory are used to estimate the SOC [28]. Pan et al. [11] used the grey prediction model (GM) combined with an OCV model based on the piecewise cubic-Hermite interpolation to build a grey extended Kalman filter (GMEKF) for the SOC estimation of an Li ion battery. However, the estimation accuracy and robustness of these methods still mainly depend on the type of battery model [14].
The above methods are based on the external characteristics of the battery [29], and rarely take the internal electrochemical reaction of the battery into account. Therefore, the accuracy of the estimation results depends heavily on the model or algorithm selection. As a newly developed energy equipment, the property investigation of HyLICs is still at the very beginning compared to the broad study on the Li-ion battery or lead battery. When it comes to the SOC estimation performed in HyLICs, it is certain that our work is not the first time to complete it; previous work was not discussed but spent quite a quantity of space to analyze the characteristics of HyLICs. Based on their nonlinear and time-varying characteristics, existing SOC estimation methods that were mainly performed on the external characteristics of the equipment, as well as the previous little research on HyLICs, are not suitable for our work.
In this paper, we conduct our research based on the internal characteristics of the research object and take the electrochemical impedance of HyLICs, which can be obtained by an electrochemical characteristics test, as the key parameter of the study. The voltage of HyLICs was divided into three intervals based on the linearization result of the HyLICs’ electrochemical impedance. The extended Kalman filter method and the ampere-hour integral method are used in the different intervals to estimate the SOC of HyLICs. The method is applied to different operating conditions, and the experimental results show that the method has higher estimation accuracy and stronger reliability.

2. Experiment and Electrochemical Characteristic Analysis

2.1. Hybrid Pulse Power Characterization (HPPC) Test

The hybrid pulse power characterization was recorded on battery tester BTS-60V20A produced by Neware Ins., Shenzhen. The specific procedure is as follows:
Step 1: The HyLICs were fully charged with constant voltage and standard current.
Step 2: The fully charged HyLICs were left to rest for 5 h until they reached the equilibrium state.
Step 3: The HPPC sequence was loaded before the constant current discharge was conducted. The HPPC discharge cycle was repeated at every 10% drop in SOC until the cycle ran at 10% SOC. The time interval of resting was 1 h.
Step 4: The test procedure stopped when the voltage of HyLICs reached its discharge cut-off voltage.
HPPC test data will be detailed in the following analysis of Section 4.1.

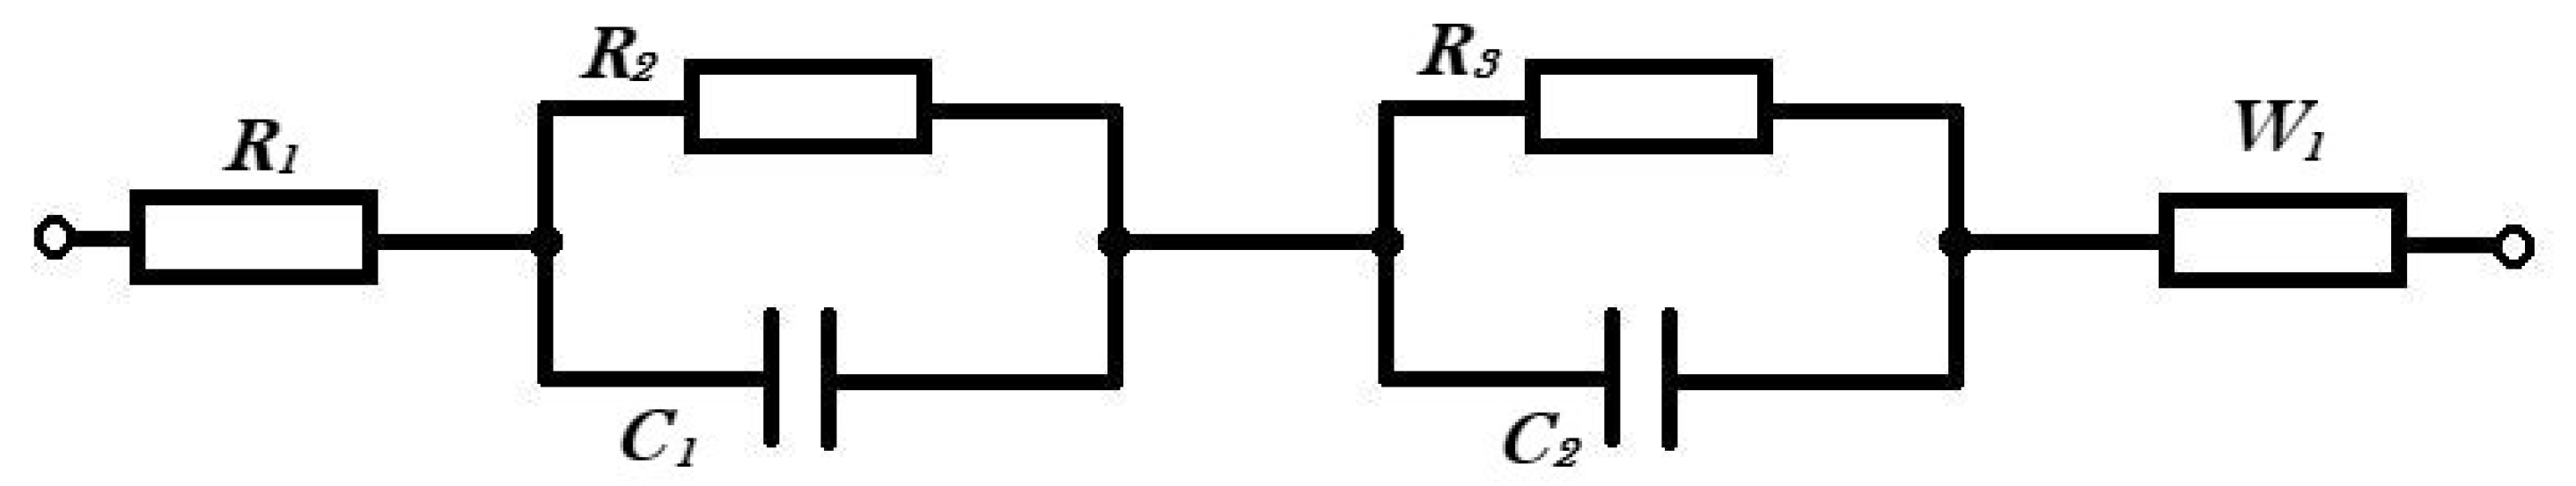
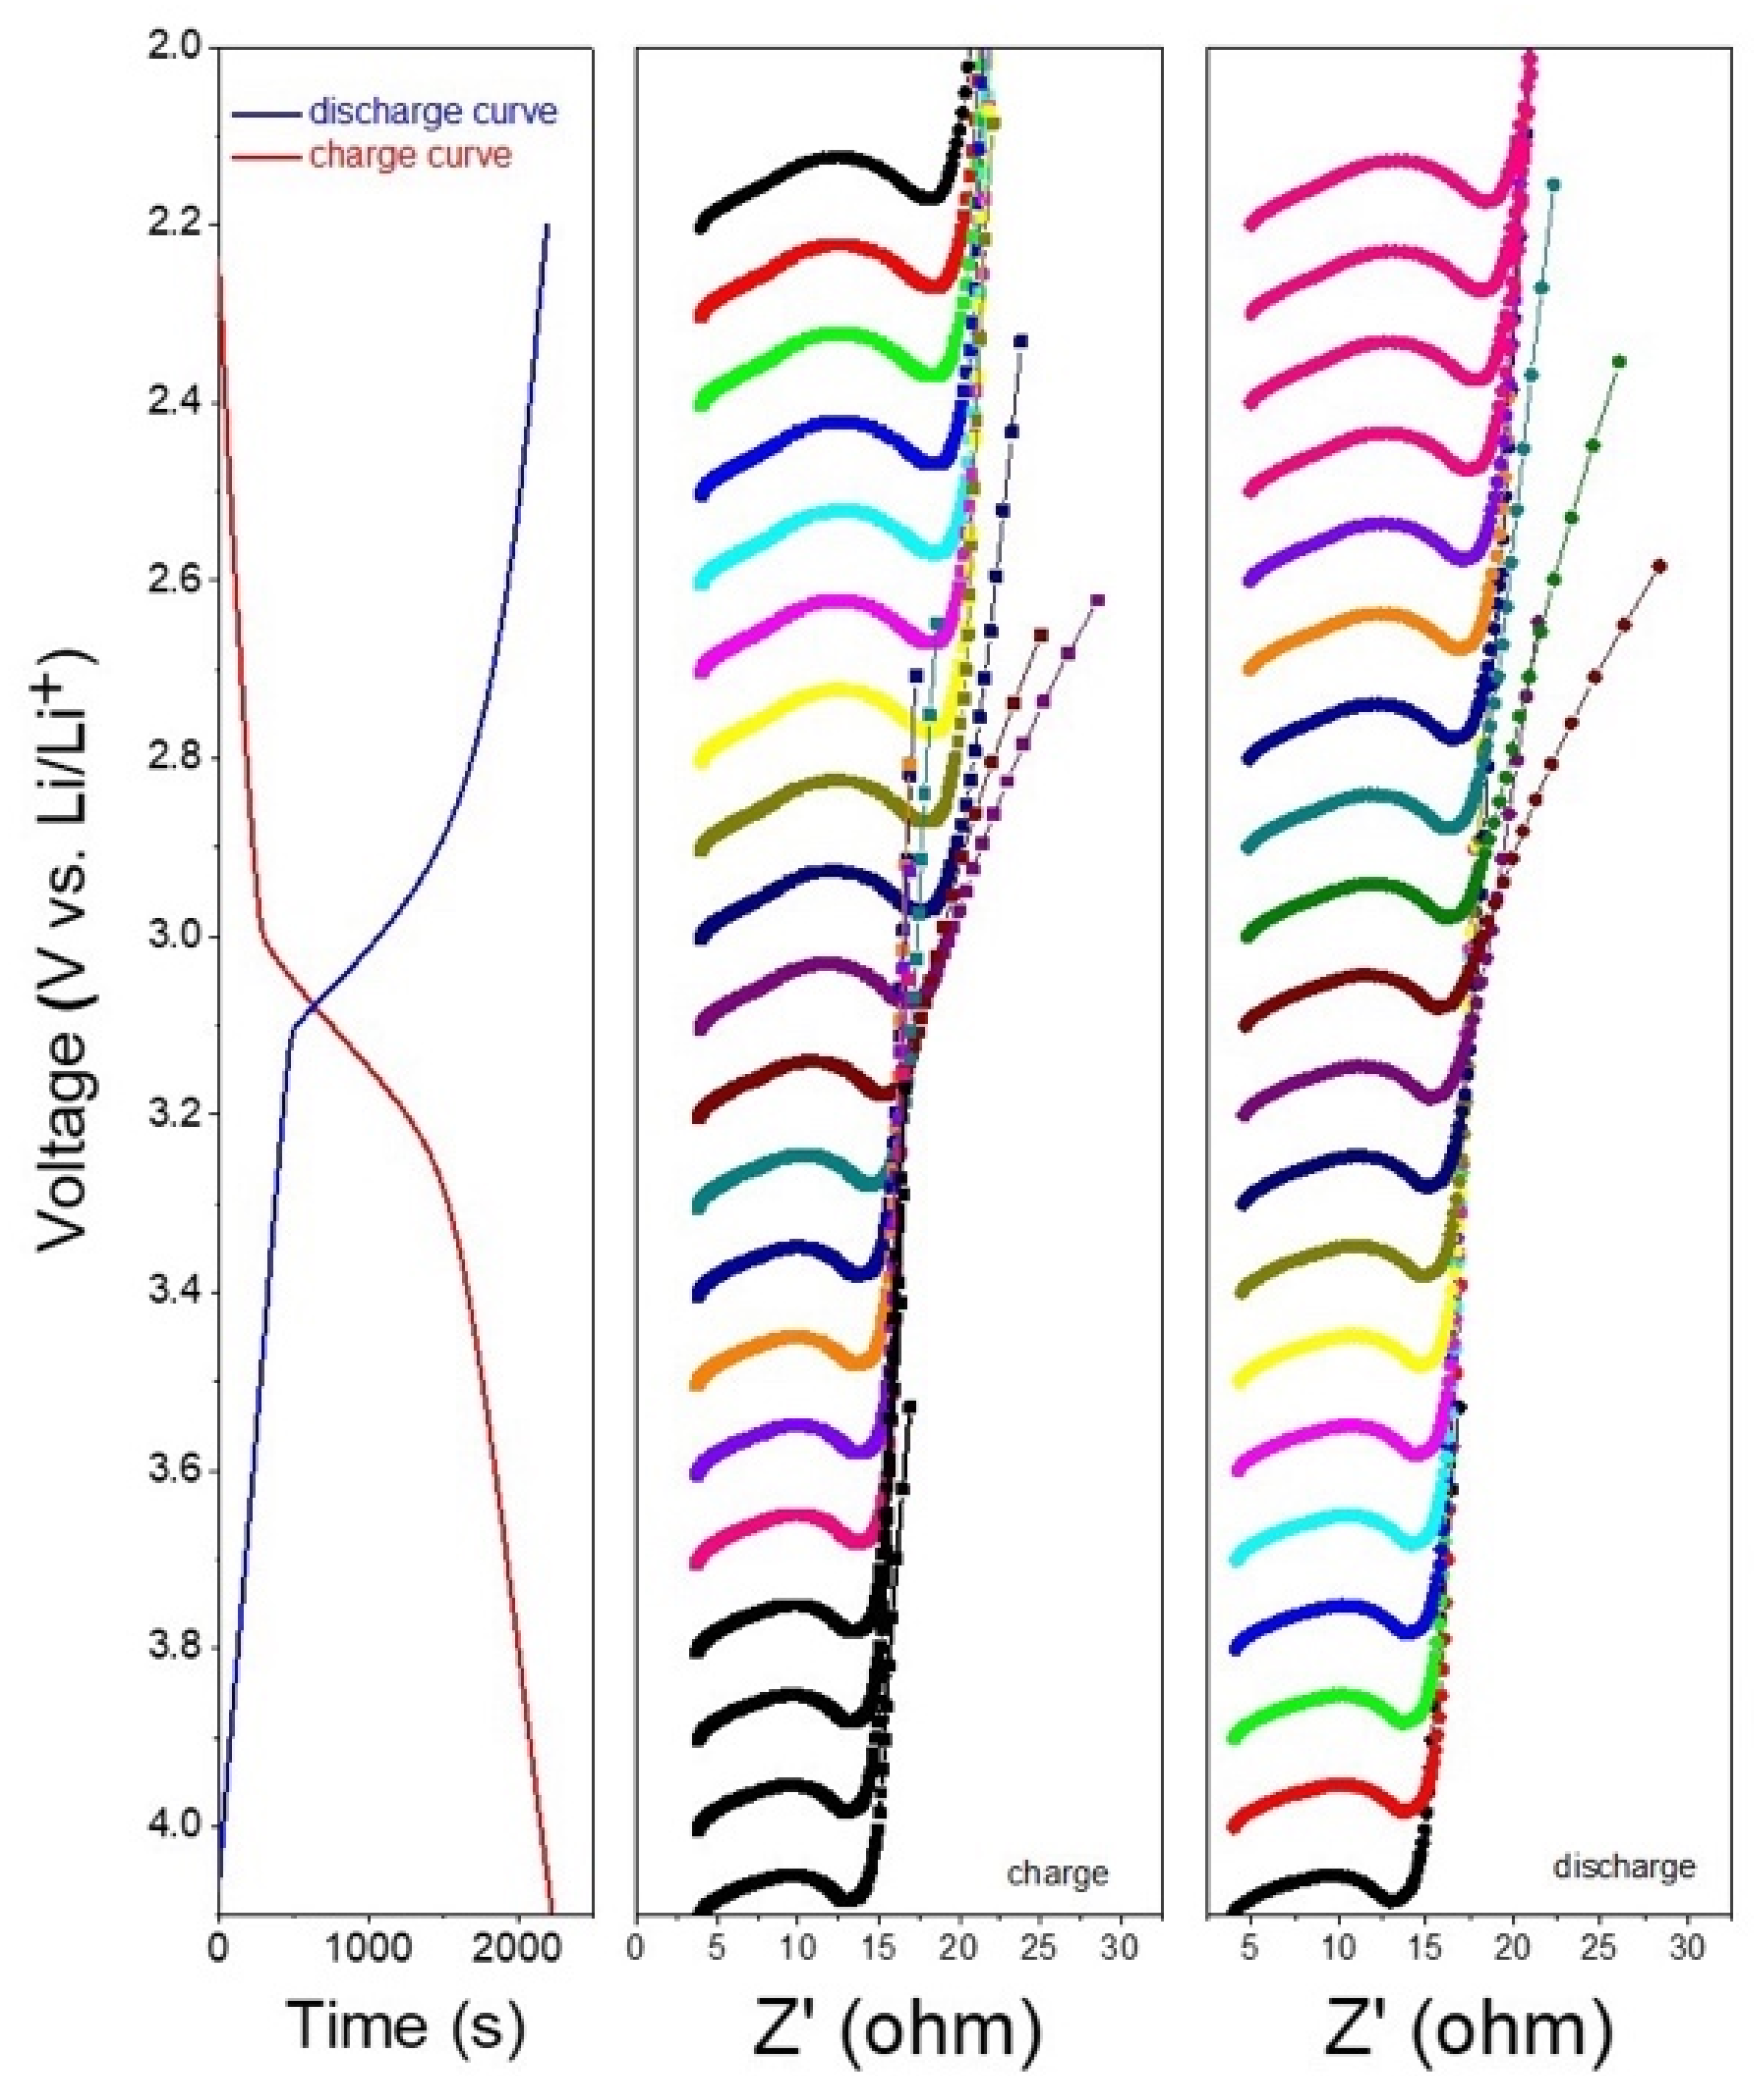
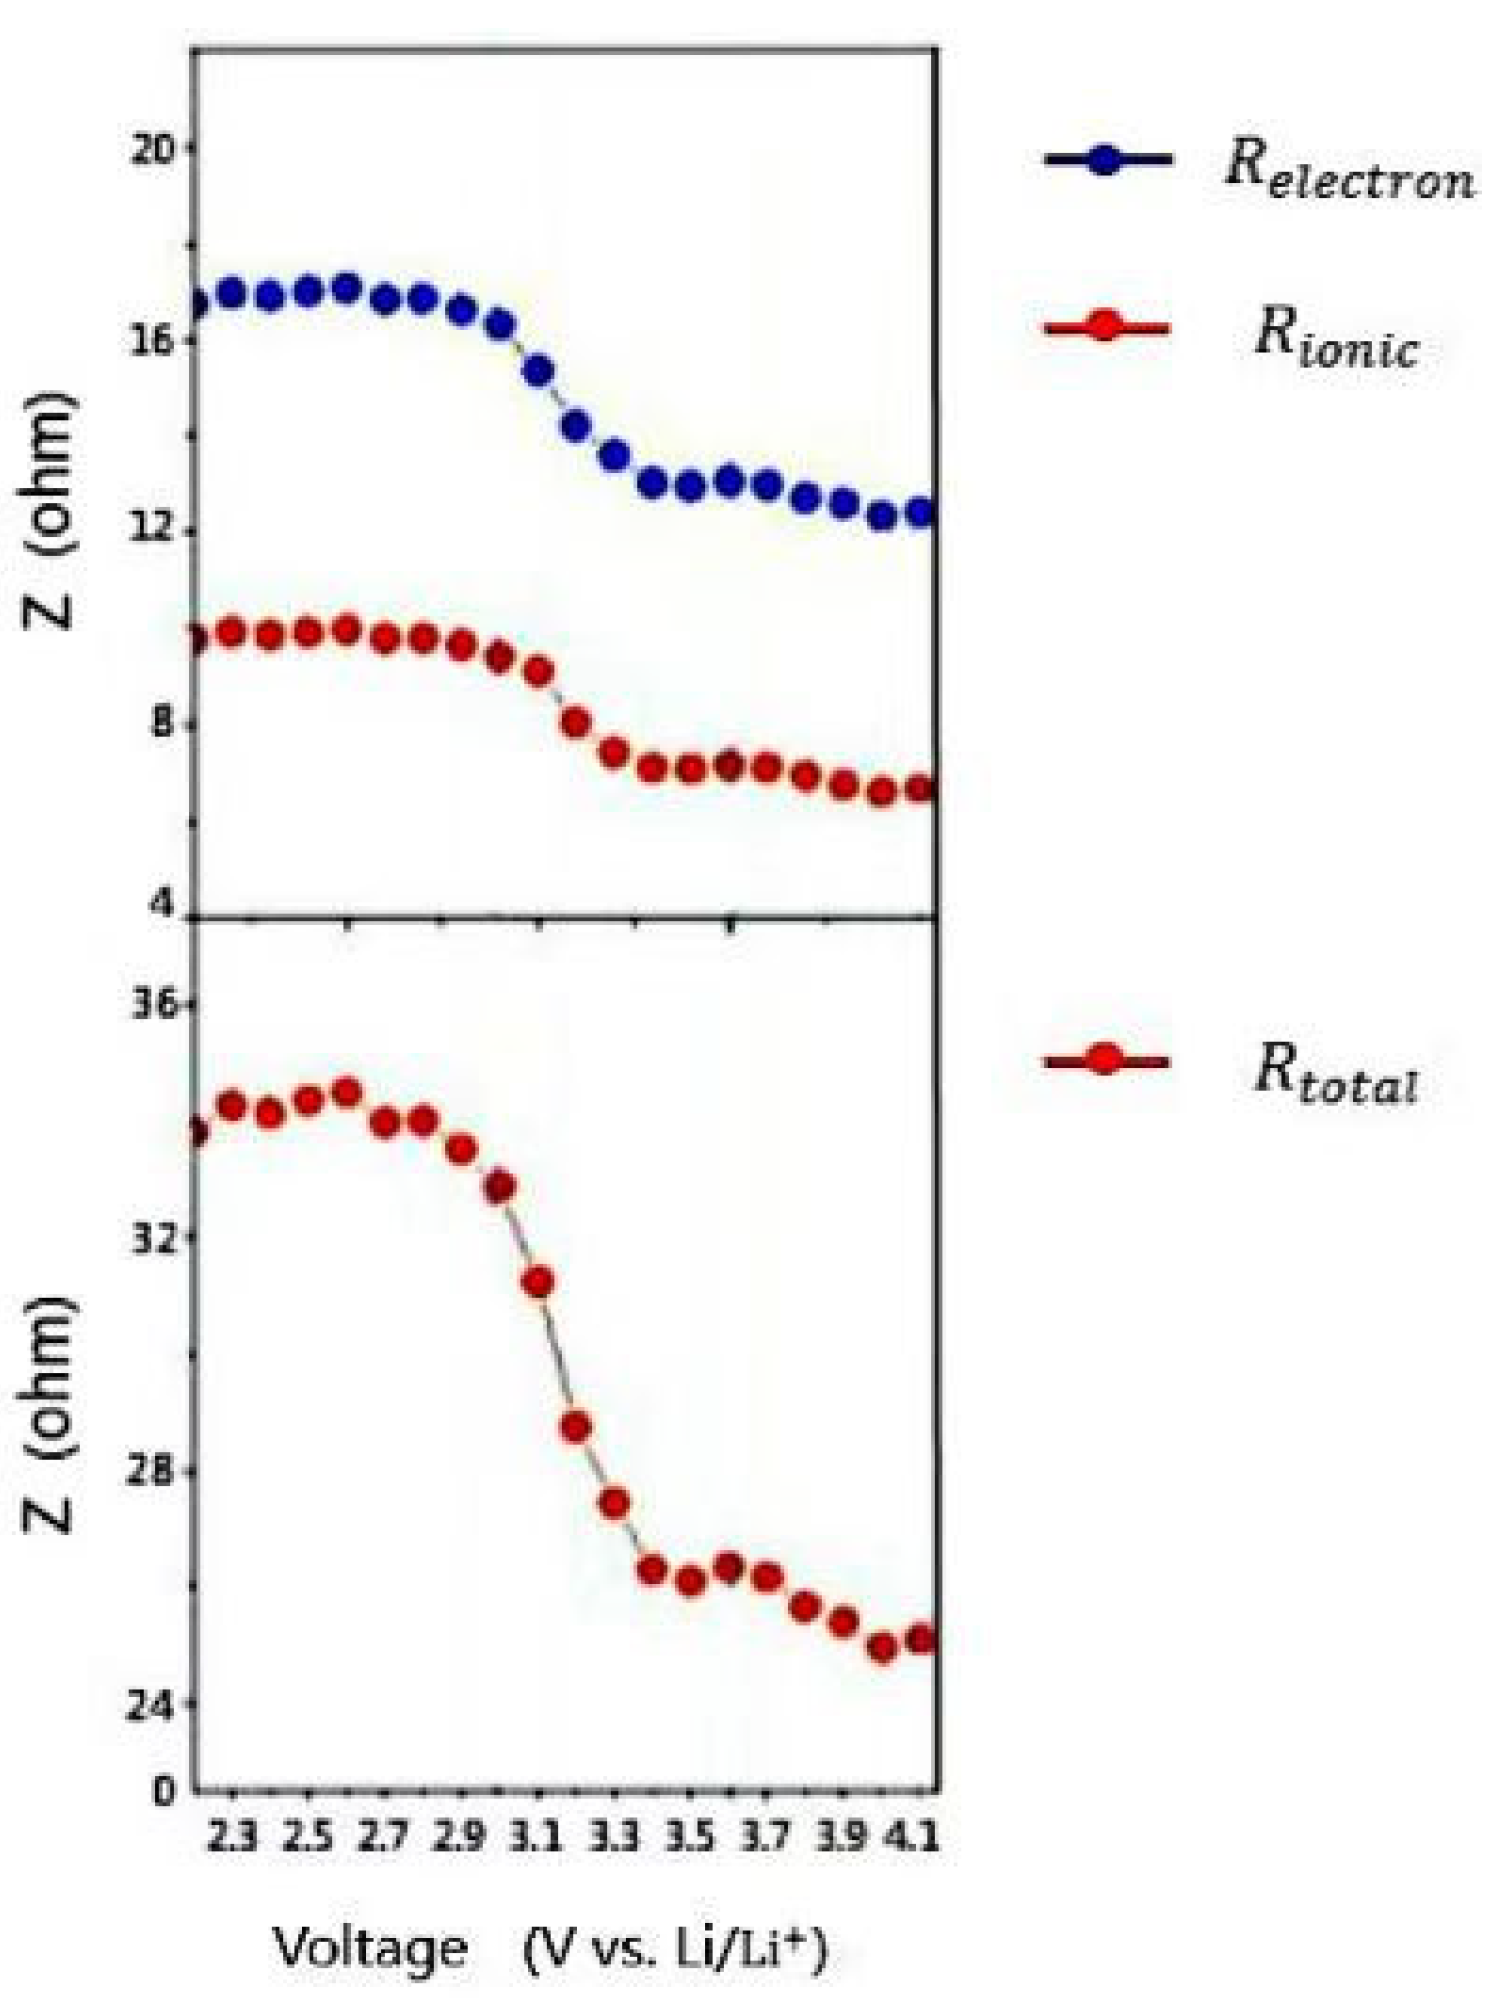
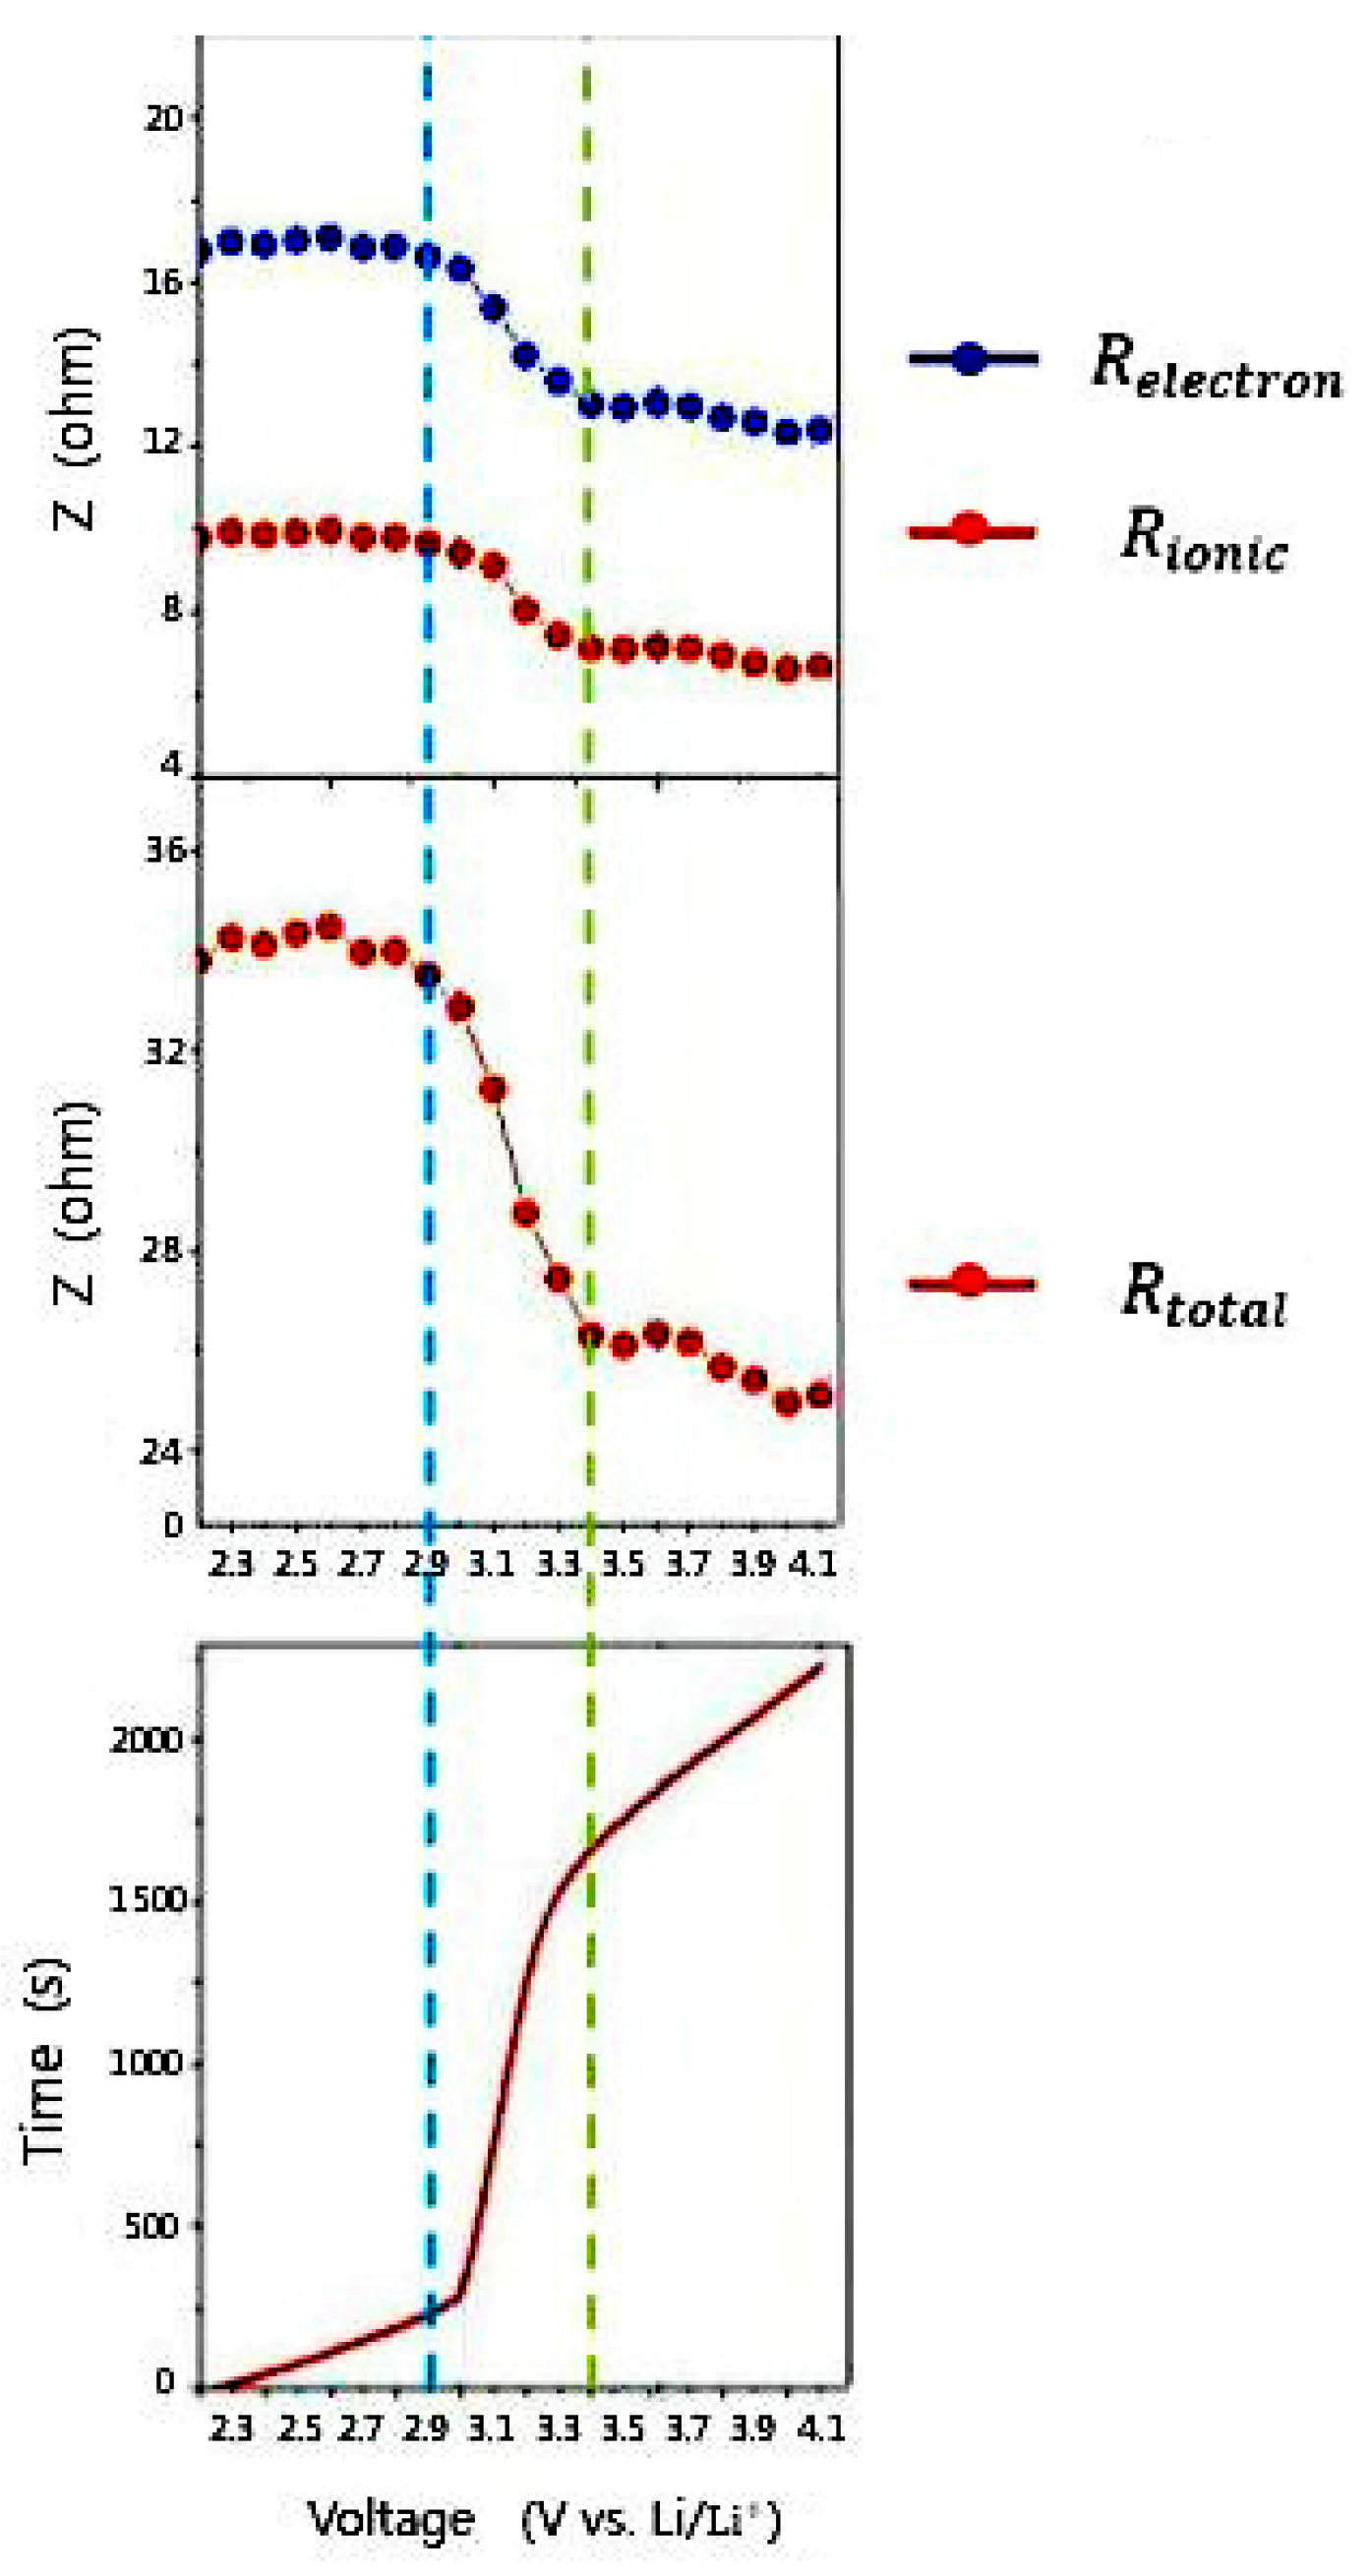
2.2. Electrochemical Characteristic Test

The electrochemical characteristic test mainly consists of two parts: cyclic voltammetry (CV) test and electrochemical impedance spectroscopy (EIS). The cyclic voltammetry (CV) profiles at different voltage ranges and scanning rates were recorded on the electrochemical workstation CHI660 produced by CH Instruments Ins., Shanghai. The EIS was tested at the open circuit voltage (OCV) within the frequency of 10−1–106 Hz on CHI660. The galvanostatic charge and discharge test was conducted on Neware battery tester. The specific procedure is as follows:
Step 1: The HyLICs were fully charged and discharged for 8 times with a constant current of 1.6 C.
Step 2: A CV test was performed on the HyLICs. A triangular wave voltage was then applied to the HyLICs. After that, the HyLICs were scanned forward with a scanning rate of 10−4 V/s from 2.2 V to 4.1 V at both charge and discharge periods.
Step 3: The HyLICs were tested with the interval of 0.1 V during the cycle from 2.2 V to 4.1 V and back to 2.2 V, to obtain the EIS of charge and discharge for each voltage state.

2.3. Electrochemical Characteristic Analysis

In order to obtain more detailed electrochemical information inside HyLICs, the Zview software was used to identify the parameters at the equivalent circuit diagram as shown in Figure 1, where R1 represents the ohmic impedance generated by the contact of electrolyte diaphragm; R2 represents the transfer resistance; C1 represents the electric double layer generated at the boundary between the electrolyte and the electrode; R3 and C2 connected in parallel represent the impedance of the solid electrolyte interface membrane on the negative electrode of the battery; W1 represents the ion diffusion resistance of the battery. The kinetic parameters of the reaction process were calculated by an EIS test, and the EIS test results are shown in Figure 2. Based on the results, the electronic impedance, ion impedance and total impedance can be further fitted into curves.
The electronic impedance, ion impedance and total impedance of the HyLICs changed with terminal voltage are shown in Figure 3. It can be seen that for the total impedance of the HyLIC, its nonlinear and time-varying characteristics are quite obvious and it is inappropriate to adopt one method to estimate its SOC during different energy storage conditions. The standard Levenberg–Marquardt method [30] and general global optimization algorithm are used to perform piecewise linear fitting to the total impedance of the HyLICs, and the mathematical relationship is shown in Equation (1).
y = 0.0357 x + 34.125 ,   x < 2.8875 16.9 x + 83.23 ,   2.8875 x < 3.3355 1.2976 x + 30.7036 ,   x 3.3355
After fitting, the mean square error MSE = 0.3025, the residual sum of squares RSS = 1.8308 and the correlation coefficient R = 0.9969 indicate that the model fits the data well. Intervals are separated by blue and green dotted lines in Figure 4. When the HyLICs voltage is between 2.2 V and 2.90 V, the corresponding SOC interval is 3–20%, the slope of the discharge OCV–SOC curve is large, and the OCV of the HyLICs changes drastically with the SOC value. The total impedance curve remains basically stable. In this interval, the capacitive energy storage characteristics of HyLICs occupy a dominant position. When the terminal voltage rises to 2.90–3.35 V, the corresponding SOC range is 20–80%, with an obviously smaller slope of the discharge OCV–SOC curve. As the SOC value increases greatly, the OCV value changes less and the total impedance curve drops sharply in this interval. They all show that the energy storage characteristics of lithium batteries dominate in this interval of HyLICs. When the terminal voltage reaches 3.35–3.8 V, the corresponding SOC interval increases to 80–100%, the slope of the discharge OCV–SOC curve increases again, and the total impedance of the capacitor is reduced and becomes stable. The above results prove that the capacitive energy-storage characteristic of HyLICs takes control again.

3. SOC Partition Estimation Method Based on Electrochemical Characteristics

3.1. Battery Model and Parameter Identification

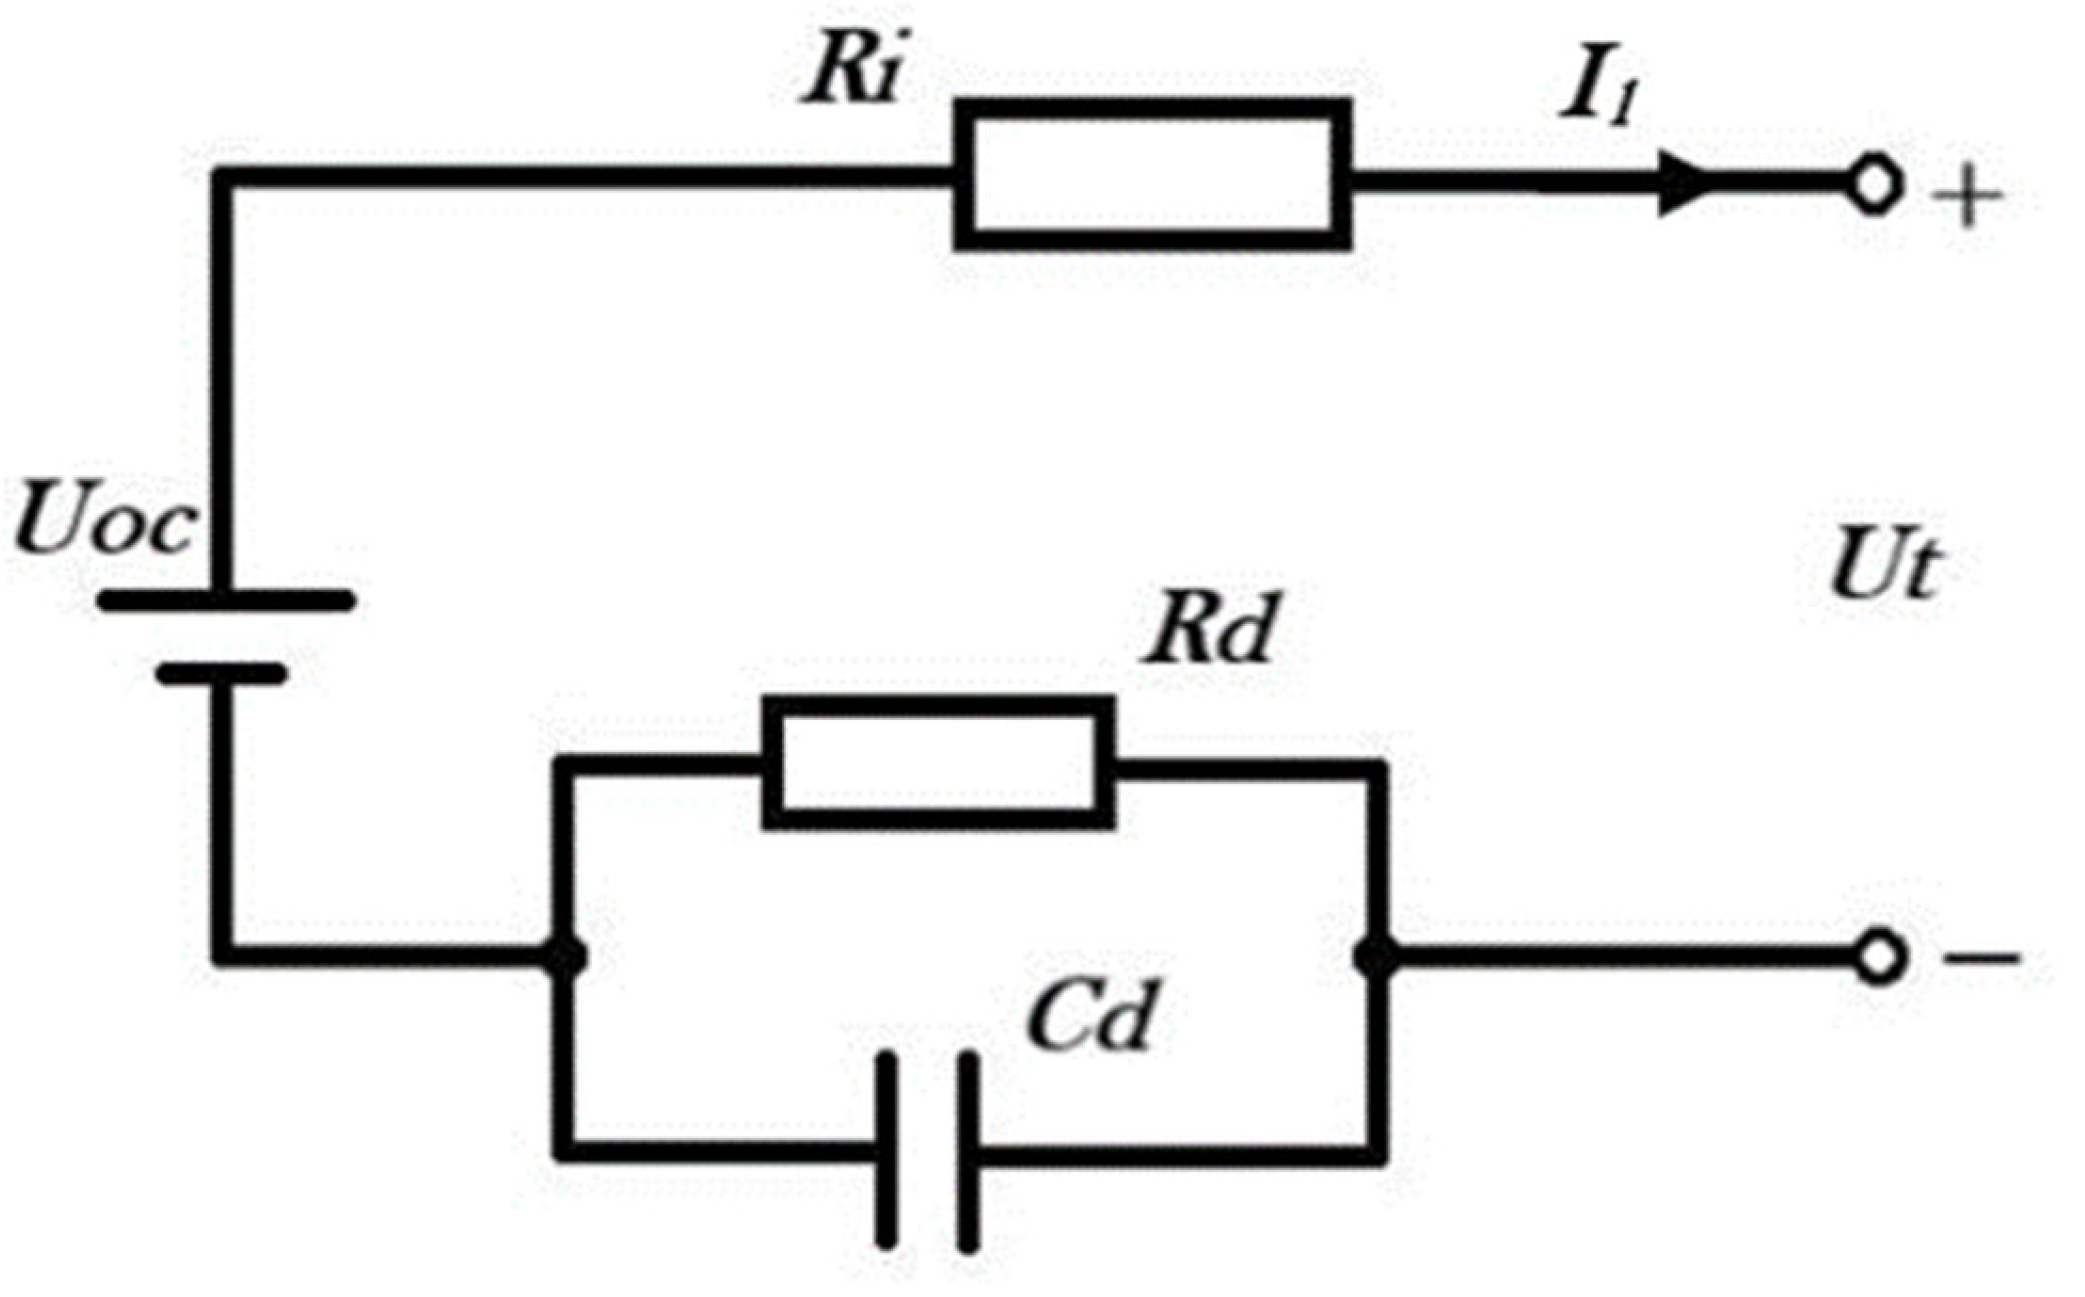
3.1.1. Equivalent Circuit Model

The equivalent circuit model [31] is a circuit network that can quantitatively describe the working characteristics of power batteries. Compared to other equivalent models [32], the equivalent circuit model has the advantages of strong applicability, high precision and easy quantitative analysis. Considering the real-time requirements of the Battery Management System for state information estimation and the computing ability of microprocessors, it is necessary to establish a lithium-ion capacitor model with as low complexity as possible on the premise of meeting the accuracy requirements. Comparing its model accuracy, complexity, computational complexity and other factors to the Rint model and Partnership for a New Generation Vehicles (PNGV) model, the first-order RC equivalent circuit model (Thevenin model) was selected for the establishment of an equivalent model of HyLICs [33]. The circuit diagram is shown in Figure 5, and the circuit equation is:
U ˙ d = i L C d U d R d R d U t = U o c U d R i · i L
where Uoc is the OCV, iL is the load current, Ut is the terminal voltage, Ri is the ohmic internal resistance, and Rd and Cd are the polarization resistance and polarization capacitance of the RC network, respectively.

3.1.2. Parameter Identification

The parameters of the HyLICs change with the influence of factors, such as operating temperature and working conditions. The accuracy of the fixed parameter model will inevitably decrease with the change of battery life-cycle parameters, so that the battery state cannot be accurately estimated. Therefore, it is necessary to introduce an online update mechanism for battery-model parameters. According to the characteristics of rapid changes in battery-system status and slow changes in parameters, it is necessary to reduce the influence weight of old data on parameter estimation, while increasing the influence of new information on system-parameter identification, and the newer the data, the greater the weight [34]. For this reason, the Recursive Least Squares method with Forgetting Factor (FFRLS) [11] is used to identify the parameters of the first-order RC model of lithium-ion batteries Rd, Ri, Cd.

3.2. The EKF Method for SOC Estimation

The EKF [35,36] method is applied to estimate the SOC of the HyLICs. The terminal voltage sequence UT,0, UT,1, UT,2,…, UT,k is the system input and the terminal current sequence IL,0, IL,1, …, IL,k is the system output. The model of the system is as follows:
S O C ˙ U d ˙ = 1 0 0 1 R d C d S O C U d + 1 q 0 1 C d I L + W U t = O C V S O C U d R i I L + V
where UOC = OCV(SOC) represents the nonlinear function between open-circuit voltage UOC and the SOC of the HyLICs; W and V are white noise that obeys Gaussian distribution.
The linear variable system is as follows:
S O C ˙ U d ˙ = 1 0 0 1 R d C d S O C U d + 1 q 0 1 C d I L + W U t = d O C V d S O C 1 S O C U d + O C V S O C ^ U d ^ R i I L d O C V d S O C 1 S O C ^ U d ^ + V
The discrete time model of the system is as follows:
S O C ˙ U d ˙ = 1 0 0 e 1 R d C d S O C U d + 1 q 0 R d 1 e 1 R d C d I L , k + W k 1 U t , k = d O C V d S O C 1 T S O C U d k + O C V k S O C ^ k U d , k ^ R i I L , k d O C V d S O C 1 k T S O C ^ U d ^ k + V k
where x k = S O C U d k T is the state vector, U t , k is the observation vector, I L , k is the control vector, W k 1 and V k are uncorrelated zero-mean Gaussian white noise. In addition, the SOC estimation can be achieved by applying the linearized system discrete-time model to the EKF algorithm.

3.3. SOC Partition Estimation Method Based on Electrochemical Characteristics

From the analysis in Section 2.2, it can be seen that when the terminal voltage is 2.2–2.9 V and 3.35–3.8 V, the capacitive energy-storage characteristics of HyLICs dominate. Capacitor energy storage has strong nonlinear characteristics and the EKF method is suitable for nonlinear systems. The EKF method is not sensitive to initial parameters and can reduce the accumulation of experimental errors. Therefore, the SOC value of these battery intervals will be estimated using the EKF method considering the complexity of the algorithm and the real-time of the system [37]. When the terminal voltage is between 2.90 V and 3.35 V, the battery-energy-storage characteristics are more apparent, and the ampere-hour method should be used to estimate the SOC value more accurately [38].

4. Results and Discussion

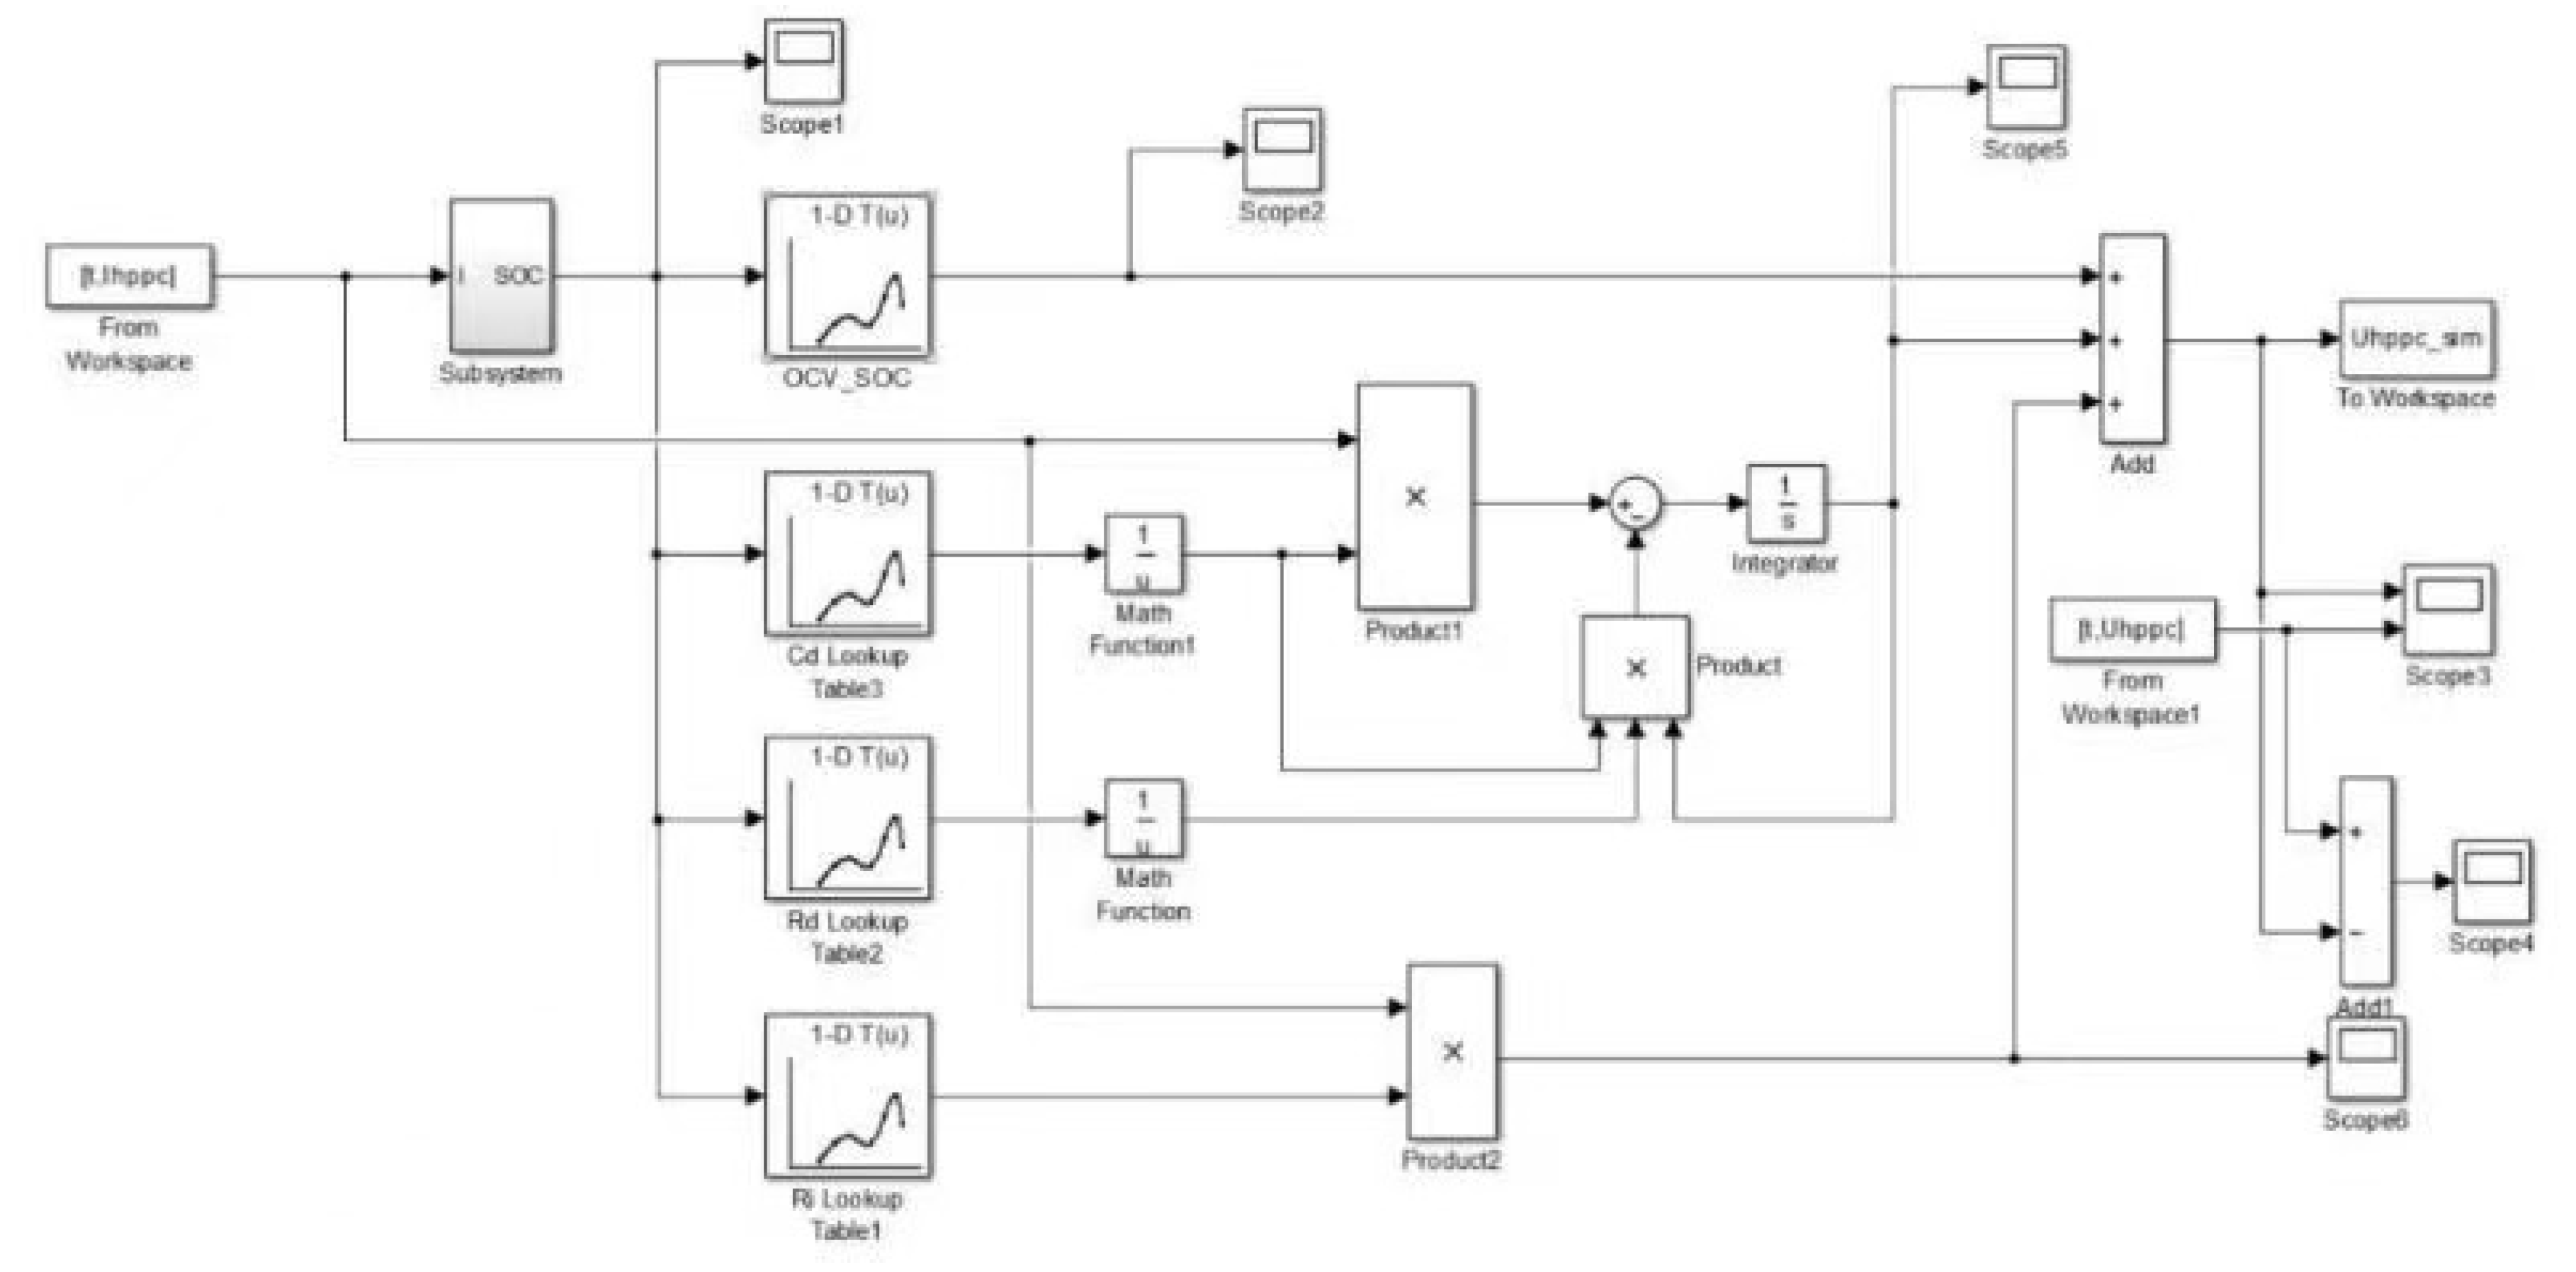
4.1. Analysis of the Model for Battery SOC Estimation

A comparison of the UOC value obtained by parameter identification with the discharge OCV–SOC curve is shown in Figure 6. The average error is 0.02 V and the maximum error is 0.033 V. It can be seen that the parameter-identification result is true, the difference between the values is small and the identification accuracy is high.
Combining the common SOC estimation methods described in this chapter, the analysis of the electrochemical characteristics of lithium-ion capacitors, and the methods selected for different intervals, the flow chart of the SOC partition-estimation method based on the electrochemical characteristics of lithium-ion capacitors can be obtained as following and as shown in Figure 7:
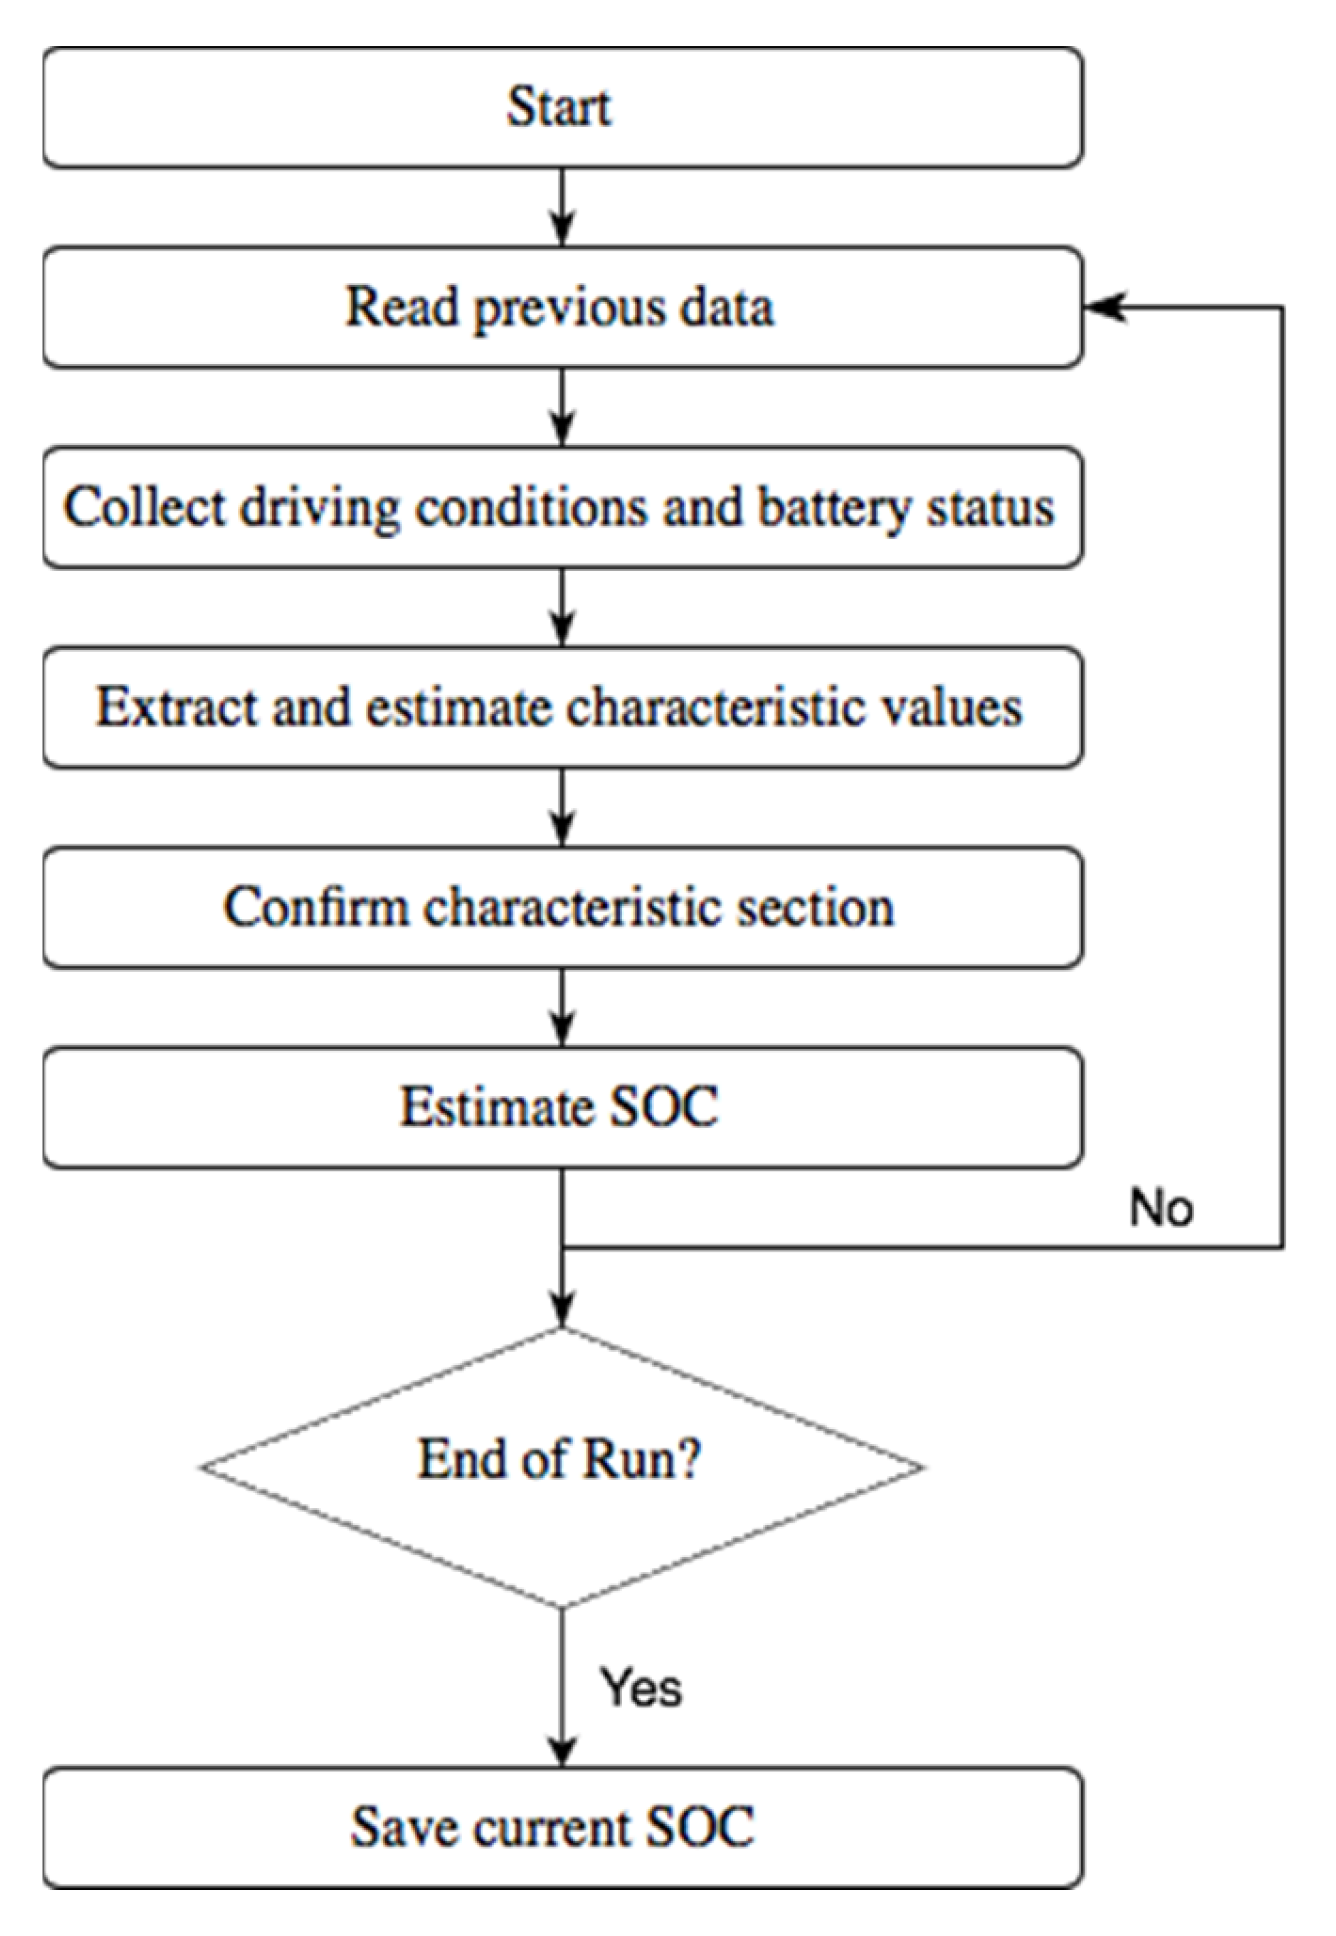
  • The historical information stored in the system should be queried, and the SOC value obtained at the last time of the last operation of the HyLIC should be used as the initial value of the SOC estimation algorithm;
  • The real-time operating condition data of the HyLIC would be acquired, including terminal voltage, working current, etc., the terminal voltage as the characteristic value of the SOC electrochemical characteristic zone would be used, and the chemical characteristic interval of the lithium ion capacitor would be judged according to the terminal voltage value;
  • The current SOC of the HyLIC would be estimated according to the current interval of the lithium-ion capacitor and the corresponding method previously determined, and the result would be saved;
  • Determine whether the work is over. If it is, jump out of the loop; otherwise, return to 2.
According to the parameter-identification results, the Thevenin model of the HyLICs shown in Figure 8 is established in Simulink. Load the HPPC test current at the input terminal of the model, and compare the output terminal voltage value HPPC test results. As shown in Figure 9, the average error is 0.176 V, and the maximum error is 0.431 V. In the middle- and high-voltage range in Figure 8, the estimated value of the Thevenin model is in good agreement with the measured value, while the error becomes larger in the low-voltage range. The reason may be that the charging and discharging principle of HyLICs is more complicated, but the accuracy of the model is still acceptable.

4.2. Algorithm Verification

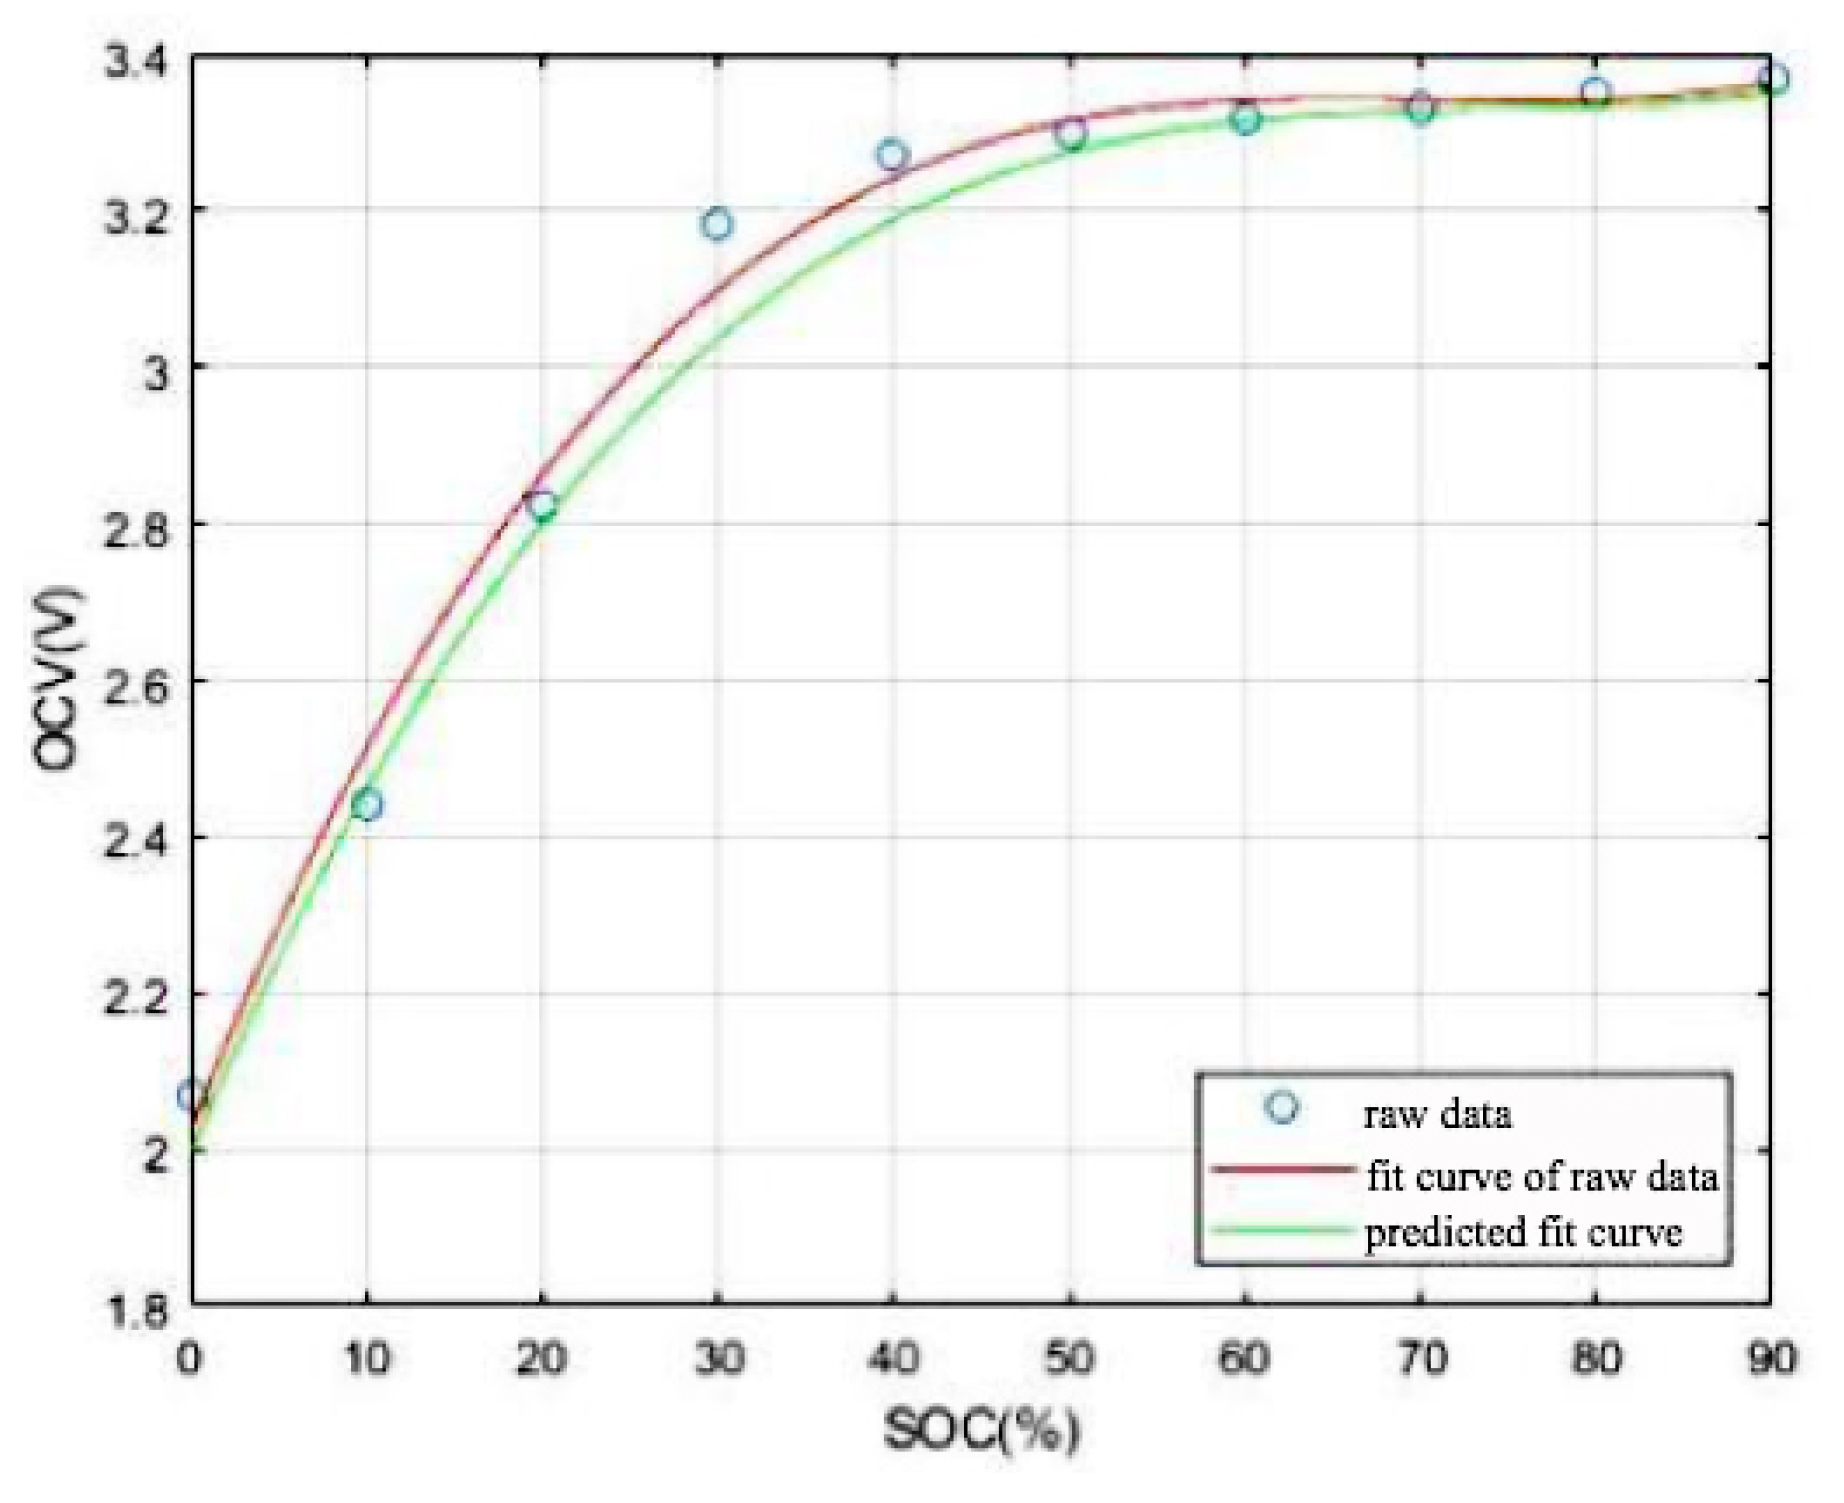
4.2.1. Discharge OCV Test and Verification

The relevant data is recorded during the test of 1C rate in the discharge open-circuit voltage at room temperature of the HyLICs. The voltage and current data in the discharge open-circuit voltage test are used as the input of the algorithm and implemented in MATLAB. The estimated SOC value obtained by the partition-estimation algorithm and the SOC value measured in the laboratory are shown in Figure 10a. The difference between them is shown in Figure 10b.
It can be seen from Figure 10 that this method is close to the data measured in the laboratory in the low SOC interval, and the accuracy is a little lower in the medium and high SOC intervals. The reason is that the SOC value of the HyLICs is greater than 80% when the system is started and the EKF method is used in the interval. Before the estimation result of the EKF method converges to a stable value, the algorithm switches to the stable region. During that period, the ampere-hour method is used for SOC estimation, and the initial value of this method has a great effect on it. The initial value estimation error will accumulate as the test proceeds. It can be seen from Figure 10b that in the discharge open-circuit-voltage test, the error between the predicted and actual value is less than 10%, which is still within an acceptable range. Regardless of whether the error is feasible for other circumstances, there is no denying that the error-correcting process still requires deeper and more qualified work to optimize the current estimation method and to reduce error.

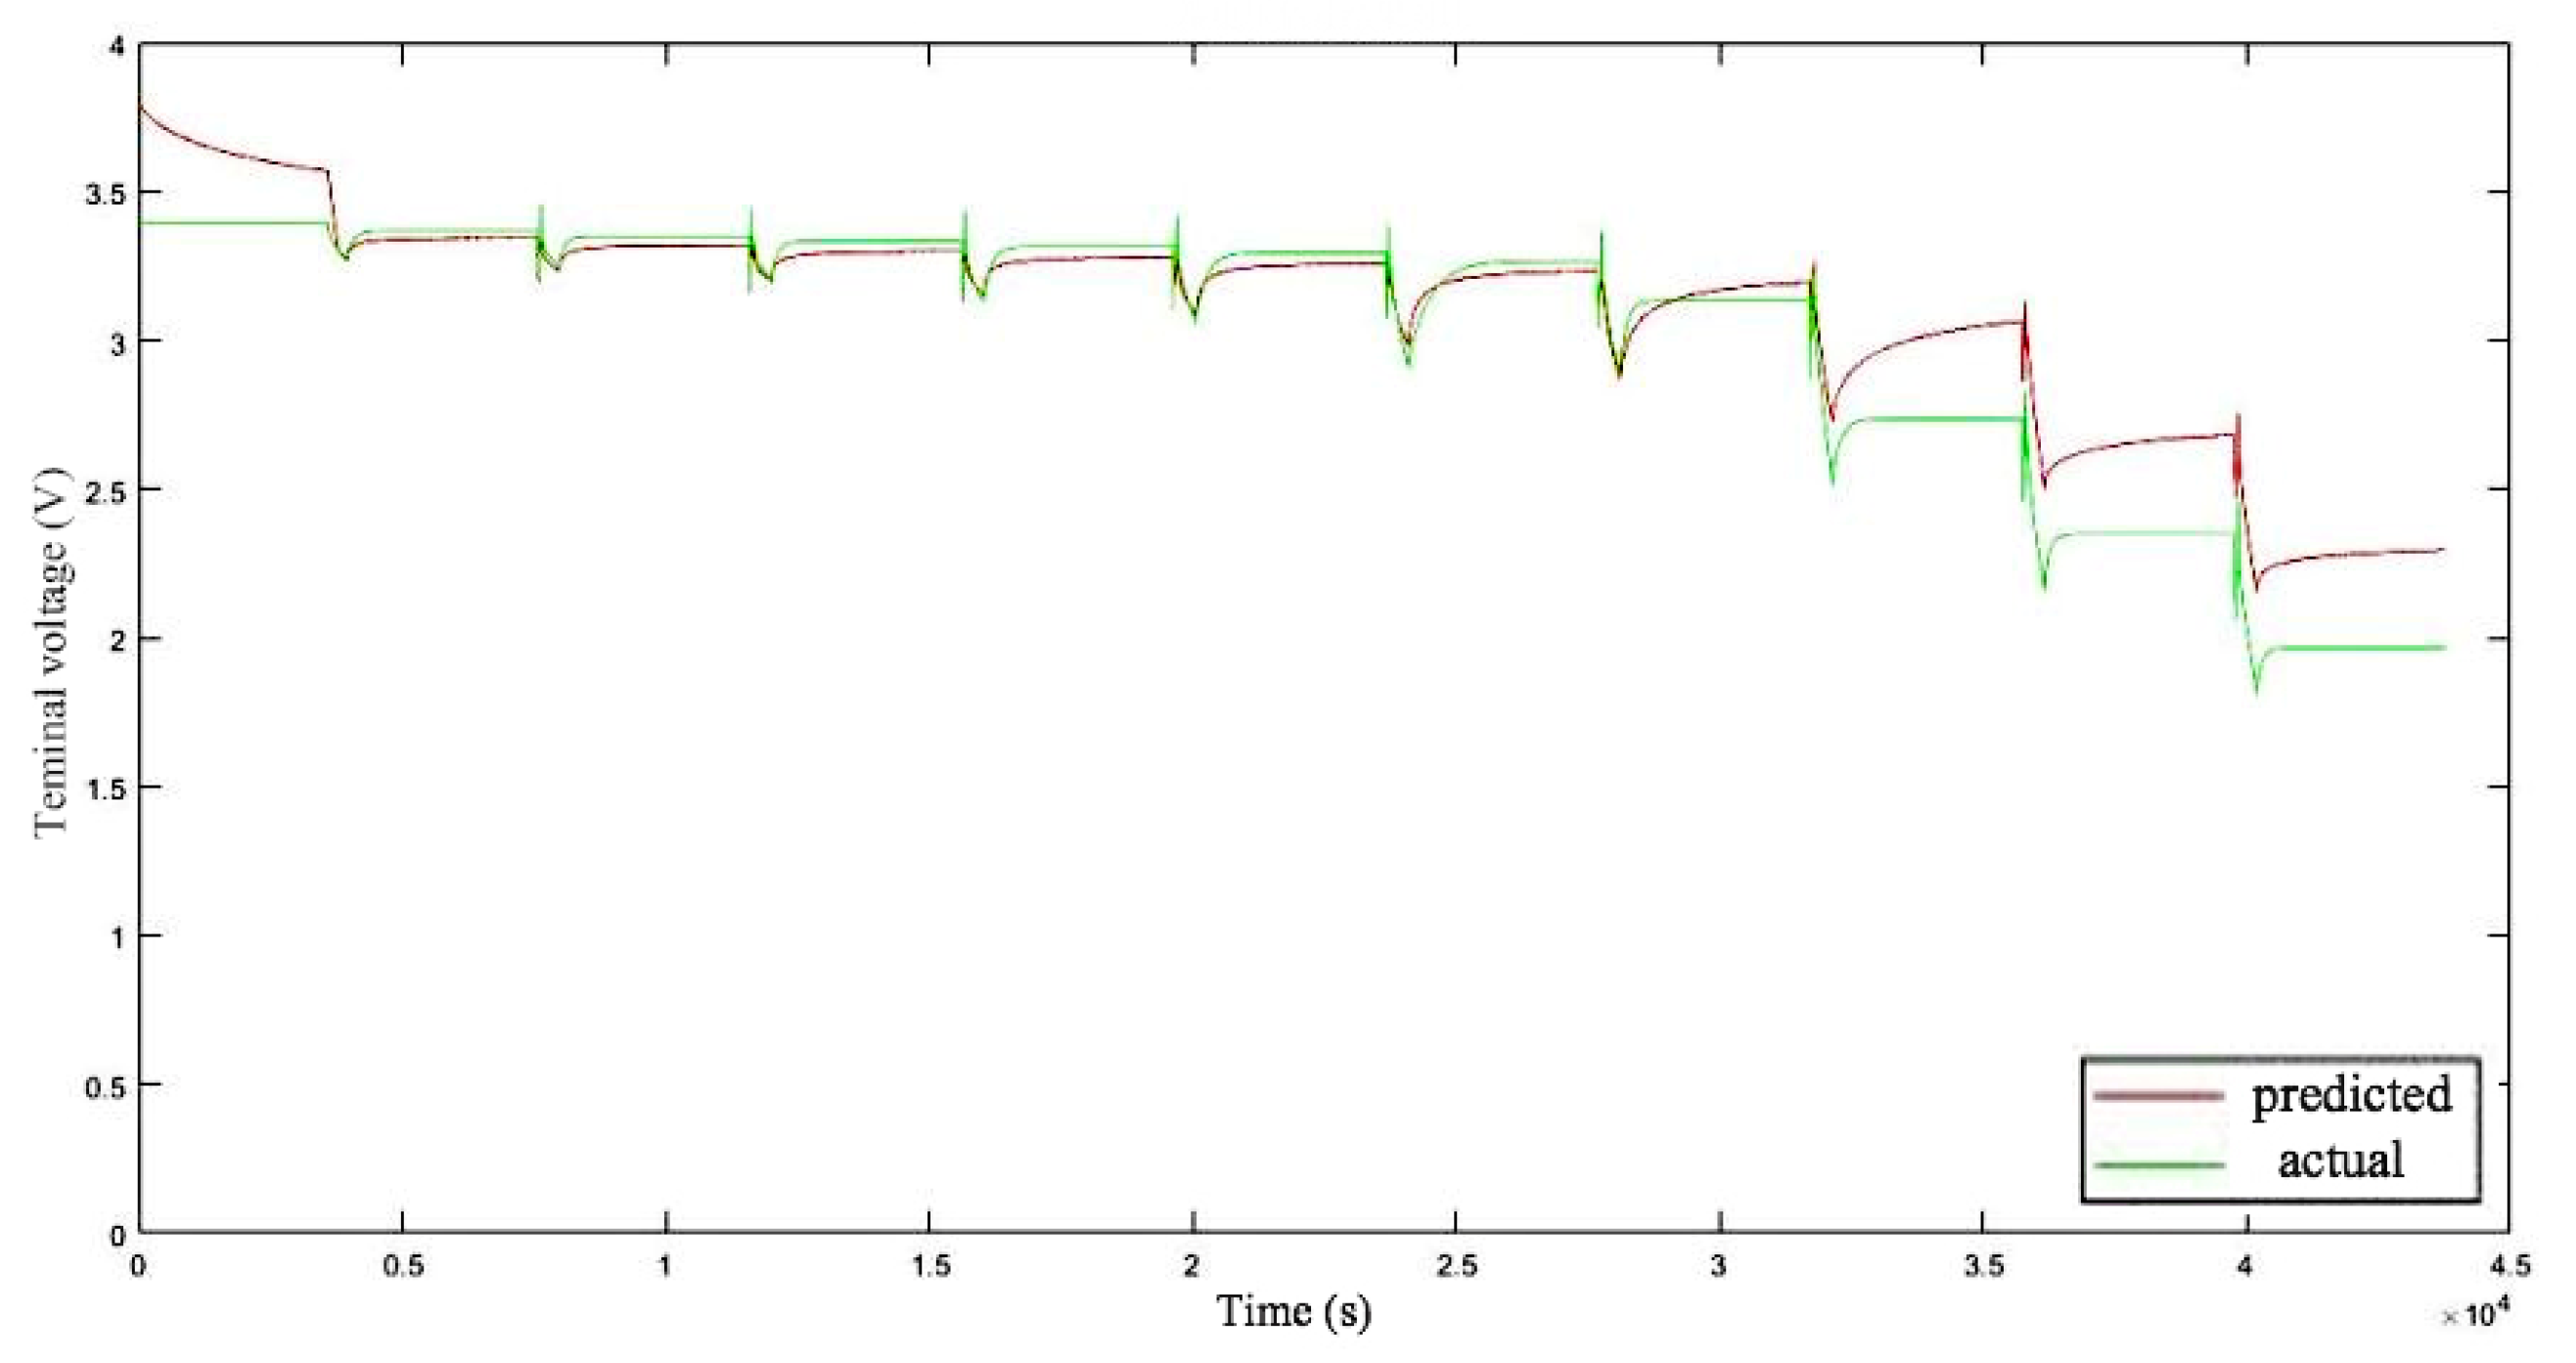
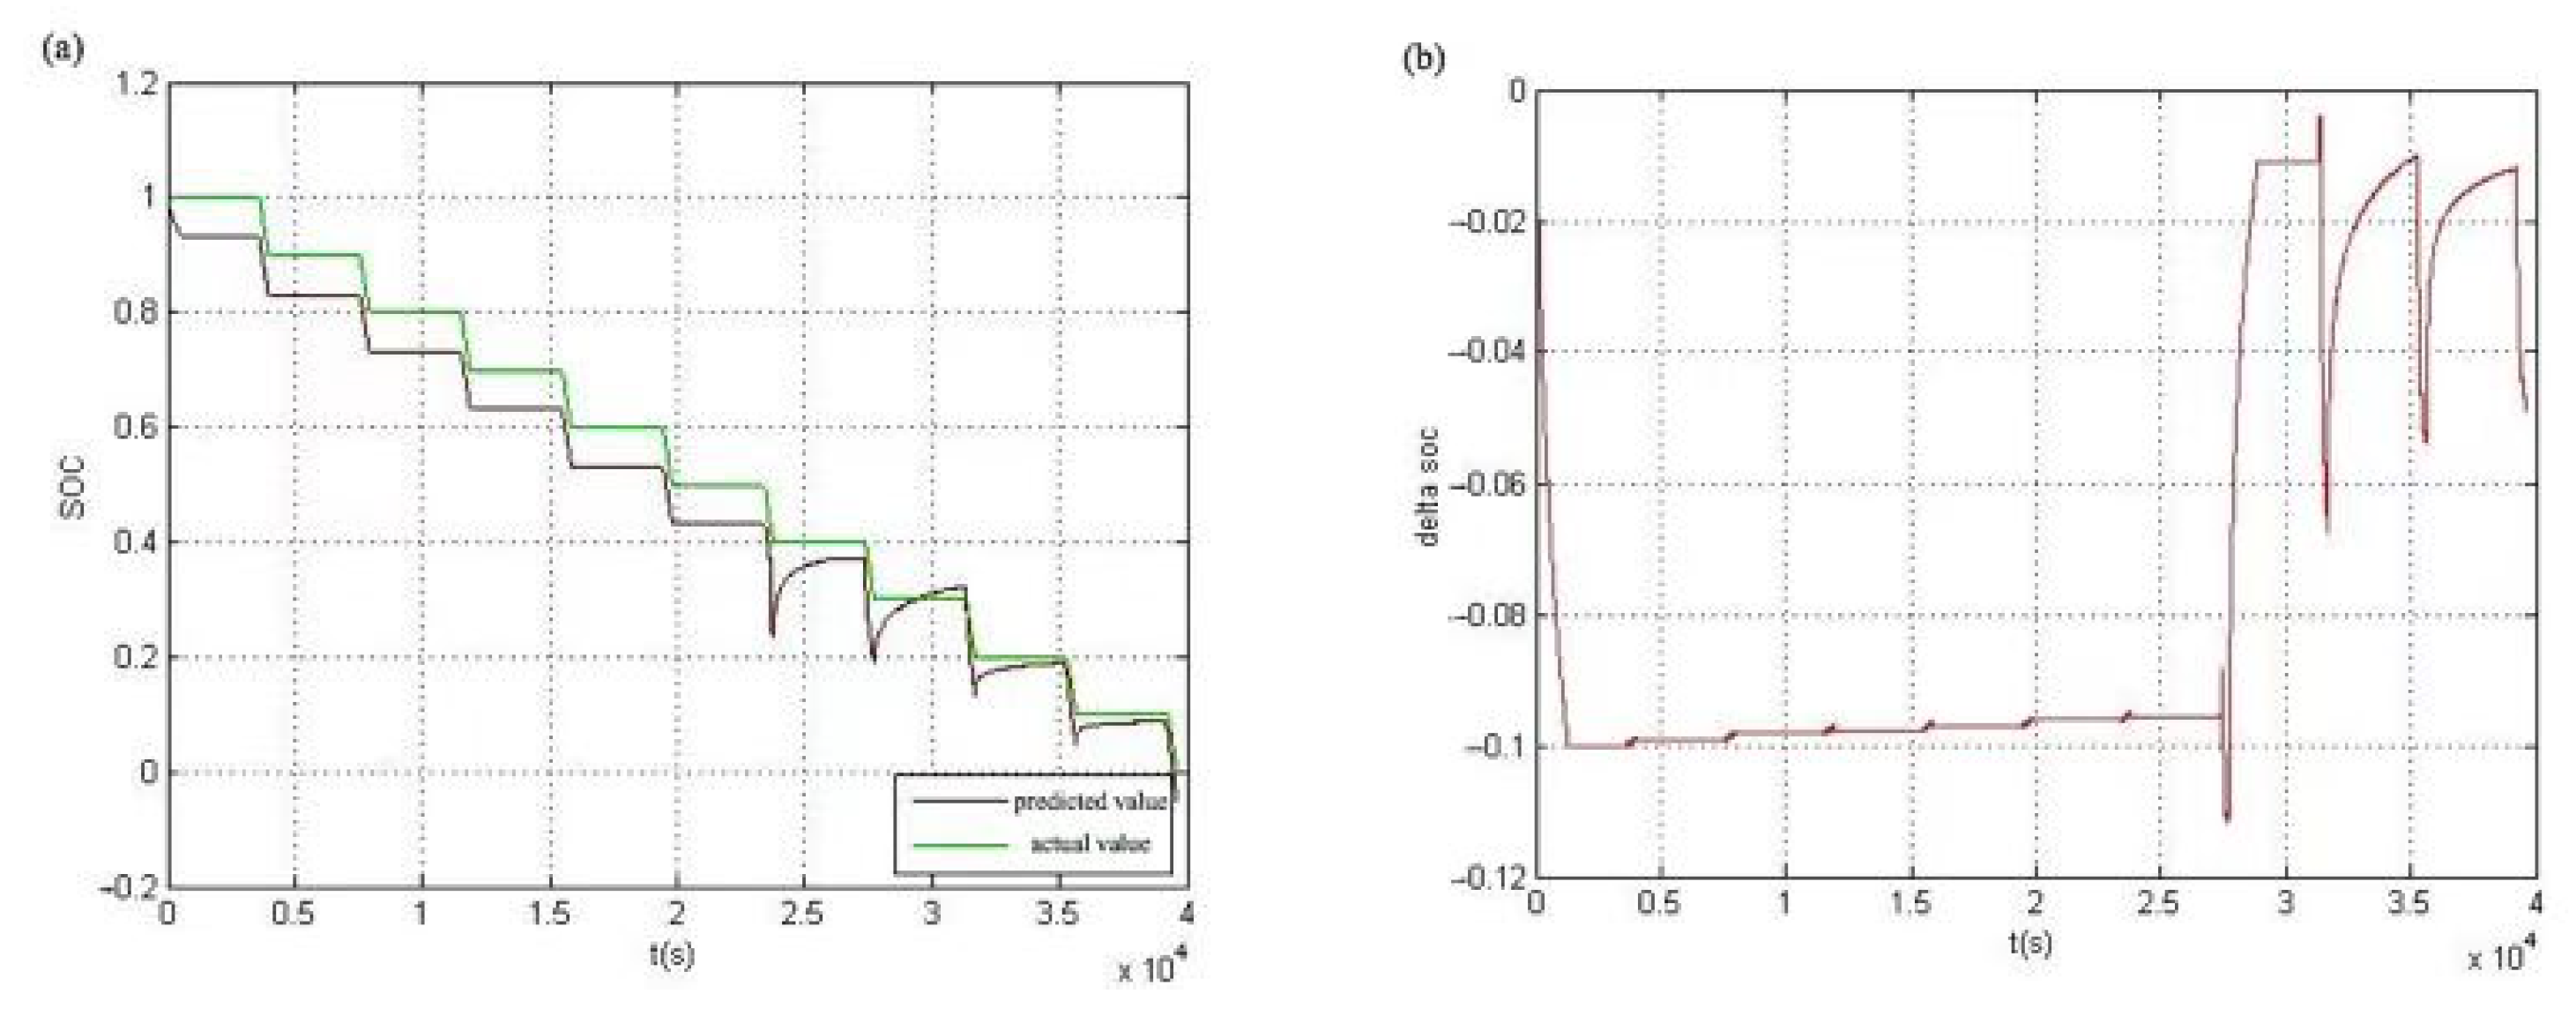
4.2.2. HPPC Test and Verification

In order to verify the estimation accuracy of the model under different voltage and current, the model was placed under HPPC experimental conditions and an HPPC test of HyLICs was conducted at room temperature [39]. The voltage and current data in the HPPC test are used as the algorithm input. The test was implemented in MATLAB. Figure 11a,b show the SOC estimation value obtained by the partition-estimation algorithm, the SOC value measured by the laboratory and the error of them, respectively.
It can be seen from Figure 11 that during the entire HPPC test process, the error between the predicted value of the partition-estimation algorithm and the actual measurement value is very small. It is only when the current pulses are too large, short in duration and recover quickly that large differences occur. Fast convergence proves that the algorithm has a good suppression effect on this disturbance. In addition, the average error between the predicted value and the actual value is 0.034 V, showing a high estimation and a strong algorithm reliability.

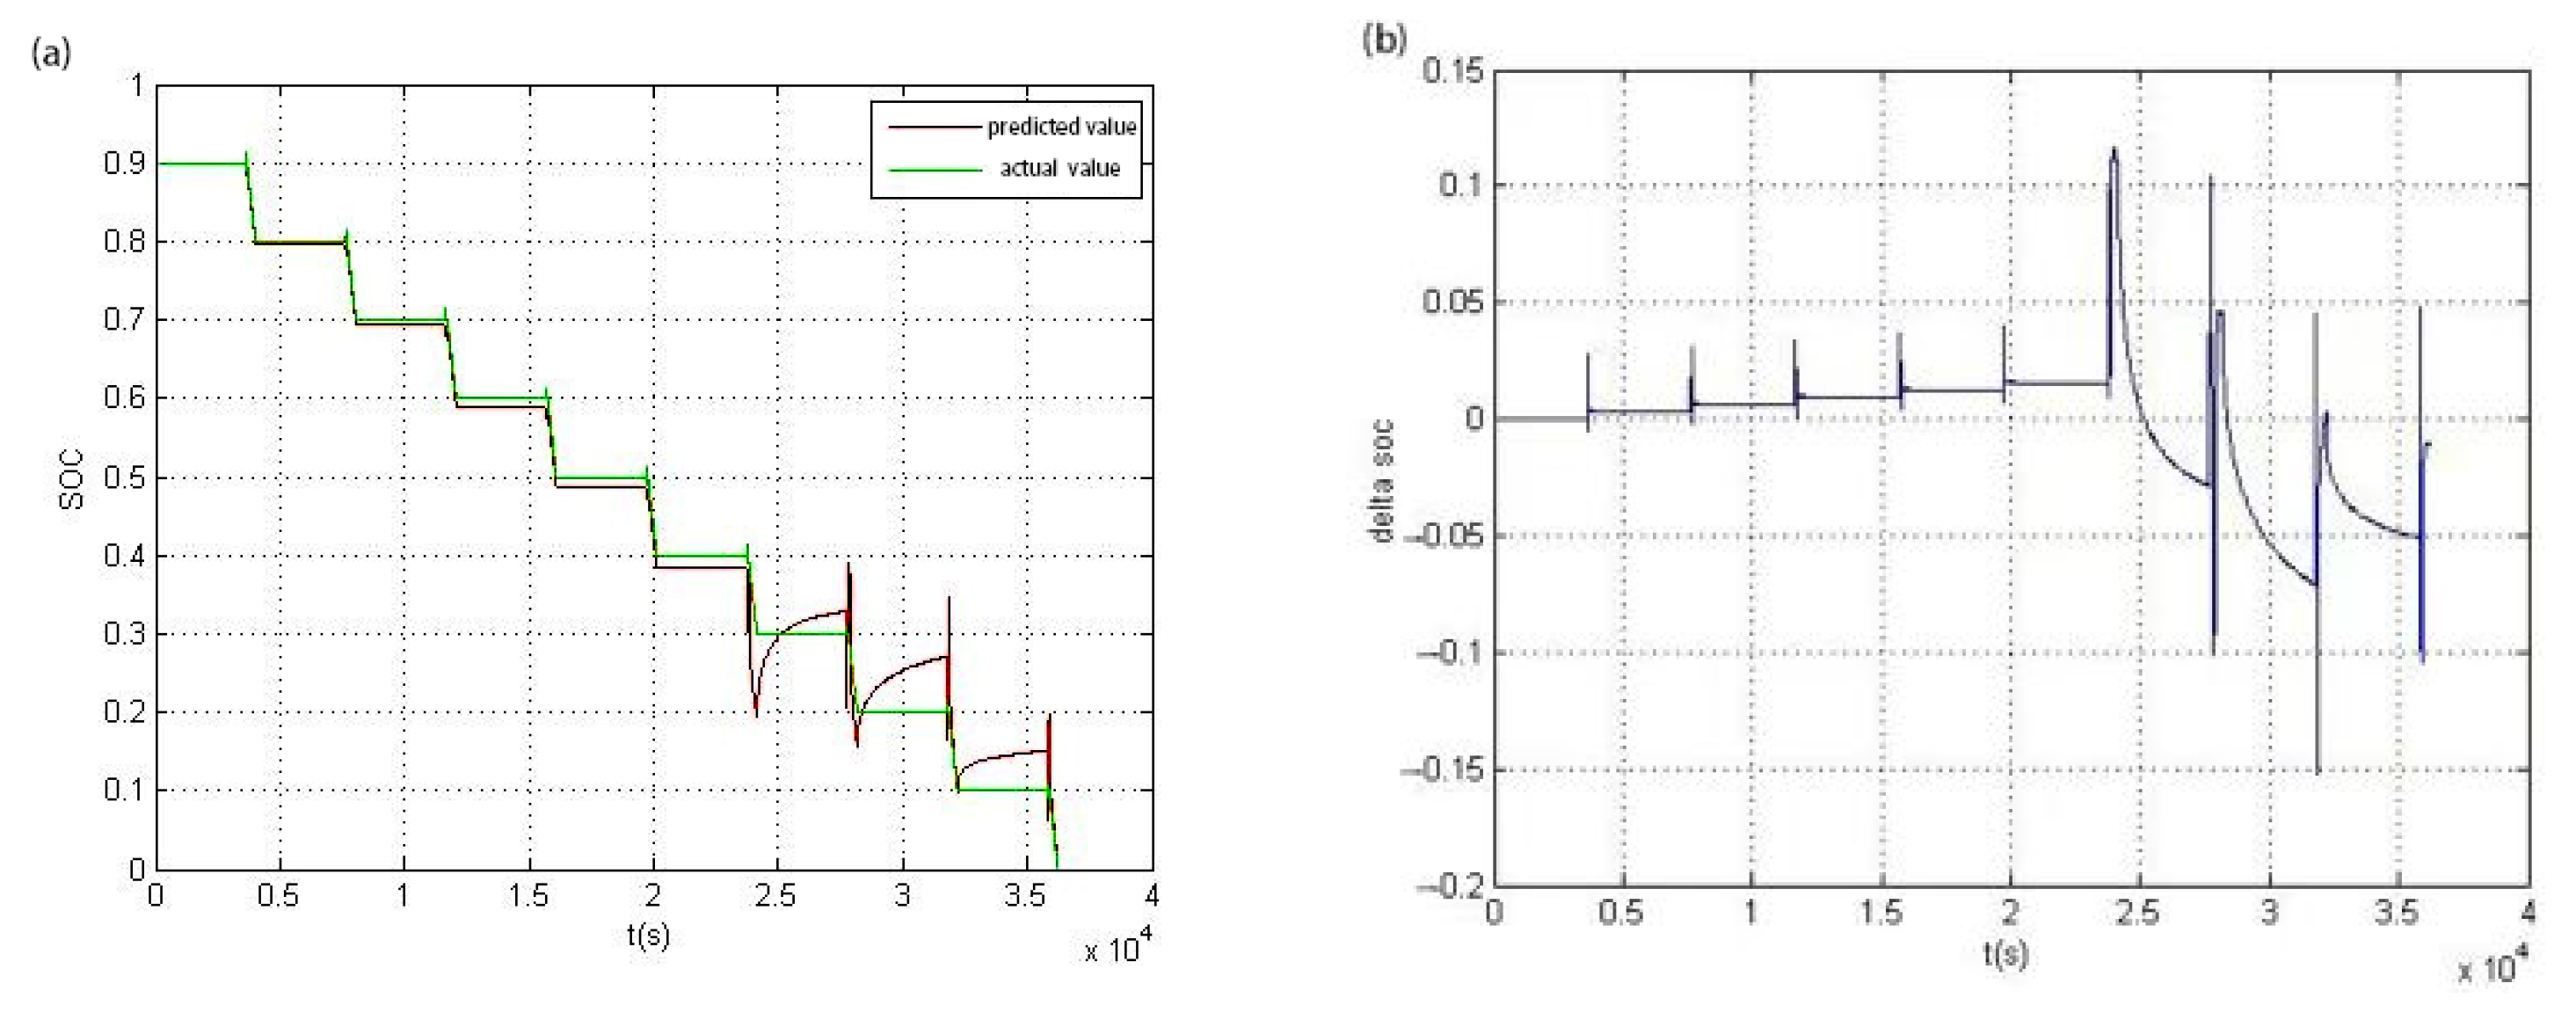
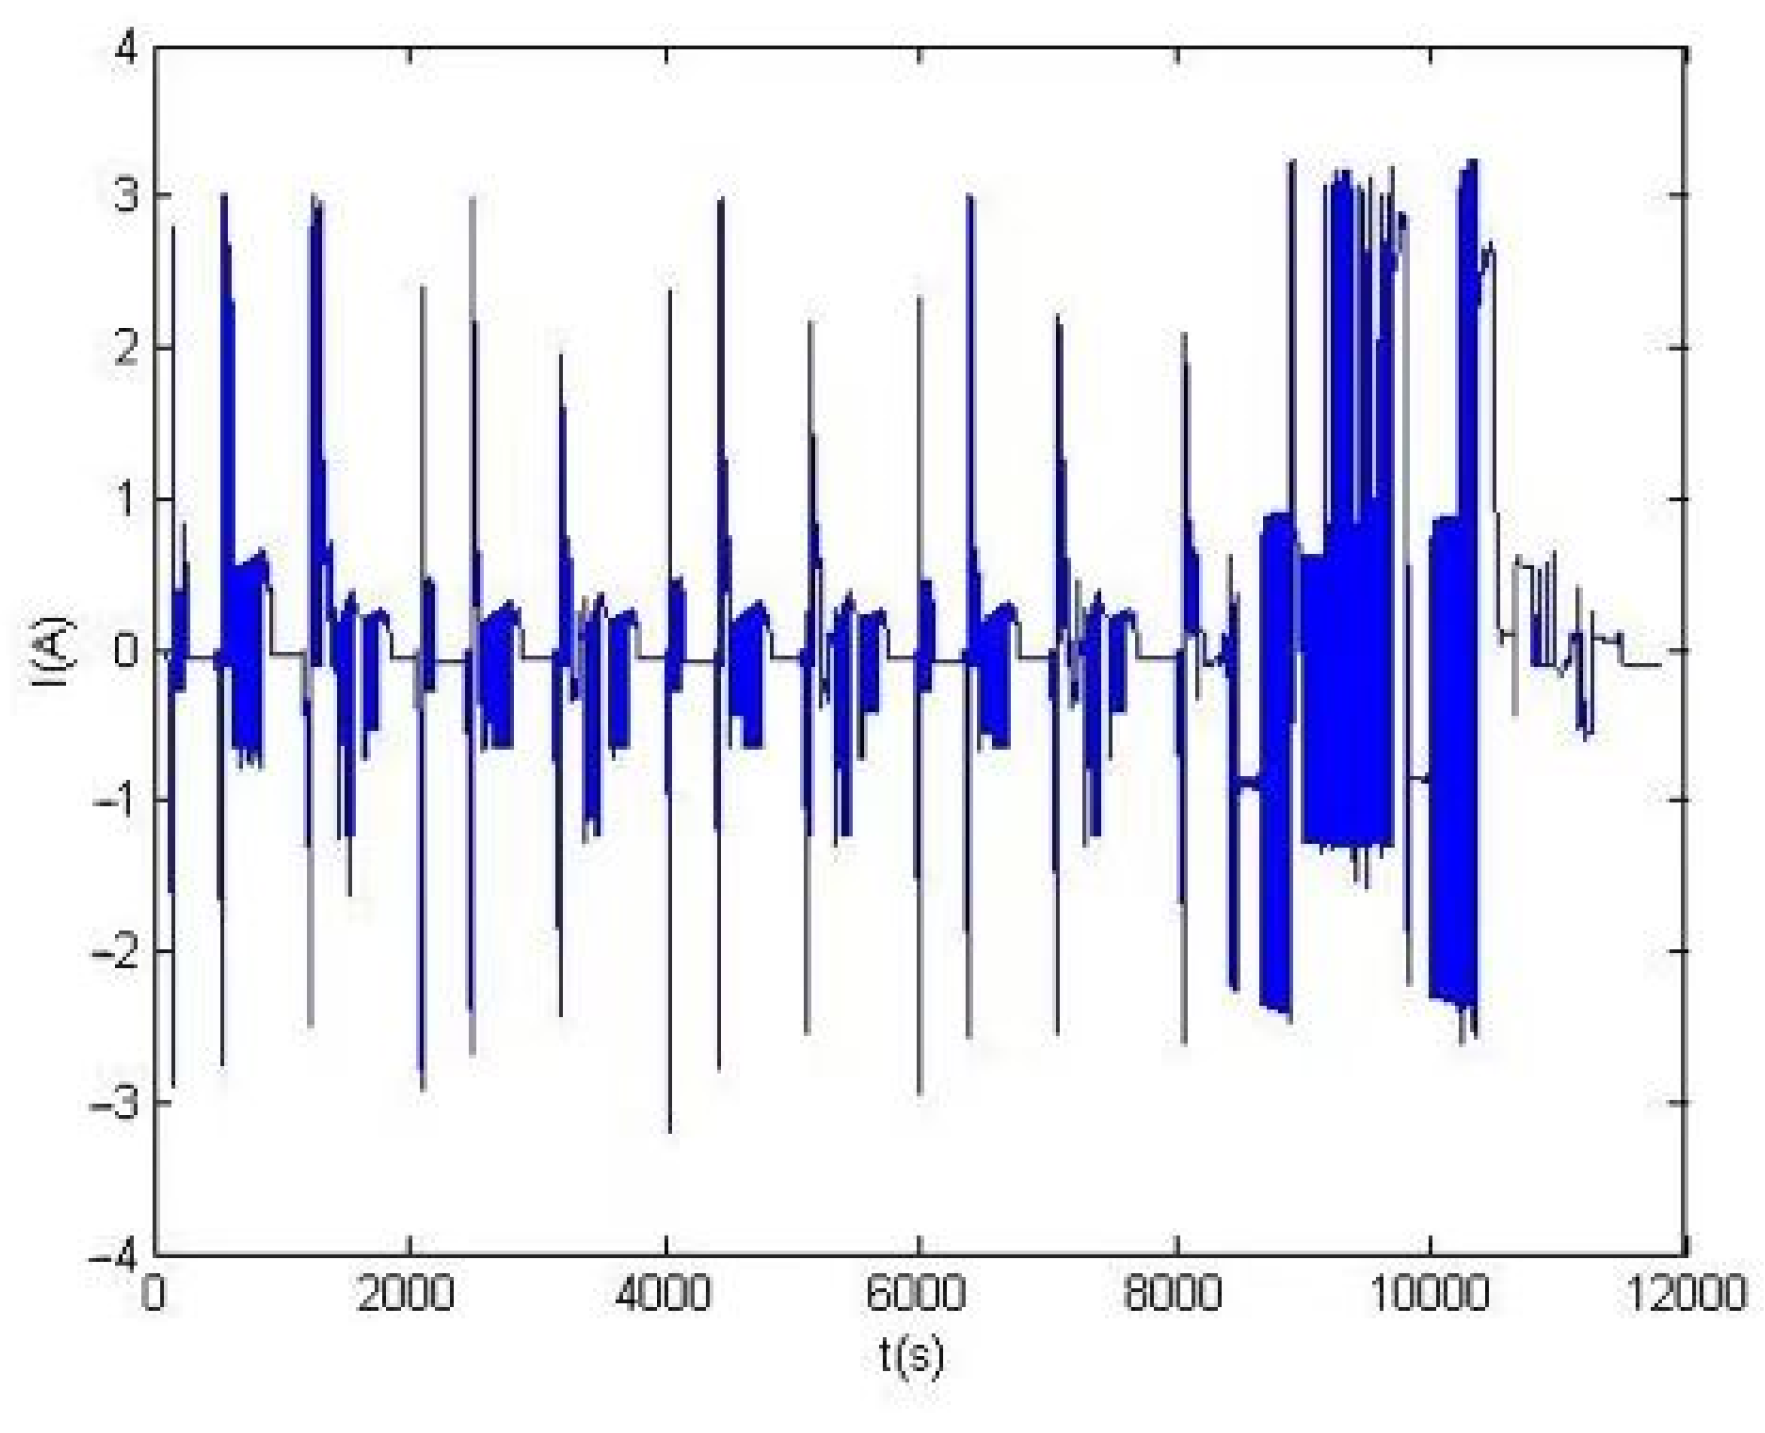
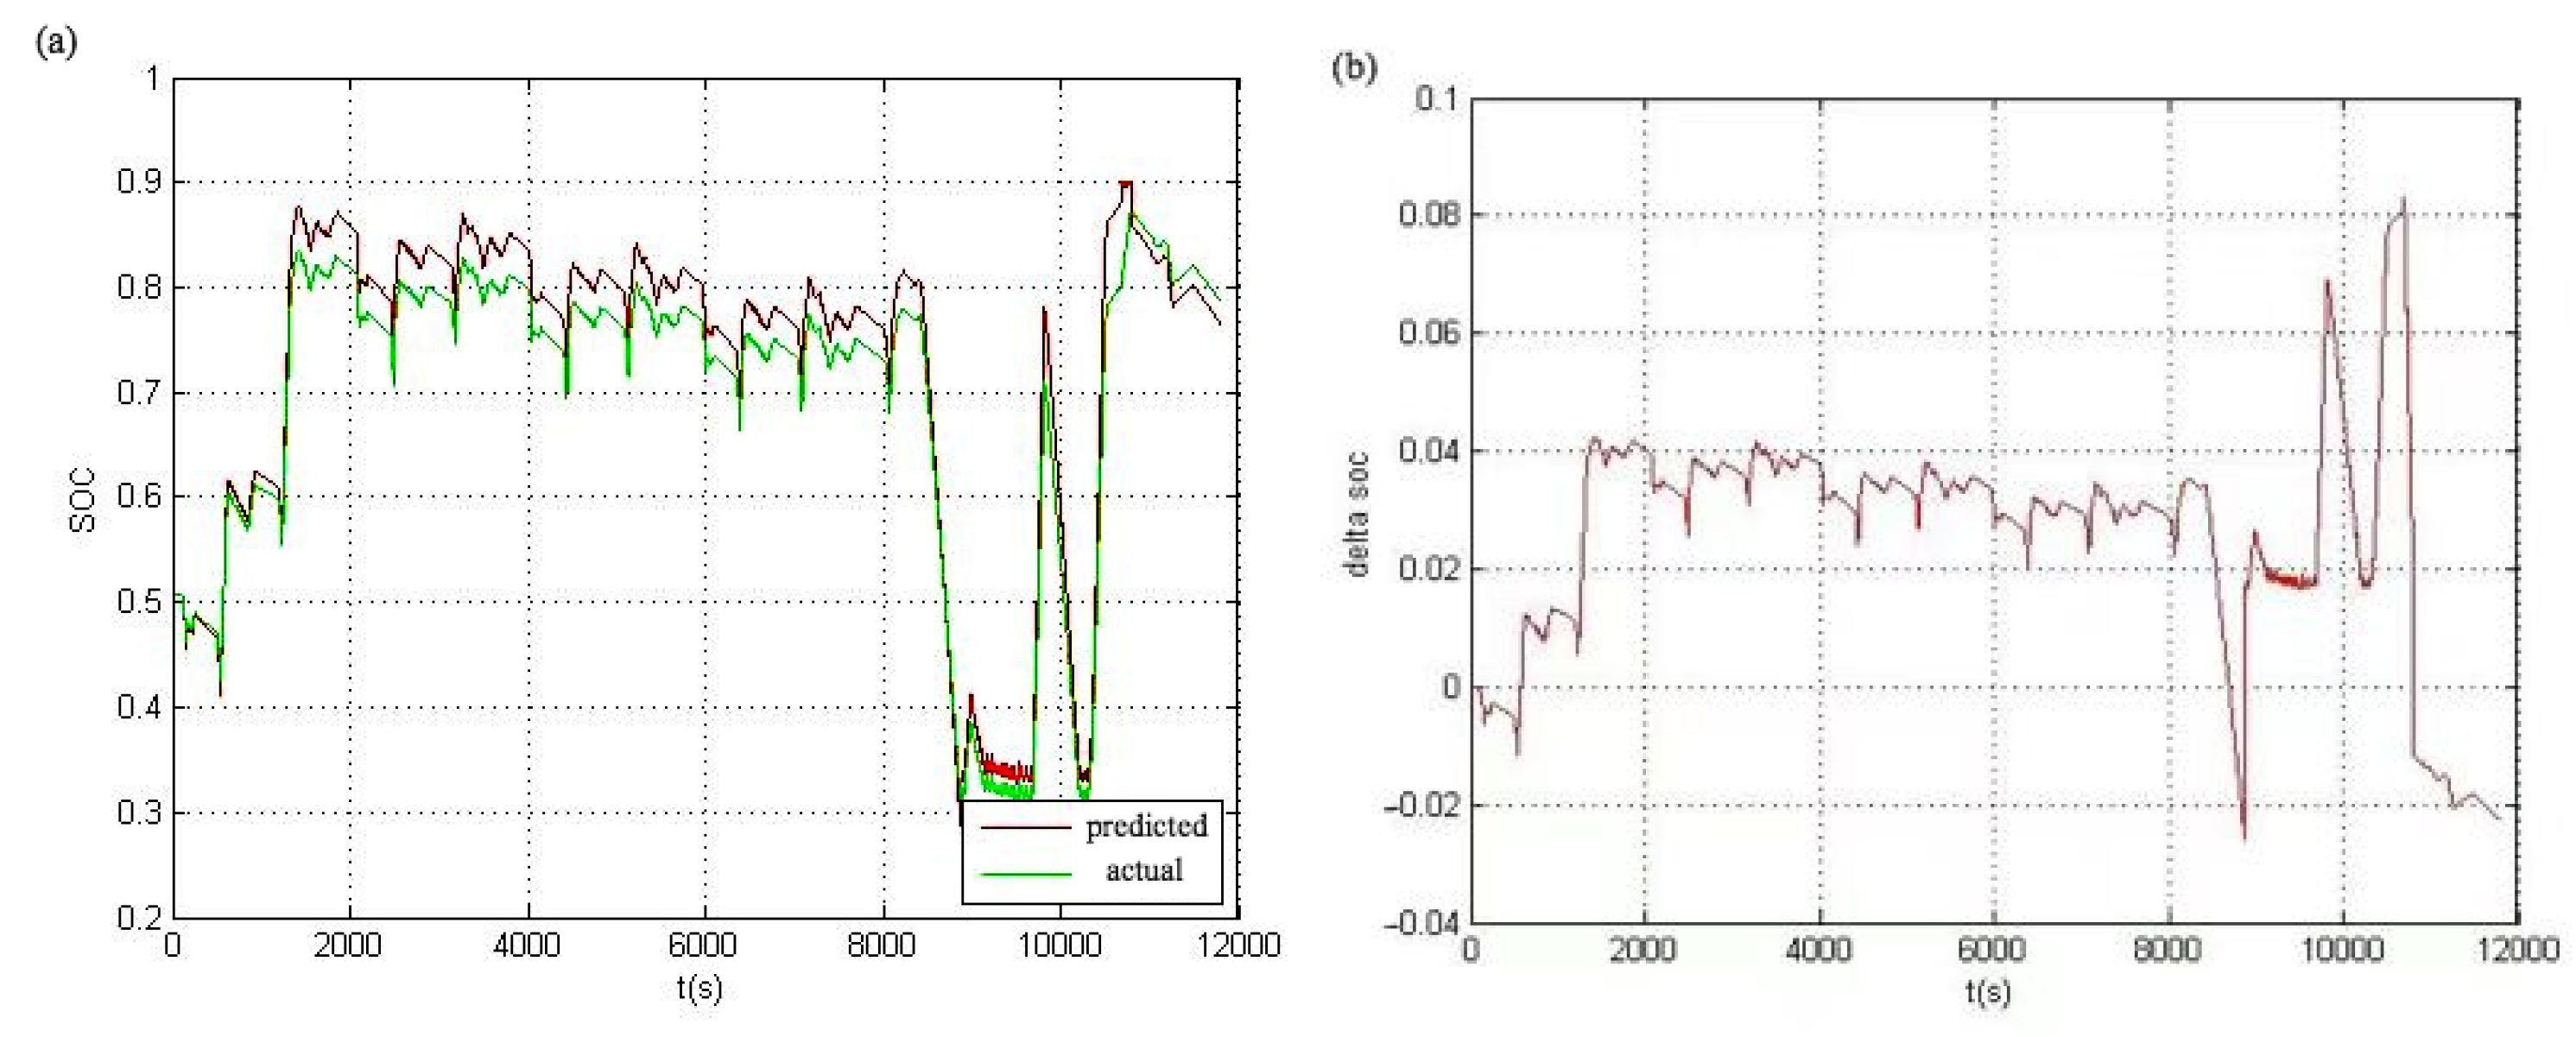
4.2.3. NEDC Cycle Verification

Tests in Section 4.2.1 and Section 4.2.2 were based on working conditions in a laboratory environment. However, in real vehicle-mounted working conditions, the operation of HyLICs is more complicated. To further verify the accuracy and reliability of the partition estimation method, applying the method to actual standard operating conditions, comparing the estimated results with the standard values of the conditions and analyzing the pros and cons of the algorithm seem quite necessary.
In order to exert the advantages of high power density and long cycle life of a lithium-ion capacitor, the energy power device of the 48 V vehicle start–stop system was adopted. The parallel mild hybrid system was formed with the internal combustion engine to achieve high energy-saving efficiency at relatively low cost, provide sufficient power when the vehicle starts and maximize the energy recovered during braking. With its typical characteristics of a nonlinear and time-varying energy-storage pattern, HyLICs used in this paper as start–stop power supply devices are mainly for the needs of urban operating conditions in China. Therefore, NEDC operating conditions are selected as the standard comprehensive operating conditions [40].
Through a NEDC cycle test, the NEDC operating-condition simulation in the 48 V hybrid-electric vehicle model was established, and the I-t, U-t, P-t and other relational curves of the battery working process under this operating condition were derived in the AVL-cruise software. The I-t curve is shown in Figure 12. According to the ampere-hour method, the relationship between the SOC of the power battery and the time under NEDC operating conditions can be calculated. The voltage and current values under NEDC operating conditions are used as the input of the partition-estimation algorithm in MATLAB. The estimated SOC value, the measured value and the difference between them are shown in Figure 13a,b. The average error between the estimated value and the measured value is 0.031 V, and the maximum error is 0.057 V. The error of this algorithm is within the accuracy range required by practical application, so it has high reliability.

5. Conclusions

In this article, from the perspective of the electrochemical-reaction principle of HyLICs, an SOC partition-estimation method based on its electrochemical characteristics was proposed. The accuracy was increased and the amount of calculation was deduced by combining the Extended Kalman filter (EKF) method and the ampere-hour (Ah) method at different phases. The proposed method was verified with the data under different working conditions by a valid battery model. The results show that the method can accurately estimate the SOC of the HyLICs. Based on this method’s accurate estimation, HyLICs-loaded vehicles are more competitive in the automotive industry’s development.
When selecting an equivalent-circuit model for lithium-ion capacitors, the Thevenin equivalent circuit model was chosen in consideration of factors such as model accuracy, real-time calculation and complexity of algorithm. However, during model validation, it was found that the Thevenin model was not sufficient to fully describe the external characteristics of lithium-ion capacitors in the low SOC range, which might affect the accuracy of the SOC estimation algorithm based on the model. Therefore, it was necessary to study and establish the HyLICs equivalent model superior to the Thevenin model while considering the model accuracy, computational real-time and algorithm complexity. The discharge open-circuit voltage test data and HPPC test data used in the verification of the SOC estimation algorithm in the paper were measured under laboratory conditions. The NEDC cycle working-condition data used were obtained by establishing a 48 V hybrid-electric vehicle model in AVL-cruise software and running the NEDC working condition simulation. Compared with the external characteristic data of the capacitor collected in real time under the actual operating condition, these data have less interference from pollution or noise. In later research, the real data collected to verify the feasibility of the SOC estimation algorithm will make the verification results more convincing.

Author Contributions

Conceptualization, X.H.; methodology, R.G.; software, X.H. and Z.W.; validation, R.G.; formal analysis, R.G.; investigation, L.Z. and X.T.; resources, Z.W.; data curation, S.S.; writing—original draft, L.Z.; writing—review and editing, L.Z. and X.L.; visualization, X.T.; supervision, S.S. and J.Z.; project administration, J.Z.; funding acquisition, X.T. and J.Z. All authors have read and agreed to the published version of the manuscript.

Funding

The work is supported by Key scientific and technological projects of China Huadian Corporation Ltd. (Grant No. CHDKJ20-01-111 and CHDER/MYZX-CG-2022-0022).

Institutional Review Board Statement

Not applicable.

Informed Consent Statement

Not applicable.

Data Availability Statement

Data is unavailable due to privacy.

Conflicts of Interest

The authors declare no conflict of interest.

References

  1. Liang, T.; Wang, H.W.; Fei, R.X.; Wang, R.; He, B.B.; Gong, Y.S.; Yan, C.J. A high-power lithium-ion hybrid capacitor based on a hollow N-doped carbon nanobox anode and its porous analogue cathode. Nanoscale 2019, 11, 20715–20724. [Google Scholar] [CrossRef]
  2. Yuan, J.; Qin, N.; Lu, Y.; Jin, L.; Zheng, J.; Zheng, J.P. The effect of electrolyte additives on the rate performance of hard carbon anode at low temperature for lithium-ion capacitor. Chin. Chem. Lett. 2022, 33, 3889–3893. [Google Scholar] [CrossRef]
  3. Zhang, J.; Wang, J.; Shi, Z.; Xu, Z. Mesoporous carbon material as cathode for high performance lithium-ion capacitor. Chin. Chem. Lett. 2018, 29, 620–623. [Google Scholar] [CrossRef]
  4. An, Z.X.; Fang, W.Y.; Xu, J.Q.; Zhang, J.J. Comparative analysis of electrochemical performances and capacity degrading behaviors in lithium-ion capacitors based on different anodic materials. Ionics 2019, 25, 3277–3285. [Google Scholar] [CrossRef]
  5. Navid, Q.; Hassan, A. An Accurate and Precise Grey Box Model of a Low-Power Lithium-Ion Battery and Capacitor/Supercapacitor for Accurate Estimation of State-of-Charge. Batteries 2019, 5, 50. [Google Scholar] [CrossRef] [Green Version]
  6. Kurzweil, P.; Shamonin, M. State-of-Charge Monitoring by Impedance Spectroscopy during Long-Term Self-Discharge of Supercapacitors and Lithium-Ion Batteries. Batteries 2018, 4, 35. [Google Scholar] [CrossRef] [Green Version]
  7. Liu, K.L.; Shang, Y.L.; Ouyang, Q.; Widanage, W.D. A Data-Driven Approach With Uncertainty Quantification for Predicting Future Capacities and Remaining Useful Life of Lithium-ion Battery. IEEE Trans. Ind. Electron. 2021, 68, 3170–3180. [Google Scholar] [CrossRef]
  8. El Ghossein, N.; Sari, A.; Venet, P. Lifetime Prediction of Lithium-Ion Capacitors Based on Accelerated Aging Tests. Batteries 2019, 5, 28. [Google Scholar] [CrossRef] [Green Version]
  9. Lin, C.; Mu, H.; Xiong, R.; Shen, W.X. A novel multi-model probability battery state of charge estimation approach for electric vehicles using H-infinity algorithm. Appl. Energy 2016, 166, 76–83. [Google Scholar] [CrossRef]
  10. Lipu, M.S.H.; Hannan, M.A.; Hussain, A.; Ayob, A.; Saad, M.H.M.; Karim, T.F.; How, D.N.T. Data-driven state of charge estimation of lithium-ion batteries: Algorithms, implementation factors, limitations and future trends. J. Clean. Prod. 2020, 277, 124110. [Google Scholar] [CrossRef]
  11. Pan, H.H.; Lu, Z.Q.; Lin, W.L.; Li, J.Z.; Chen, L. State of charge estimation of lithium-ion batteries using a grey extended Kalman filter and a novel open-circuit voltage model. Energy 2017, 138, 764–775. [Google Scholar] [CrossRef]
  12. El Ghossein, N.; Sari, A.; Venet, P. Development of a Capacitance versus Voltage Model for Lithium-Ion Capacitors. Batteries 2020, 6, 54. [Google Scholar] [CrossRef]
  13. Zheng, Y.J.; Ouyang, M.G.; Han, X.B.; Lu, L.G.; Li, J.Q. Investigating the error sources of the online state of charge estimation methods for lithium-ion batteries in electric vehicles. J. Power Sources 2018, 377, 161–188. [Google Scholar] [CrossRef]
  14. Liu, S.Q.; Wang, J.H.; Liu, Q.S.; Tang, J.; Liu, H.L.; Zhou, Y.; Pan, X.Y. A Novel Discharge Mode Identification Method for Series-Connected Battery Pack Online State-of-Charge Estimation Over A Wide Life Scale. IEEE Trans. Power Electron. 2021, 36, 326–341. [Google Scholar] [CrossRef]
  15. He, H.W.; Zhang, X.W.; Xiong, R.; Xu, Y.L.; Guo, H.Q. Online model-based estimation of state-of-charge and open-circuit voltage of lithium-ion batteries in electric vehicles. Energy 2012, 39, 310–318. [Google Scholar] [CrossRef]
  16. Li, Y.; Guo, H.; Qi, F.; Guo, Z.P.; Li, M.Y. Comparative Study of the Influence of Open Circuit Voltage Tests on State of Charge Online Estimation for Lithium-Ion Batteries. IEEE Access 2020, 8, 17535–17547. [Google Scholar] [CrossRef]
  17. Wei, M.; Ye, M.; Li, J.B.; Wang, Q.; Xu, X.X. State of Charge Estimation of Lithium-Ion Batteries Using LSTM and NARX Neural Networks. IEEE Access 2020, 8, 189236–189245. [Google Scholar] [CrossRef]
  18. Ma, Y.Y.; Wu, L.F.; Guan, Y.; Peng, Z. The capacity estimation and cycle life prediction of lithium-ion batteries using a new broad extreme learning machine approach. J. Power Sources 2020, 476, 228581. [Google Scholar] [CrossRef]
  19. Li, J.B.; Ye, M.; Meng, W.; Xu, X.X.; Jiao, S.J. A Novel State of Charge Approach of Lithium Ion Battery Using Least Squares Support Vector Machine. IEEE Access 2020, 8, 195398–195410. [Google Scholar] [CrossRef]
  20. Chen, L.; Chen, J.; Wang, H.M.; Wang, Y.J.; An, J.J.; Yang, R.; Pan, H.H. Remaining Useful Life Prediction of Battery Using a Novel Indicator and Framework With Fractional Grey Model and Unscented Particle Filter. IEEE Trans. Power Electron. 2020, 35, 5850–5859. [Google Scholar] [CrossRef]
  21. Hussein, A.A. Derivation and Comparison of Open-Loop and Closed-Loop Neural Network Battery State-of-Charge Estimators. In Proceedings of the 7th International Conference on Applied Energy (ICAE), Abu Dhabi, United Arab Emirates, 28–31 March 2015; pp. 1856–1861. [Google Scholar]
  22. Malkhandi, S. Fuzzy logic-based learning system and estimation of state-of-charge of lead-acid battery. Eng. Appl. Artif. Intell. 2006, 19, 479–485. [Google Scholar] [CrossRef]
  23. Yang, F.F.; Song, X.B.; Xu, F.; Tsui, K.L. State-of-Charge Estimation of Lithium-Ion Batteries via Long Short-Term Memory Network. IEEE Access 2019, 7, 53792–53799. [Google Scholar] [CrossRef]
  24. Xia, B.Z.; Cui, D.Y.; Sun, Z.; Lao, Z.Z.; Zhang, R.F.; Wang, W.; Sun, W.; Lai, Y.Z.; Wang, M.W. State of charge estimation of lithium-ion batteries using optimized Levenberg-Marquardt wavelet neural network. Energy 2018, 153, 694–705. [Google Scholar] [CrossRef]
  25. Waag, W.; Fleischer, C.; Sauer, D.U. Critical review of the methods for monitoring of lithium-ion batteries in electric and hybrid vehicles. J. Power Sources 2014, 258, 321–339. [Google Scholar] [CrossRef]
  26. Mousavi, G.S.M.; Nikdel, M. Various battery models for various simulation studies and applications. Renew. Sustain. Energy Rev. 2014, 32, 477–485. [Google Scholar] [CrossRef]
  27. Zou, Y.; Hu, X.S.; Ma, H.M.; Li, S.E. Combined State of Charge and State of Health estimation over lithium-ion battery cell cycle lifespan for electric vehicles. J. Power Sources 2015, 273, 793–803. [Google Scholar] [CrossRef]
  28. Seaman, A.; Dao, T.S.; McPhee, J. A survey of mathematics-based equivalent-circuit and electrochemical battery models for hybrid and electric vehicle simulation. J. Power Sources 2014, 256, 410–423. [Google Scholar] [CrossRef] [Green Version]
  29. Yu, Y.X.; Mao, J.S.; Chen, X.X. Comparative analysis of internal and external characteristics of lead-acid battery and lithium-ion battery systems based on composite flow analysis. Sci. Total Environ. 2020, 746, 140763. [Google Scholar] [CrossRef]
  30. Lourakis, M.I.A.; Argyros, A.A. Is Levenberg-Marquardt the Most Efficient Optimization Algorithm for Implementing Bundle Adjustment? In Proceedings of the 10th IEEE International Conference on Computer Vision (ICCV 2005), Beijing, China, 17–20 October 2005; pp. 1526–1531. [Google Scholar]
  31. Hu, X.S.; Li, S.B.; Peng, H. A comparative study of equivalent circuit models for Li-ion batteries. J. Power Sources 2012, 198, 359–367. [Google Scholar] [CrossRef]
  32. He, H.W.; Xiong, R.; Peng, J.K. Real-time estimation of battery state-of-charge with unscented Kalman filter and RTOS mu COS-II platform. Appl. Energy 2016, 162, 1410–1418. [Google Scholar] [CrossRef]
  33. Chen, B.; Ma, H.D.; Fang, H.Z.; Fan, H.Z.; Luo, K.; Fan, B. An Approach for State of Charge Estimation of Li-ion Battery Based on Thevenin Equivalent Circuit model. In Proceedings of the Prognostics and System Health Management Conference (PHM- Hunan), Lab Sci & Technol Integrated Logist Support, Zhangjiajie, China, 24–27 August 2014; pp. 647–652. [Google Scholar]
  34. Huo, Y.T.; Hu, W.; Li, Z.; Rao, Z.H. Research on parameter identification and state of charge estimation of improved equivalent circuit model of Li-ion battery based on temperature effects for battery thermal management. Int. J. Energy Res. 2020, 44, 11583–11596. [Google Scholar] [CrossRef]
  35. He, H.W.; Qin, H.Z.; Sun, X.K.; Shui, Y.P. Comparison Study on the Battery SoC Estimation with EKF and UKF Algorithms. Energies 2013, 6, 5088–5100. [Google Scholar] [CrossRef] [Green Version]
  36. Yang, Y.H.; Nagayama, T.; Xue, K. Structure system estimation under seismic excitation with an adaptive extended kalman filter. J. Sound Vib. 2020, 489, 115690. [Google Scholar] [CrossRef]
  37. Xu, J.; Gao, M.; He, Z.; Han, Q.; Wang, X. State of Charge Estimation Online Based on EKF-Ah Method for Lithium-Ion Power Battery. In Proceedings of the 2nd International Congress on Image and Signal Processing, Tianjin, China, 17–19 October 2009; pp. 4120–4124. [Google Scholar]
  38. Liu, Z.X.; Li, Z.; Zhang, J.B.; Su, L.S.; Ge, H. Accurate and Efficient Estimation of Lithium-Ion Battery State of Charge with Alternate Adaptive Extended Kalman Filter and Ampere-Hour Counting Methods. Energies 2019, 12, 757. [Google Scholar] [CrossRef] [Green Version]
  39. He, L.; Hu, M.K.; Wei, Y.J.; Liu, B.J.; Shi, Q. State of charge estimation by finite difference extended Kalman filter with HPPC parameters identification. Sci. China Technol. Sci. 2020, 63, 410–421. [Google Scholar] [CrossRef]
  40. Shim, B.J.; Park, K.S.; Koo, J.M.; Jin, S.H. Work and speed based engine operation condition analysis for new European driving cycle (NEDC). J. Mech. Sci. Technol. 2014, 28, 755–761. [Google Scholar] [CrossRef]
Figure 1. Electrochemical impedance equivalent circuit model.
Batteries 09 00163 g001
Figure 2. Electrochemical impedance spectroscopy of HyLICs.
Batteries 09 00163 g002
Figure 3. Capacitor impedance changes with terminal voltage of HyLICs.
Batteries 09 00163 g003
Figure 4. Classification results based on electrochemical characteristics of HyLICs.
Batteries 09 00163 g004
Figure 5. The first-order RC equivalent circuit model.
Batteries 09 00163 g005
Figure 6. The OCV–SOC curve after the parameter identification.
Batteries 09 00163 g006
Figure 7. SOC partition-estimation method based on electrochemical characteristics.
Batteries 09 00163 g007
Figure 8. HyLICs Simulink model.
Batteries 09 00163 g008
Figure 9. Comparison chart of predicted terminal voltage and actual value.
Batteries 09 00163 g009
Figure 10. Comparison chart of (a) predicted SOC and actual value; (b) the difference through discharge OCV test.
Batteries 09 00163 g010
Figure 11. Comparison chart of (a) predicted SOC and actual value; (b) the difference through HPPC test.
Batteries 09 00163 g011
Figure 12. The I-t curve at the loading profiles of NEDC.
Batteries 09 00163 g012
Figure 13. Comparison chart of (a) predicted terminal voltage and actual value; (b) the difference through NEDC cycle test.
Batteries 09 00163 g013
Disclaimer/Publisher’s Note: The statements, opinions and data contained in all publications are solely those of the individual author(s) and contributor(s) and not of MDPI and/or the editor(s). MDPI and/or the editor(s) disclaim responsibility for any injury to people or property resulting from any ideas, methods, instructions or products referred to in the content.

