Abstract
When using lithium-ion batteries (LiBs) with nickel-rich cathodes, safety issues such as thermal runaway (TR) propagation must be considered. To design safe LiBs, effective countermeasures against TR propagation must be developed. For this purpose, knowledge about the TR behaviour, especially the TR onset temperature, of fresh and aged lithium-ion cells is required. Therefore, the aim of this work is to investigate the TR behaviour of several fresh and aged lithium-ion cells with different cathode chemistries in overtemperature tests using an oven test setup to determine changes in the TR behaviour due to cyclisation. For the investigation of the TR behaviour of large format lithium-ion cells, the oven test setup turns out to be an effective alternative to the accelerating rate calorimetry test. Analysing the results shows that the initial TR temperature after cyclisation for one cell chemistry is significantly decreased due to the failure of one cell component. In addition, from a series of tests and the measured TR onset temperatures it can be deduced that an underlying probability distribution should be taken into account when designing safe LiBs.
1. Introduction
Lithium-ion batteries (LiBs) are widely used in the latest mobile applications or electric vehicles (EVs) [1]. In order to extend the total range of EVs, in many applications nickel-rich cathodes are used in modern LiBs [2]. This technology comes with an increased energy density, while the thermal stability may be lower compared to other battery cathode materials, leading to safety issues such as thermal runaway (TR) [3,4]. If a single-cell TR happens inside a battery module, a large amount of heat is released, which may lead to a TR of neighbouring cells [5]. This TR propagation is one of the major issues to be solved for the development of safe battery packs [6]. Therefore, specific knowledge about the TR behaviour of the lithium-ion cells that are used within the battery design process is crucial.
A typical TR process of lithium-ion cells may include ejection of material and gas, ignition and combustion. Once the critical temperature of a lithium-ion cell is exceeded, exothermic reactions between the different cell components begin, which results in a rapid increase in cell temperature and further exothermic reactions. In this context, the TR behaviour of a cell is characterized by three safety relevant temperatures: The onset temperature of self-heating , the onset temperature of TR and the maximum temperature [7,8]. To avoid TR propagation, a cell temperature below must be guaranteed for neighbouring cells within the LiB [9]. In addition, when comparing the functionality of safety devices of large prismatic lithium-ion cells, two other safety-relevant temperatures should be evaluated: the activation temperature of the relief valve and the overcharge safety device (OSD) [10,11].
The TR process and the occurring exothermic reactions have been analysed in the literature by using differential scanning calorimetry (DSC) [12,13] and accelerating rate calorimetry (ARC) [14,15]. If the cell temperature exceeds (80–120 C), the solid electrolyte interface (SEI) film is decomposed. This reaction generates heat, leading to self-heating of the cells [16]. Once the SEI film is seriously damaged, lithiated graphite on the anode begins to react with electrolyte and the binder (around 120–140 C) [17,18], which results in an accelerated self-heating process. If the melting temperature of the separator is reached, an internal short circuit (ISC) occurs with a collapsing separator [19]. The onset temperature for the ISC depends significantly on the separator material. The ISC occurs approximately at when a PE separator is used, at for PP separators or at more than if the separator has a ceramic coating [20]. The heating process intensifies through the decomposition of the cathode material around [21,22], which generates a significant amount of oxygen [23]. As a result, the generated oxygen may oxidize the electrolyte [24] or react with the lithiated graphite, generating a large amount of heat and resulting in TR at the onset temperature with a maximum temperature of [25]. In the literature, is defined as the point where the self-heating rate of the cell reaches [26].
Previous work has shown that the safety risk related to the TR in fully charged cells is most critical compared to other states of charge (SOC) [22,27]. Those results were confirmed for large and small format lithium-ion cells [28,29], as well as for different cathode chemistries [30].
Some thermal safety issues of fresh LiBs at the beginning of their life can be avoided through chemistry design or battery management systems [31]. Whereas others, such as penetration- and crush-triggered TR, cannot be avoided by these methods [20]. However, the TR behaviour of aged LiBs might differ from fresh LiBs [32,33], leading to enhanced safety risks. Therefore, during battery design it is important to consider possible influences of ageing effects on the TR behaviour to ensure safe operation of the LiBs over the entire battery lifetime.
Some researchers described that LiBs degraded under high-temperature storage exhibit an improved thermal stability with a higher during TR [34] without analysing the ageing effects leading to the improved thermal stability. Abada et al. concluded that an improved thermal stability can be explained by the thickening of the SEI film [7], which is the main effect of calendrical ageing [35]. Other studies focusing on the influences of cyclization on the TR behaviour have shown that some ageing processes lead to a decreased thermal stability with lower and , without identifying the ageing process itself [36,37]. However, a detailed investigation of the influence of ageing effects on the TR behaviour is given by Ren et al. [38]. According to this research, a decay in thermal stability is only observed if lithium plating or deposition occurs during degradation of the cell. Other ageing effects, such as cathode particle cracking or cathode electrolyte interphase film formation, do not result in any obvious changes in TR behaviour [38].
According to the existing literature, some regular ageing effects, such as lithium plating or SEI film thickening, as well as the SOC clearly affect TR behaviour. However, current research mostly focuses on investigating the influence of these regular ageing effects on TR behaviour. This means that other effects that could occur during cyclisation, such as the mechanical failure of a cell component, e.g. due to delamination of the ceramic coating of the separator, are not considered. Therefore, comprehensive studies are required to gather knowledge about the TR process of fresh and aged lithium-ion cells.
The aim of this work is to investigate the TR behaviour of several fresh and aged lithium-ion cells with different cathode chemistries to determine changes in the TR behaviour due to cyclisation. Therefore, overtemperature tests are performed in an oven test setup, which operates on the heat-wait-seek method described by Lei et al. [39] similarly to the ARC. For this purpose, the cells are cycled under normal conditions. Therefore, plating or lithium deposition effects that could have an influence on the TR process are not expected. However, a massive decay in thermal stability after cyclization is observed in one cell type, which is triggered by the delamination of the ceramic coating of the separator. Furthermore, from a small series of overtemperature tests and the measured TR onset temperature , which is relevant for the development of effective countermeasures against TR propagation [9], it can deduced that an underlying probability distribution should be considered in the development of safe LiBs. The results presented in this paper provide novel insights into the TR behaviour of fresh and aged large format lithium-ion cells, from which necessary conclusions can be drawn in order to develop safe LiB systems.
2. Experimental Procedures
2.1. Test Samples
In this study, two different types of commercial prismatic cells in the PHEV2 format are investigated. The anode material of both cell types is graphite, whereas the cathode material differs. The first cell type uses a (NMC111) cathode and the second cell type a (NMC622) cathode, respectively. Both cell types come with an organic -based carbonate electrolyte. Additionally, both cell types take advantage of a ceramic-coated separator, in order to increase the onset temperature of TR and the thermal stability. A detailed summary of the cell parameters is listed in Table 1.

Table 1.
Cell parameters.
2.2. Ageing Procedure
The cell capacities are determined by a reference performance test (RPT) at prior to the ageing test. During the RPT, the cells are cycled according to the following procedure:
- (1)
- CC(1C)-CV charge to until the charging current is reduced to
- (2)
- Rest for 30 min
- (3)
- CC(1C) discharge to for cell type 1 and 2, respectively. According to the respective cell specifications
- (4)
- Rest for 30 min
The initial cell capacity is determined as the discharge cell capacity of the third cycle.
The state of health (SOH) is defined as the relative capacity
where C is the discharge capacity of the cell during cycling.
The ageing sequence follows the RPT procedure at an ambient temperature of to cycle four cells of each cell type until 90% (type 1) or 80% (type 2), respectively. In order to simulate the integration of one cell into a module stack surrounded by a prestressed frame, each discharged cell is mounted between two steel plates with an initial force of .
The cells are tested with a multichannel battery testing system (BaSyTec XCTS50) and a climate chamber (ESPEC PU-3KP) to control the ambient temperature.
2.3. Electrochemical Impedance Spectroscopy (EIS)
In order to investigate any changes in cell impedance after cyclization, EIS is performed on one cell of each type at fresh and cycled state. Therefore, the cells are fully charged at by CC-CV charging prior to EIS. Afterwards, the cell impedance is measured between and using eight frequencies per decade with a HIOKI BT4560. During EIS, all cells are located in a climate chamber (ESPEC PU-3KP) at and rested for to reach thermal equilibrium before conducting measurements.
2.4. Thermal Behaviour Test Procedure
Oven tests are performed on five fresh and three aged cells of each cell type to investigate the thermal stability and TR behaviour of the cells. Therefore, all cells are in a fully charged state, as described in several international norms [40,41]. A lithium-ion cell is referred to be more thermally stable, if the onset temperature of TR is higher compared to cells with a lower thermal stability and a lower , respectively [42].
An oven manufactured by HORO Dr. Hofmann GmbH is utilized for these tests. K-type thermocouples are used to measure temperatures at the cell surface and inside the oven, whereby the sampling rate of the thermocouple signals is 10 Hz. The thermocouple on the cell surface is attached using a thermally conductive adhesive, whereby the measuring point is additionally taped with glass fibre tape to insulate the measuring point from neighbouring surfaces. Each cell is mounted between two steel plates with an initial force of and tested in each oven test. Plasterboards are inserted between the steel plates and the cell to minimize the thermal coupling between the steel plates and the cell. The insertion of insulation ensures that the heat generated during TR is not immediately transferred to the rest of the measurement setup. Therefore, it is possible to estimate TR behaviour in a worst-case scenario with the help of the measured temperatures. The measurement setup and thermocouple positions are presented in Figure 1.
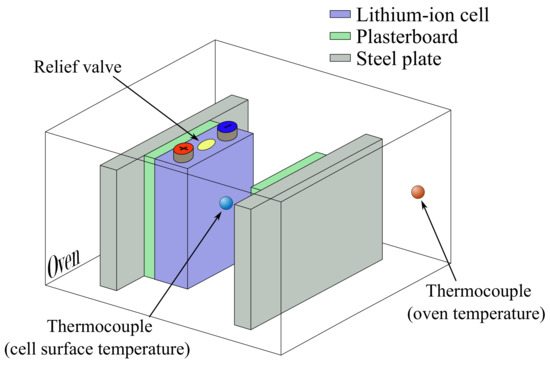
Figure 1.
Scheme of the oven test setup with the thermocouple positions.
During the thermal stability test, the oven is preheated to and rested for . After the initial preheating, the ambient temperature of the oven is increased in steps of , with resting periods of after each temperature step until a cell TR is detected, i.e., the measured cell surface temperature rate exceeds .
3. Results and Discussion
3.1. Cycling Performance and Degradation Behaviour
Figure 2 displays the degradation behaviour of each aged cell. As shown in Figure 2a, all type 2 cells reach 80% after only 956 to 1147 cycles, whereas the type 1 cells exhibit a better performance, with cycle numbers reaching from 1457 up to 1959 cycles at an of 90%. Although both cell types are cycled under normal conditions, an accelerated capacity loss of the type 2 cells is observed. In particular, a rapid loss of capacity is detected after about 850 cycles. This might be caused by changes in cell balancing during cyclization [43] which may lead to lithium deposition [44]. A steadily decreasing capacity is observed for type 1 cells. Therefore, an accelerated degradation behaviour due to lithium deposition is not to be expected in this case.
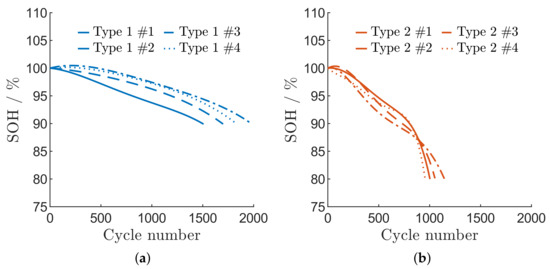
Figure 2.
Degradation behaviour of the aged cells. (a) cell type 1 until 90% SOH; (b) cell type 2 until 80% SOH.
After cyclization, one cell of each type is used for EIS tests. The impedance spectra of the aged and fresh cells are compared in Figure 3. In the following visual evaluation of the impedance spectra, the equivalent circuit model presented by Schmidt et al. [45] is used as a basis. According to Schmidt et al. [45], the characteristics of the SEI and charge transfer processes are represented by the total diameter of the impedance arc, while the electrolyte conductivity and electronic losses are modelled using an ohmic resistance by evaluating at . The SEI and charge transfer resistance is represented by the total diameter of the impedance arc, while the ohmic resistance of each cell can be obtained by evaluating at . Figure 3 shows, that both aged cells exhibit an increased impedance. The SEI and charge transfer characteristics of the aged type 2 cell show a significant change. The diameter of the impedance arc nearly multiplied by five compared to that of the fresh cell, while the diameter of the impedance arc of the type 1 cells remains unchanged. The most conspicuous change is an increase in ohmic resistance for both cell types. While the ohmic resistance of the aged type 2 cells increased only slightly, the ohmic resistance of the aged type 1 cell almost tripled. The observed increase in ohmic resistance may be caused by a reduced ionic conductivity of the electrolyte, for example due to electrolyte decomposition or loss in lithium inventory [46].
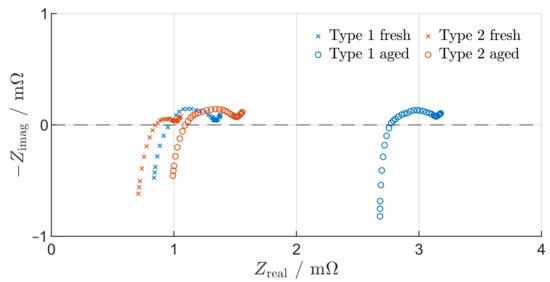
Figure 3.
Impedance spectra for fresh and aged cells of type 1 and 2 at 90% and 80% SOH, respectively.
After EIS, the fresh and aged cells are discharged to and , respectively, and disassembled under air atmosphere. The anodes harvested from these cells are presented in Figure 4. Since the cathodes of fresh and aged cells show little differences, they are not presented in this work. As shown in Figure 4a,b, the anodes of the fresh type 1 and 2 cells have a uniform graphite grey colour with no visible lithium depositions on the surface. The anode of the aged type 1 cell is similar to the fresh anode with no obvious changes in colour or visible depositions. A small amount of lithium deposition is detected on the surface of the anode of the aged type 2 cell, turning the colour into silver grey locally, which is consistent with the analysis of the degradation behaviour from Figure 2 and Figure 3.
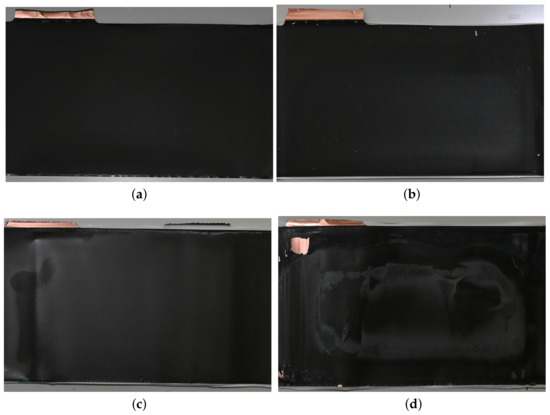
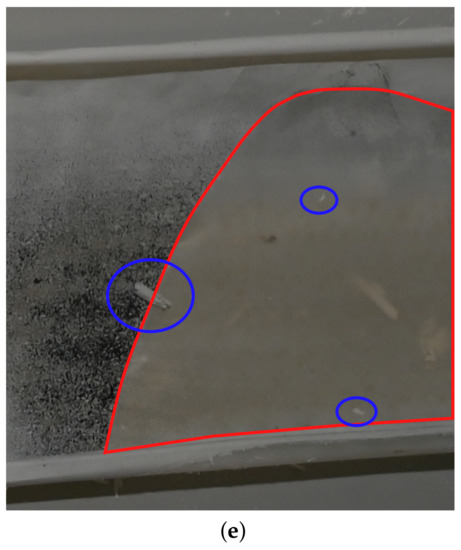
Figure 4.
Pictures of a separator part of the aged type 1 cell with the area of delaminated coating inside the red lines and agglomerates of delaminated ceramic in blue circles (e) and the fully-discharged anodes from fresh and aged cells. (a) Fresh type 1 cell; (b) aged type 1 cell; (c) fresh type 2 cell; (d) aged type 2 cell.
When removing the cell coils of the fresh type 1 cell from the cell housing, a small amount of electrolyte remains in the housing, whereas no electrolyte can be detected in the housing when disassembling the aged type 1 cells, indicating electrolyte consumption. The consumption of electrolyte may lead to the significant increase in cell impedance described in Figure 3 [47]. In addition, distinctive delamination effects of the ceramic coating on the separator surface of the aged type 1 cell are obtained, turning the separator colour from white to ivory in the delaminated areas, which is shown in Figure 4e. Separator areas with delaminated ceramic coating are not detected for the aged type 2 cell.
3.2. Thermal Runaway Behaviour and Temperatures
The results of a typical overtemperature test using the oven test setup is shown in Figure 5. During the preheating phase, the cell temperature slowly increases to . Thereafter, the ambient temperature is increased by every until is reached. When the cell temperature reaches , the OSD separates the cell tabs from the active material. The heating process of the cell accelerates at due to self-heating, while the before constant cell temperature increasing rate starts to increase. Therefore, is defined as the point at which the temperature gradient exceeds of the constant increasing rate during the heating process without self-heating. The exothermal reactions activated during self-heating lead to the decomposition of overheated electrolyte, resulting in activating the relief valve at [48]. Finally, the heating process results in TR at with a maximum temperature of .
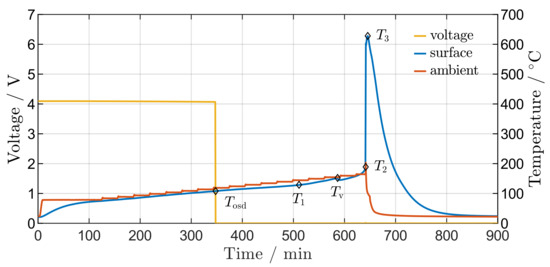
Figure 5.
TR behaviour of an aged type 2 cell. Diamonds represent the five TR behaviour temperatures , , , and .
Although the oven testing procedure is equal for all tested cells, the TR behaviour differs between the cell types, as shown in Figure 6 and Table 2. The external heating process of all cells starts at . While self-heating of fresh type 1 cells occurs between 121 and 129 C, before the OSD disables cell current flow (around 137–138 C), the OSD of fresh type 2 cells is triggered between and before self-heating occurs around 122–128 C. After self-heating, the total heating process accelerates and the relief valve of the cells opens around 145–154 C (fresh type 1) and 142–166 C (fresh type 2), respectively. While the TR of fresh type 2 cells is triggered between and , fresh type 1 cells are more thermally stable as the TR starts around 207–213 C. Maximum cell temperatures during TR for the fresh cells are determined to be around 618–682 C (fresh type 1) and 518–577 C (fresh type 2), respectively. All tested fresh type 2 cells show lower maximum temperatures than fresh type 1 cells, while the mass loss of fresh type 2 cells is larger (around 42–44%) than that of the type 1 cells (around 37–39%). The ejected gases of fresh type 2 cells are ignited in all tests and a strong flame formation is observed.
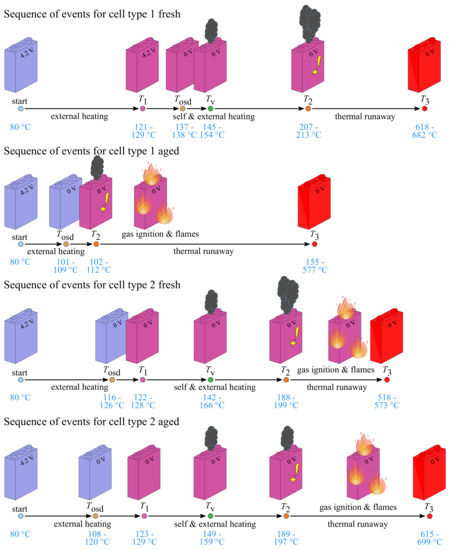
Figure 6.
Sketch of the sequence of events during overtemperature tests with increasing surface temperatures for fresh and aged type 1 and 2 cells.

Table 2.
TR behaviour and mass loss of all tested cells.
Comparing the TR behaviour of fresh and aged type 1 cells, a shift to lower temperatures can be observed. The OSD of the aged type 1 cells is triggered approximately earlier than the OSD of the fresh cells. The TR of the aged cells is already triggered between 102 and 112 C, which means that cannot be determined in these cases. This corresponds to 50% of compared to the fresh type 1 cells. In addition, the relief valve does not open until is reached between 102 and 112 C. While the ejected gases of fresh type 1 cells do not ignited, the aged cells show ignition of the gases and strong flame formation. In two of the three aged type 1 cells tested, the entire cell coil is ejected from the cell housing during TR. As a result, the mass loss of the aged type 1 cells higher and the maximum temperature reached with the TR is lower compared to the fresh type 1 cells.
The cycled type 2 cells show almost the same TR behaviour compared to the fresh type 2 cells. The OSD trigger temperature of the aged cells is slightly lower than of the fresh cells. Additionally, the aged type 2 cells show a higher maximum TR temperature (around 615–699 C) than the fresh cells (around 518–573 C), while the mass loss of aged type 2 cells is around 29–31%, which is slightly lower than that of fresh type 2 cells.
3.3. Discussion
According to literature, cells with a NMC111 cathode are considered to be more thermally stable and less reactive than cells with a NMC622 cathode [49]. Additionally, all aged type 1 cells are only cycled until 90% SOH, while the degraded type 2 cells are cycled until 80% SOH with at an ambient temperature of . Therefore, no decay in thermal stability is expected for the aged cells, especially for the cells of type 1. However, as described in Figure 5, a reduced TR onset temperature is detected for the aged type 1 cells. Furthermore, a decay in thermal stability is not observed for aged cells of type 2.
In previous works, local lithium deposition or plating has been shown to reduce the thermal stability [26,38]. After disassembling the cell, no lithium deposition is observed for the aged type 1 cell, as shown in Figure 4b. Furthermore, a small amount of local lithium deposition is obtained for the aged type 2 cell, as shown in Figure 4d, which does not result in a reduction in in any of the aged type 2 cells tested. Therefore, another effect must lead to the decreased TR onset temperature of the tested aged type 1 cells.
When disassembling the aged type 1 cell, local delamination of the ceramic coating and the separator is observed, as shown in Figure 4e. Therefore, the continuous ceramic coating on the separator is disrupted, which might result in the loss of the enhanced thermal safety properties of the ceramic coating. By further analysing the delaminated separator areas using a DSC measurement with two heating phases, the melting range of the separator material without the ceramic coating is determined, which is shown in the DSC result in Figure 7. The melting of the separator material starts at about and ends before . By comparing the DSC result from Figure 7 with the TR behaviour of the aged type 1 cells shown in Figure 5, a clear correlation between of the aged type 1 cells and the onset of separator melting can be seen. Therefore, the separator areas with delaminated coating could be the cause of the observed decrease in thermal stability in all tested aged type 1 cells. Although separators with a ceramic coating are thermally more stable than those without a ceramic coating [20], the local delamination results in the loss of the improved thermal stability. By heating the aged type 1 cells, the cell temperature increases to the melting region of the delaminated separator. As a result, the areas without a continuous ceramic coating start to melt, which could lead to local ISC and TR.
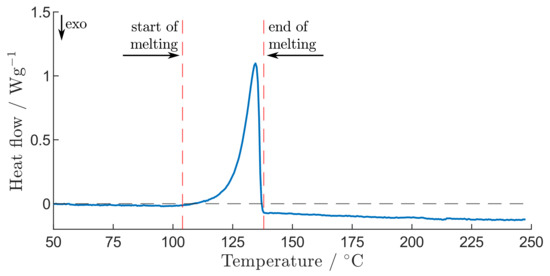
Figure 7.
DSC result of the separator material without ceramic coating of the aged type 1 cell, with the beginning and end of melting marked by red dashed lines.
In order to develop effective countermeasures against TR propagation in a battery module after one cell goes into TR, the temperature of neighbouring cells must be kept below [9]. Usually, during the development of LiBs, only single validation tests are performed by using the same setup to verify the safety [9]. In Figure 8 all determined values for are shown. Comparing the data points of the individual tests, a random variation is clearly detectable. Assuming that a normal distribution describes the random variation of the data points, the determined normal distributions for each test series are presented in Figure 8. Statistical tests confirm that the normal distribution describes the random variation of the data points, which is consistent with the results reported by Walker et al. [50]. The observed average for the aged type 1 cells is with a standard deviation of based on a sample size of three experiments. For the fresh type 1 cells, an average of with a standard deviation of based on five samples could be obtained. The observed average for the fresh type 2 cells is with a standard deviation of based on a sample size of five experiments. For the aged type 2 cells, an average of with a standard deviation of based on three samples could be obtained.
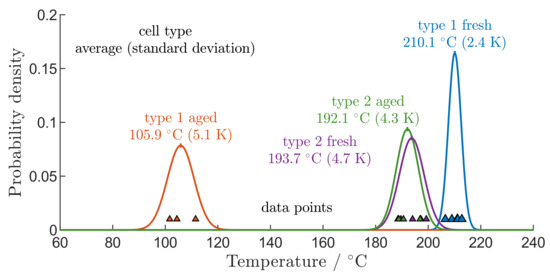
Figure 8.
Measurement points (triangles) of all measured TR onset temperatures and assumed normal distribution (lines) with standard deviation and mean values for all performed thermal stability tests and filtered by aged and fresh cells of both types.
By comparing the distribution of the data points from fresh and aged type 2 cells, no notable changes are detected. The standard deviation or mean values are not influenced by ageing effects through cyclization in this case, whereas the standard deviation and average determined from the data points of aged type 1 cells differ significantly from the data points of fresh type 1 cells, due to the local separator failure of the aged type 1 cells. Therefore, significant differences in the influence of ageing on the distribution of are detected by comparing both cell types.
In addition, comparing the maximum cell temperature to the mass loss of each cell, which are presented in Table 2, shows that an increased amount of ejected material comes with a lower cell temperature. The amount of heat generated by non-ejected material depends on the substance remaining in the cell [51]. Therefore, a higher amount of ejected material leads to a lower amount of generated heat through non-ejected material and lower cell temperatures.
4. Conclusions
The TR behaviour of several aged and fresh large format lithium-ion cells with different cathode chemistries, i.e., NMC622 and NMC111, respectively, are investigated in this paper. The cells are degraded by cyclization at an ambient temperature of , while EIS measurements and cell openings are performed on one fresh and aged cell of each chemistry type. Finally, the TR behaviour of fresh and aged cells are compared.
The TR behaviour of the aged type 2 cells shows no major changes from fresh cells, while for the type 1 cells, massive differences in TR behaviour between aged and fresh cells are obtained. In all measurements, , and of the aged type 1 cells decrease in comparison to the fresh type 1 cells. In the existing literature, lithium plating or deposition leads to a decay in [38], which cannot be observed during cell disassembly on aged type 1 cathodes. Furthermore, slight lithium decomposition is detected for the degraded type 2 cell, without having any impact on the TR behaviour in this case.
During further analysis, the local delamination of the ceramic coating of the separator is identified as a possible reason for the changes in TR behaviour. Without the ceramic coating forming a continuous layer, the separator melting starts around , which may lead to the thermal failure of the separator and an earlier ISC and TR in the aged type 1 cells compared to the fresh cells.
Finally, the measured data is examined for random variation to provide a first small contribution in generating the necessary data for designing safe LiB systems and developing effective countermeasures against TR propagation. Assuming normally distributed data points for aged and fresh cells, the comparison of the datasets shows that the standard deviation and mean values of the underlying distribution highly depend on the TR behaviour of the cell type and may change after cyclization due to ageing effects or the failure of cell components.
For the first time, this work illustrates that for the development of safe LiBs with effective countermeasures against TR propagation, both massive changes in TR behaviour due to degradation during the lifetime of LiBs and an underlying probability distribution of should be considered.
Future work will focus on TR modelling in order to predict the changes in TR behaviour during the whole lifetime of the LiB and developing sufficient countermeasures against TR propagation in order to design safe LiBs for EV and other mobile applications.
Author Contributions
Conceptualization, F.M., M.B., O.B., M.P. and M.A.D.; methodology, F.M., M.B. and M.P.; software, F.M.; validation, F.M., M.B., O.B., M.P. and M.A.D.; formal analysis, F.M., M.B. and M.P.; investigation, F.M.; resources, F.M. and M.A.D.; data curation, F.M.; writing—original draft preparation, F.M. and M.A.D.; writing—review and editing, M.B., O.B., M.P. and M.A.D.; visualization, F.M., M.B., O.B., M.P. and M.A.D.; supervision, M.A.D.; project administration, O.B.; funding acquisition, O.B. All authors have read and agreed to the published version of the manuscript.
Funding
This research was financially supported by the Federal State of Baden-Württemberg (grant number 16BZF210) and by the Federal Ministry for Economic Affairs and Climate Action (BMWK) (grant number 16BZF210 and 03EFQBW221).
Institutional Review Board Statement
Not applicable.
Informed Consent Statement
Not applicable.
Data Availability Statement
Not applicable.
Conflicts of Interest
The authors declare no conflict of interest. The funders had no role in the design of the study; in the collection, analyses, or interpretation of data; in the writing of the manuscript; or in the decision to publish the results.
Abbreviations
The following abbreviations are used in this manuscript:
| ARC | Accelerating rate calorimetry |
| CC | Constant current |
| CV | Constant voltage |
| DSC | Differential scanning calorimetry |
| EIS | Electrochemical impedance spectroscopy |
| EVs | Electric vehicles |
| ISC | Internal short circuit |
| LiBs | Lithium-ion batteries |
| NMC111 | cathode |
| NMC622 | cathode |
| OSD | Overcharge safety device |
| RPT | Reference performance test |
| SEI | Solid electrolyte interface |
| SOC | States of charge |
| SOH | State of health |
References
- Chen, W.; Liang, J.; Yang, Z.; Li, G. A Review of Lithium-Ion Battery for Electric Vehicle Applications and Beyond. Energy Procedia 2019, 158, 4363–4368. [Google Scholar] [CrossRef]
- Choi, K.H.; Liu, X.; Ding, X.; Li, Q. Design strategies for development of nickel-rich ternary lithium-ion battery. Ionics 2020, 26, 1063–1080. [Google Scholar] [CrossRef]
- Lyu, P.; Huo, Y.; Qu, Z.; Rao, Z. Investigation on the thermal behavior of Ni-rich NMC lithium ion battery for energy storage. Appl. Therm. Eng. 2020, 166, 114749. [Google Scholar] [CrossRef]
- Sun, P.; Bisschop, R.; Niu, H.; Huang, X. A Review of Battery Fires in Electric Vehicles. Fire Technol. 2020, 56, 1361–1410. [Google Scholar] [CrossRef]
- Chen, J.; Ren, D.; Hsu, H.; Wang, L.; He, X.; Zhang, C.; Feng, X.; Ouyang, M. Investigating the thermal runaway features of lithium-ion batteries using a thermal resistance network model. Appl. Energy 2021, 295, 117038. [Google Scholar] [CrossRef]
- Li, H.; Duan, Q.; Zhao, C.; Huang, Z.; Wang, Q. Experimental investigation on the thermal runaway and its propagation in the large format battery module with Li(Ni1/3Co1/3Mn1/3)O2 as cathode. J. Hazard. Mater. 2019, 375, 241–254. [Google Scholar] [CrossRef]
- Abada, S.; Petit, M.; Lecocq, A.; Marlair, G.; Sauvant-Moynot, V.; Huet, F. Combined experimental and modeling approaches of the thermal runaway of fresh and aged lithium-ion batteries. J. Power Sources 2018, 399, 264–273. [Google Scholar] [CrossRef]
- Xie, X.; Ren, D.; Wang, L.; Feng, X.; He, X. Investigation on Thermal Runaway of Li-Ion Cells Based on LiNi1/3Mn1/3Co1/3O2. J. Electrochem. Energy Convers. Storage 2021, 18, 031001. [Google Scholar] [CrossRef]
- Becher, D.; Bauer, M.; Döring, H.; Böse, O.; Friess, B.; Danzer, M.A. Preventing thermal propagation in battery packs using enthalpy supported thermal barriers. J. Energy Storage 2021, 42, 103057. [Google Scholar] [CrossRef]
- Golubkov, A.W.; Planteu, R.; Krohn, P.; Rasch, B.; Brunnsteiner, B.; Thaler, A.; Hacker, V. Thermal runaway of large automotive Li-ion batteries. RSC Adv. 2018, 8, 40172–40186. [Google Scholar] [CrossRef]
- Balakrishnan, P.; Ramesh, R.; Prem Kumar, T. Safety mechanisms in lithium-ion batteries. J. Power Sources 2006, 155, 401–414. [Google Scholar] [CrossRef]
- Kupper, C.; Spitznagel, S.; Döring, H.; Danzer, M.A.; Gutierrez, C.; Kvasha, A.; Bessler, W.G. Combined modeling and experimental study of the high-temperature behavior of a lithium-ion cell: Differential scanning calorimetry, accelerating rate calorimetry and external short circuit. Electrochim. Acta 2019, 306, 209–219. [Google Scholar] [CrossRef]
- Chiba, K.; Yoshizawa, A.; Isogai, Y. Thermal safety diagram for lithium-ion battery using single-crystal and polycrystalline particles LiNi0.8Co0.1Mn0.1O2. J. Energy Storage 2020, 32, 101775. [Google Scholar] [CrossRef]
- Galushkin, N.E.; Yazvinskaya, N.N.; Galushkin, D.N. Mechanism of Thermal Runaway in Lithium-Ion Cells. J. Electrochem. Soc. 2018, 165, A1303–A1308. [Google Scholar] [CrossRef]
- Ouyang, D.; Liu, Y.; Hamam, I.; Wang, J.; Dahn, J. A comparative study on the reactivity of charged Ni-rich and Ni-poor positive electrodes with electrolyte at elevated temperatures using accelerating rate calorimetry. J. Energy Chem. 2021, 60, 523–530. [Google Scholar] [CrossRef]
- Feng, X.; Fang, M.; He, X.; Ouyang, M.; Lu, L.; Wang, H.; Zhang, M. Thermal runaway features of large format prismatic lithium ion battery using extended volume accelerating rate calorimetry. J. Power Sources 2014, 255, 294–301. [Google Scholar] [CrossRef]
- Richard, M.N.; Dahn, J.R. Accelerating Rate Calorimetry Study on the Thermal Stability of Lithium Intercalated Graphite in Electrolyte. I. Experimental. J. Electrochem. Soc. 1999, 146, 2068–2077. [Google Scholar] [CrossRef]
- Richard, M.N.; Dahn, J.R. Accelerating Rate Calorimetry Study on the Thermal Stability of Lithium Intercalated Graphite in Electrolyte. II. Modeling the Results and Predicting Differential Scanning Calorimeter Curves. J. Electrochem. Soc. 1999, 146, 2078–2084. [Google Scholar] [CrossRef]
- Huang, L.; Liu, L.; Lu, L.; Feng, X.; Han, X.; Li, W.; Zhang, M.; Li, D.; Liu, X.; Sauer, D.U.; et al. A review of the internal short circuit mechanism in lithium-ion batteries: Inducement, detection and prevention. Int. J. Energy Res. 2021, 45, 15797–15831. [Google Scholar] [CrossRef]
- Feng, X.; Ouyang, M.; Liu, X.; Lu, L.; Xia, Y.; He, X. Thermal runaway mechanism of lithium ion battery for electric vehicles: A review. Energy Storage Mater. 2018, 10, 246–267. [Google Scholar] [CrossRef]
- Bak, S.M.; Hu, E.; Zhou, Y.; Yu, X.; Senanayake, S.D.; Cho, S.J.; Kim, K.B.; Chung, K.Y.; Yang, X.Q.; Nam, K.W. Structural Changes and Thermal Stability of Charged LiNixMnyCozO2 Cathode Materials Studied by Combined In Situ Time-Resolved XRD and Mass Spectroscopy. Acs Appl. Mater. Interfaces 2014, 6, 22594–22601. [Google Scholar] [CrossRef]
- Nguyen, T.T.D.; Abada, S.; Lecocq, A.; Bernard, J.; Petit, M.; Marlair, G.; Grugeon, S.; Laruelle, S. Understanding the Thermal Runaway of Ni-Rich Lithium-Ion Batteries. World Electr. Veh. J. 2019, 10, 79. [Google Scholar] [CrossRef]
- Huang, Q.; Ma, L.; Liu, A.; Ma, X.; Li, J.; Wang, J.; Dahn, J. The reactivity of charged positive Li1-n[NixMnyCoz]O2 electrodes with electrolyte at elevated temperatures using accelerating rate calorimetry. J. Power Sources 2018, 390, 78–86. [Google Scholar] [CrossRef]
- Belharouak, I.; Vissers, D.; Amine, K. Thermal Stability of the Li(Ni[sub 0.8]Co[sub 0.15]Al[sub 0.05])O[sub 2] Cathode in the Presence of Cell Components. J. Electrochem. Soc. 2006, 153, A2030. [Google Scholar] [CrossRef]
- Ren, D.; Feng, X.; Liu, L.; Hsu, H.; Lu, L.; Wang, L.; He, X.; Ouyang, M. Investigating the relationship between internal short circuit and thermal runaway of lithium-ion batteries under thermal abuse condition. Energy Storage Mater. 2021, 34, 563–573. [Google Scholar] [CrossRef]
- Liu, X.; Ren, D.; Hsu, H.; Feng, X.; Xu, G.L.; Zhuang, M.; Gao, H.; Lu, L.; Han, X.; Chu, Z.; et al. Thermal Runaway of Lithium-Ion Batteries without Internal Short Circuit. Joule 2018, 2, 2047–2064. [Google Scholar] [CrossRef]
- Wang, Z.; Ouyang, D.; Chen, M.; Xuehui, W.; Zhang, Z.; Wang, J. Fire behavior of lithium-ion battery with different states of charge induced by high incident heat fluxes. J. Therm. Anal. Calorim. 2018, 136, 2239–2247. [Google Scholar] [CrossRef]
- Li, C.; Wang, H.; Han, X.; Wang, Y.; Wang, Y.; Zhang, Y.; Feng, X.; Ouyang, M. An Experimental Study on Thermal Runaway Behavior for High-Capacity Li(Ni 0.8 Co 0.1 Mn 0.1)O 2 Pouch Cells at Different State of Charges. J. Electrochem. Energy Conv. Stor. 2021, 18, 021012. [Google Scholar] [CrossRef]
- Perea, A.; Paolella, A.; Dubé, J.; Champagne, D.; Mauger, A.; Zaghib, K. State of charge influence on thermal reactions and abuse tests in commercial lithium-ion cells. J. Power Sources 2018, 399, 392–397. [Google Scholar] [CrossRef]
- Zheng, S.; Wang, L.; Feng, X.; He, X. Probing the heat sources during thermal runaway process by thermal analysis of different battery chemistries. J. Power Sources 2018, 378, 527–536. [Google Scholar] [CrossRef]
- Lu, L.; Han, X.; Li, J.; Hua, J.; Ouyang, M. A review on the key issues for lithium-ion battery management in electric vehicles. J. Power Sources 2013, 226, 272–288. [Google Scholar] [CrossRef]
- Fleischhammer, M.; Waldmann, T.; Bisle, G.; Hogg, B.I.; Wohlfahrt-Mehrens, M. Interaction of cyclic ageing at high-rate and low temperatures and safety in lithium-ion batteries. J. Power Sources 2015, 274, 432–439. [Google Scholar] [CrossRef]
- Waldmann, T.; Quinn, J.; Richter, K.; Kasper, M.; Tost, A.; Klein, A.; Wohlfahrt-Mehrens, M. Electrochemical, Post-Mortem, and ARC Analysis of Li-Ion Cell Safety in Second-Life Applications. J. Electrochem. Soc. 2017, 164, A3154–A3162. [Google Scholar] [CrossRef]
- Lammer, M.; Königseder, A.; Gluschitz, P.; Hacker, V. Influence of aging on the heat and gas emissions from commercial lithium ion cells in case of thermal failure. J. Electrochem. Sci. Eng. 2018, 8, 101–110. [Google Scholar] [CrossRef]
- Loveridge, M.J.; Remy, G.; Kourra, N.; Genieser, R.; Barai, A.; Lain, M.J.; Guo, Y.; Amor-Segan, M.; Williams, M.A.; Amietszajew, T.; et al. Looking Deeper into the Galaxy (Note 7). Batteries 2018, 4, 3. [Google Scholar] [CrossRef]
- Xie, S.; Ren, L.; Yang, X.; Wang, H.; Sun, Q.; Chen, X.; He, Y. Influence of cycling aging and ambient pressure on the thermal safety features of lithium-ion battery. J. Power Sources 2020, 448, 227425. [Google Scholar] [CrossRef]
- Zhao, C.; Sun, J.; Wang, Q. Thermal runaway hazards investigation on 18650 lithium-ion battery using extended volume accelerating rate calorimeter. J. Energy Storage 2020, 28, 101232. [Google Scholar] [CrossRef]
- Ren, D.; Hsu, H.; Li, R.; Feng, X.; Guo, D.; Han, X.; Lu, L.; He, X.; Gao, S.; Hou, J.; et al. A comparative investigation of aging effects on thermal runaway behavior of lithium-ion batteries. eTransportation 2019, 2, 100034. [Google Scholar] [CrossRef]
- Lei, B.; Zhao, W.; Ziebert, C.; Uhlmann, N.; Rohde, M.; Seifert, H. Experimental Analysis of Thermal Runaway in 18650 Cylindrical Li-Ion Cells Using an Accelerating Rate Calorimeter. Batteries 2017, 3, 14. [Google Scholar] [CrossRef]
- SAE. J2464: Electric and Hybrid Electric Vehicle Rechargeable Energy Storage System Safety and Abuse Testing; SAE: Warrendale, PA, USA, 2009. [Google Scholar]
- Ruiz, V.; Pfrang, A.; Kriston, A.; Omar, N.; Van den Bossche, P.; Boon-Brett, L. A review of international abuse testing standards and regulations for lithium ion batteries in electric and hybrid electric vehicles. Renew. Sustain. Energy Rev. 2018, 81, 1427–1452. [Google Scholar] [CrossRef]
- Li, H.; Kong, X.; Liu, C.; Zhao, J. Study on thermal stability of nickel-rich/silicon-graphite large capacity lithium ion battery. Appl. Therm. Eng. 2019, 161, 114144. [Google Scholar] [CrossRef]
- Kleiner, K.; Jakes, P.; Scharner, S.; Liebau, V.; Ehrenberg, H. Changes of the balancing between anode and cathode due to fatigue in commercial lithium-ion cells. J. Power Sources 2016, 317, 25–34. [Google Scholar] [CrossRef]
- Waldmann, T.; Hogg, B.I.; Wohlfahrt-Mehrens, M. Li plating as unwanted side reaction in commercial Li-ion cells—A review. J. Power Sources 2018, 384, 107–124. [Google Scholar] [CrossRef]
- Studies on LiFePO4 as cathode material using impedance spectroscopy. J. Power Sources 2011, 196, 5342–5348. [CrossRef]
- Tröltzsch, U.; Kanoun, O.; Tränkler, H.R. Characterizing aging effects of lithium ion batteries by impedance spectroscopy. Electrochim. Acta 2006, 51, 1664–1672. [Google Scholar] [CrossRef]
- Vetter, J.; Novák, P.; Wagner, M.; Veit, C.; Möller, K.C.; Besenhard, J.; Winter, M.; Wohlfahrt-Mehrens, M.; Vogler, C.; Hammouche, A. Ageing mechanisms in lithium-ion batteries. J. Power Sources 2005, 147, 269–281. [Google Scholar] [CrossRef]
- Essl, C.; Golubkov, A.W.; Fuchs, A. Comparing Different Thermal Runaway Triggers for Two Automotive Lithium-Ion Battery Cell Types. J. Electrochem. Soc. 2020, 167, 130542. [Google Scholar] [CrossRef]
- Ma, L.; Nie, M.; Xia, J.; Dahn, J. A systematic study on the reactivity of different grades of charged Li[NixMnyCoz]O2 with electrolyte at elevated temperatures using accelerating rate calorimetry. J. Power Sources 2016, 327, 145–150. [Google Scholar] [CrossRef]
- Walker, W.Q.; Darst, J.J.; Finegan, D.P.; Bayles, G.A.; Johnson, K.L.; Darcy, E.C.; Rickman, S.L. Decoupling of heat generated from ejected and non-ejected contents of 18650-format lithium-ion cells using statistical methods. J. Power Sources 2019, 415, 207–218. [Google Scholar] [CrossRef]
- Walker, W.Q.; Cooper, K.; Hughes, P.; Doemling, I.; Akhnoukh, M.; Taylor, S.; Darst, J.; Billman, J.; Sharp, M.; Petrushenko, D.; et al. The effect of cell geometry and trigger method on the risks associated with thermal runaway of lithium-ion batteries. J. Power Sources 2022, 524, 230645. [Google Scholar] [CrossRef]
Disclaimer/Publisher’s Note: The statements, opinions and data contained in all publications are solely those of the individual author(s) and contributor(s) and not of MDPI and/or the editor(s). MDPI and/or the editor(s) disclaim responsibility for any injury to people or property resulting from any ideas, methods, instructions or products referred to in the content. |
© 2023 by the authors. Licensee MDPI, Basel, Switzerland. This article is an open access article distributed under the terms and conditions of the Creative Commons Attribution (CC BY) license (https://creativecommons.org/licenses/by/4.0/).