Article

Effect of Flame Retardants and Electrolyte Variations on Li-Ion Batteries

1
Karlsruhe Institute of Technology, Institute for Applied Materials Hermann-von-Helmholtz-Platz 1, D-76344 Eggenstein-Leopoldshafen, Germany
2
Department of Microsystems Engineering, University of Freiburg, Georges-Köhler-Allee 102, D-79110 Freiburg, Germany
*
Author to whom correspondence should be addressed.
Batteries 2023, 9(2), 82; https://doi.org/10.3390/batteries9020082
Submission received: 23 December 2022 / Revised: 20 January 2023 / Accepted: 24 January 2023 / Published: 26 January 2023
(This article belongs to the Special Issue Electrode Materials and Electrolyte for Rechargeable Batteries)

Abstract

:
Lithium-ion batteries are being increasingly used and deployed commercially. Cell-level improvements that address flammability characteristics and thermal runaway are currently being intensively tested and explored. In this study, three additives—namely, lithium oxalate, sodium fumarate and sodium malonate—which exhibit fire-retardant properties are investigated with respect to their incorporation into graphite anodes and their electro/chemical interactions within the anode and the cell material studied. It has been shown that flame-retardant concentrations of up to approximately 20 wt.% within the anode coating do not cause significant capacity degradation but can provide a flame-retardant effect due to their inherent, fire-retardant release of CO2 gas. The flame-retardant-containing layers exhibit good adhesion to the current collector. Their suitability in lithium-ion cells was tested in pouch cells and, when compared to pure graphite anodes, showed almost no deterioration regarding cell capacity when used in moderate (≤20 wt.%) concentrations.

1. Introduction

Li-ion batteries (LIB) are promising energy-storage devices for portable consumer electronics as well as energy sources for electric vehicles. However, Li-ion batteries are susceptible to high temperatures, which can lead to ignition and even the explosion of these batteries. In the event of improper operation, gas and heat may be generated inside the battery as a result of electrode, electrolyte or solvent degradation. This gas mixture can be very explosive or even self-igniting if it is released from the cell, mixed with air or through oxygen-release reactions from the electrodes (especially the cathode). Physical damage by crushing or puncturing can also cause rapid ignition and the destruction of the battery [1,2].
Many efforts have been made to improve the safety of Li-ion batteries. There have been developments to obtain safer electrolytes: for instance, by the addition of flame retardants (FRs) to electrolytes, or by using less-flammable electrolyte solvents such as ionic liquids (ILs) and hydrofluoroethers (HFEs) instead of organic electrolytes [1]. Fluorinated solvents are also a possibility for enhancing the battery’s safety characteristics [3]. Safety devices incorporated into battery cells and modules, such as a shutdown separator, cell vent, and current interrupt devices, etc., are further options for managing battery safety [2,4].
Several different materials can be used as anode materials [5]. Typically, graphite, LTO or Si–graphite blend materials are used in commercial cells. They are processed as a layer together with a binder and carbon black. Accordingly, the combustible fraction involved in the thermal runaway fire (expressed as carbon) is correspondingly high. To our knowledge, no flame retardants are currently processed directly into the anode material.
Standard organic, carbonate-based electrolytes are sensitive to increases in local temperature and overcharge, even if the temperature does not overcome 100 °C [6]. Such abusive conditions can cause exothermic reactions inside the cell and lead to thermal runaway. The main strategies to improve LIB safety on a cell level are the development of less/non-flammable electrolytes, the use of electrolyte additives or the addition of fire retardants [7,8,9,10]. ILs are of major interest due to their high thermal, chemical and electrochemical stability. However, their high viscosity and respectively poor ionic conductivity hamper the application of ILs in batteries. Therefore, the addition of organic solvents to such IL electrolytes is often applied to improve the ionic conductivity and/or reduce the viscosity of pure IL electrolytes [11,12]. Solid-state electrolytes, namely, inorganic solid electrolytes and polymer electrolytes, are often described as more thermally stable; therefore, they can replace liquid electrolytes, overcoming the issue of their low ionic conductivity [13]. Additionally, organic phosphorous compounds can be used as fire retardants. They improve the thermal stability of the electrolyte, reduce its flammability by interrupting decomposition reactions, and can even diminish the ageing process [14,15,16,17,18,19,20,21,22]. At the same time, however, organic phosphates can act as electrolytes in the battery itself (e.g., trimethyl phosphate). Non-flammable phosphate electrolytes improve the thermal stability of the battery and suppress gas generation during charging and discharging [17,23].
Lithium bis(trifluoromethanesulfonyl)imide (LiTFSI) is an alternative conducting salt. It is related to the standardly used, high reactive LiPF6 due to its higher thermal and electrochemical stability [24]. Its main disadvantage is its corrosivity towards aluminum (a cathode current collector) [24]. Electrolyte additives such as lithium difluoro(oxalato)borate (LiDFOB), in combination with fluoroethylene carbonate (FEC), can prevent Al corrosion in presence of LiTFSI and improve cell cycling and cell aging [24].
The formation of solid electrolyte interface layers (SEIs) appears on an anode surface during the first charging cycles as a result of electrolyte decomposition, This protecting the electrolytes from further decomposition. Thus, the thermal stability of the SEI is crucial for battery safety. The SEI decomposition temperature can be increased if a combination of thermally stable Li salts and high-boiling electrolytes is used. Some extra additives (e.g., organic phosphorous compounds) can also strengthen the SEI and improve its thermal stability [25,26]. Jiang et al. proposed a composite electrolyte additive consisting of perfluoro-2-methyl-3-pentanone (PFMP) and N,N-dimethylacetamide (DMAC), which doubled the protection mechanism. DMAC improved the thermal stability of the electrolyte and PFMP served as a self-cooling component [27].
The separator in the battery cell also plays a crucial role in battery safety. It prevents physical contact between the cathode and anode while simultaneously allowing ion transport between both electrodes [4]. Damage caused by external puncturing, dendrite growth or shrinkage by overheating or overcharging leads to an internal short circuit and thus accelerates thermal runaway in the battery. Separators with a so-called “shutdown behavior” are favored because of their ability to “close pores” if the temperature increases [2]. Single- or three-layer separators composed of polyolefins are the most widely used separators in batteries [9,28,29]. They exhibit a high porosity, low thickness and demonstrate a low ionic resistivity. A crucial disadvantage of such separators, however, is their narrow melting temperature range, which is between 135 °C and 165 °C [4]. Additionally, a shrinkage of the separator occurs at even lower temperatures. Composite separators made of ceramics such as LiAlO2, Al2O3, MgO, etc., coated onto polyolefins were developed with the aim of improving the melting point of the separator and thus the cell safety [4,9,29,30,31]. There are still many efforts being made with respect to the thermal-stability improvements of separators. On one hand, different polymers and ceramics are intensively investigated with respect to their higher thermal stability. For example, fluorinated polyimide nanofibers with improved flame-retardant properties were proposed [32]. Luo et al. demonstrated that no visible changes occurred when the separator was heated up to 160 °C. This was additionally confirmed through differential scanning calorimetry and thermogravimetric analysis [32]. Liu et al. developed a polyphenylene sulfide separator which displayed a high porosity, high wettability and high thermal stability (up to 280 °C) [33]. A composite, polyvinyl-alcohol-based separator with a wider shutdown temperature window of 155 °C was fabricated and successfully tested [34]. Cellulose-based separators are a good option for both battery safety improvement and the environment. In addition to demonstrating negligible shrinkage at an elevated temperature, they can also improve rate capability and enhance capacity retention and cycling stability [35,36]. The incorporation of MoO3 and Al-doped Li6.75La3Zr1.75Ta0.25O12 into poly(vinylidene fluoride hexafluoropropylene) demonstrates superior safety to flame events. Only approximately 5% of shrinkage was observed after heating the separator at 160 °C for 4 h [31].
Another possible avenue to improving the flame-retardant effect of a separator is to include additives with known flame-retardant properties as surface coatings or even introduce them into the separator structure. Liao et al. proposed an environmentally friendly separator consisting of bacterial cellulose, attapulgite rod and ammonium polyphosphate which displayed self-extinguishing characteristics after ignition with a low heat and gas contribution [36]. Lee et al. significantly improved the thermal stability of a tri-layer separator by coating it with brominated poly(2,6-dimethyl-1,4-phenylene oxide) [37]. Peng et al. soaked ceramic separators with phenol-formaldehyde resin, which is known for its insulating properties and is already widely used in electrical equipment [38].
Li dendrite growth is an adverse process inside the battery which can lead to separator damage and a short circuit [39]. Dendrite penetration through the separator can be suppressed by coating a polyolefin film with an aramid resin. The small pores of this separator do not allow dendrites to grow into or through it, leading to granular or spherical deposits along the plane of the separator [39]. Good separation between the cathode and anode can be achieved by coating both electrodes with an α-Al2O3 slurry. Such a coating is very thin, less sensitive toward high temperatures and more mechanically and dimensionally stable when compared to commercial separators [40]. Flame retardants can even be added to the current collector foils. Thus, Ye et al. proposed an ultralight, polyimide-coated Cu current collector with the addition of flame-retardant triphenyl phosphate, thus improving the cell safety [41].
Another potential approach to reduce the incidence of fires is to use substances that can release fire-retardant gases. It is known that oxalates, formates, fumarates and malonates can release CO2 under thermal exposure. The exact decomposition depends strongly on the surrounding atmosphere and the reaction conditions. Nevertheless, it is conceivable that the released CO2 has a fire-retardant effect or can influence the gas composition limits for explosion. Lithium oxalate in particular has already been investigated mechanistically; therefore, it is known that it decomposes into the corresponding lithium carbonate at approximately 550 °C, with the CO being split off [42,43,44,45]. The CO immediately reacts again in the presence of oxygen, forming CO2.
In this study, we have incorporated various flame retardants directly into the anode material to answer the open question of how to best introduce flame retardants into the cell and whether they have the desired safety-enhancing effect. This allows for the corresponding substances to act directly in the cell so that they can react appropriately (well and quickly) in the case of cell abuse or cell failure. Since this function is embodied directly in the cell, failures due to electrical issues or time delays from activating external safety measures can also be overcome. At the same time, the ion transport and cell chemistry are not or are only marginally affected. Due to the high flammability of the carbonate mixtures typically used as electrolytes, we have considered the influence of the electrolytes to address the overall safety.
In the present study, three organic salts (namely, lithium oxalate, sodium fumarate and sodium malonate) with two groups of -COO- in their structure were introduced into the Li battery anode. The intent was to achieve a CO2 release during thermal decomposition at elevated temperatures, thus slowing down fire extension or even preventing battery ignition. For that purpose, full coin cells as well as pouch-bag cells with modified anodes vs. NMC111 (NMC—lithium nickel manganese cobalt oxide) cathodes were assembled and filled with three different electrolytes:
(1)
An LP30-standard Li-ion battery electrolyte containing ethylene carbonate (EC) and dimethyl carbonate (DMC) in equivalent volumetric parts as solvents and 1 M LiPF6 as a conductive salt;
(2)
Ethylene carbonate (EC) and propylene carbonate (PC) + 1 M LiDFOB;
(3)
1,2-butylene carbonate (1,2-BC) and fluoroethylene carbonate (FEC) + 1 M LiTFSI.
The performance of these battery cells (within 122 cycles) and the cell aging (within 1024 cycles) was investigated. Finally, the pouch cells were overcharged, and the released gases were studied using gas chromatography (GC). Postmortem analyses on coin cells using liquid GC-MS (MS—mass spectrometry) to investigate the decomposition reactions taking place in the presence of flame retardants are also provided.

2. Materials and Methods

2.1. Chemicals

For slurry preparation, graphite Mechano-CAP 1P1 (spherical particles 26.35 µm in diameter; purchased from H.C. Carbon GmbH, Rednitzhembach, Germany); carbon black Super C65 (Timcal, Bodio, Switzerland); 2 wt.% sodium carboxymethyl cellulose, WALOCELTM CRT 2000PA07, dissolved in water (Dow, MR, USA.) and styrene-butadiene rubber SBR TRD 500 GR (JSR, Shanghai, China) were used. Lithium oxalate (99%, CAS 553-91-3; ABCR, Karlsruhe, Germany); sodium fumarate (>99%, CAS 17013-01-3; Sigma-Aldrich, Schnelldorf, Germany) and sodium malonate (>99%, CAS 141-95-7; TCI, Zwijndrecht, Belgium) were used as received. Lithium bis(trifluoromethanesulfonyl) imide (LiTFSI, 99.9%, Gotion, CAS 90076-65-6); lithium difluoro(oxalato) borate (LiDFOB, 99.8%, Gotion, CAS 409071-16-5); fluoroethylene carbonate (FEC, 99.9%, Gotion, CAS 114435-02-8); ethylene carbonate (EC, 99.98%, Gotion, 96-49-1), and propylene carbonate (PC, 99.99%, Gotion, CAS 108-32-7) were used as received. 1,2-butylene carbonate (1,2-BC, 98%, CAS 4437-85-8, TCI Europe) was distilled and dried with a 3 Å molecular sieve (rest water content: 10 ppm or less).

2.2. Electrolytes

Electrolytes—0.75 mol∙kg−1 of LiDFOB, EC/PC 1:1 (v/v) and 0.75 mol∙kg−1 of LiTFSI, 1,2-BC/FEC 1:1 (v/v)—were prepared in an argon-filled glove box GS (Glovebox Systemtechnik, Germany) with O2 and H2O levels of less than 1 ppm. LP30 (1 M of LiPF6, EC/DMC 1:1 (v/v), Sigma-Aldrich, battery grade) was used as received. The salt concentrations equaled approximately 1 M.

2.3. Electrode and Cell Preparation

The anode preparation procedure consisted of three steps: (1) mixing a slurry, (2) doctor-blading processing and (3) drying the sheet. An amount of 59.4 g of graphite mixed with 1.234 g of carbon black was added step by step to 55.2 g of 2 wt.% Na-CMC solution and stirred using a vacuum-equipped dissolver (VMA Getzmann, Reichshof, Germany; rotational speed of 500 min−1). After all the solid particles were dispersed in the Na-CMC-binder, the rotational speed was increased to 2000 min−1 and the mixture was stirred with additional cooling for approximately 40 min until homogeneity was achieved. The resulting slurry consisted of approximately 52.4 wt.% of dispersed components and 47.6 wt.% of water. The anode materials with flame retardants were prepared by adding well-defined amounts of Li oxalate, Na fumarate or Na malonate to the slurry, resulting in 5, 10, 20, 35 and 50 wt.% of FRs in the dried anode layer (see Table 1), respectively. Extra water was added to the mixture to keep the component—water ratio similar to that of the pristine slurry. Finally, a 1.25 wt.% of SBR binder was added to a slurry.
The obtained slurries were coated onto 10 µm thin Cu foil (width of 10 cm, Nippon Foil Mfg. C., Tokyo, Japan) using a miniature tape-casting coater (MSK-AFA-HC100, MTI Corp.) and a doctor blade with an adjustable film height and a speed of 0.2 m∙min−1. The film thickness was varied with purpose to prepare anodes with a specific capacity higher than 2.0 mAh∙cm−2 (see Table 1). The foils were dried in a furnace at 40 °C for at least 12 h. For cell assembly, all the electrodes and separators were dried overnight in a vacuum furnace at 100 °C for the coin cells and at 130 °C for the pouch cells.

2.4. Li-Ion Battery Cells

Coin cells were prepared in an argon-filled glove box (MBraun GmbH, Garching, Germany) with oxygen and water levels below 0.5 ppm. The NMC111-cathode (Ø 16 mm, Custom Cells, Itzehoe, Germany), anode (Ø 16 mm, with or without FR) and separator (Ø 17 mm, Whatman, QMA, UK), loaded with 110 µL of electrolyte, were assembled in a coin cell (CR 2032 type, PI-KEM, Tamworth, U.K.) with a digital, pressure-controlled electric crimper (MSK-160E, PI-KEM, Tamworth, U.K.) at approximately 0.8 T. For better contact and uniform current distribution, a stainless-steel spacer and spring were placed between the cathode and the coin cell case. The coin-cell tests were carried out using an in-house-developed cell cycler Liccy (Institute of Data Processing and Electronics, KIT, Karlsruhe, Germany) and CTS (Battery Test System, BaSyTec GmbH, Asselfingen, Germany) (Table 2). The individual anode specifications are listed with the supporting information in Table S1 and Figure S1. All coin cells were cycled with a constant current charge to 4.2 V and discharged with a constant current to 3.0 V (Table S3, supporting information)
The pouch-bag cells were assembled in a dry room at a dew point below −70 °C. The size of NMC111 cathode was 5 cm × 5 cm and the size of anode (with and without FR) was 5.5 cm × 5.5 cm. The cathode loading was 2.0 mAh∙cm−2. The anode loading varied from anode material to anode material but exceeded 2.1 mAh∙cm−2 for each material electrode to avoid lithium plating during cycling. A ceramic-coated PET was used as a separator. All cells were loaded with 450 µL of electrolyte. The individual anode data are listed in Table S2 (supporting information). The pouch bags were cycled with a constant current charge to 4.2 V and discharged with a constant current to 3.0 V (Table S4, supporting information).

2.5. Methods

2.5.1. Gas Chromatography Coupled to Mass Spectrometry (GC-MS, Gas)

Gas analyses were performed using a Clarus 690 GC (Perkin Elmer, Waltham, MA, USA), coupled with an ARNEL 4019 system (Perkin Elmer, Waltham, MA, USA) and a mass spectrometer (MS, SQ8S, Perkin Elmer, U.S.A.). This setup allowed for the detection and quantification of the gases CO2, CO, CH4, C2H2, C2H4, C2H6, O2, He, Kr and Ar from a concentration of approximately 150 ppm. A calibration gas mixture with the components included (Basigas) was used for quantification. The gas samples were injected at room temperature and switched to the columns at a normal pressure. Evaluation and control took place using TotalChrom 6.3.4 software (Perkin Elmer, Waltham, MA, USA). To reference the gas intensities, krypton (Kr) was used as an internal standard after the electrochemical tests.

2.5.2. Gas Chromatography Coupled to Mass Spectrometry (GC-MS, Liquid)

Gas chromatographic measurements of the liquid electrolytes were performed using a Clarus 690 (Perkin Elmer, Waltham, Massachusetts, U.S.A.) with a coupled MS (SQ8T, Perkin Elmer). The method is described in detail in [46]. Briefly, the samples were introduced into the device via an autosampler (CAP injector, T = 250 °C, 0.5 µL) and separated using a 5MS column (ELITE-5MS, PerkinElmer, 30 m length, 0.25 inner diameter, 0.5 µm film thickness). A temperature program was used, and the pressure was adjusted accordingly (40 °C, 1.5 min; 20 K∙min−1 heat up to 320 °C; initial pressure of 175 kPa for 2 min, then pressure increased at 7,8 kPa/min to 300 kPa). After separation, a split into the MS (T (ion source) = 200 °C, T (transfer line) = 200 °C, filament voltage = 70 kV) and into an additional FID (T = 280 °C) took place. The analysis and hardware control were performed using the software TurboMass 6.1.2 (Perkin Elmer, Waltham, MA, USA).

2.5.3. Light Microscopy

The electrode surface was studied using a Keyence digital microscope VHX-7000 and an objective VHX E500S with 2000× magnification.

2.5.4. Mandrel Bend Test

The influence of the addition of flame retardants on the adhesive and cohesive properties of the anode electrodes were studied using the mandrel bend test. For this purpose, the anode foils were prepared as described and tested using a Mandrel Bending Tester EQ-MBT-12-LD (PI-KEM, Tamworth, UK) equipped with 12 cylinders with diameters ranging from 2 mm to 32 mm. Beginning with the largest one, the coated foils were bent over the bending cylinder for 2–3 s at 180°. They were precisely examined with a light microscope AX70 (Olympus, Hamburg, Germany) after each test. The results were compared with a commercially available anode purchased from Custom Cells.

2.5.5. Resistance

Anode slurries with and without FRs were coated onto a glass plate (20 cm × 20 cm × 0.2 cm) using a miniature tape-casting coater (MSK-AFA-HC100, PI-KEM, Tamworth, U.K.) and a doctor blade with an adjustable film height and a speed of 0.2 m/min. The film thickness was adjusted to the anode foils for corresponding concentrations of FRs in the layer (Table 1). The resistance was measured between 1 MHz and 1 Hz using the electrochemical workstations Zennium E and X and THALES software (Zahner-Elektrik GmbH, Kronach, Germany). The glass plate with anode coating was placed inside an in-house-built, 3D-printed sample holder (see Figure 1a). Two copper plates (20 cm × 2 cm × 0.2 cm) were positioned on the anode surface and connected with the workstation. Several measurements were performed on the same layer by changing the distance between the Cu plates from 1 cm to 7 cm in 1 cm increments (Figure 1b).

2.5.6. Rheology

The rheological properties of the pristine slurry and the slurries with added FRs were studied using a Gemini HR Nano (Netzsch Gerätebau GmbH, Selb, Germany) rotational rheometer with a 40 mm diameter, cone-plate measuring system and a 4° cone angle. All samples were measured at 25 °C with shear rates from 1 s−1 to 200 s−1.

2.5.7. Scanning Electron Microscope (SEM)

SEM images were taken with a Zeiss Supra 55 FE-SEM (Zeiss, Oberkochen, Germany). All samples containing FRs were additionally sputter-coated with gold/palladium (Au/Pd = 80/20) prior to SEM inspection to reduce sample charging.

2.5.8. Solubility

The solubility limit of the FR was analyzed by repeatedly dissolving appropriate amounts of FR (10 mg) in water (1 mL) under stirring conditions. When no more FR was soluble, the previously determined amount was taken as the solubility limit. The solubility limit was checked by directly weighing the amount that was barely soluble.

2.5.9. Thermogravimetric Analysis (TGA-IR)

All the chosen flame retardants were examined with TGA-IR using a thermogravimetric analyzer (Netzsch STA 449 F3) coupled with an IR spectrometer. Amounts of 23.4 mg of lithium oxalate, 22.8 mg of sodium fumarate and 24.8 mg of sodium malonate were measured in an Al2O3 crucible. The samples were heated from 30 °C to 1000 °C with a heating rate of 10 K∙min−1 under air gas flow. IR spectra were recorded between 400 cm−1 and 4,500 cm−1. The decomposition of the FRs was additionally examined by Kieran Evans from PerkinElmer (U.K.) using a thermogravimetric analyzer (PerkinElmer TGA 8,000) coupled with an IR spectrometer (PerkinElmer Spectrum 3, transfer line: TL9000e). All valves, lines and cell temperatures were set to 280 °C and the gas flow was set to 85 mL∙min−1. The samples were heated from 30 °C to 1000 °C at a 10 K∙min−1 heating rate. There was an air purge of 40 mL∙min−1 with a 60 mL∙min−1 nitrogen balance purge. IR spectra were acquired from 4000 cm−1 to 600 cm−1 with two scans per spectrum and a resolution of 8 cm−1.

2.5.10. Overcharging Abuse Test

The pouch-bag cells were connected to a programmable, DC power supply (Korad, KD6005P, Welectron, Germany) and placed inside a fume hood. Initially, all the studied cells were charged up to 4.2 V with a 0.02 A current (corresponding to 0.5 C). Following this, the current was increased up to 0.2 A (5 C). The cell potential was monitored with the power supply, and the cell temperature was measured with an IR thermometer (Mestek, IR03A, Shenzhen Mestek Tools Co., LTD, Longhua, Shenzhen, China). The current was switched off as soon as the cell reached 50 V. Finally, the cell was removed from the power supply and prepared for GC-MS gas investigation.

3. Results

3.1. Electrolyte Formulations and Electrolyte Characteristics

In the present study, three electrolyte mixtures—namely, 0.77 mol∙kg1 of LiPF6 in EC/DMC (LP30), 0.75 mol∙kg1 of LiDFOB dissolved in EC/PC 1:1 (v/v) and 0.75 mol∙kg1 of LiTFSI dissolved in 1,2-BC/FEC 1:1 (v/v)—were used, and their impact on the flammability of Li ion battery cells was investigated in detail. In Table 2, the electrolyte formulations and the electrochemical and physicochemical properties of the studied electrolytes are summarized. The data indicate that the two newly prepared electrolytes with comparative Li+ concentration ranges achieved similar oxidative stabilities but had slightly lower ionic conductivities and higher viscosity values, respectively, when compared to the LP30 electrolyte. This suggests a slightly lower ion mobility. However, the flash point was significantly higher for the new electrolytes vs. the LP30. Additionally, the flash point of the EC/PC mixture (160 °C) was also increased when compared to the 1,2-BC/FEC electrolyte formulation (149 °C). Temperature-dependent conductivity measurements revealed a typical behavior which is well-known from organic liquid electrolytes (Figure S2, supporting information). In addition, based on its distinctly improved conductivity properties, the newly investigated EC/PC electrolyte suggested an improved cell performance when compared to the BC/FEC electrolyte.

3.2. Flame Retardants and CO2 Release

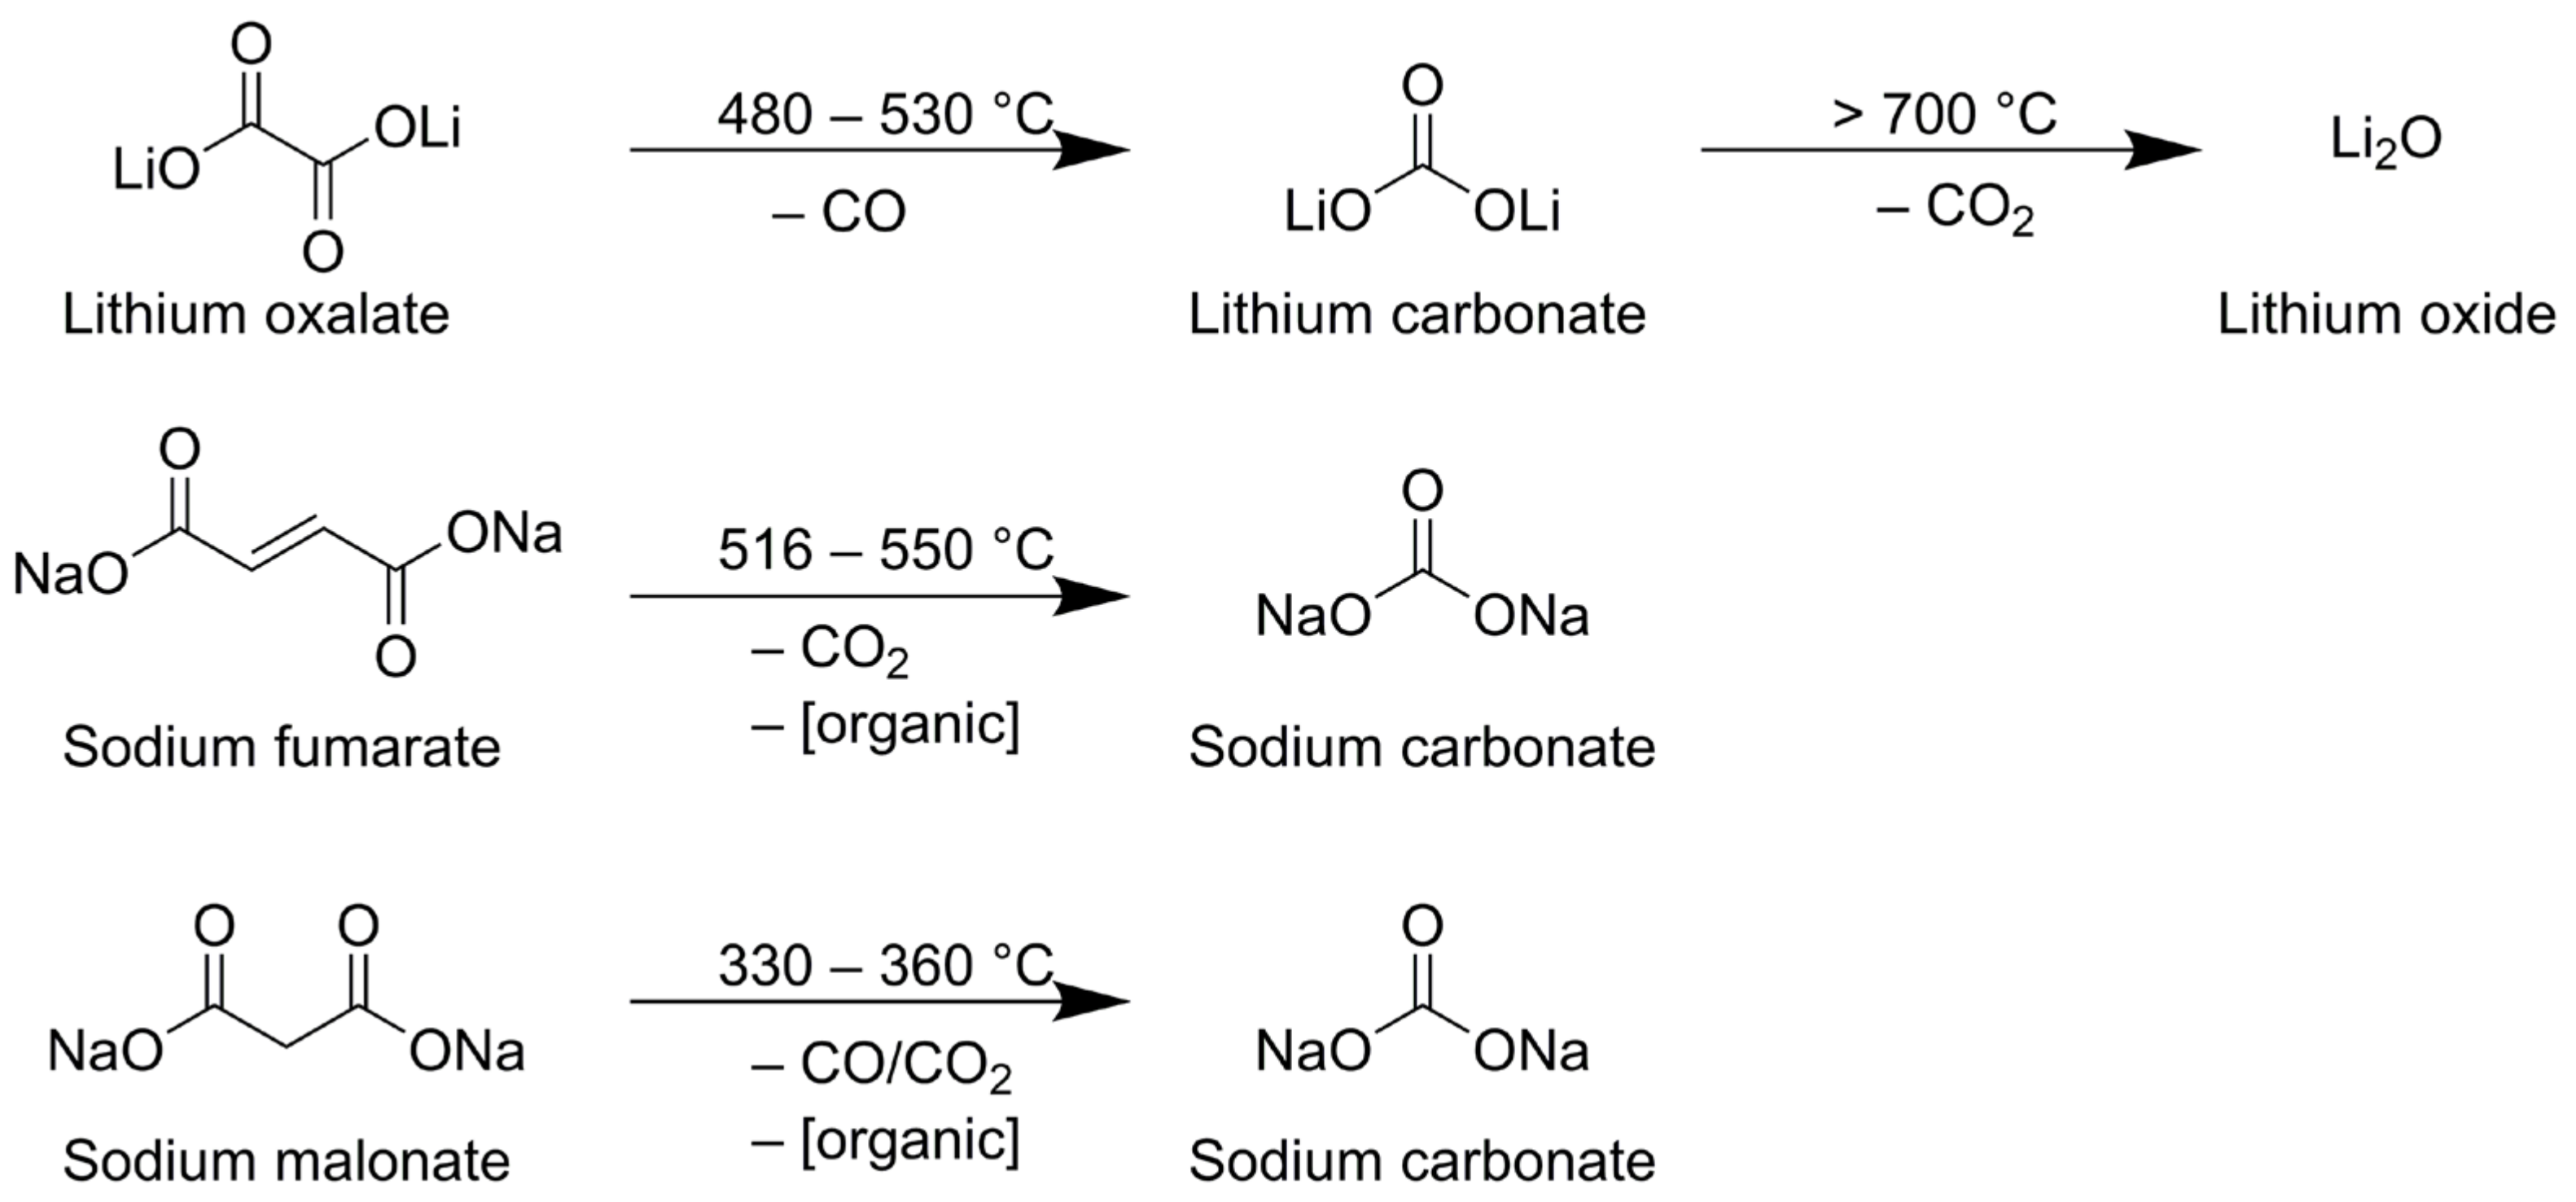
As indicated in the introduction, methods are still being explored to improve the intrinsic safety behavior of Li-ion cells during thermal runaway. In this study, therefore, a new approach based on the release of internal gas (CO2) was tested to improve the safety characteristics of the corresponding Li-ion cells. Accordingly, three selected flame retardants were tested in detail. Their decomposition pathways are depicted in Figure 2. To evaluate the potential of the FRs in terms of CO2 release, the decomposition of lithium oxalate, sodium malonate and sodium fumarate was investigated by TGA (Figure 3). CO2 is expected to be released when these salts are heated to elevated temperatures. Lithium oxalate is already known as a cathode additive for Li-ion batteries [47,48] and has been shown to act as a “sacrificial salt” in order to donate Li ions when the cell is charged at a high potential (approximately 4.7 V), simultaneously releasing CO2 [47,48]. Moreover, a higher charge capacity, cycling stability and coulombic efficiency were observed when lithium oxalate was introduced into the cathode material [47,48].
The thermal decomposition of lithium oxalate was also previously studied [42,43,44,45]. As is described in the literature, the formation of gas products is highly dependent on the atmosphere in which the TGA measurement is performed [43,44,49]. For example, the gas products and reaction enthalpies in TGA measurements differ depending on the purge gas employed, e.g., in the study of pure lithium oxalate. Air or oxygen as a purge gas leads to the direct conversion of CO into CO2. CO2 is then predominantly detected in the subsequent IR analysis. A conclusion of the CO gas actually released is then only possible via mass loss. In the practical case, oxygen will be present in a battery due to oxygen release from the cathode material or by the venting of a cell and the subsequent contact with ambient air. Therefore, dry air was used as the carrier gas in this study. The precise decomposition of each individual compound/component was not investigated in the present study. However, it was referred to in the literature findings [42,49,50] or postulated on the basis of mass loss and gas detection by IR spectroscopy to determine the decomposition gases (Figure 2).
The behavior of lithium oxalate described in the literature was confirmed in the present study (Figure 3a). Here, the Li oxalate decomposition occurred in two steps: (1) at 480 °C–530 °C and (2) between 700 °C and 1000 °C. In this case, the temperature range of the second mass loss depended on the heating rate and, in the examined study, was probably not yet completed at 1000 °C. The experiment confirmed the theoretical mass loss of the first stage (480 °C–530 °C) for a CO release of 27.4% (27.3% found). Time-resolved IR spectra, as indicated, provided strong absorption band characteristics for CO2 (2330 cm−1 and 2360 cm−1 correspond to stretching, 690 cm−1 corresponds to bending, and 3600 cm−1 and 3720 cm−1 represent a combination of bending and stretching vibrations: also see Figure S3, supporting information) [51]. Only a small amount of CO was detected (weak bands: 2100 cm−1 and 2180 cm−1). This is due to the reaction of CO with ambient, atmospheric oxygen to CO2. The residue of thermal decomposition was Li2O. Thus, the thermal decomposition of Li oxalate in the oxygen-containing atmosphere released two CO2 molecules (the second, however, beginning only at approximately 700 °C).
In the case of sodium fumarate (Figure 3b), a slight initial mass loss of 4.1% between 400 °C and 515 °C was observed prior to the main decomposition, which occurred around 530 °C. In contrast to the literature, the main mass loss (27.4%) occurred at a higher temperature range, between 516 °C and 550 °C (440 °C–490 °C [52]). However, this mass loss is in good agreement with the release of CO2 (a theoretical loss of 27.5%), which was also observed by Ionashiro et al. [52]. The IR spectra show strong bands at 2330 cm−1 and 2360 cm−1, which are characteristic of CO2, and some weak bands in the range between 1250 cm−1 and 2000 cm−1 (Figure S3, supporting information). Apparently, the main product of decomposition was CO2, but some organic residues were also released as the result of molecular rearrangement. Ionashiro et al. ultimately assigned the organic bands to methane and some traces of CO [52]. Consequently, the total mass loss, up to 550 °C in the present case, was 31.6%, indicating the formation of Na2CO3 (33.8%, determined theoretically). A mass decrease from 550 °C indicates the continuous slow formation of sodium oxide under CO2 evolution. CO2 could also be detected in the corresponding temperature range (550 °C–1000 °C).
The TGA curve of sodium malonate (Figure 3c) shows a strong initial mass loss between 330 °C and 360 °C (22.5%). This range was also described by Caires et al. for sodium malonate with the formation of Na2CO3 (in a TGA experiment, under dry air) [53]. However, the loss is too large for a 1:1 molar CO decay (18.9%, determined theoretically) on one hand, but too small for a 1:1 molar CO2 decay (29.7%, determined theoretically) on the other hand. The IR spectra indicate that large amounts of CO2, as well as some organic fragmentation products, were released, but this can also be explained by conversion of CO to CO2 under the dry air atmosphere, as previously described for lithium oxalate. It is assumed that the decomposition was not equimolar, but that a gas mixture CO/CO2 (approximately 70:30) was released: this was then detected as CO2 in the IR spectrometer. Analogous to sodium fumarate, sodium malonate also continuously released CO2 up to 1000 °C, starting at 360 °C, which can be observed in the IR spectra.

3.3. Electrode Slurry Preparation and Anode Characterization

Anode materials with FRs were prepared in three steps: (1) a pristine slurry consisting of graphite, carbon black and 2 wt.% Na-CMC was mixed using a dissolver; (2) defined amounts of FRs were added to the slurry and stirred manually and (3) an SBR binder was added and stirred manually as well. All tests on anode materials and anode coatings were performed immediately after the anode material was prepared to avoid any degradation processes. The solubility of the FR in water was also estimated, with an aim of gaining a better understanding about the form of the FRs inside the slurry. Table 1 provides an overview of the component contents in the slurry as well as the FRs’ solubilities. It is evident that lithium oxalate was the least soluble and sodium malonate was the most soluble flame retardant studied here. The solubility of the FRs in water at 23 °C were obtained as follows: lithium oxalate: 55 ± 2 g∙L−1, sodium fumarate: 220 ± 5 g∙L−1 and sodium malonate: 1155 ± 10 g∙L−1.
The slurry for the anode materials studied here is a suspension of solid components, such as graphite, carbon black and partly FR, in liquid components, which included Na-CMC and an SBR binder dissolved in water. to the aim was to improve the adhesion and cohesion properties of the electrode layer as well as the dissolved FR. Its rheological properties are crucial for electrode coating. On one hand, viscosity defines the stability and lifetime of the slurry (e.g., sedimentation). On the other hand, viscosity affects the coating procedure. A too high or too low viscosity can lead to non-uniform coating, runniness and pooling, which, from their side, leads to inhomogeneous active-material loading on the electrode surface. This causes local differences in dis/charge currents with the appearance of hot spots during battery cycling [54,55,56,57,58,59,60].
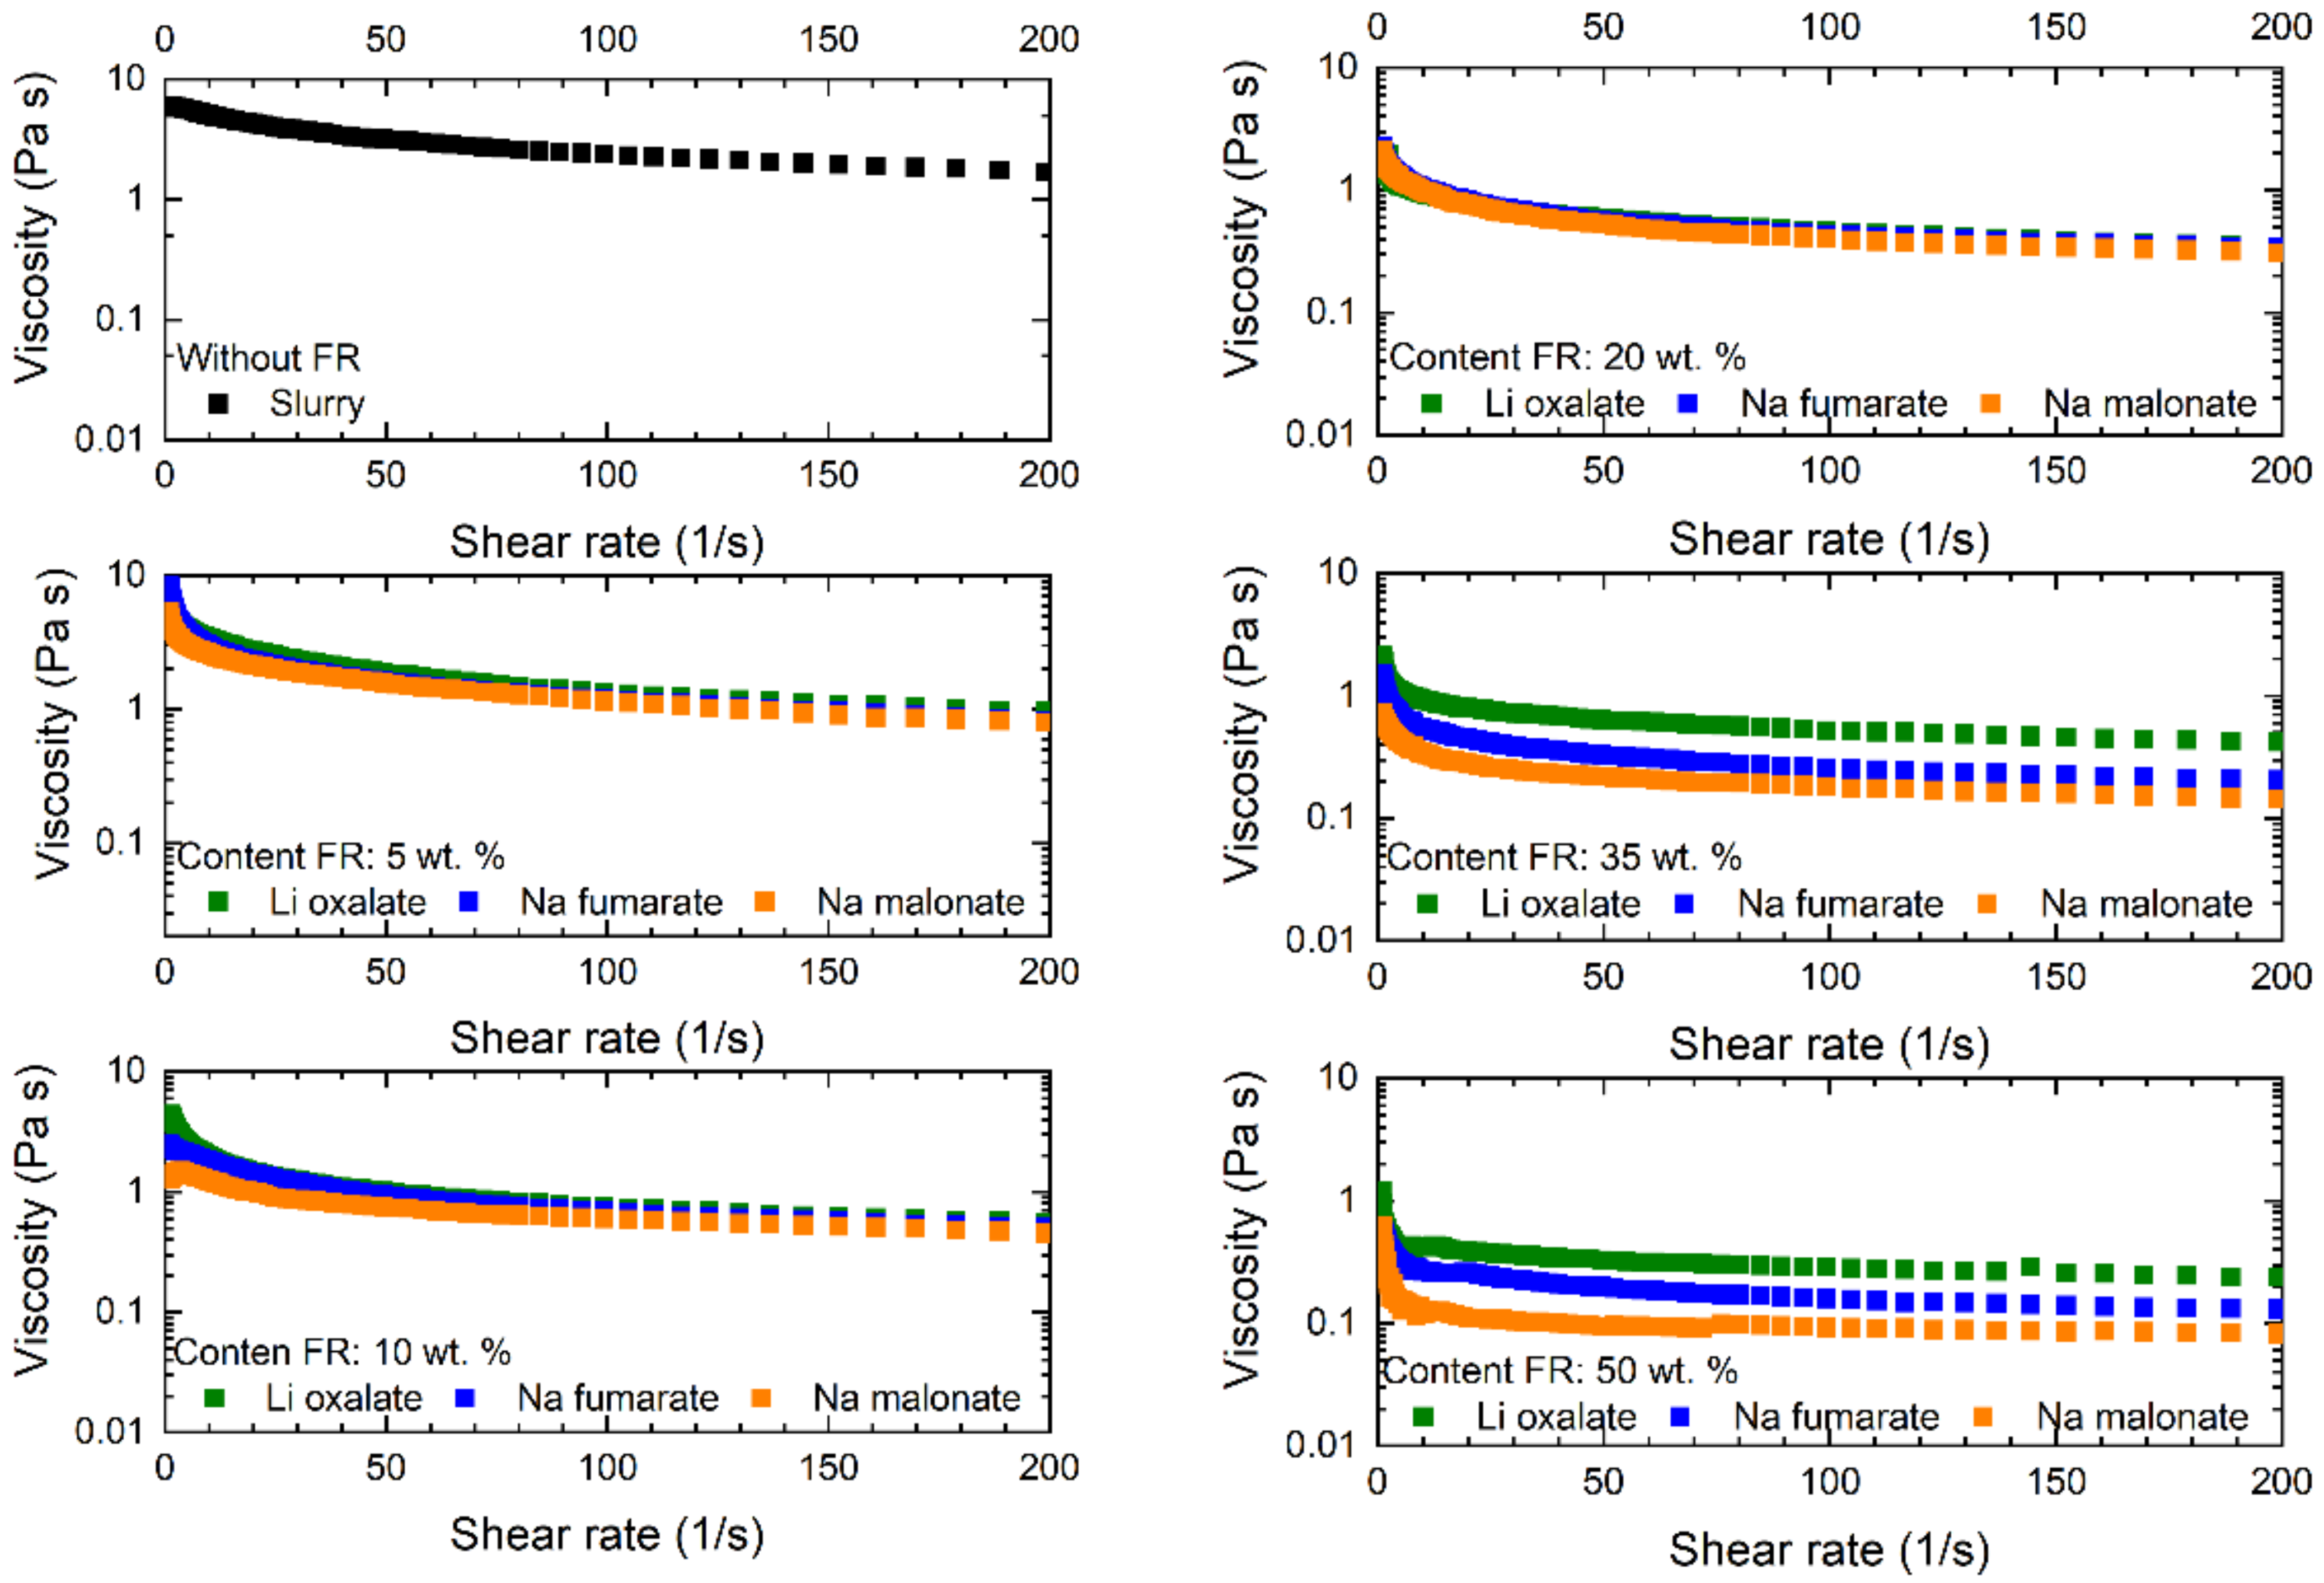
To eliminate the influence of FR additives on slurries, their viscosity was studied. Figure 4 displays the viscosity of the anode material and the slurry as a function of a shear rate. A viscosity drop was observed for all slurries when the shear rate increased. This is a so-called shear-thinning effect, which is typical for suspensions containing macromolecules of polymer structure [59,61,62]. Furthermore, a clear viscosity dependence on the amount of added water with an increasing content of FRs was detected. Extra water was added to the slurry to keep the solid particles/water ratio constant. However, please note the partial dissolution of the FRs in water. Thus, the anode material became less viscous. Another reason for decreasing the viscosity by increasing the amount of water and FR was a decline in the Na-CMC content in the final anode material (see Figure S1, supporting information) [56,63]. It should also be mentioned that deviations in viscosity for all three FRs were less pronounced at concentrations of up to 20 wt.%, especially at higher shear rates. Beginning with concentrations of 35 wt.%, the anode material containing lithium oxalate appeared to be more viscous, and the slurry with sodium malonate appeared to be less viscous. This trend persisted for the samples with a 50 wt.%. A possible explanation for this observation is the difference in solubility of these FRs in water (Table 1). Lithium oxalate, with a solubility of 55 g∙L−1, is the least soluble FR. The solubility of sodium fumarate is 220 g∙L−1, and sodium malonate is most soluble FR with a solubility of 1155 g∙L−1.
In order to achieve a large variety of different lithium-ion cell designs, electrodes must be folded and winded many times during the manufacturing procedure. Therefore, highly flexible electrodes with stable material layers are needed for the large-scale production of batteries. Additionally, the heating of the anode foils during the electrode preparation (drying) as well as the charge–discharge cycling reduces the adhesion of the graphite. This leads to a higher fragility of the active material and its delamination from the copper current collector, hence limiting its application in the battery assembly. Delamination of the electrode material strongly negatively influences the electrochemical performance, e.g., by an increase of overall resistance; it may even cause an internal short circuit [50,64,65,66,67,68]. The adhesion/cohesion properties of the electrode layer and the layer thickness determine its mechanical stability and define an applicability of the anode for battery assembly. The mandrel bending test serves as a fast and easy method for adhesion/cohesion property evaluation. For these aims, several anodes with predefined thickness were prepared in the same way as for the coin cell or pouch-bag tests and dried as described (Table 1). Each foil was placed on the cylinder surface, beginning with the largest (32 mm diameter) and ending with the smallest (2 mm diameter), and then bent. After each bending procedure, the foil was carefully examined using a light microscope with the aim to detect any splits or detachment signs. The test results are listed in Table 3. Commercial graphite foil from Custom Cells did not reveal any sign of split or detachment up to 2 mm, whereas the self-made graphite without an FR showed small splits at 2 mm but did not show any sign of particle detachment.
The presence of small amounts of FR (up to 10 wt.%) did not deteriorate the adhesion/cohesion properties of an anode material. Only small splits in the layer/coating were observed in the case of Li oxalate by concentrations of 10 wt.%. The adhesion/cohesion properties were comparable with pristine graphite (both self-made (SM) and purchased from Custom Cells). A poorer cohesion was observed for moderate concentrations of FRs (20 wt.% and 35 wt.%) in a layer, especially for samples using Na malonate. The first small cracks on the electrode sheet were detected after bending it over a cylinder with a diameter of 20 mm. This effect became even more obvious when the concentration reached 50 wt.%. The signs of cracks could already be observed by bending the sheet over the 32 mm cylinder for both Na fumarate and Na malonate. Poor adhesion thereby led to detachment from the current collector when a bending diameter of 10 mm was reached. This behavior could be explained by the lower content of the Na-CMC binder in the layer when compared to other solid components. This decreased with the increasing concentration of FR, as well as with changes in the binder structure described above. Surprisingly, the anode foils with added lithium oxalate were less influenced by this effect. The layers demonstrated good adhesion properties even at 50 wt.%. Another reason for poor adhesion and cohesion is the layer thickness. As was mentioned previously, thicker films must be coated for slurries with higher FR concentration to fulfil the specific capacity criteria (a minimum of 2.0 mAh∙cm−2). Kishimoto et al. [69] showed that the crack initiation depends on the maximum strain from bending, which is higher in thicker films.
NA—no signs of any damage, even with the lowest bending diameter of 2 mm.
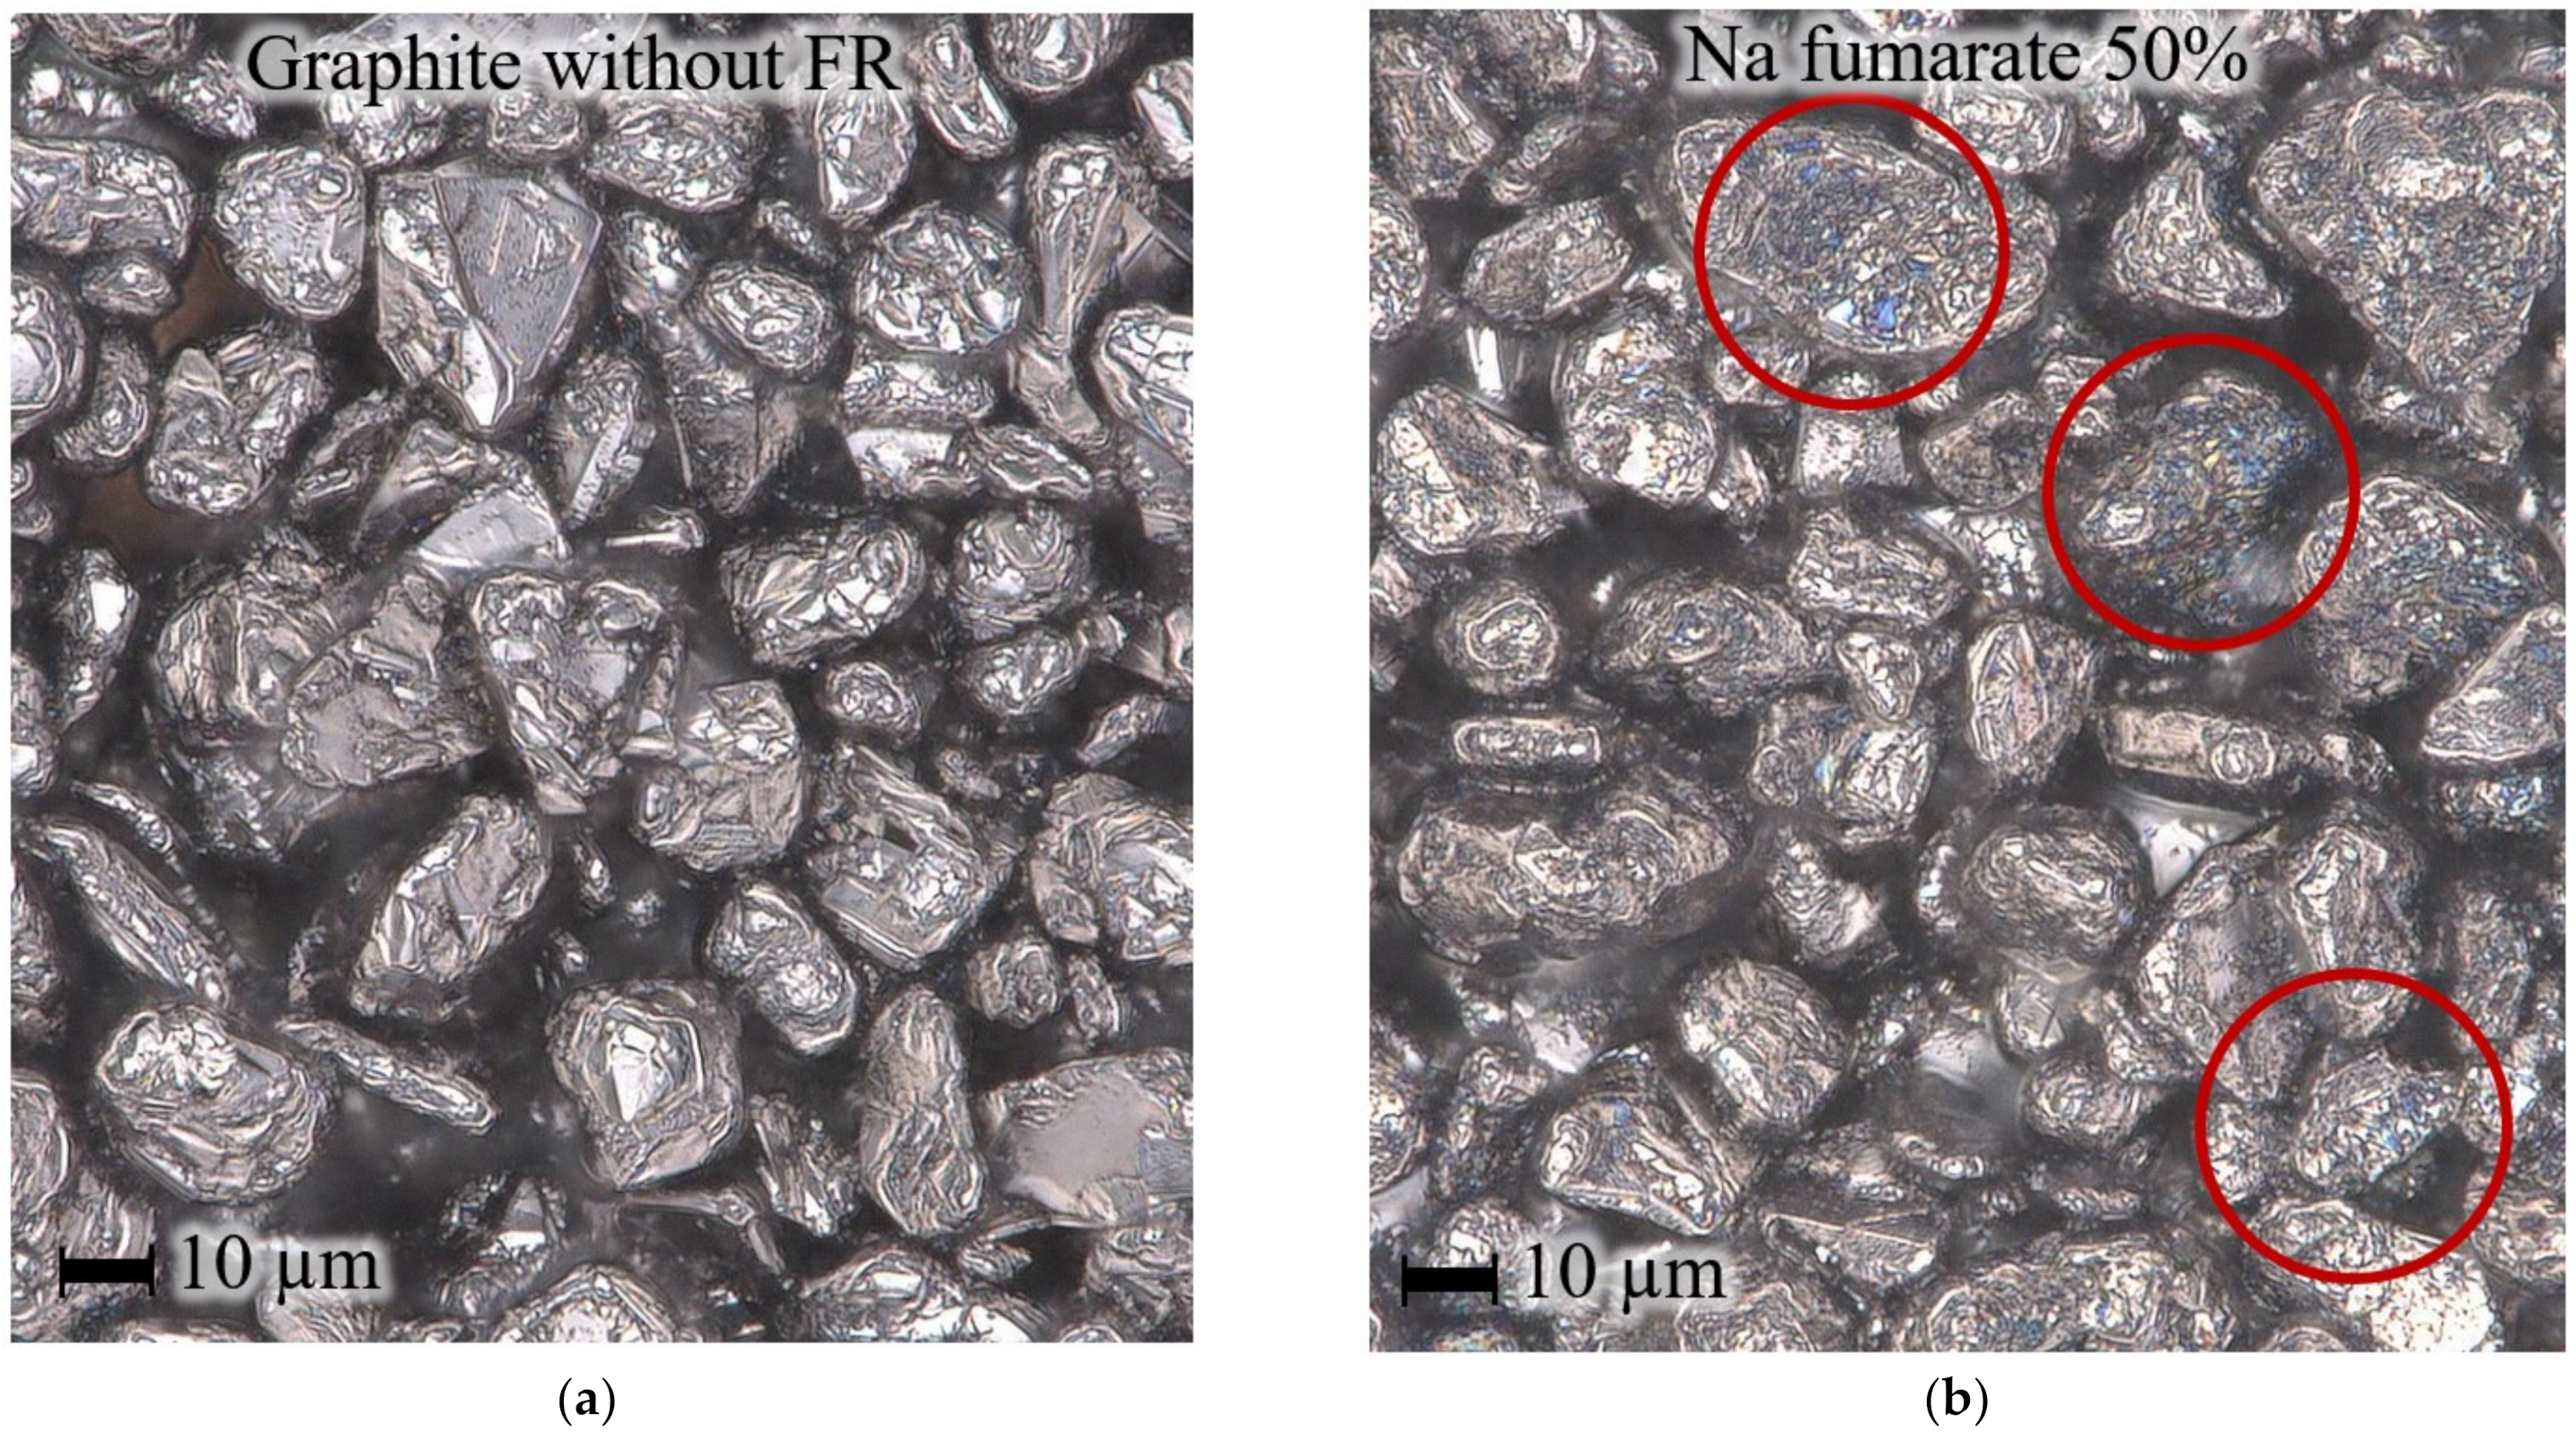
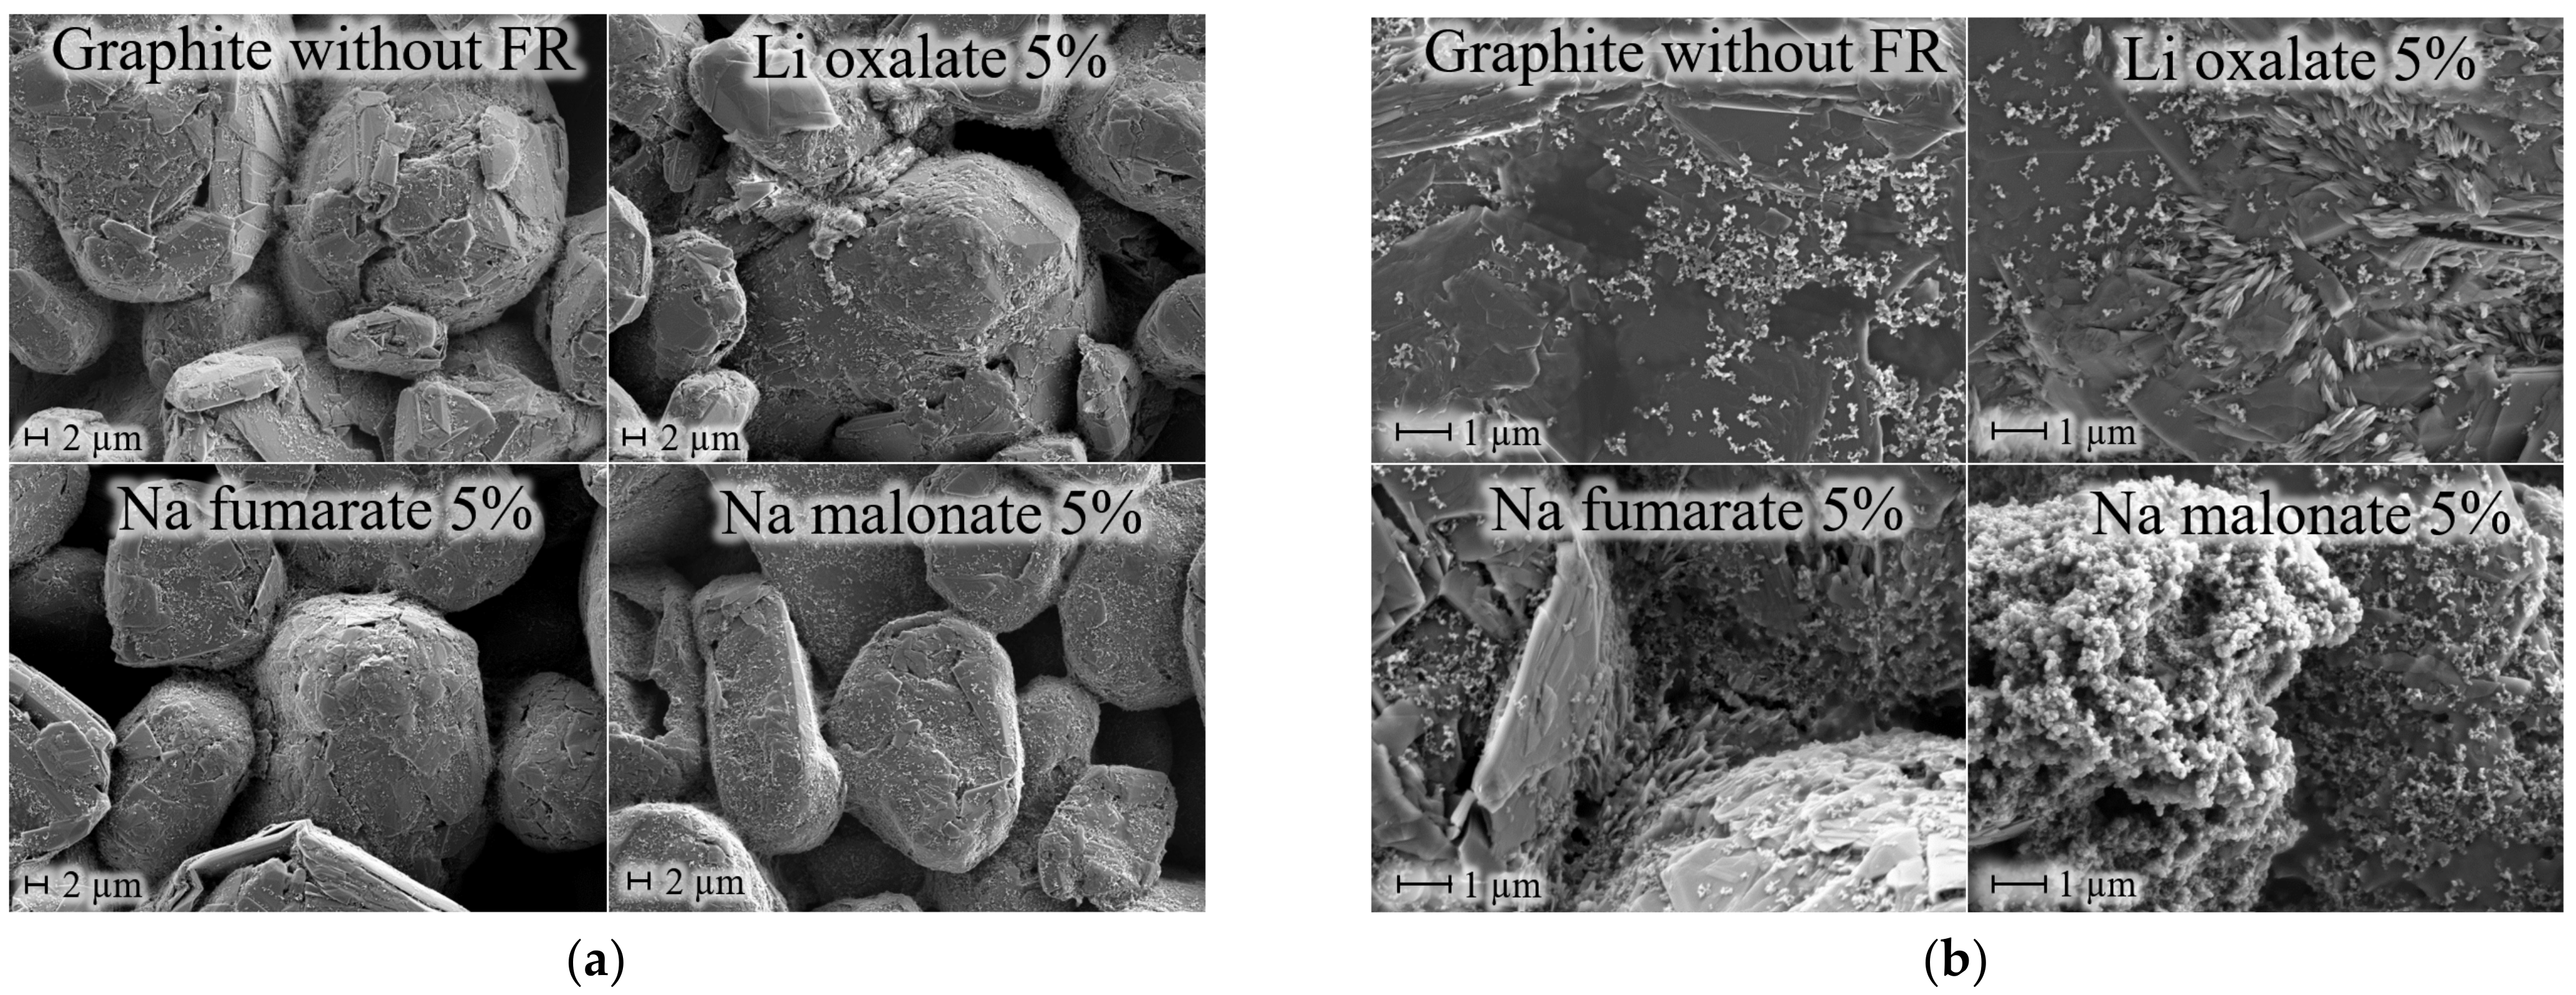
Anodes prepared for cell test performances were also studied using light microscopy and SEM to gain an overview of the FR distribution inside the anode layer. Figure 5 shows the anode with 50 wt.% of sodium fumarate and the anode without an added FR. The image of the pristine slurry demonstrates predominantly graphite particles as the main component of the anode material. Carbon black, Na-CMC and SBR-binder cannot be identified because of resolution limitations. In contrast, some blueish inclusions on graphite particles are observed when the FR was added (highlighted in the figure with red circles). These inclusions can be ascribed to the crystals of the organic FR. Thus, one can be sure that FRs do not cover the entire anode surface with an impenetrable film even at high FR concentrations and, therefore, the graphite with an FR remains accessible for Li-ion de/intercalation during dis/charging. SEM images provide a deeper insight into the anode layer structure when an FR is added (Figure 6).
Graphite particles covered with active carbon can be recognized. Organic Na-CMC and SBR-binder partially cover the graphite surface. Small amount of FRs (5 wt.%) added to the slurry dissolved in the binder completely during anode material preparation (Table 1). Therefore, one can imagine that added FRs affect the binder structure. Figure 6b demonstrates these changes. Crystals of organic salts can be distinguished from graphite, active carbon and pristine binder by their appearance. Thus, lithium oxalate builds wire-like crystals between particles and single crystals on the graphite-particle surface. Sodium fumarate can be described as sharp crystals in binder. Sodium malonate crystals appear as fine grains connected to pore structure. In its turn, this finding explains and accomplishes the results of mandrel bend test (Table 3). Binders mixed with FRs are not able to maintain good cohesion as well as the adhesion properties of the anode, especially at high contents of the FR.
The resistivity of a lithium-ion battery depends on the resistance of its components and the resistance due to phase changes. For a better electrochemical performance of the battery, electrodes with a low internal resistance are required. To gain a better overview of the impact of FRs on the anode resistance, the specific resistance of a pristine anode coating was studied. For that purpose, four layers with different thicknesses— namely, 80 µm, 240 µm, 750 µm and 1040 µm—were coated on a glass plate, dried, and studied using electrochemical impedance spectroscopy (EIS). Figure 7 demonstrates the measured electronic resistance of FR-free electrodes in dependence of the sample length for all four layers. The measurements demonstrate a clear linear tendency. The resistance was high for a thinner layer and decreased with an increasing thickness. The higher slurry volume allowed electrons to move more freely. At the same time, the measured resistance grew with an increased path of coating between the Cu plates. Apparently, the slurry layer can be considered a typical conductor. Its resistance is directly proportional to its length (or distance, L) and inversely proportional to its cross-sectional area, A (Equation 1), in which R is the resistance [Ohm] and ρ is the specific electrical resistivity [Ohm·m]. An offset (Figure 7) can be caused by Cu plates that are not perfectly in place. A specific resistivity of the layer can be calculated using the following Equation (2), in which d is the width of the slurry stripe on the glass plate in meters and h is the layer height (thickness) in meters. The calculated specific electrical resistivities for all layer thicknesses are summarized in Table 4.
R = ρ L A
ρ = R A L = R d · h L
The anode slurry consisted of a large amount of graphite and some percent of conductive carbon black, SBR-binder and Na-CMC. Consequently, the resistivity of the layer depended predominantly on the specific electrical resistivity of graphite. The electrical conductivity or resistance of a material depends on the charge mobility in its structure. From this point of view, graphite can be considered semi-metallic. The electrons can move easily along a basal plane, as in a conductor, but not between layers. As a result, the resistance perpendicular to the graphene layers is very high, and graphite acts as an electrical insulator. Hence, the resistance values for graphite vary between 0.0025 and 0.005·10−3 Ohm·m (when the current flow is parallel to the graphite layers) and 3·10−3 Ohm·m (when the current flow is perpendicular to the graphite layers) [70]. The calculated resistance is in a good agreement with this data.
The same experiment was performed for layers containing FRs. FRs are organic salts; thus, their electric conductivity is considerably smaller in comparison to graphite and carbon black. Consequently, the resistivity of a slurry/FR-mixture is expected to be significantly higher and to increase with increasing concentrations of the FR. Table 5 and Figure S4 in the supporting information summarize this behavior. The resistance for all three FRs at different concentrations was measured in the same way as for the FR-free coating. The measured resistance rose by increasing the concentration of all the chosen FRs. Li oxalate, Na fumarate and Na malonate demonstrated similar resistance values for a concentration up to 20 wt.%. This behavior remained similar for Li oxalate and Na fumarate at even higher concentrations, while the resistance observed for Na malonate appeared to be ca. 5 times larger at 50 wt.%. The calculated specific resistance supports this observation. Hence, the presence of a higher amount of FR in the electrode is desirable from the safety point of view but appears to be challenging for the electrochemical performance of the battery.

3.4. Assembly and Testing of Lithium-Ion Cells

The influence of flame retardants on electrochemical cell performance was studied in coin cells with a NMC111 cathode material. The cells were filled with an electrolyte (LP30, LiDFOB + EC/PC or LiTFSI + 1,2-BC/FEC), and glass fiber (QMA) was used as a separator. All coin-cell parts as well as the electrodes and separator sheets were dried carefully in a vacuum oven to remove traces of water. As shown above, high concentrations of FRs in the anode led to poor adhesion and cohesion and, as a result, to splits inside the anode layer and its subsequent delamination from the current collector (Table 3). Such anodes decrease the battery cycle life, and the use of such “damaged” anodes must be avoided. The anodes with FRs were processed and handled very carefully.
Coin-cell tests were performed on anodes with FRs loaded with three different electrolytes. Figure 8 shows the discharge capacities for cells with 5 wt.%, 20 wt.%, and 50 wt.% of FR discharged with 1C, 5C and 10C. From an electrochemical point of view, LP30 and LiDFOB + EC/PC appear to be better electrolytes than LiTFSI + 1,2-BC/FEC. Cells loaded with these electrolytes delivered, on average, more capacity than cells loaded with LiTFSI + 1,2-BC/FEC at all discharge rates. The type of the FR has less impact on the capacity. Higher discharge rates led to a capacity decrease for all electrolytes and all flame retardants because of the higher resistance. The impact of this decrease is individual and characteristic for both the flame retardant and the electrolyte. Thus, the discharge capacities of the cells with LP30 were, on average higher, than for the LiDFOB+EC/PC and LiTFSI + 1,2-BC/FEC mixtures (125–135 mAh∙g−1 for 1 C, 30–80 mAh∙g−1 for 5 C, and 10–30 mAh∙g−1 for 10 C). This can be explained by the lower ion conductivity/higher viscosity of the two latter electrolyte mixtures, causing an aggravated lithium mobility at high current rates (Table 2). Individual deviations in discharge capacity could be also explained by the fact that the self-made anodes were not calendered. This especially affected the electrodes with higher FR contents and thus higher layer thicknesses.
Cells loaded with the LiDFOB + EC/PC electrolyte mixture delivered discharge capacities at 1 C, comparable to the cells containing LP30. Increased C-rates led to significant capacity drop (from 120–130 mAh∙g−1 at 1 C to 20–40 mAh∙g−1 at 5 C and to 5–20 mAh∙g−1 at 10 C), which was caused by the higher resistance, as described previously. Interestingly, increasing the FR content did not lead to further discharge-capacity losses, as was observed for LP30. The capacity values for 5% and 20% Li oxalate and Na fumarate were comparable. Cells using Na malonate loaded with LiDFOB+EC/PC demonstrated a behavior similar to the LP30. Increased amount of FRs resulted in a decrease of cell capacity if the electrode dimensions were maintained (thickness, etc.). Lithium-ion cells loaded with LiTFSI+1,2-BC/FEC had the lowest discharge capacity values (100–120 mAh∙g−1 at 1 C, 15–20 mAh∙g−1 at 5 C and 1–10 mAh∙g−1 at 10 C) because of their low ion conductivity (Figure S5, supporting information). As an electrolyte, LiTFSI+1,2-BC/FEC caused performance fading for all C-rates and all FRs. This effect was less pronounced for Li oxalate and Na fumarate and more obvious for Na malonate. Obviously, Na malonate had more of an impact on SEI building and thus on the capacity decrease. Although it is known from the literature that LiTFSI is highly corrosive toward Al, no signs of this could be observed in coin-cell test performance up to potentials of 4.2 V vs. Li/Li+ [24,71]. Thus, the decreasing specific capacity in the presence of LiTFSI was predominantly caused by its low conductivity. The Coulomb efficiencies of the FR-containing cells show that the cells did not change significantly in the presence of the FR (Figure S6, supporting information).
Pouch-bag cells were used for the aging tests. Anodes for pouch-bag cells with 5 wt.% of FR were prepared in the same way as the anodes for coin cells. All cell components were dried overnight at 130 °C in the vacuum oven and assembled in a dry room. The pouch-bag cells specs are listed in Table S2 (supporting information). The pouch-bag cycling data delivered results similar to the results for the coin cells (Figure 9). The initial capacities for the three studied electrolytes are almost similar and correspond to the capacities measured for the coin cells (130–140 mAh∙g−1). Capacity deviations between the coin and pouch-bag cells can be explained by differences in the stack pressure between a pouch-bag cell and a coin cell [72]. The main differences between the electrolytes and FRs were revealed after approximately 1000 cycles (see Table S4, supporting information). Thus, LP30 demonstrated the most stable behavior when compared to the LiDFOB + EC/PC and LiTFSI + 1,2-BC/FEC mixtures. At least 80% (for Na fumarate and pure graphite) and 87% (for Li oxalate and Na malonate) of the initial capacity were kept in the pouch-bag cells after 1024 cycles. The LiDFOB + EC/PC electrolyte caused a significant capacity loss for all the examined anode materials. This effect was more obvious for cells with Na fumarate and Na malonate. After 100 cycles, the capacity had already decreased to 60% of its initial value and remained constant up to 1024 cycles. Cells with graphite and Li oxalate demonstrated a more stable cycling performance and therefore less capacity fade (approximately 72% after 1024 cycles). The LiTFSI + 1,2-BC/FEC mixture is highly corrosive to the Al current collector, as was mentioned previously [24,71]. The cell-test performance on pouch-bag cells supported this finding. The discharge capacity dropped dramatically after the 100th cycle for Li oxalate and after the 160th cycle for graphite, reaching almost 0 mAh∙g−1 after the 200th and 750th cycles, respectively.
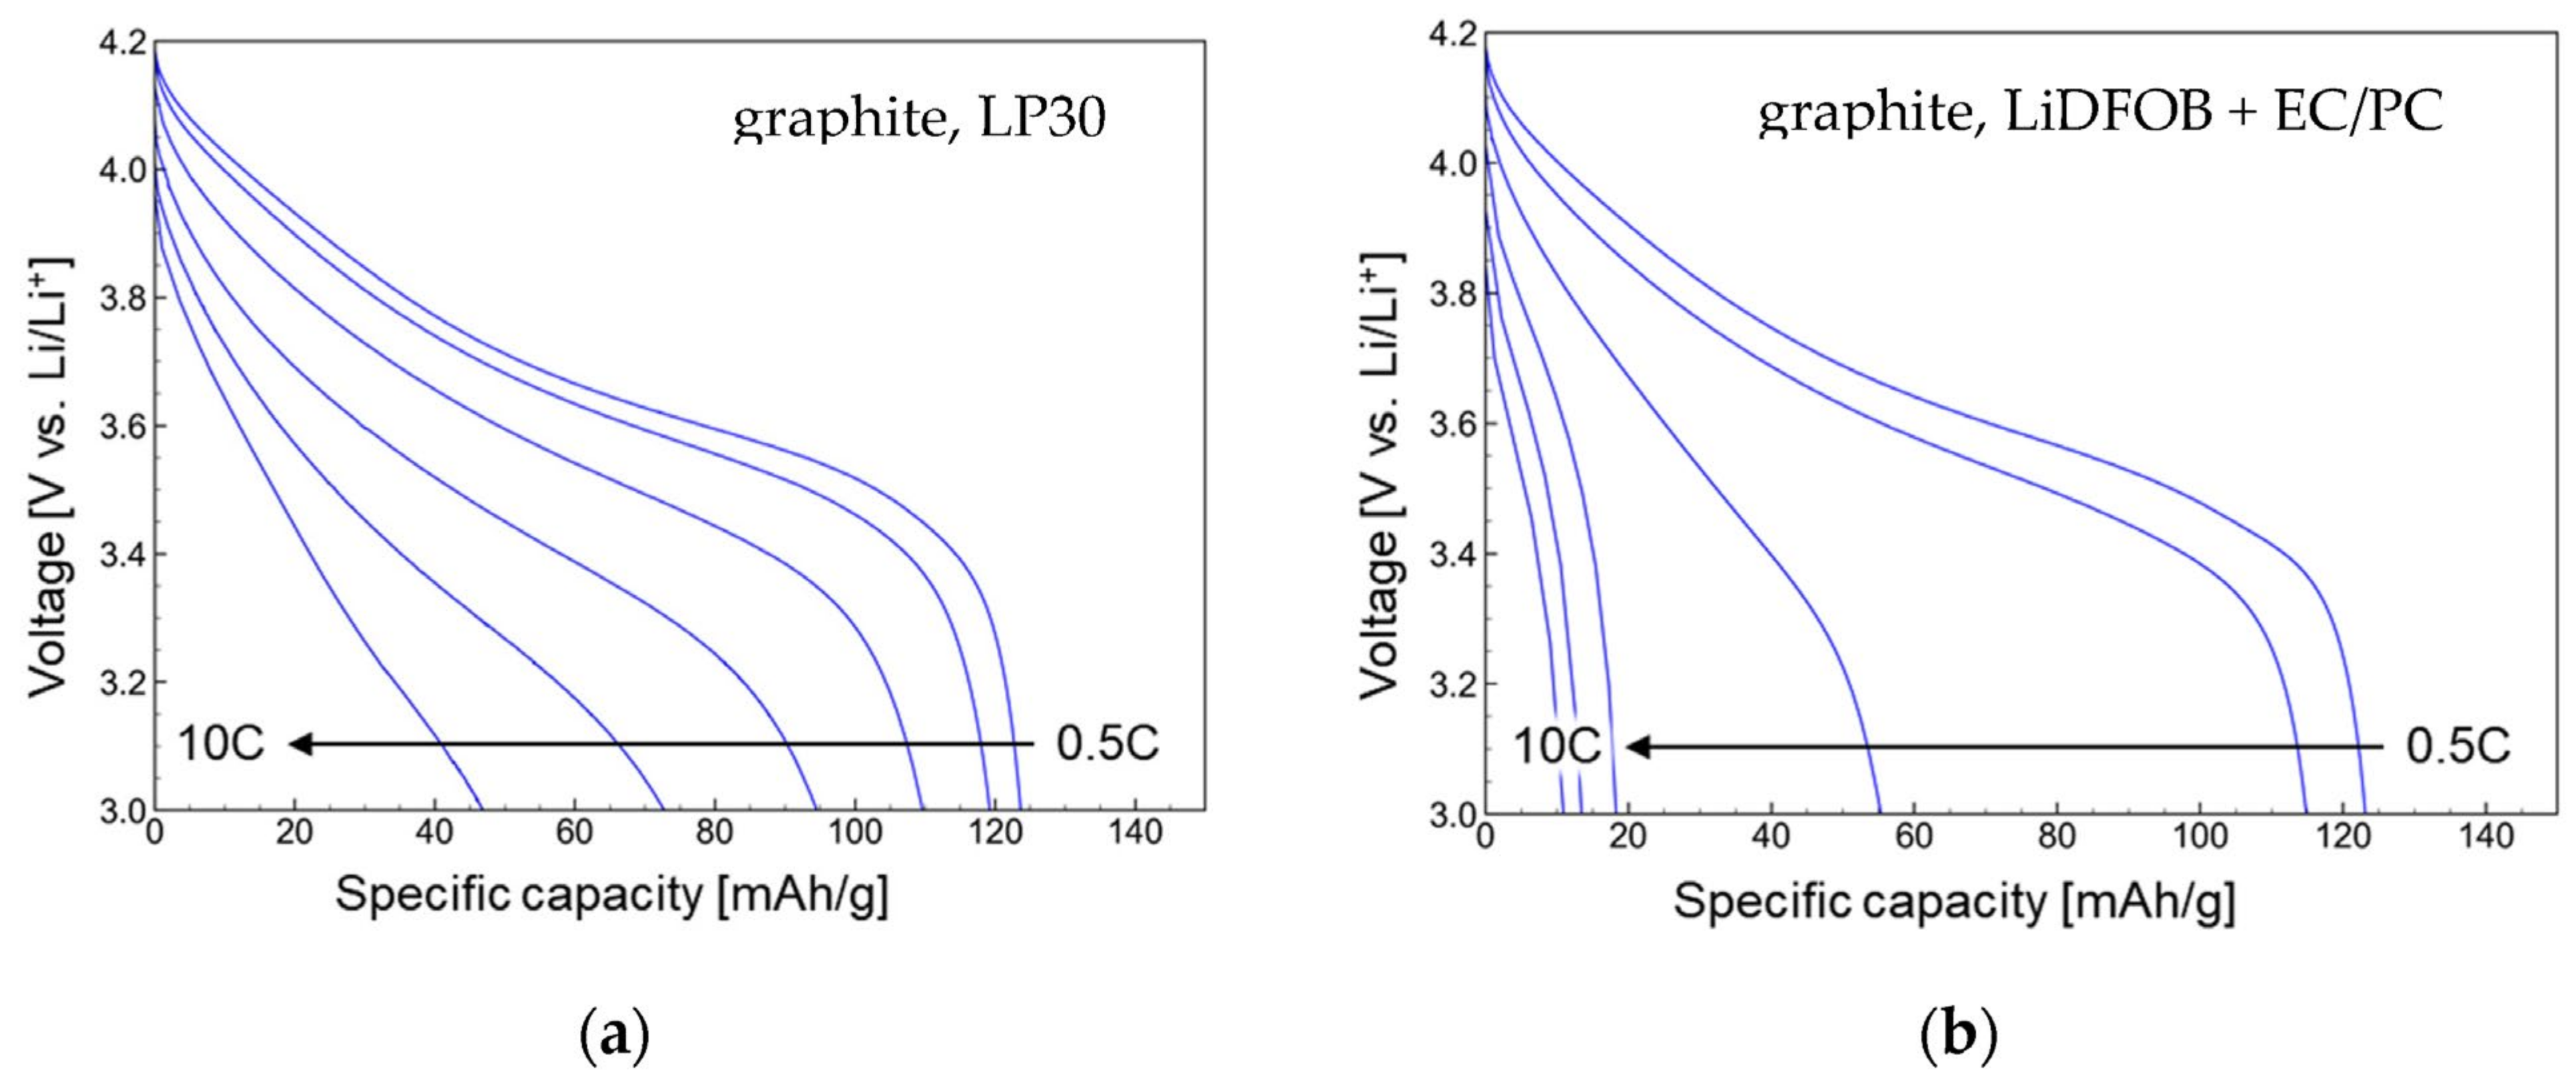
A rate capacity test was also performed for the pouch-bag cells by charging them with 0.5 C and discharging with different C-rates from 0.5 C to 10 C (0.5 C, 1 C, 2.5 C, 5 C, 7.5 C and 10 C) (Figure 10).
This test was performed directly after the formation cycles at the beginning of the cell cycling. The cells loaded with LP30 and LiDFOB + EC/PC showed similar capacities at 0.5 C, which only slightly decreased at 1 C. For detailed information, the FR results of the discharge curves are shown in Figure S7, supporting information. An increased discharge capacity (2.5 C and higher) caused a capacity fade for both electrolytes but, in the case of the LiDFOB mixture, an increased current led to a dramatic capacity drop (55 mAh∙g−1 for LiDFOB vs. 110 mAh∙g−1 for LP30 at 2.5 C, and 10 mAh∙g−1 for LiDFOB vs. 4 mAh∙g−1 for LP30 at 10 C). The hinderance of Li-ion diffusion at high current rates is related to the lower ion conductivity of LiDFOB + EC/PC and therefore to higher resistance. Similar observations can be made for the cells containing FRs. The discharge capacities of the cells loaded with the LiDFOB + EC/PC mixture were more affected by the increasing current than the cells with LP30.
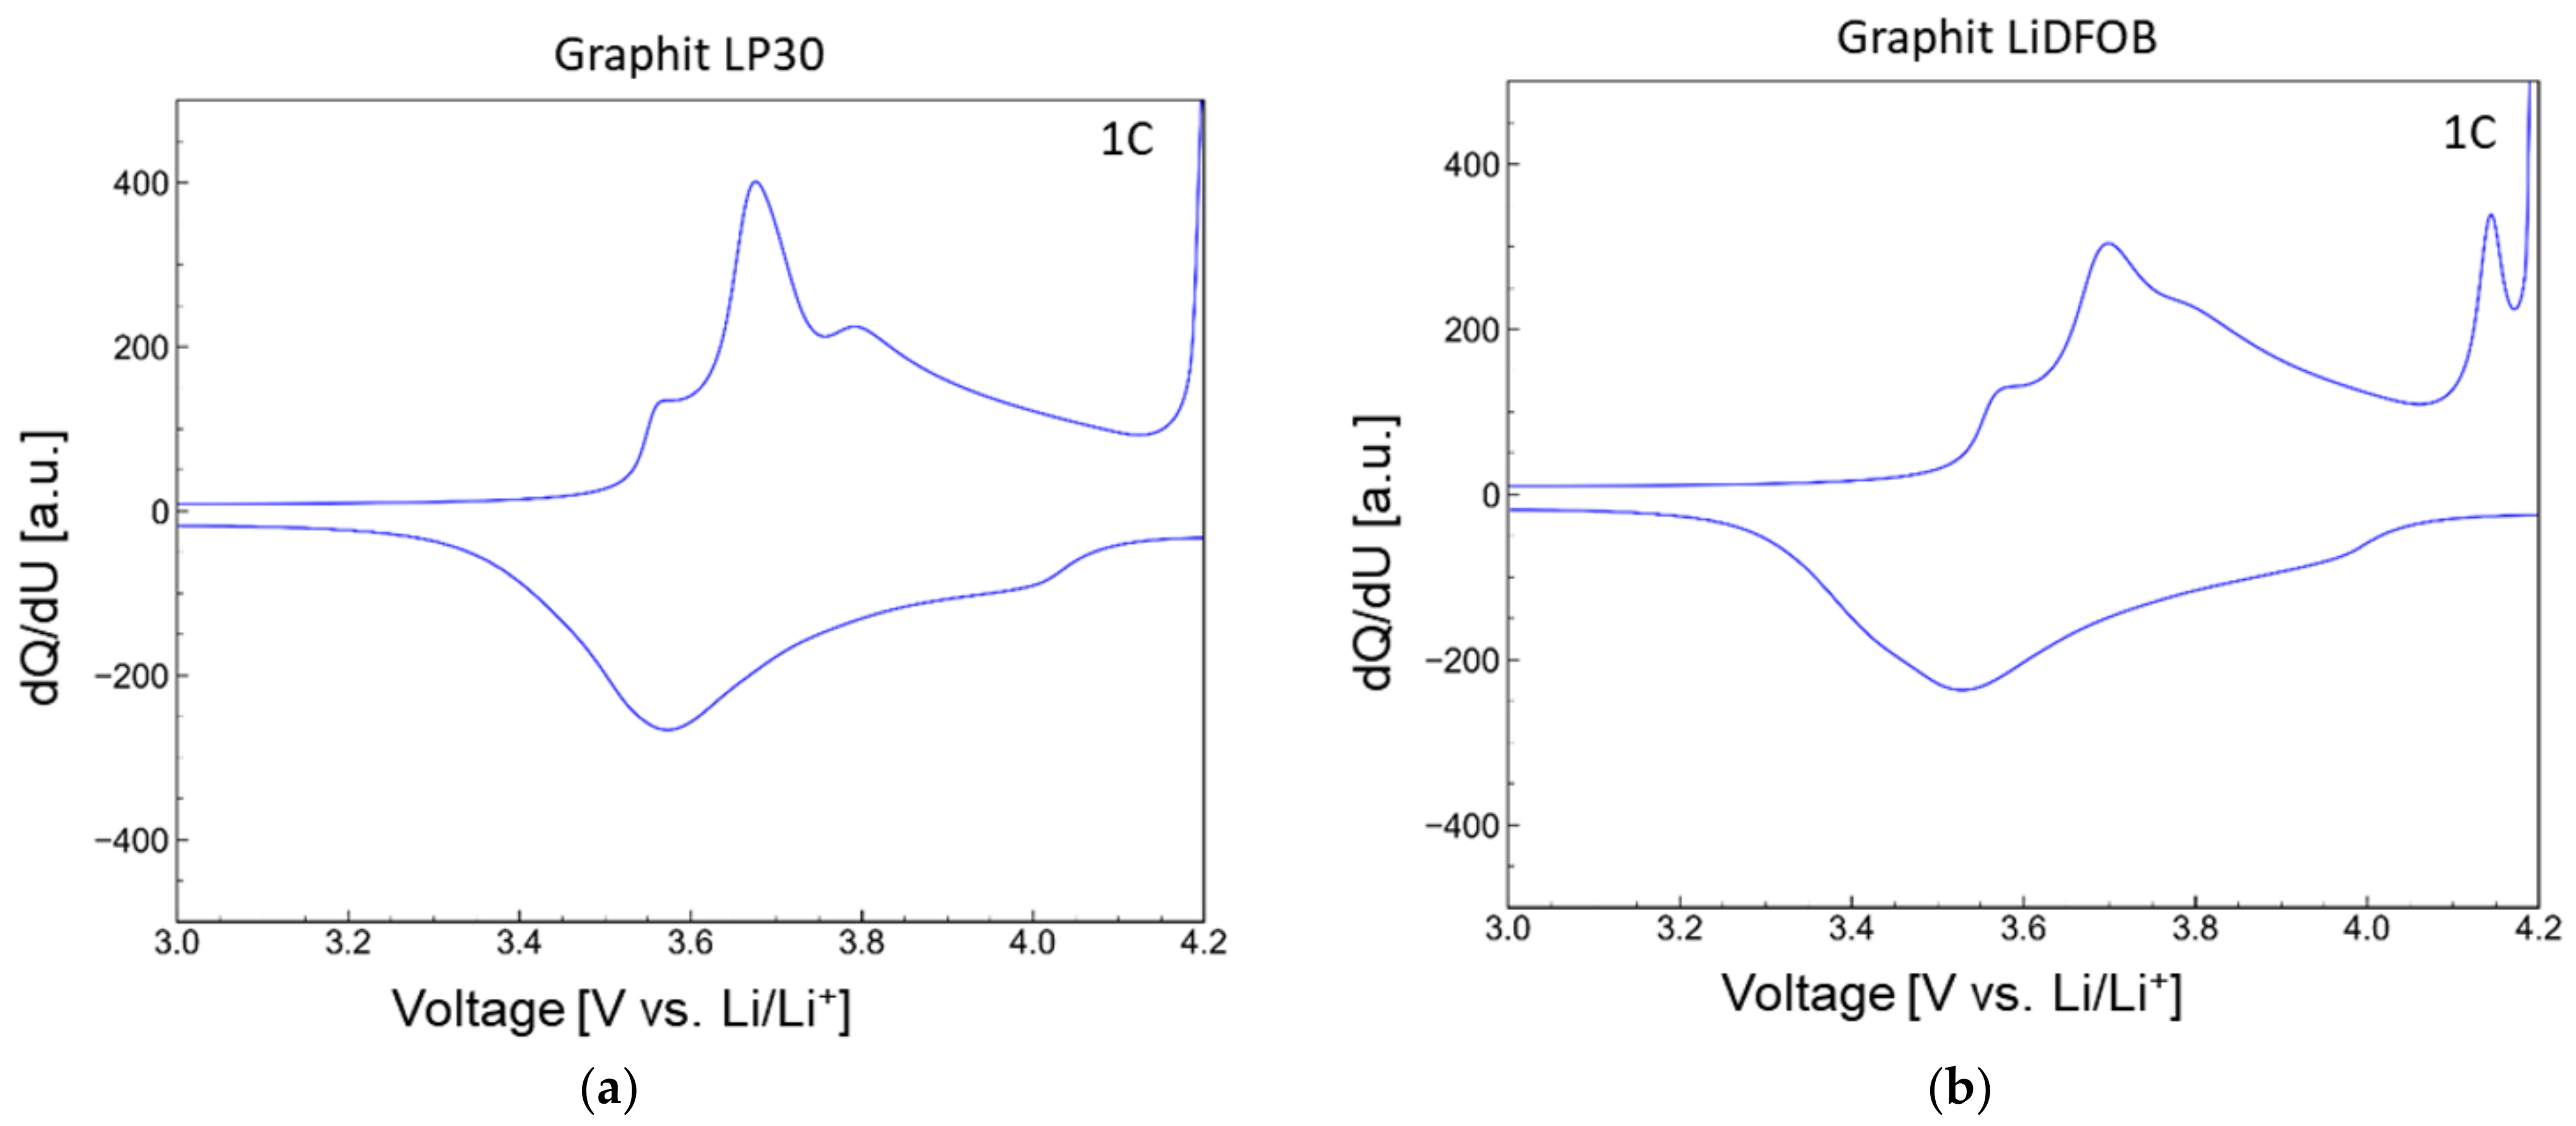
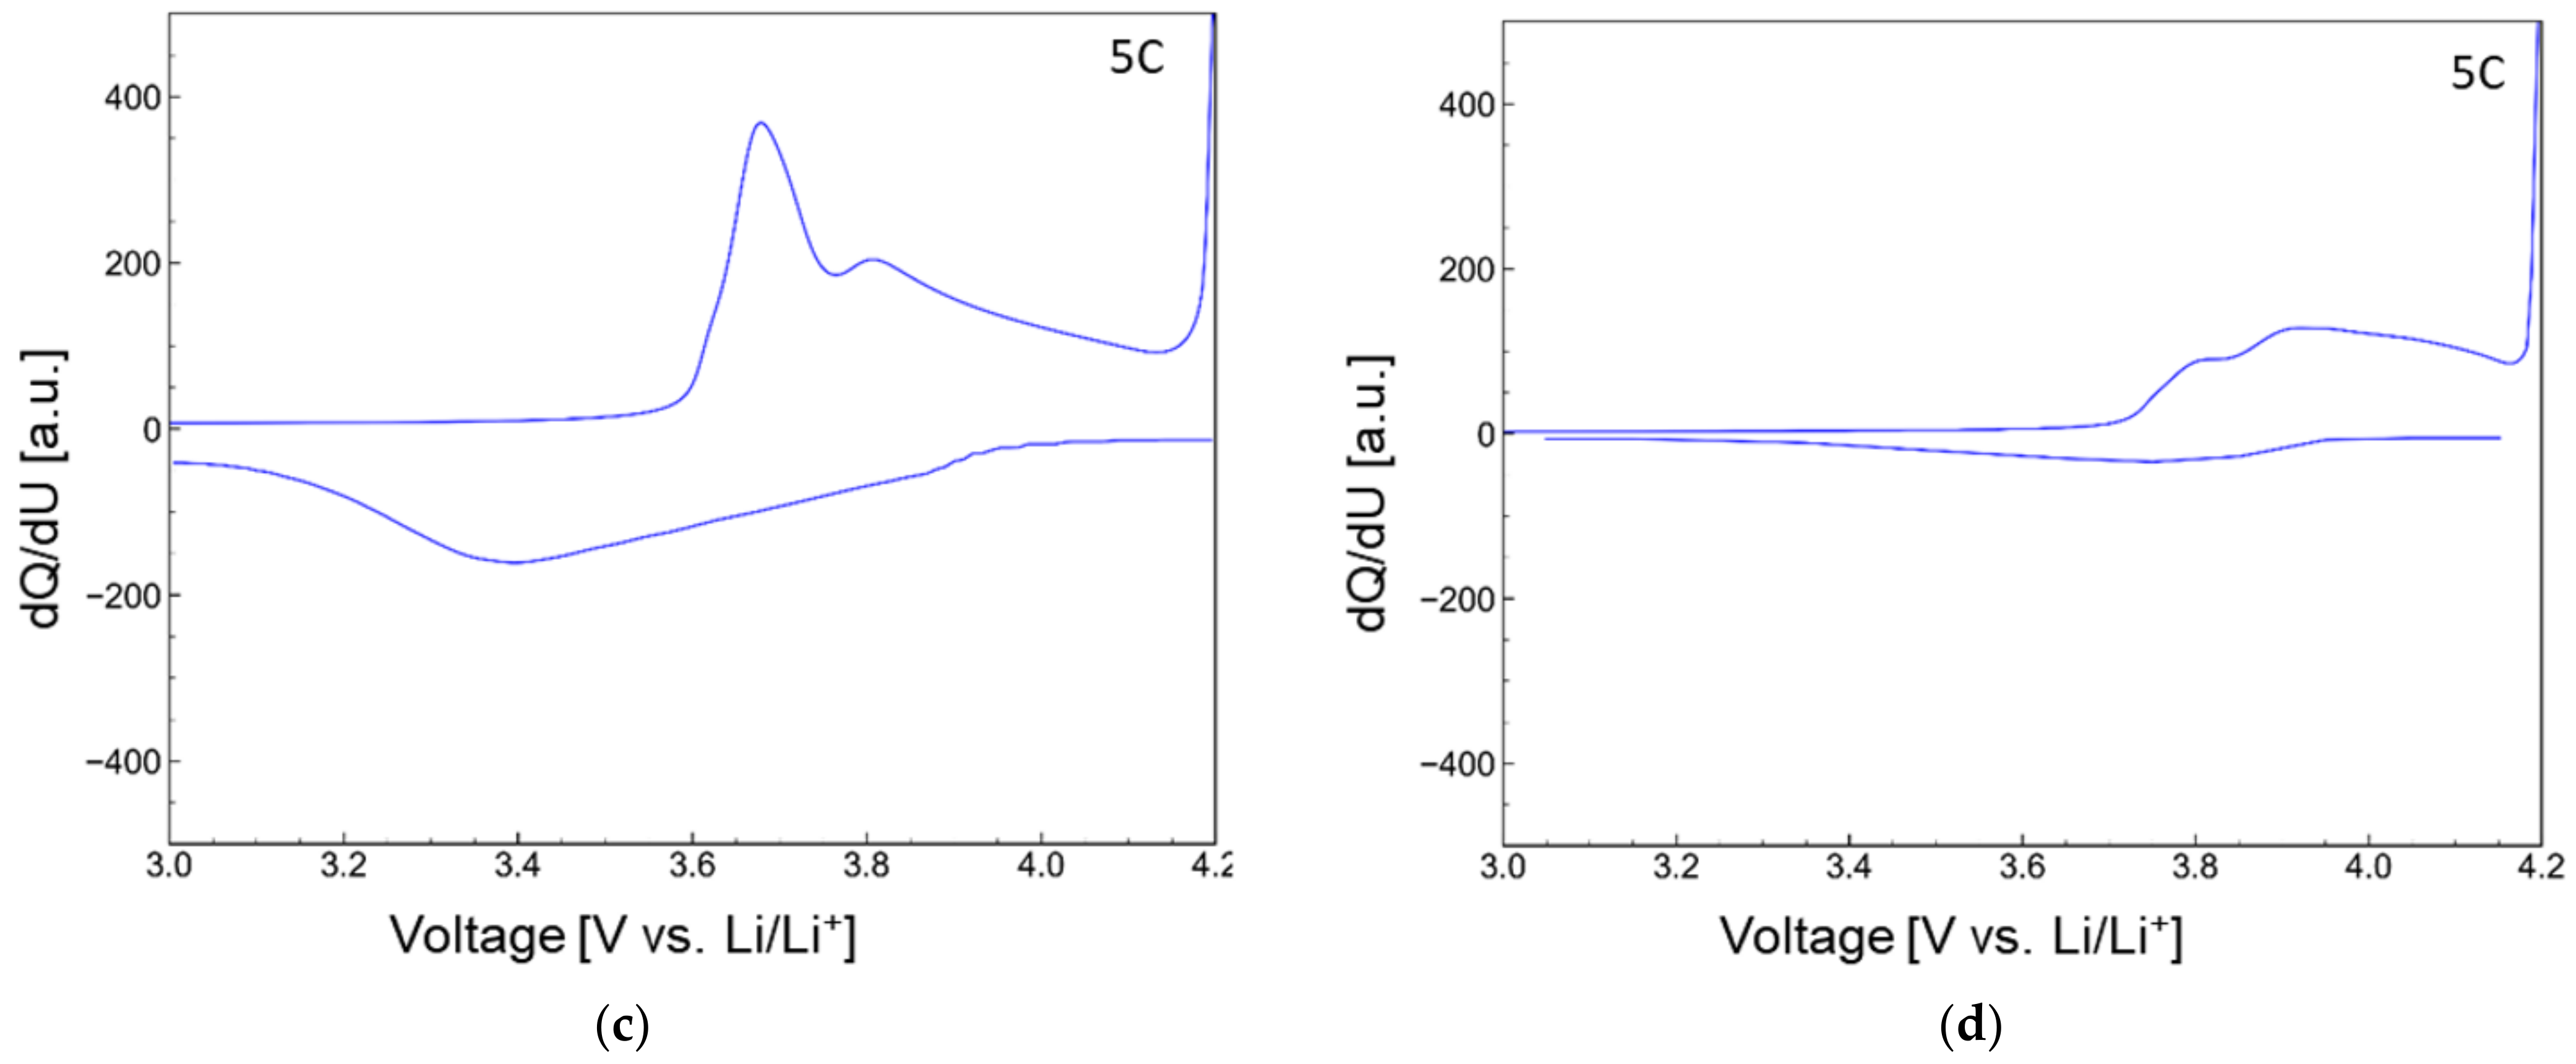
Differential capacity curves (dQ/dU) demonstrate a redox response of the NMC111-and-graphite-based anode with and without FR during charging/discharging, depending on the studied electrolytes. Figure 11 shows the results for the pure graphite anode. The corresponding plots for the FR-containing anode sheets are shown in Figures S8–S10 (supporting information).
Charging at 1 C demonstrated one intense peak at 3.7 V and two less-intense peaks at 3.5 V and 3.8 V. During discharge, only two peaks were observed: a weak peak at 4.0 V and an intense peak at 3.6 V. The intense peaks at 3.7 V (charging) and 3.57 V (discharging) correspond to the Ni2+/Ni4+ couple [73]. A peak at 3.6 V originated from Li intercalation into the graphite anode [74]. By discharging at a rate of 5 C, only two peaks could be found in the anodic scan: 3.7 V and 3.8 V. The peak observed at 3.57 V at 1C was almost merged with the intense peak at 3.7 V. Only two peaks were observed in the cathodic scan direction, which were shifted toward a lower potential when compared with 1 C (3.4 V and 3.9 V at 5 C vs. 3.57 V and 4.0 V at 1 C). An increased shift between the redox peaks at 5 C was caused by a strong polarization effect. Pouch-bag cells loaded with the LiDFOB+EC/PC mixture demonstrated three strong, overlapped peaks between 3.5 V and 3.8 V, corresponding to Ni2+/Ni4+ redox couple, Li-ion intercalation and an intense peak at 4.15 V, which was probably caused by a redox reaction in electrolyte. At a higher discharge rate, all peaks during discharge were shifted to a lower potential; they merged even stronger and lost their intensities. The added FRs influenced this behavior only slightly. Obviously, an electrolyte has more impact on the redox processes during charging/discharging than FRs.

3.5. Post-Mortem Analysis of the Li-Ion Cells

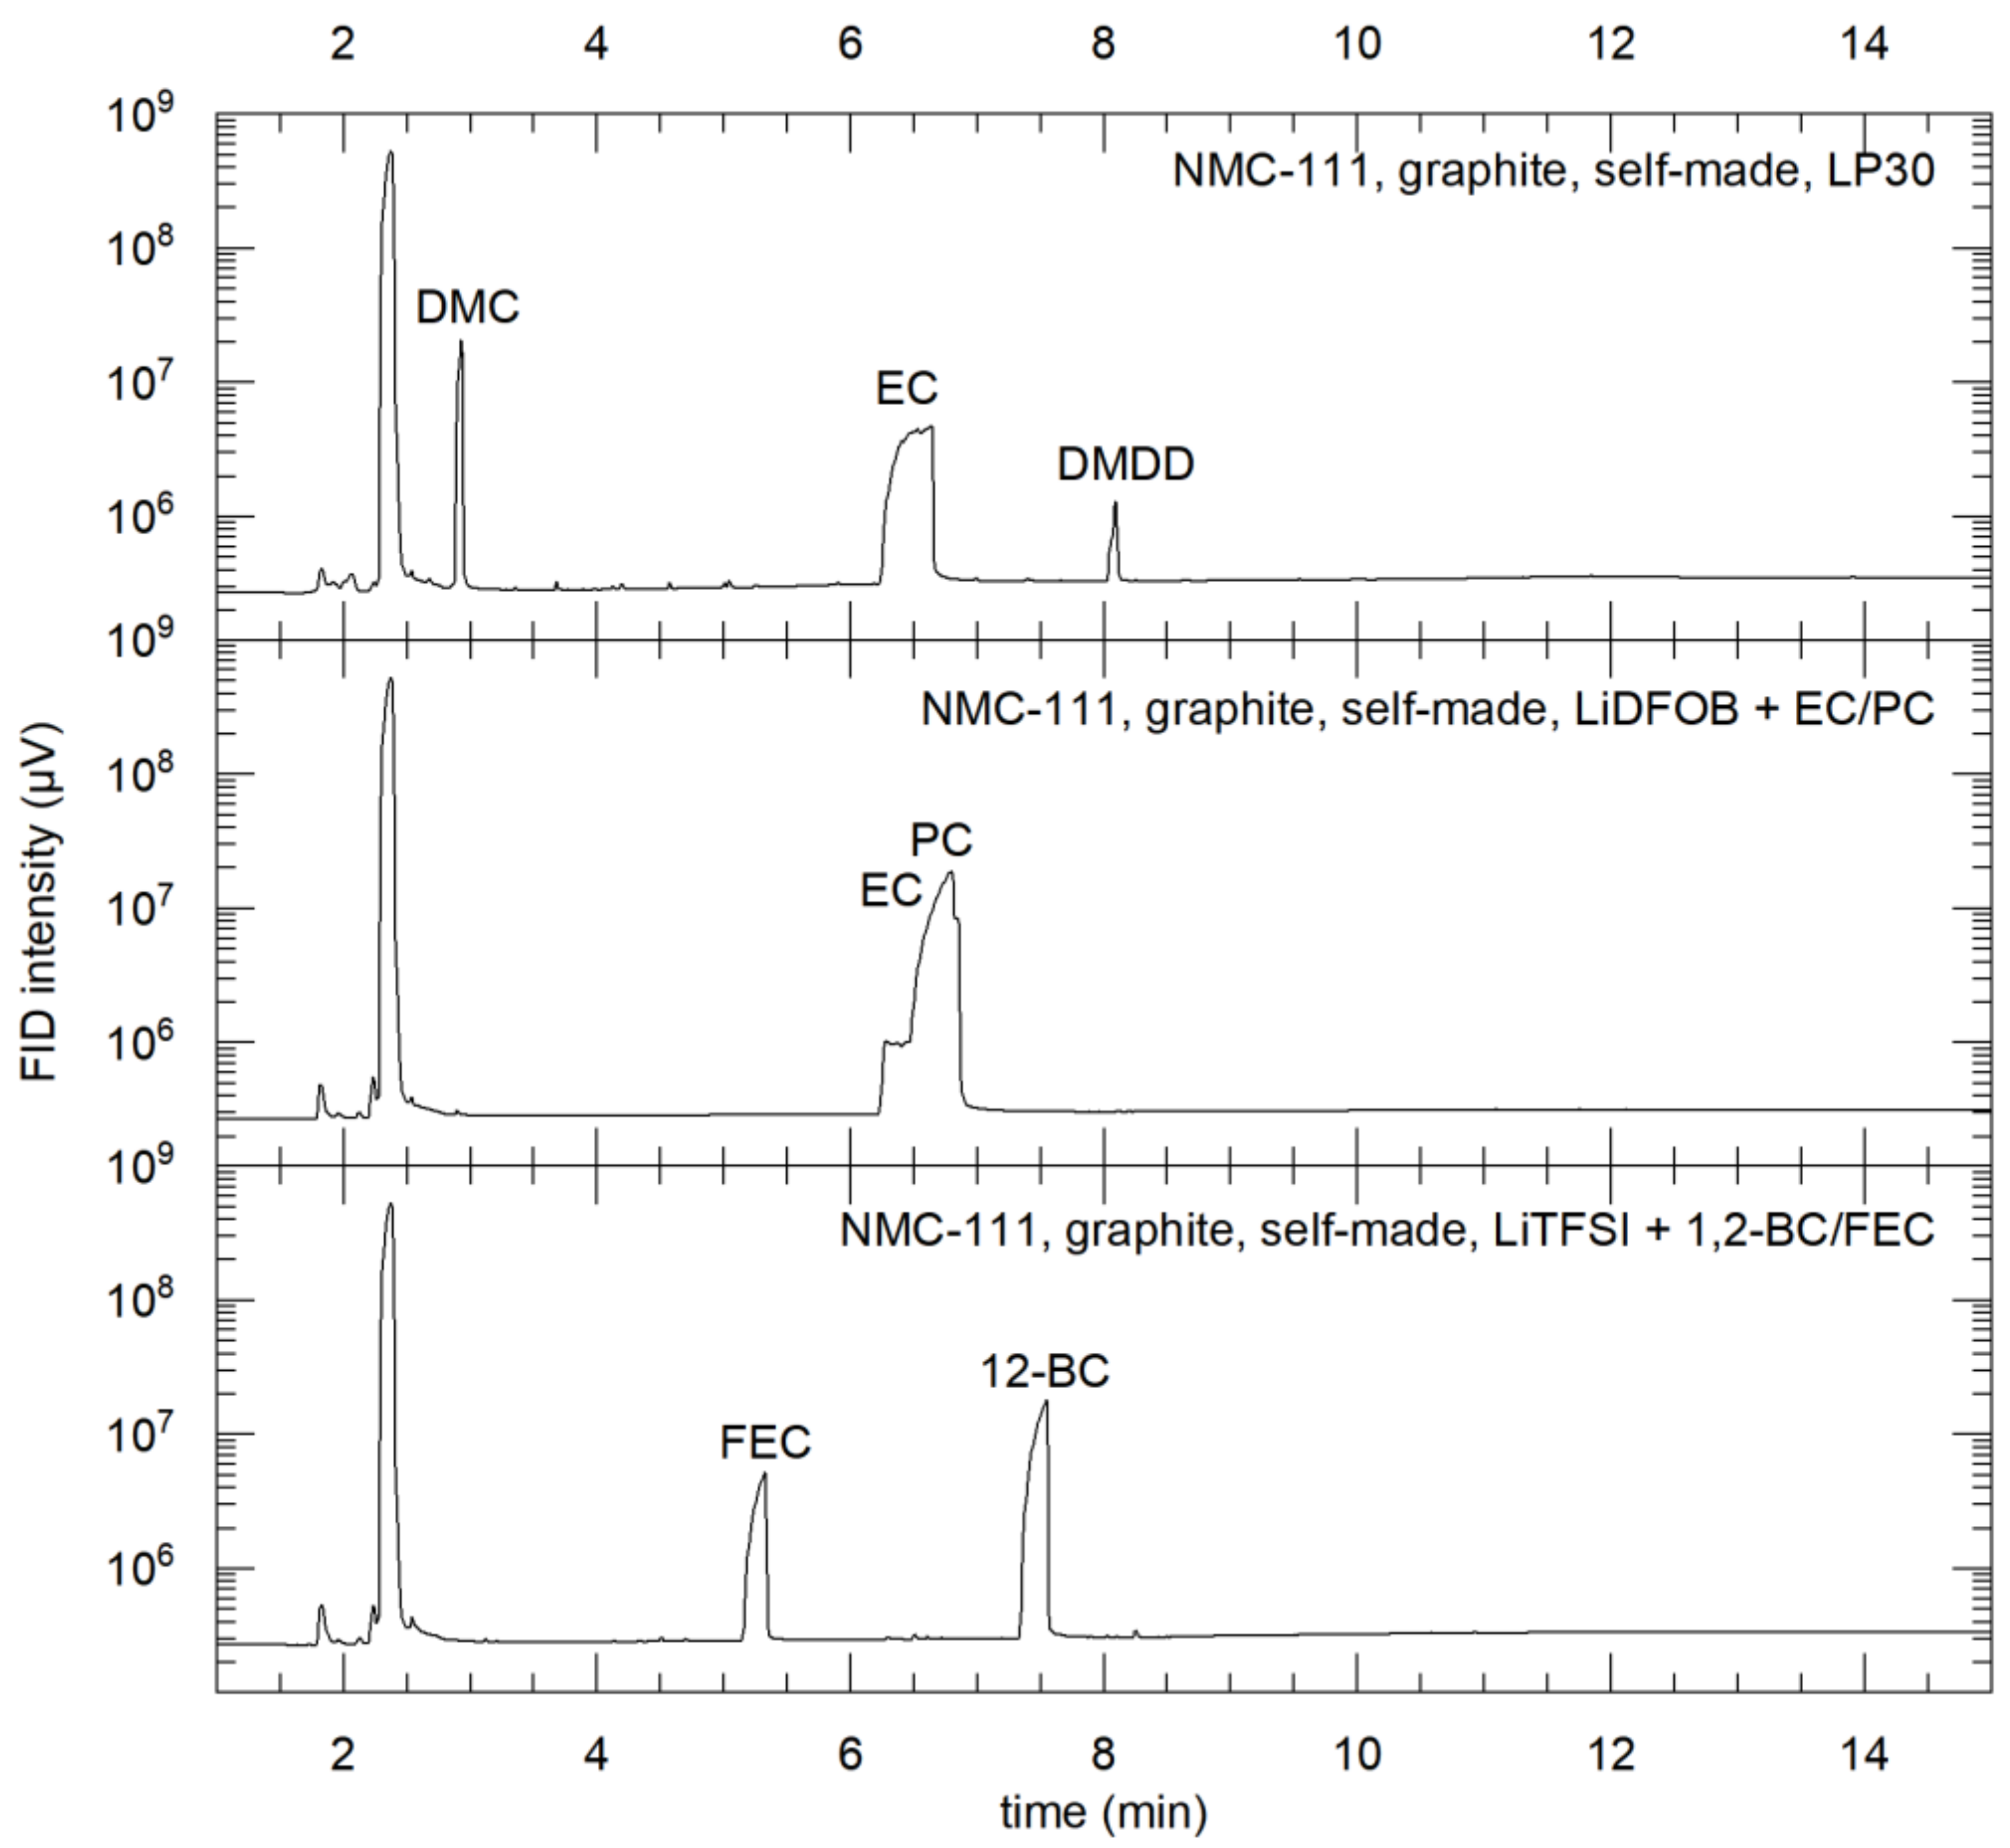
After the coin cells were cycled for 122 cycles, they were disassembled inside an argon-filled glove box. Electrolytes were extracted from the separator, diluted with dichloromethane, and studied with GC-MS (m/z > 15, Figure 12). Chromatograms were acquired for coin cells with pure graphite anodes loaded with LP30, LiDFOB + EC/PC and LiTFSI + 1,2-BC/FEC. Additionally, anodes with FRs in different concentrations were examined as well. Since the aim was to detect decomposition products if possible, the main components were added at a concentration too high for the column (tailing and peak shape).
LP30 is a standard electrolyte for Li-ion batteries. Its decomposition paths have already been studied and reported in the literature [75]. In the presence of water or other impurities, the conducting salt LiPF6 decomposes readily to form LiF, POF3, HF and POF2H and/or POF2(OH) [75]. These decomposition products can be found in the chromatogram in the case of LP30. POF3 can be detected at 1.81 min and POF2(OH) can be detected at 2.2 min (please note that both compounds can only be observed in the MS analysis, not in Figure 12, top). An intense peak at 2.9 min can be assigned to the electrolyte solvent dimethyl carbonate (DMC). The following peak at a higher retention time originates from ethylene carbonate (EC, onset at 6.3 min). The last well-resolved peak at 8.1 min is associated with dimethyl-2,5-dioxahexanedioate (DMDD), which is a product of DMC+EC decomposition. No signs of other analytes were found in the chromatograms, even from cells with high amounts of an organic FR within the anode. The electrolyte mixtures LiDFOB+EC/PC and LiTFSI+1,2-BC/FEC appear to be more stable than LP30. A broad, non-well-resolved peak at 6.9 min in the chromatogram in Figure 12 (middle) belongs to EC and PC solvents that were not baseline separated under the given GC conditions. No other signs of decomposition products can be observed in the chromatogram. The chromatogram of the LiTFSI+1,2-BC/FEC (Figure 12, bottom) mixture demonstrates two well-resolved peaks which can be ascribed to FEC (onset at 5.1 min) and 1,2-BC (onset at 7.4 min), respectively. It can be concluded that FRs neither cause additional decomposition of the electrolyte nor change the LP30 decomposition pathways.
Li-ion batteries can maintain their capacity if they operate in a defined voltage range. Overcharge and depth discharge cause irreversible capacity loss, reduce cycling life and leading to heat generation, which has a negative impact on battery safety. Strong overcharge triggers Li plating, SEI and electrolyte decomposition and gas generation, which also accelerates cell decomposition [76,77]. Systematic overcharge tests on small-format pouch cells are always associated with very large errors. Therefore, a systematic accelerating rate calorimetry (ARC) measurement, including gas detection, will be used to investigate larger-sized pouch cells in a subsequent study.
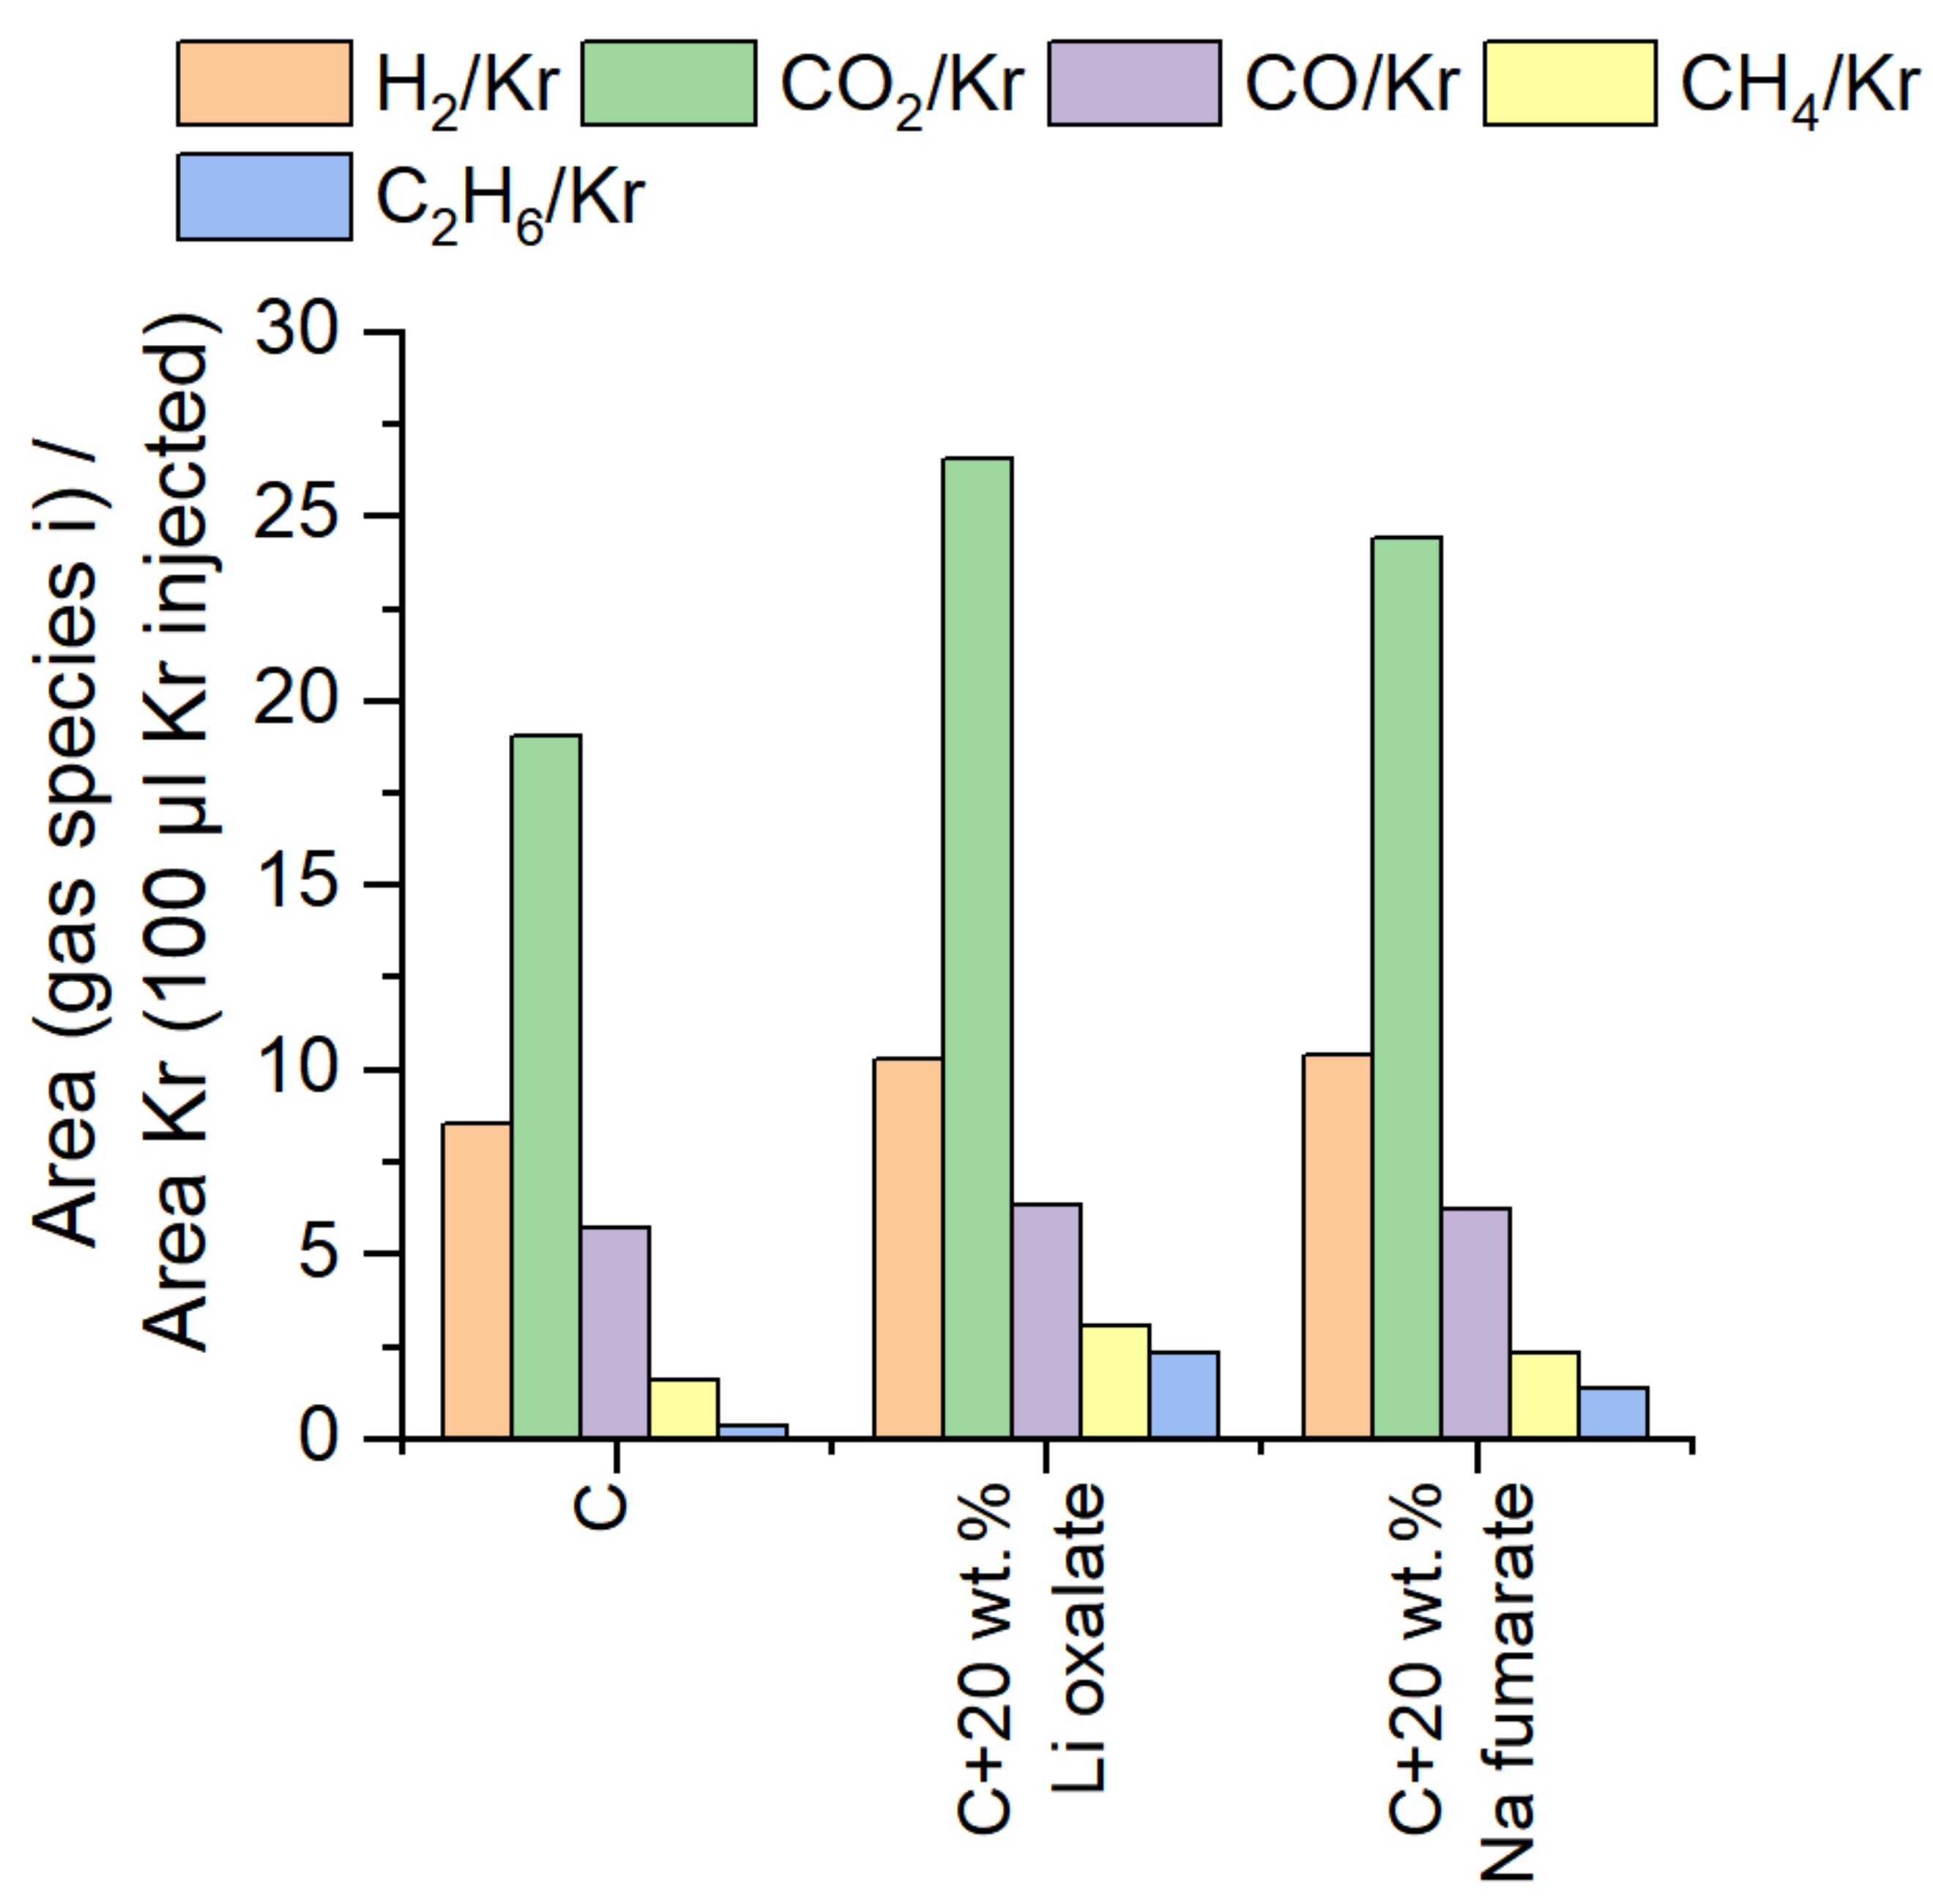
The abuse test (overcharging) was performed to demonstrate the fundamental principle of the FR effects in a battery cell. Overcharging usually leads to electrolyte decomposition and thus to gas evolution [78,79]. As shown previously, FR mainly decomposes into CO2, which should protect the cell from ignition. For this purpose, the Li-ion cells were prepared in specially designed pouch cells that included a gas extraction valve. An image is shown in Figure S11 (supporting information). This setup made it possible to extract gas without contamination from the surrounding atmosphere. The appropriately prepared pouch cells were then first cycled during cell formation (10 cycles) and subsequently overcharged. For this purpose, the cell was first fully charged (100% SOC) and then overcharged at 15 C up to a cell voltage of 50 V. As sodium malonate showed the weakest performance in the current rate tests, the gas tests were performed without sodium malonate as an FR additive. During this process, the cells (with a capacity of approximately 40 mAh) showed significant swelling but did not burst. A reference gas (Kr) was then introduced into the cell, and the present gas amounts were determined relative to the reference gas using GC-TCD. Figure 13 shows the corresponding measurements for FR Li oxalate and Na fumarate.
At an FR fraction of 20%, a significantly increased CO2 gas formation could be observed in the cases of lithium oxalate and sodium fumarate. It should be noted that, as the proportions can only be estimated relative to themselves, quantitative statements between the gases are not possible. It is noticeable that the proportion of CO was almost constant in all three cells although, as expected, lithium oxalate decomposed to CO in the first step. Additionally, it should be noted that no O2 was detected in the cells, so a conversion of CO to CO2 and carbon cannot be excluded [80].

4. Discussion

In this study, three flame retardants incorporated into the anode layer (namely, lithium oxalate, sodium fumarate and sodium malonate) were investigated together with three electrolytes (namely, 1 M LiPF6 in EC/DMC, 1 M LiTFSI in 12-BC/FEC and LiDFOB in EC/PC). It was shown that the electrolytes were optimized in terms of flammability (especially with respect to flash point, Table 2) and the flame retardants were selected with respect to their potential for CO2 release.
Based on the measurements, the gas release of the FRs can be discussed in more detail. The release of CO2 in the air atmosphere, neglecting energy balancing, can be estimated from TGA measurements that exploited revealed information about mass losses. Assuming an ideal gas behavior and under atmospheric conditions (which are present after release) in a temperature range between 300 °C and 600 °C, respectively (as the temperature range in which thermal runaway of a battery usually occurs), and assuming the direct formation of CO from CO2 (1:1 mol), the calculated values of Table 6 were obtained. From this point of view, lithium oxalate is more favorable as a flame retardant than sodium fumarate or malonate.
The fabrication of the anode layers was specifically investigated and described. Thus, the rheological behavior of the anode slurry was studied in detail. The slurry containing 10 wt.% and more of lithium oxalate can be considered a mixture of graphite, active carbon, and undissolved FR crystals in a saturated Li-oxalate-Na-CMC/SBR-water solution. In contrast, a major part of sodium fumarate and sodium malonate were dissolved in the slurry, even at high concentrations. Adding a water-soluble FR to a slurry containing a Na-CMC-water solution can also cause changes in the Na-CMC polymer structure and thus in the entire graphite/active carbon/Na-CMC network.
Mandrel bending tests around a metal cylinder showed no significant changes in the adhesion of the self-made anode sheets up to an FR content of 10%. For lithium oxalate, even at a 35 wt.% FR content, almost the same adhesive strength could be shown. SEM, microscopy and conductivity tests on the electrodes showed that the anode layers containing FRs were very similar up to approximately a 20 wt.% FR content in the case of lithium oxalate and up to a 10 wt.% FR in the cases of sodium fumarate and sodium malonate. This was confirmed by the adhesion tests and suggests that the FRs are well-fabricated into the layers.
The FRs were investigated in coin cells to evaluate their impact on cell capacity, especially at higher current rates. A significant capacity loss was observed for higher C-rates when the FR concentration increased. This can be explained by the fact that FRs themselves are a source of additional resistivity, meaning that the mobility of the electrons through the anode layer at elevated current rates was hampered since their intrinsic electrical conductivity was lower than that of the surrounding electrode layer. Another reason for the capacity loss at high C-rates may be changes in the SEI layer caused by the high amount of the FR. Possibly, the transport of Li ions was slowed down during charging and discharging as a result of changes in the SEI caused by FR decomposition. At the same time, there was no noticeable difference in the rate capability for cells with Li oxalate and Na fumarate. On the contrary, discharge capacities of the cells with Na malonate were remarkably smaller. Higher C-rates intensified this effect. The influence of FRs on discharge capacity was more pronounced at high C-rates (>5 C). Sodium malonate featured the slightest effect on concentration-dependent capacity losses and was highly dependent on the electrolyte used. The influence for sodium fumarate had a moderate impact, and lithium oxalate had the largest impact on capacity losses.
Cell tests provide an indication that, at low current rates, the flame retardants have no negative effect on performance and cell capacity, even at high FR concentrations. Higher currents above 5 C, on the other hand, lead to a reduction in discharge capacity with an increasing FR content due to deteriorated conductivity in the layers. While lithium oxalate and sodium fumarate both exhibited similar behaviors, sodium malonate showed the weakest performance and exhibited a significant capacity loss at low-current rates. Gas-releasing tests demonstrated that the evolved CO2 amount was higher when flame retardants were present in the anode layer.

5. Conclusions

In the present study, the properties of flame retardants (lithium oxalate, sodium fumarate and sodium malonate) and their combination with three electrolytes (one standard electrolyte, LP30, and two low-flammable electrolytes, LiDFOB + EC/PC and LiTFSI + 1,2-BC/FEC) were investigated. The addition of FRs to a pristine anode slurry causes changes to the physical, mechanical and electrical properties of the resulting anodes, especially at high concentrations. From this perspective, a 20 wt.% of FR in the slurry could be considered optimum. The viscosity of the slurry/FR mixture is high enough to enable a coating of the anodes with the desired thickness. The produced electrodes are stable for further manipulations during cell manufacturing. At the same time, the resistivity of the anode with an FR is low and comparable with the pristine graphite slurry, which in turn indicates less impact on the entire cell resistance. The coin cells and pouch bags with an added 5 wt.% of FRs were studied with an aim of demonstrating how electrochemical performance is affected in the presence of FRs. Even at high discharge rates (10 C), the discharge capacity values were comparable to the pristine anode. The long-time performance tests on the pouch-bag cells with and without FRs showed that at least 80% of the pristine capacity remained in the cell after 1024 cycles (ca. 3 months at 1 C). Lithium oxalate is the most promising FR from this study. During the thermal decomposition of 1 g of Li oxalate, more than 200 mL of CO2 was released (in the first step as CO).

Supplementary Materials

The following supporting information can be downloaded at: https://www.mdpi.com/article/10.3390/batteries9020082/s1, Figure S1: Composition of an anode without FR (a), with 5 wt.% FR (b), 10 wt.% (c), 20 wt.% (d), 35 wt.% (e) and 50 wt.% (f); Figure S2: Ionic conductivity of electrolytes LP30, LiDFOB + EC/PC and LiTFSI + 1,2-BC/FEC measured in temperature range 0–80 °C; Figure S3: IR spectra of lithium oxalate, sodium fumarate and sodium malonate at each weight-loss step; Figure S4: Specific resistance of graphite/FR layer calculated for different concentrations of FR; Figure S5: Specific discharge capacity of NMC/anode with 0, 5, 10, 20, 35 and 50 wt.% of FR full cells loaded with LP30 (1st row), LiDFOB + EC/PC (2nd row) and LiTFSI + 1,2-BC/FEC (3d row) in dependence of discharge rate (C-Rate); Figure S6: Coulombic efficiency of NMC/anode with 0, 5, 10, 20, 35 and 50 wt.% of FR full cells loaded with LP30 (1st row), LiDFOB + EC/PC (2nd row) and LiTFSI + 1,2-BC/FEC (3d row) in dependence of discharge rate (C-Rate); Figure S7: Discharge curves of pouch bag cells NMC/5 wt.% Li oxalate (top), Na fumarate (middle) and Na malonate (bottom) loaded with LP30 (left) and LiDFOB + EC/PC (right) for C-rates from 0.5 to 10; Figure S8: Differential chronopotentiograms of the pouch-bag cell NMC/graphite + lithium oxalate 5% loaded with LP30 (left) and LiDFOB EC/PC (right) at 1C and 5C discharge rates (charge rate 0.5C); Figure S9: Differential chronopotentiograms of the pouch-bag cell NMC/graphite + sodium fumarate 5% loaded with LP30 (left) and LiDFOB + EC/PC (right) at 1C and 5C discharge rates (charge rate 0.5C); Figure S10: Differential chronopotentiograms of the pouch-bag cell NMC/graphite + lithium oxalate 5% loaded with LP30 (left) and LiDFOB + EC/PC (right) at 1C and 5C discharge rates (charge rate 0.5C); Figure S11: Photography of the pouch-bag cell including the gas extraction unit. Table S1: Composition of anode materials with and without FRs in combination with electrolytes LP30, LiDFOB + EC/PC and LiTFSI + 1,2-BC/FEC studied in coin cells and their area capacities; Table S2: Anode material data in combination with electrolytes LP30, LiDFOB + EC/PC and LiTFSI + 1,2-BC/FEC, studied in pouch-bag cells including their area capacity; Table S3: Cycling procedure for coin cells; Table S4: Cycling procedure for pouch-bag cells.

Author Contributions

Conceptualization, N.F., A.H. and T.H.; data curation, N.F.; funding acquisition, T.H.; investigation, N.F., D.N., M.M. and F.M.; methodology, N.F., D.N., M.M., I.R. and A.S.; project administration, T.H.; resources, A.S. and T.H.; software, I.R.; supervision, A.H. and T.H.; validation, N.F. and F.M.; visualization, A.H.; writing—original draft, N.F. and A.H.; writing—review & editing, N.F., A.H., D.N., M.M., I.R., F.M., A.S. and T.H. All authors have read and agreed to the published version of the manuscript.

Funding

This research was funded by the Deutsche Forschungsgemeinschaft (DFG), grant number “HA 1924/18-2”. We acknowledge support from the Deutsche Forschungsgemeinschaft and the KIT Publication Fund of the Karlsruhe Institute of Technology.

Institutional Review Board Statement

Not applicable.

Informed Consent Statement

Not applicable.

Data Availability Statement

Additional data are provided in the supporting information.

Acknowledgments

We acknowledge Olivia Wiegand for pouch-cell assembling, Daniela Linder for TGA measurements and Zhengqi Wang for fruitful discussions. We gratefully acknowledge Kieran Evans from PerkinElmer for additional TGA measurements.

Conflicts of Interest

The authors declare no conflict of interest. The funders had no role in the design of the study; in the collection, analyses or interpretation of data; in the writing of the manuscript; or in the decision to publish the results.

References

  1. Roth, E.P.; Orendorff, C.J. How electrolytes influence battery safety. Electrochem. Soc. Interface 2012, 21, 45–49. [Google Scholar] [CrossRef]
  2. Doughty, D.H.; Roth, E.P. A general discussion of Li ion battery safety. Electrochem. Soc. Interface 2012, 21, 37–44. [Google Scholar]
  3. Hou, J.; Wang, L.; Feng, X.; Terada, J.; Lu, L.; Yamazaki, S.; Su, A.; Kuwajima, Y.; Chen, Y.; Hidaka, T.; et al. Thermal Runaway of Lithium-Ion Batteries Employing Flame-Retardant Fluorinated Electrolytes. Energy Environ. Mater. 2022, 0, 1–7. [Google Scholar] [CrossRef]
  4. Orendorff, C.J. The role of separators in lithium-ion cell safety. Electrochem. Soc. Interface 2012, 21, 61–65. [Google Scholar] [CrossRef]
  5. Cheng, H.; Shapter, J.G.; Li, Y.; Gao, G. Recent progress of advanced anode materials of lithium-ion batteries. J. Energy Chem. 2021, 57, 451–468. [Google Scholar] [CrossRef]
  6. Ravdel, B.; Abraham, K.M.; Gitzendanner, R.; DiCarlo, J.; Lucht, B.; Campion, C. Thermal stability of lithium-ion battery electrolytes. J. Power Sources 2003, 119–121, 805–810. [Google Scholar] [CrossRef]
  7. Zhou, X.; Qiu, S.; Mu, X.; Zhou, M.; Cai, W.; Song, L.; Xing, W.; Hu, Y. Polyphosphazenes-based flame retardants: A review. Compos. B Eng. 2020, 202, 108397–108414. [Google Scholar] [CrossRef]
  8. Nabipour, H.; Wang, X.; Song, L.; Hu, Y. Metal-organic frameworks for flame retardant polymers application: A critical review. Compos. A Appl. Sci. Manuf. 2020, 139, 106113–106123. [Google Scholar] [CrossRef]
  9. Gao, F.; Liu, H.; Yang, K.; Zeng, C.; Wang, S.; Fan, M.; Wang, H. A review on materials for flame retarding and improving the thermal stability of lithium ion batteries. Int. J. Electrochem. Sci. 2020, 15, 1391–1411. [Google Scholar] [CrossRef]
  10. Deng, K.; Zeng, Q.; Wang, D.; Liu, Z.; Wang, G.; Qiu, Z.; Zhang, Y.; Xiao, M.; Meng, Y. Nonflammable organic electrolytes for high-safety lithium-ion batteries. Energy Storage Mater. 2020, 32, 425–447. [Google Scholar] [CrossRef]
  11. Indris, S.; Heinzmann, R.; Schulz, M.; Hofmann, A. Ionic liquid based electrolytes: Correlating Li diffusion coefficients and battery performance. J. Electrochem. Soc. 2014, 161, A2036–A2041. [Google Scholar] [CrossRef]
  12. Arbizzani, C.; Gabrielli, G.; Mastragostino, M. Thermal stability and flammability of electrolytes for lithium-ion batteries. J. Power Sources 2011, 196, 4801–4805. [Google Scholar] [CrossRef]
  13. Zheng, Y.; Yao, Y.; Ou, J.; Li, M.; Luo, D.; Dou, H.; Li, Z.; Amine, K.; Yu, A.; Chen, Z. A review of composite solid-state electrolytes for lithium batteries: Fundamentals, key materials and advanced structures. Chem. Soc. Rev. 2020, 49, 8790–8839. [Google Scholar] [CrossRef]
  14. Lee, D.J.; Im, D.; Ryu, Y.-G.; Lee, S.; Yoon, J.; Lee, J.; Choi, W.; Jung, I.; Lee, S.; Doo, S.-G. Phosphorus derivatives as electrolyte additives for lithium-ion battery: The removal of O2 generated from lithium-rich layered oxide cathode. J. Power Sources 2013, 243, 831–835. [Google Scholar] [CrossRef]
  15. Dagger, T.; Grützke, M.; Reichert, M.; Haetge, J.; Nowak, S.; Winter, M.; Schappacher, F.M. Investigation of lithium ion battery electrolytes containing flame retardants in combination with the film forming electrolyte additives vinylene carbonate, vinyl ethylene carbonate and fluoroethylene carbonate. J. Power Sources 2017, 372, 276–285. [Google Scholar] [CrossRef]
  16. Hyung, Y.E.; Vissers, D.R.; Amine, K. Flame-retardant additives for lithium-ion batteries. J. Power Sources 2003, 119–121, 383–387. [Google Scholar] [CrossRef]
  17. Matsumoto, K.; Martinez, M.; Gutel, T.; Mailley, S.; De vito, E.; Patoux, S.; Inoue, K.; Utsugi, K. Stability of trimethyl phosphate non-flammable based electrolyte on the high voltage cathode (LiNi0.5Mn1.5O4). J. Power Sources 2015, 273, 1084–1088. [Google Scholar] [CrossRef]
  18. Milien, M.S.; Beyer, H.; Beichel, W.; Klose, P.; Gasteiger, H.A.; Lucht, B.L.; Krossing, I. Lithium bis(2,2,2-trifluoroethyl)phosphate Li[O2P(OCH2CF3)2]: A high voltage additive for LNMO/Graphite cells. J. Electrochem. Soc. 2018, 165, A2569–A2576. [Google Scholar] [CrossRef] [Green Version]
  19. Pires, J.; Castets, A.; Timperman, L.; Santos-Peña, J.; Dumont, E.; Levasseur, S.; Tessier, C.; Dedryvère, R.; Anouti, M. Tris(2,2,2-trifluoroethyl) phosphite as an electrolyte additive for high-voltage lithium-ion batteries using lithium-rich layered oxide cathode. J. Power Sources 2015, 296, 413–425. [Google Scholar] [CrossRef]
  20. Wu, B.; Pei, F.; Wu, Y.; Mao, R.; Ai, X.; Yang, H.; Cao, Y. An electrochemically compatible and flame-retardant electrolyte additive for safe lithium ion batteries. J. Power Sources 2013, 227, 106–110. [Google Scholar] [CrossRef]
  21. Xu, M.; Liu, Y.; Li, B.; Li, W.; Li, X.; Hu, S. Tris (pentafluorophenyl) phosphine: An electrolyte additive for high voltage Li-ion batteries. Electrochem. Commun. 2012, 18, 123–126. [Google Scholar] [CrossRef]
  22. Todorov, Y.M.; Aoki, M.; Mimura, H.; Fujii, K.; Yoshimoto, N.; Morita, M. Thermal and electrochemical properties of nonflammable electrolyte solutions containing fluorinated alkylphosphates for lithium-ion batteries. J. Power Sources 2016, 332, 322–329. [Google Scholar] [CrossRef]
  23. Sogawa, M.; Kawanoue, H.; Todorov, Y.M.; Hirayama, D.; Mimura, H.; Yoshimoto, N.; Morita, M.; Fujii, K. Solvation-controlled lithium-ion complexes in a nonflammable solvent containing ethylene carbonate: Structural and electrochemical aspects. Phys. Chem. Chem. Phys. 2018, 20, 6480–6486. [Google Scholar] [CrossRef] [PubMed]
  24. Wang, Z.; Hofmann, A.; Hanemann, T. Low-flammable electrolytes with fluoroethylene carbonate based solvent mixtures and lithium bis(trifluoromethanesulfonyl)imide for lithium-ion batteries. Electrochim. Acta 2019, 298, 960–972. [Google Scholar] [CrossRef]
  25. Zu, C.; Yu, H.; Li, H. Enabling the thermal stability of solid electrolyte interphase in Li-ion battery. Infomat 2021, 3, 648–661. [Google Scholar] [CrossRef]
  26. Liu, X.; Yin, L.; Ren, D.; Wang, L.; Ren, Y.; Xu, W.; Lapidus, S.; Wang, H.; He, X.; Chen, Z.; et al. In situ observation of thermal-driven degradation and safety concerns of lithiated graphite anode. Nat. Commun. 2021, 12, 4235–4245. [Google Scholar] [CrossRef]
  27. Jiang, L.; Wang, Q.; Li, K.; Ping, P.; Jiang, L.; Sun, J. A self-cooling and flame-retardant electrolyte for safer lithium ion batteries. Sustain. Energy Fuels 2018, 2, 1323–1331. [Google Scholar] [CrossRef]
  28. Balakrishnan, P.G.; Ramesh, R.; Prem Kumar, T. Safety mechanisms in lithium-ion batteries. J. Power Sources 2006, 155, 401–414. [Google Scholar] [CrossRef]
  29. Demirocak, D.; Srinivasan, S.; Stefanakos, E. A review on nanocomposite materials for rechargeable Li-ion batteries. Appl. Sci. 2017, 7, 731–757. [Google Scholar] [CrossRef] [Green Version]
  30. Gogia, A.; Wang, Y.; Rai, A.K.; Bhattacharya, R.; Subramanyam, G.; Kumar, J. Binder-free, thin-film ceramic-coated separators for improved safety of lithium-ion batteries. ACS Omega 2021, 6, 4204–4211. [Google Scholar] [CrossRef]
  31. Zeng, G.; Zhao, J.; Feng, C.; Chen, D.; Meng, Y.; Boateng, B.; Lu, N.; He, W. Flame-retardant bilayer separator with multifaceted van der Waals interaction for lithium-ion batteries. ACS Appl. Mater. Interfaces 2019, 11, 26402–26411. [Google Scholar] [CrossRef]
  32. Luo, X.; Lu, X.; Chen, X.; Chen, Y.; Song, C.; Yu, C.; Wang, N.; Su, D.; Wang, C.; Gao, X.; et al. A robust flame retardant fluorinated polyimide nanofiber separator for high-temperature lithium–sulfur batteries. J. Mater. Chem. A 2020, 8, 14788–14798. [Google Scholar] [CrossRef]
  33. Liu, H.; Yang, F.; Xiang, M.; Cao, Y.; Wu, T. Development of multilayer polypropylene separators for lithium-ion batteries via an industrial process. Ind. Eng. Chem. Res. 2021, 60, 11611–11620. [Google Scholar] [CrossRef]
  34. Yan, N.; Ding, L.; Wu, T.; Zhang, S.; Yang, F.; Cao, Y.; Xiang, M. Shutdown-functionalized poly ethylene-vinyl alcohol sulfonate lithium and poly (vinyl alcohol) composite lithium-ion battery separator. J. Electrochem. Soc. 2021, 168, 110510–110519. [Google Scholar] [CrossRef]
  35. Zhang, J.; Yue, L.; Kong, Q.; Liu, Z.; Zhou, X.; Zhang, C.; Xu, Q.; Zhang, B.; Ding, G.; Qin, B.; et al. Sustainable, heat-resistant and flame-retardant cellulose-based composite separator for high-performance lithium ion battery. Sci. Rep. 2014, 4, 3935–3943. [Google Scholar] [CrossRef] [Green Version]
  36. Liao, C.; Mu, X.; Han, L.; Li, Z.; Zhu, Y.; Lu, J.; Wang, H.; Song, L.; Kan, Y.; Hu, Y. A flame-retardant, high ionic-conductivity and eco-friendly separator prepared by papermaking method for high-performance and superior safety lithium-ion batteries. Energy Storage Mater. 2022, 48, 123–132. [Google Scholar] [CrossRef]
  37. Lee, J.Y.; Shin, S.H.; Moon, S.H. Flame retardant coated polyolefin separators for the safety of lithium ion batteries. Korean J. Chem. Eng. 2016, 33, 285–289. [Google Scholar] [CrossRef]
  38. Peng, L.; Shen, X.; Dai, J.; Wang, X.; Zeng, J.; Huang, B.; Li, H.; Zhang, P.; Zhao, J. Three-dimensional coating layer modified polyolefin ceramic-coated separators to enhance the safety performance of lithium-ion batteries. J. Electrochem. Soc. 2019, 166, A2111–A2120. [Google Scholar] [CrossRef]
  39. Arise, I.; Miyahara, Y.; Miyazaki, K.; Abe, T. Functional role of aramid coated separator for dendrite suppression in lithium-ion batteries. J. Electrochem. Soc. 2022, 169, 010536–010545. [Google Scholar] [CrossRef]
  40. Sharma, G.; Jin, Y.; Lin, Y.S. Lithium ion batteries with alumina separator for improved safety. J. Electrochem. Soc. 2017, 164, A1184–A1191. [Google Scholar] [CrossRef]
  41. Ye, Y.; Chou, L.-Y.; Liu, Y.; Wang, H.; Lee, H.K.; Huang, W.; Wan, J.; Liu, K.; Zhou, G.; Yang, Y.; et al. Ultralight and fire-extinguishing current collectors for high-energy and high-safety lithium-ion batteries. Nat. Energy 2020, 5, 786–793. [Google Scholar] [CrossRef]
  42. Boldyrev, V.V.; Nev’yantsev, I.S.; Mikhailov, Y.I.; Khairetdinov, E.F. The mechanism of the thermal decomposition of oxalates. Kinet. Katal. 1970, 11, 306–311. [Google Scholar]
  43. Girgis, M.M.; El-Awad, A.M. Kinetics and mechanism of thermal decomposition of lithium oxalate catalysed by CdI_,Co,Fe204 (X = 0.0, 0.5 and 1.0) ferrospinel additives. Thermochim. Acta 1993, 214, 291–303. [Google Scholar] [CrossRef]
  44. Dollimore, D.; Tinsley, D. The thermal decomposition of oxalates. Part XlP: The thermal decomposition of Lithium oxalate. J. Chem. Soc. A 1971, 304. [Google Scholar]
  45. Papazian, H.A.; Pizzolato, P.J.; Patrick, J.A. Thermal decomposition of oxalates of ammonium and potassium. J. Am. Ceram. Soc. 1971, 54, 250–254. [Google Scholar] [CrossRef]
  46. Hofmann, A.; Wang, Z.; Bautista, S.P.; Weil, M.; Müller, F.; Löwe, R.; Schneider, L.; Mohsin, I.U.; Hanemann, T. Comprehensive characterization of propylene carbonate based liquid electrolyte mixtures for sodium-ion cells. Electrochim. Acta 2022, 403, 139670–139687. [Google Scholar] [CrossRef]
  47. Shanmukaraj, D.; Grugeon, S.; Laruelle, S.; Douglade, G.; Tarascon, J.-M.; Armand, M. Sacrificial salts: Compensating the initial charge irreversibility in lithium batteries. Electrochem. Commun. 2010, 12, 1344–1347. [Google Scholar] [CrossRef]
  48. Solchenbach, S.; Wetjen, M.; Pritzl, D.; Schwenke, K.U.; Gasteiger, H.A. Lithium oxalate as capacity and cycle-life enhancer in LNMO/Graphite and LNMO/SiG full cells. J. Electrochem. Soc. 2018, 165, A512–A524. [Google Scholar] [CrossRef]
  49. Muraishi, K. Thermal decomposition of alkali metal malonate anhydrides in various atmospheres. Thermochim. Acta 1990, 164, 401–409. [Google Scholar] [CrossRef]
  50. Jeong, D.; Lee, J. Electrode design optimization of lithium secondary batteries to enhance adhesion and deformation capabilities. Energy 2014, 75, 525–533. [Google Scholar] [CrossRef]
  51. Larkin, P. Environmental Dependence of Vibrational Spectra; Elsevier: Amsterdam, The Netherlands, 2011; pp. 55–62. [Google Scholar]
  52. Ionashiro, E.Y.; Caires, F.J.; Siqueira, A.B.; Lima, L.S.; Carvalho, C.T. Thermal behaviour of fumaric acid, sodium fumarate and its compounds with light trivalent lanthanides in air atmosphere. J. Therm. Anal. Calorim. 2011, 108, 1183–1188. [Google Scholar] [CrossRef]
  53. Caires, F.J.; Lima, L.S.; Carvalho, C.T.; Giagio, R.J.; Ionashiro, M. Thermal behaviour of malonic acid, sodium malonate and its compounds with some bivalent transition metal ions. Thermochim. Acta 2010, 497, 35–40. [Google Scholar] [CrossRef]
  54. Bauer, W.; Nötzel, D. Rheological properties and stability of NMP based cathode slurries for lithium ion batteries. Cer. Internat. 2014, 40, 4591–4598. [Google Scholar] [CrossRef]
  55. Bitsch, B.; Dittmann, J.; Schmitt, M.; Scharfer, P.; Schabel, W.; Willenbacher, N. A novel slurry concept for the fabrication of lithium-ion battery electrodes with beneficial properties. J. Power Sources 2014, 265, 81–90. [Google Scholar] [CrossRef] [Green Version]
  56. Cushing, A.; Zheng, T.; Higa, K.; Liu, G. Viscosity analysis of battery electrode slurry. Polymers 2021, 13, 4033–4041. [Google Scholar] [CrossRef]
  57. Diehm, R.; Kumberg, J.; Dörrer, C.; Müller, M.; Bauer, W.; Scharfer, P.; Schabel, W. In situ investigations of simultaneous two-layer slot die coating of component-graded anodes for improved high-energy Li-ion batteries. Energy Technol. 2020, 8, 1901251. [Google Scholar] [CrossRef]
  58. Liu, D.; Chen, L.-C.; Liu, T.-J.; Fan, T.; Tsou, E.-Y.; Tiu, C. An effective mixing for lithium ion battery slurries. Adv. Chem. Eng. Sci. 2014, 04, 515–528. [Google Scholar] [CrossRef] [Green Version]
  59. Ma, F.; Fu, Y.; Battaglia, V.; Prasher, R. Microrheological modeling of lithium ion battery anode slurry. J. Power Sources 2019, 438, 226994. [Google Scholar] [CrossRef] [Green Version]
  60. Ouyang, L.; Wu, Z.; Wang, J.; Qi, X.; Li, Q.; Wang, J.; Lu, S. The effect of solid content on the rheological properties and microstructures of a Li-ion battery cathode slurry. RSC Adv. 2020, 10, 19360–19370. [Google Scholar] [CrossRef]
  61. Jeschull, F.; Brandell, D.; Wohlfahrt-Mehrens, M.; Memm, M. Water-soluble binders for lithium-ion battery graphite electrodes: Slurry rheology, coating adhesion, and electrochemical performance. Energy Technol. 2017, 5, 2108–2118. [Google Scholar] [CrossRef]
  62. Gordon, R.; Orias, R.; Willenbacher, N. Effect of carboxymethyl cellulose on the flow behavior of lithium-ion battery anode slurries and the electrical as well as mechanical properties of corresponding dry layers. J. Mater. Sci. 2020, 55, 15867–15881. [Google Scholar] [CrossRef]
  63. Lim, S.; Kim, S.; Ahn, K.H.; Lee, S.J. The effect of binders on the rheological properties and the microstructure formation of lithium-ion battery anode slurries. J. Power Sources 2015, 299, 221–230. [Google Scholar] [CrossRef]
  64. Li, W.; Zhu, J. A large deformation and fracture model of lithium-ion battery cells treated as a homogenized medium. J. Electrochem. Soc. 2020, 167, 120503–120504. [Google Scholar] [CrossRef]
  65. Christensen, J.; Newman, J. Stress generation and fracture in lithium insertion materials. J. Solid State Electrochem. 2006, 10, 293–319. [Google Scholar] [CrossRef]
  66. Huttner, F.; Haselrieder, W.; Kwade, A. The influence of different post-drying procedures on remaining water content and physical and electrochemical properties of lithium-ion batteries. Energy Technol. 2019, 8, 1900245. [Google Scholar] [CrossRef]
  67. Kumberg, J.; Müller, M.; Diehm, R.; Spiegel, S.; Wachsmann, C.; Bauer, W.; Scharfer, P.; Schabel, W. Drying of lithium-ion battery anodes for use in high-energy cells: Influence of electrode thickness on drying time, adhesion, and crack formation. Energy Technol. 2019, 7, 1900722. [Google Scholar] [CrossRef]
  68. Schilling, A.; Schmitt, J.; Dietrich, F.; Dröder, K. Analyzing bending stresses on lithium-ion battery cathodes induced by the assembly process. Energy Technol. 2016, 4, 1502–1508. [Google Scholar] [CrossRef]
  69. Kishimoto, Y.; Kobayashi, Y.; Ohtsuka, T.; Tsuruta, T.; Nakamura, K.; Tsukagoshi, Y. Computational evaluation of bending fatigue test on electrode of lithium-ion battery. In Proceedings of the 6th European Conference on Computational Mechanics; 7th European Conference on Computational Fluid Dynamics, Glasgow, Scotland, 11-15 June 2018. [Google Scholar]
  70. Pierson, H.O. Handbook of Carbon Graphite Diamond and Fullerenes. Properties, Processing and Applications; Noyes Publications: Norwich, NY, USA, 1994. [Google Scholar]
  71. Matsumoto, K.; Inoue, K.; Nakahara, K.; Yuge, R.; Noguchi, T.; Utsugi, K. Suppression of aluminum corrosion by using high concentration LiTFSI electrolyte. J. Power Sources 2013, 231, 234–238. [Google Scholar] [CrossRef]
  72. Quilty, C.D.; Bock, D.C.; Yan, S.; Takeuchi, K.J.; Takeuchi, E.S.; Marschilok, A.C. Probing sources of capacity fade in LiNi0.6Mn0.2Co0.2O2 (NMC622): An operando XRD study of Li/NMC622 batteries during extended cycling. J. Phys. Chem. C 2020, 124, 8119–8128. [Google Scholar] [CrossRef]
  73. Shaju, K.M.; Rao, G.V.S.; Chowdari, B.V.R. Performance of layered Li(Ni1/3Co1/3Mn1/3)O2 as cathode for Li-ion batteries. Electrochim. Acta 2002, 48, 145–151. [Google Scholar] [CrossRef]
  74. Jung, R.; Metzger, M.; Maglia, F.; Stinner, C.; Gasteiger, H.A. Oxygen release and its effect on the cycling stability of LiNixMnyCozO2(NMC) cathode materials for Li-ion batteries. J. Electrochem. Soc. 2017, 164, A1361–A1377. [Google Scholar] [CrossRef]
  75. Kawamura, T.; Okada, S.; Yamaki, J.-i. Decomposition reaction of LiPF6-based electrolytes for lithium ion cells. J. Power Sources 2006, 156, 547–554. [Google Scholar] [CrossRef]
  76. Yuan, Q.; Zhao, F.; Wang, W.; Zhao, Y.; Liang, Z.; Yan, D. Overcharge failure investigation of lithium-ion batteries. Electrochim. Acta 2015, 178, 682–688. [Google Scholar] [CrossRef]
  77. Zhang, G.; Wei, X.; Chen, S.; Zhu, J.; Han, G.; Dai, H. Revealing the impact of slight electrical abuse on the thermal safety characteristics for lithium-ion batteries. ACS Appl. Energy Mater. 2021, 4, 12858–12870. [Google Scholar] [CrossRef]
  78. Ohsaki, T.; Kishi, T.; Kuboki, T.; Takami, N.; Shimura, N.; Sato, Y.; Sekino, M.; Satoh, A. Overcharge reaction of lithium-ion batteries. J. Power Sources 2005, 146, 97–100. [Google Scholar] [CrossRef]
  79. Hofmann, A.; Uhlmann, N.; Ziebert, C.; Wiegand, O.; Schmidt, A.; Hanemann, T. Preventing Li-ion cell explosion during thermal runaway with reduced pressure. Appl. Therm. Eng. 2017, 124, 539–544. [Google Scholar] [CrossRef]
  80. Meisel, T.; Halmos, Z.; Seybold, K.; Pungor, E. The thermal decomposition of alkali metal formates. J. Therm. Anal. 1975, 7, 73–80. [Google Scholar] [CrossRef]
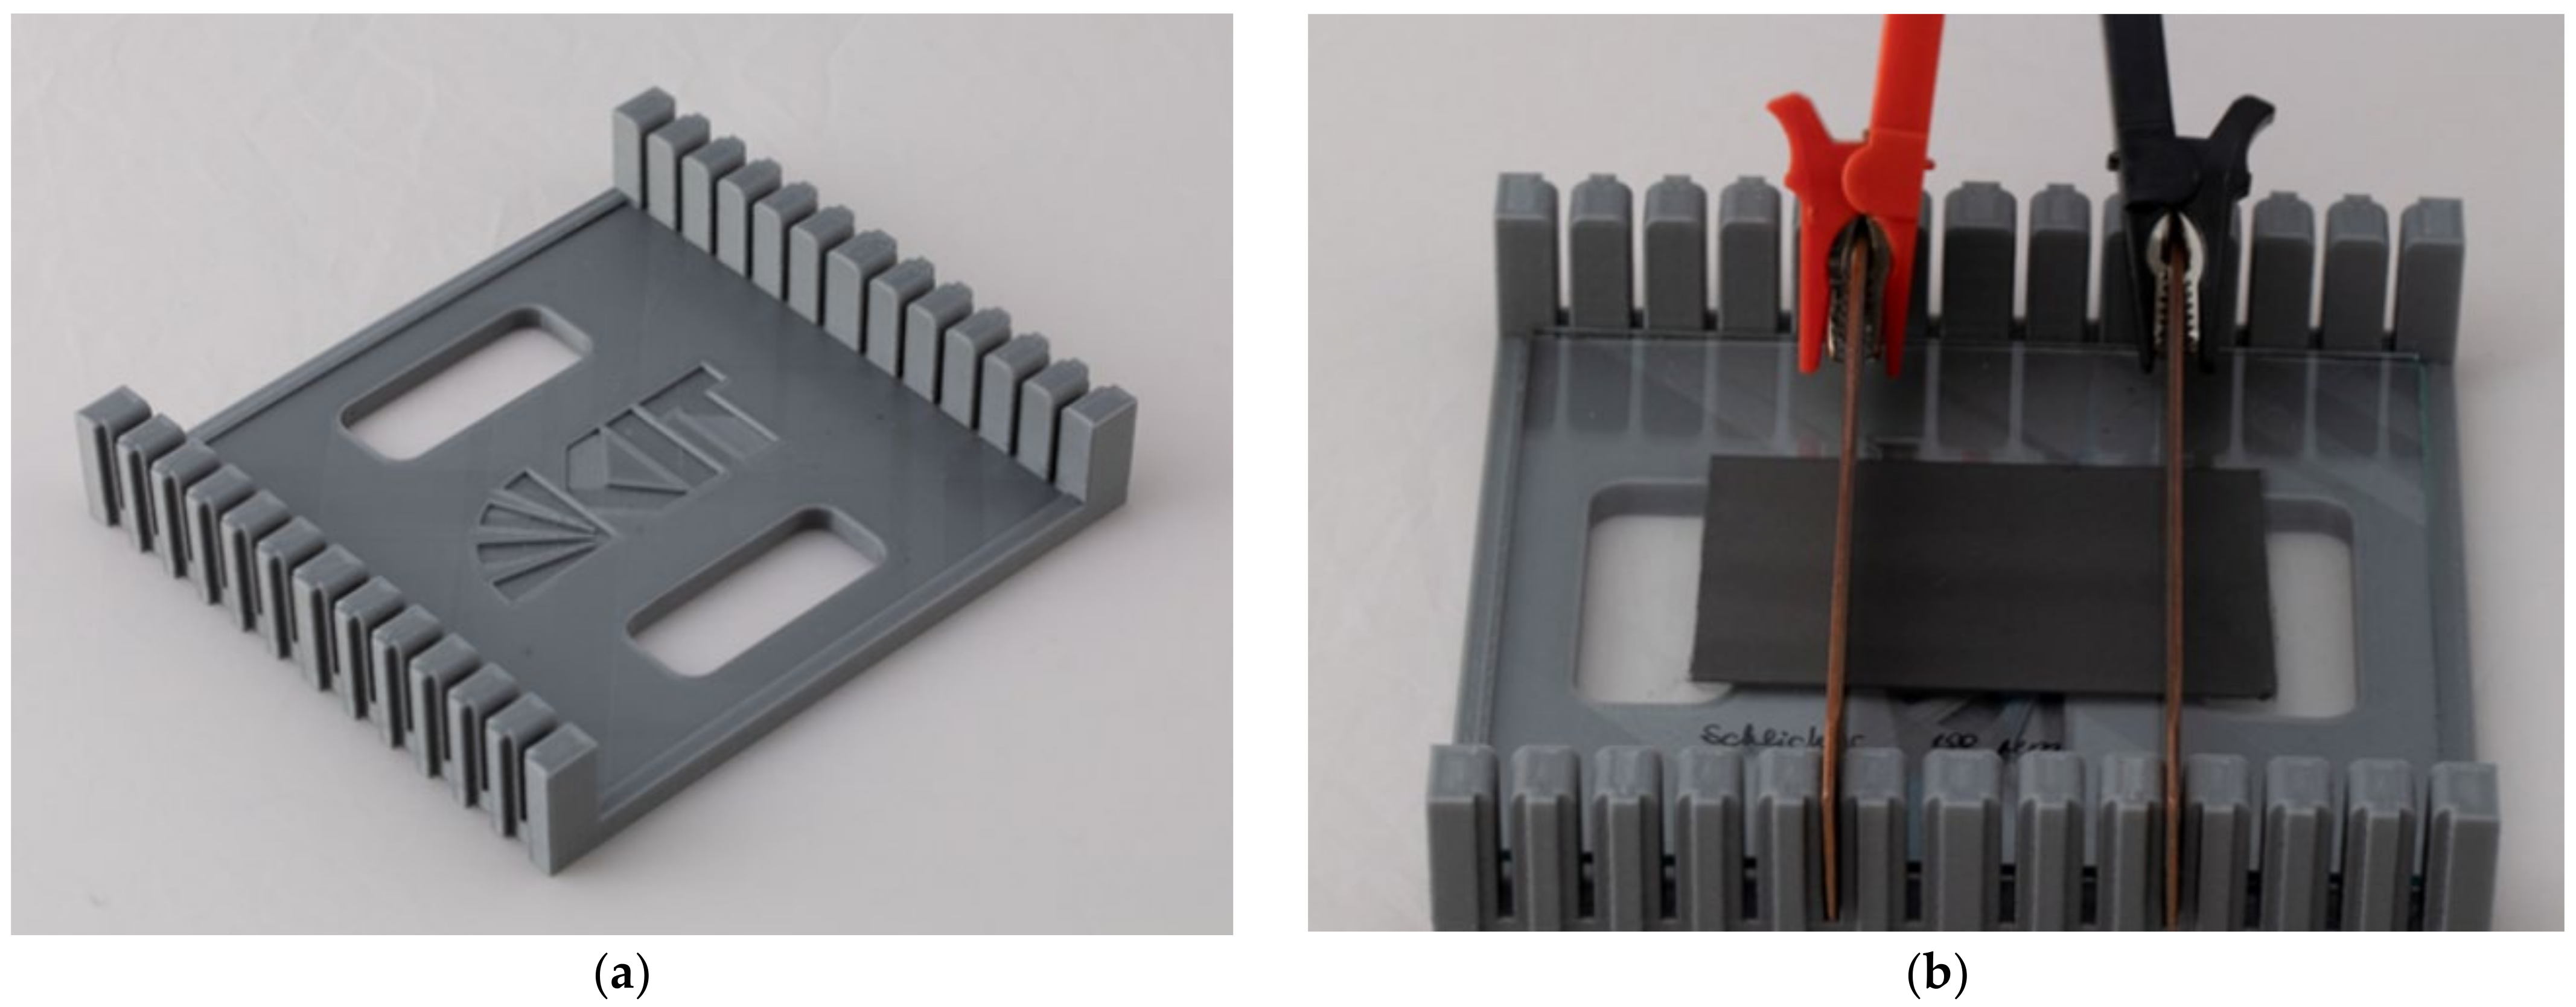
Figure 1. The in-house-built, 3D-printed sample holder made of polyactide (PLA) for the measurement of the resistance is shown in (a). (b) depicts the graphite anode on a glass plate, including a coating on the glass surface, including the sample holder.
Batteries 09 00082 g001
Figure 2. Chemical structures and potential decomposition pathways, including the decomposition temperatures of investigated flame retardants.
Batteries 09 00082 g002
Figure 3. TGA measurements of lithium oxalate (a), sodium fumarate (b) and sodium malonate (c, all with dry-air purge gas). The ranges (blue dots) where the mass loss was identified are marked. A pre-decomposition in the case of Na fumarate was identified but, due to the much slower process (kinetics), this pre-decomposition process between 400 and 450 °C is not included. Additionally, the second decomposition in the case of lithium oxalate is also not marked due to the high temperature (>700 °C). The uncertainty of the mass loss is in the order of 0.1–0.3 percentage points.
Batteries 09 00082 g003
Figure 4. Viscosity of pristine slurry and slurry with added FR as a function of shear rate.
Batteries 09 00082 g004
Figure 5. Microscope images of anodes without FRs (a) and with added sodium fumarate (b) at 50 wt.%. Red circles emphasize FR inclusions on anode surface. The sample “slurry” accounts for the dried slurry without any FR.
Batteries 09 00082 g005
Figure 6. SEM images of anodes without FR, with 5 wt.% lithium oxalate, with 5 wt.% sodium fumarate and with 5 wt.% sodium malonate. (a) Images are made with 2000× magnification and (b) images are presented with 10,000× magnification.
Batteries 09 00082 g006
Figure 7. Analysis of resistance measured on anode layers with different thickness coated on a glass plate.
Batteries 09 00082 g007
Figure 8. Specific discharge capacity of NMC//graphite with 0, 5, 20 and 50 wt.% of FR full cells loaded with LP30 (a), LiDFOB EC/PC (b), and LiTFSI 1,2-BC/FEC (c) in dependence of discharge rate (C-Rate). Red—1 C (10th cycle); blue— 5 C (92nd cycle); and green—10 C (104th cycle).
Batteries 09 00082 g008
Figure 9. Cycling data of pouch-bag cells with graphite (blue), 5 wt.% Li oxalate (green), 5 wt.% Na fumarate (red), and 5 wt.% Na malonate (magenta) cycled 1024 times. At cycle 516, a C/10 cycle was performed; thus, the discharge capacity is recorded too high here. In the case of LiTFSI + 1,2-BC/FEC in combination with self-made graphite, some spikes were recorded (between cycles 100 and 200) which were removed for better comparison.
Batteries 09 00082 g009
Figure 10. Discharge curves of pouch-bag cells (NMC111//graphite) loaded with LP30 (a) and LiDFOB+EC/PC (b) for C-rates from 0.5 C to 10 C (the charge rate is 0.5 C).
Batteries 09 00082 g010
Figure 11. Differential chronopotentiograms of the pouch-bag cell NMC111//graphite anode loaded with LP30 (a,c) and LiDFOB+EC/PC (b,d) at 1 C and 5 C discharge rates.
Batteries 09 00082 g011aBatteries 09 00082 g011b
Figure 12. GC-MS chromatograms for LP30 (top), LiDFOB EC/PC (middle) and LiTFSI 1,2-BC/FEC, (bottom) extracted from separator after 121 cycles. The large peak at 2.8 min originates from the diluent (dichloromethane).
Batteries 09 00082 g012
Figure 13. Gas composition measured with GC-MS after abuse test. C—graphite.
Batteries 09 00082 g013
Table 1. Composition of anode materials with added flame retardants.
wt.% of FR in anode layer510203550
m (slurry), (g)1010101010
m (FR), (g)0.27580.58221.31002.82155.2400
m (FR)/ml water in slurry, (mg/mL)4998196343490
m (added water), (g) 0.25050.52891.11902.56314.7600
m (SBR binder), (g)0.21050.22220.25000.30770.4000
Film thickness, (µm)145160210345470
Table 2. Composition, density, viscosity and conductivity, as well as the glass, flash and melting points estimated for the studied electrolytes. Results for the EC/DMC and 1,2-BC/FEC electrolytes are taken from reference [24] for comparison.
Electrolyte Solvent CompositionEC/DMCEC/PC1,2-BC/FEC
Conducting saltLiPF6LiDFOBLiTFSI
c (conducting salt), mol∙kg−10.770.750.75
Density ρ, 298.15 K, g∙cm−31.31.321.39
Glass point (Tg, taken from DSC at 10 K∙min−1), (°C)−72.8−93.4−95.0
Flash point (fp), (°C)25.0162149.0
Melting point (mp., taken from DSC at 10 K∙min−1), (°C)−4.6
Eox, Li|Pt, 298.15 K, (V)4.74.54.8
Viscosity η at 298.15 K (mPa∙s)3.96.612.0
Conductivity κ at 293.15 K (mS∙cm−1)10.77.42.8
Table 3. Result of mandrel bend test on anodes with different FR contents. Table states critical cylinder diameters (smallest diameter) with first visible defects.
FR wt.%Li OxalateNa FumarateNa Malonate
SplitDetachmentSplitDetachmentSplitDetachment
5NANANANANANA
102 mmNANANA2 mmNA
202 mmNA8 mmNA20 mmNA
353 mmNA25 mmNA25 mmNA
503 mmNA32 mm10 mm32 mm10 mm
Table 4. Calculated specific resistance for graphite layer correlated with its thickness. Independent of layer thickness, all values are in the same order of magnitude (within the experimental error).
Layer Thickness [µm]Specific Electric Resistivity ρ [10−3 Ohm·m]
801.16
2400.93
7501.35
10401.16
Table 5. Specific resistance of graphite/FR layer calculated for different concentrations of FR. Errors (standard deviation) are in the order of ±10%. The thickness of the layer is dependent on the FR concentration.
Specific Electrical Resistivity ρ [10−3 Ohm·m].
5 wt.%10 wt.%20 wt.%35 wt.%50 wt.%
Li-oxalate44514118
Na-fumarate57121880
Na-malonate3311123417
Table 6. Gas formation of FR compounds. Gas volumes were calculated by assuming ideal behavior (1 mol equals to 22.4 L). A total of 100 g was converted to mol, and the molar equivalents of CO and CO2 were determined.
Lithium OxalateSodium FumarateSodium Malonate
Molecular mass [g∙mol−1]101.90160.04148.03
Temperature range [°C]300–600300–600300–600
Evolved gasCOCO2CO/CO2 (70:30)
Mass loss [%]27.927.522.6
mol-eq. CO2 [mol] per 1 mol FR0.9960.6260.471 + 0.202 = 0.673
mL CO2 per 1 g FR218.987.5101.9
Disclaimer/Publisher’s Note: The statements, opinions and data contained in all publications are solely those of the individual author(s) and contributor(s) and not of MDPI and/or the editor(s). MDPI and/or the editor(s) disclaim responsibility for any injury to people or property resulting from any ideas, methods, instructions or products referred to in the content.