Abstract
The knowledge of the influence of high dynamic loads on the electrical and mechanical behavior of lithium-ion cells is of high importance to ensure a safe use of batteries over the lifetime in electric vehicles. For the first time, the behavior of six commercial Li-Ion pouch cells after a constrained short-time acceleration (300 g over 6 ms) with a resulting cell surface pressure of 9.37 MPa was investigated. At this load, two out of six cells suffered from an internal short circuit, showing several damaged separator layers across the thickness in the area of the cell tabs. For the cells that remained intact, a range of measurement techniques (e.g., inner resistance measurement, electrochemical impedance spectroscopy (EIS), or thermal imaging) was used to reveal changes in the electrical property resulting from the load. The cells without short circuit show an increase of internal resistance (average of 0.89%) after the dynamic pre-load. The electric circuit model based on the EIS measurement indicates a decrease of the resistance R1 up to 30.8%. Additionally, mechanical properties of the cells in an abuse test subsequent to the dynamic pre-load were significantly influenced. The pre-loaded cell could sustain an 18% higher intrusion depth before electrical failure occurred as compared to a fresh cell in an indentation test. The results of this study revealed that a high acceleration pulse under realistic boundary conditions can lead to critical changes in a battery cell’s properties and needs to be taken into account for future safety assessments.
1. Introduction
Lithium-ion batteries (LIB) are the most promising energy storage system for a wide range of applications, such as consumer electronics as well as electric vehicles (EV) and hybrid electric vehicles (HEV). The investigation of the safety-relevant behavior of LIB after the occurrence of a mechanical load (e.g., crash) is of great importance as LIB bear several hazards, e.g., thermal runaway (TR), fire, or explosion [1,2].
Degradation mechanisms based on normal operation (e.g., vibrations [3,4,5,6,7], calendric ageing [8,9,10], cyclic ageing [11,12]) were found to cause changes to chemical [13,14,15], electrical [16], thermal [15,17], and mechanical [14,18,19,20] properties of LIB. In addition, besides the degradation during normal operation, mechanical loads can act on LIB, e.g., as a result of a crash. Several authors reported changes in LIB properties after a mechanical load (e.g., acceleration [4,21,22] or deformation [23,24]). The mentioned changes to LIB properties can affect its safety and is therefore investigated typically by conducting mechanical abuse tests.
Different mechanical abuse tests are defined in norms [25]. Several researchers already investigated various aspects of the safety relevant behavior of LIB in mechanical abuse tests. However, the focus was mostly on destructive testing by indentation. A crash might not result in indentation, but in an acceleration load and compression of the battery cells. During a crash, an acceleration load with peaks exceeding 100 g (not an SI unit but often used in relevant literature, 1 g equals 9.81 m/s2) can occur [26]. A planar acceleration load case is covered by several norms [25,27] with peak accelerations up to 175 g and shock durations of 6 ms (e.g., UL 1642 with peak acceleration of 175 g, UN 38.3 with 150 g, 6 ms). In real accident situations (e.g., vehicle to vehicle crash, curb strike), accelerations acting on the battery can sometimes significantly exceed acceleration values defined within these norms [21,28].
Based on a series of different experiments (quasi-static and dynamic), an attempt is made to find the load limit of cells until a short circuit occurs or a thermal runaway starts. Relevant boundary conditions (e.g., pretension of cells) were mostly neglected during mechanical abuse testing so far, even though it is known that they are affecting the mechanical load limits and properties such as stiffness [29]. Mechanical load limits are affected by several factors, such as indenter geometry, strain rate, or indentation locality [1,30,31,32]. Exceeding specific mechanical load limits leads to an internal short circuit (ISC) and a failure of the battery cell by TR.
Recent literature mostly focused on abuse testing with mechanical deformation [1,31,32,33,34] and cycling of mechanical deformed batteries [23]. It is not known in which way a high, short-time acceleration (e.g., mechanical shock) can affect the mechanical and safety behavior of a constrained single battery cell.
In this work, experiments with short-time accelerations up to 300 g with a pulse duration of 6 ms were performed. During the acceleration, the cell was also subjected to a compression representing the inertial effects of the adjacent cells within the module. After the short-time acceleration load (pre-load), the effects on battery safety in abuse conditions were investigated. Subsequent to the pre-load, the cells were subjected to a mechanical abuse test and the results were compared with reference cells that were not pre-loaded. In addition, the battery cells were analyzed with different assessment methodologies before and after the dynamic pre-load. The analysis techniques consisted of electrical (internal resistance measurement, electrochemical impedance spectroscopy) and thermal (thermal imaging) methods as well as a postmortem analysis (battery dissection).
2. Materials and Methods
2.1. General Data of Investigated Cell and State of Charge (SOC) Setting
The investigated battery cell was a state-of-the-art pouch cell with a nominal capacity of 41 Ah used in a commercial electric vehicle [35]. A single cell had a weight of 0.86 kg and a size of 216 × 260 × 7.8 mm. Kovachev et al. [36] performed a chemical analysis and measured the thickness of all components of the investigated cell. They concluded that NMC and graphite were used as cathode and anode material, respectively. The separator was single-layered with an Al2O3-coating and had a thickness of approximately 20 μm. To establish a certain state of charge (SOC) value, a constant current constant voltage (CC/CV) charging protocol was used for charging the batteries at a charging rate of 1C in the constant current phase and a cut-off current of 0.05 C in the constant voltage phase. Discharging was conducted in constant current (CC) mode with a discharge rate of 1 C. The charging and discharging were performed with a programmable DC power supply (EA-PSI 9000 3U, EA Elektro-Automatik, Viersen, Germany) and an electronic load (EA-EL 9000 B, EA Elektro-Automatik, Viersen, Germany).
2.2. Constrained Short-Time Acceleration (Dynamic Pre-Load)
In order to apply the dynamic pre-load, battery cells were inserted between two movable aluminum plates that were mounted in front of a test sled (see detail in Figure 1). This test rig was especially designed for highly dynamic battery experiments. The dynamic sled test resulted in a combined load on the cell with a high acceleration and a compression constraint. The battery cells were oriented in such a way that the acceleration and mechanical compression constraint were applied in transvers direction (direction w in Figure 1a). The dynamic system accelerated the sled with a total weight of 150 kg, including the battery cell, to a maximum speed of 18 m/s within a distance of 16 m. After the acceleration phase, the sled velocity was adjusted to the constant target speed (18 m/s) over a distance of 1 m. After that phase, the freely moving sled was decelerated by an aluminum honeycomb in order to achieve the predetermined deceleration of 300 g over 6 ms. Based on preliminary investigations, this load represents the load limit at which acute electrical failure may occur. The honeycomb (Plascore—PAMG-XR1-7.9-1/4-40-N-5052) was mounted to a crash block and acted as a deformation element, resulting in a surface pressure of 9.37 MPa in the u-v plane of the cell.

Figure 1.
(a) Dimension of the investigated pouch cell (b) Schematic presentation of the dynamic test rig with a velocity overlay.
Two measurement systems were used to record the sled position and to calculate the sled velocity at the point of contact with the honeycomb. An ultra-high-speed/high-accuracy laser displacement sensor LK-H 157, Keyence, Mechelen, Belgium) with a linearity of 0.02% and a repeatability of 0.25 μm was mounted at the crash block and directly measured the displacement of the sled. In addition, video target tracking was used to measure the displacement of the sled and was mainly used to validate the measurement results. A uniaxial, piezo resistive accelerometer (Typ 62C1-1000g, ASC, Pfaffenhofen, Germany) with an amplitude non-linearity of ±1% was used to record the sled acceleration. During the tests, the cell voltage was recorded with a Dewetron DAQP-STG (Dewetron, Grambach, Austria) module with a data acquisition rate of 100 kHz and a voltage input accuracy of ±0.05% of reading. The data acquisition was performed with Dewetron data acquisition system (DEWE 2602, Dewetron, Grambach, Austria). Acceleration signals and cell voltage were filtered with a CFC600 filter as this is recommended in the SAE J211 [37] regulation for tests with vehicle components. The cell voltage was recorded 200 ms before the acceleration pulse started for a duration of 600 ms. After an observation period of 10 min (time to monitor cell behavior for safety reasons), the voltage was measured with a Fluke 179 handheld digital multimeter (Fluke Corporation, Everett, WA, USA) with a voltage accuracy of ±(0.09% + 2 counts). After this time, the cells were detached from the sled and placed under observation for another 10 days, and the voltage was measured daily with the handheld digital multimeter. In total, 8 cells were tested at 0% state of charge (SOC) with the same test configuration.
2.3. Internal Resistance Measurement
The measurement of internal resistance was based on a simplification of the VDA current step method procedure [38]. All the internal resistance measurements were performed with a 30 s charging pulse with 41 A. The measurement was performed with a programmable DC power supply (EA-PSI 9000 3U, EA Elektro-Automatik, Viersen, Germany) and an electronic load (EA-EL 9000 B, EA Elektro-Automatik, Viersen, Germany). By subtracting the voltage of the battery under load (Ul) from the voltage of the battery before the application of the current pulse (U0) and dividing the result by the value of the discharge current (I), the internal resistance (Ri) of the battery cell could be determined.
2.4. Electrochemical Impedance Spectroscopy (EIS) Measurement
Electrochemical impedance spectroscopy (EIS) was performed with galvanostatic excitation at 50% SOC and a temperature of 20 °C. Three fresh cells were used as reference to indicate changes compared to dynamically pre-loaded cells. The measurement of current and voltage was conducted with a 24-bit ADC with 48 kHz sampling frequency and ±50 A and ±5 V measurement range, respectively. The measurements were repeated three times for each cell to quantify scatter and exclude measurement errors. The excitation frequency of the current ranged from 0.01 Hz to 1 kHz with 4 points per decade, in a logarithmic manner. The current amplitude was 20 A above a frequency of 0.05 Hz and was adapted to 13.6 A, 9.0 A, and 4.5 A for the frequencies of 0.03 Hz, 0.02 Hz, and 0.01 Hz, respectively.
The data evaluation was performed by fitting of the measurement data with an equivalent circuit (EC) with the software ZView. The EC consisted of the inductance L0, resistor R0, a parallel circuit with the resistor R1, constant phase element CPE1, and the Warburg element Wo1. The resistor R0 was chosen to make statements about the electrolyte resistance and investigate possible changes caused by a dynamic pre-load. The parallel circuit with R1 and CPE1 was chosen to be able to evaluate changes in the electrochemical behavior associated with the solid electrolyte interface (SEI) and charge-transfer resistance and track changes to semi-circles in the EIS. The constant phase element CPE1 was defined according to Equation (1) by the two parameters CPE1-T (T) and CPE1-P (P), with and representing the imaginary unit and angular frequency, respectively.
A finite-length Warburg element Wo1 was defined according to Equation (2) by the three parameters Wo1-R (R), Wo1-T (T), and Wo1-P (P). The exponent Wo1-P (P) was chosen to be mutable as a relocation of the electrolyte within the cell was expected when applying a dynamic pre-load. This might affect the diffusion of the Li-ions and result in deviation from the ideal diffusion process represented by a 45° phase angle with the standard Warburg impedance element with an exponent Wo1-P (P) of 0.5. A finite-length definition was chosen over an infinite-length Warburg element to possibly distinguish between liquid-phase and solid-phase diffusion.
2.5. Quasi-Static Abuse Tests
Quasi-static abuse tests were conducted on one fresh reference cell and on dynamically pre-loaded cells with 100% SOC. A hydraulic press was used to indent the center in w-direction of the cell with a hemispherical impactor with a radius of 15 mm. The tests were conducted at a testing velocity of 1 mm/s under ambient temperature conditions (20 °C), whereby every cell was deformed at least until a short circuit occurred. The indentation force, impactor displacement, and cell voltage were recorded during all abuse tests at an acquisition rate of every µm of deformation. A load cell type K 500 kN (GTM, Bickenbach, Germany) was used (accuracy class 0.02%) to measure the indentation force. Data acquisition was performed with a NI-9237 (National Instruments, Austin, TX, USA) Bridge Input Module with a resolution of 24 bits and a sample rate of 50 kHz. A 24-bit NI-9229 (National Instruments, Austin, TX, USA) Voltage Input Module (0–60 V per channel) was used to record the cell voltage. A linear glass scale with a resolution of 1 µm and an accuracy of ±0.01 mm/m was used to measure the intrusion depth. In all tests, high-definition videos were recorded.
2.6. Thermal Imaging
Electro-thermal analysis was conducted with a thermal imaging camera. For cells, with an internal short circuit, the location of the damage inside the cell could be determined. Cells without electrical failure were examined regarding a possible different surface temperature distribution pattern resulting from changes inside the cell. [3]
The measurements were performed using a thermal imaging camera (T600, Teledyne FLIR, Wilsonville, USA) with a thermal sensitivity <0.04 °C at 30 °C. The cells were painted with a matt black varnish to avoid surface reflections and receive a known emissivity number of approximately 0.97. This ensured correct temperature measurements.
On cells that show an internal short circuit, multiple charging current pulses with a duration of 5 s were applied to heat up damaged areas as well as prevent an uncontrollable rise of temperature. The charging current was increased stepwise, starting at 1 A, doubling after each repetition. A waiting time of 60 s was applied between the current pulses to allow a possible heat conduction from inner layers to the filmed surface. During the whole sequence of current pulse and waiting time, the cell surface was filmed with the thermal camera to see the evolution of the cell surface temperature.
Cells without an internal short circuit were charged for 15 min with 1 C (41 A). The temperature distribution of the cell surface was recorded by thermal imaging every 15 s to detect inhomogeneous temperature distributions arising from internal cell damage or changes in cell components.
2.7. Post-Mortem Analysis
The cells that had self-discharged after the dynamic pre-load were analyzed in more detail to understand the reason for self-discharge. These cells were deep-discharged (where necessary) and disassembled by cutting the pouch fold at the edge of the cell with ceramic scissors [36]. Damage caused by disassembling were avoided by cutting the pouch folds as far to the edge as possible. The single layers (electrodes and separators) of the disassembled cells were examined using a translucent light to find damage, e.g., holes in the separator.
3. Results and Discussion
3.1. Constrained Short-Time Acceleration (Dynamic Pre-Load)
Figure 2 illustrates graphs of the sled-acceleration and voltage of each cell as a function of time. Solid lines represent results of cells where no irreversible short circuit occurred while dashed lines show the accelerations and voltages of the cells that exhibited a permanent short circuit after the constrained acceleration loading.
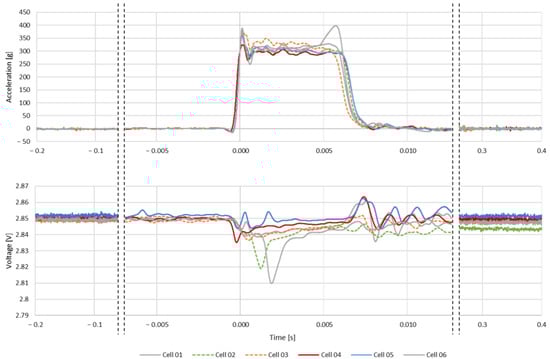
Figure 2.
Acceleration (CFC600 between −7.5 and 12.5 ms) and voltage signals (CFC600 between −7.5 and 12.5 ms) of all tested cells.
At the beginning of the acceleration pulses, a higher peak (324.2 g to 388.7 g) was noticed resulting from the buckling initiation of the aluminum honeycomb. After the initial phase (1 ms), an acceleration plateau with 300 g could be observed. For the experiment with Cell 06, another peak at the end of the acceleration phase could be recognized in the range of 398 g. The acceleration peak can be attributed to the fact that the aluminum honeycomb was almost completely compressed, which resulted in this acceleration overshoot [39]. For all other experiments, this compaction at the end of the pulse could not be seen.
The deviations from the target acceleration of 300 g over 6 ms (see Table 1) were analyzed for all cells, which had no internal short circuit. Because the loads of Cell 06 and Cell 01 show the largest deviations, they were put aside and excluded from further investigations. Cells 02 and 03, which showed a permanent short circuit after the test, were also included in further investigations.

Table 1.
Deviation of the target acceleration pulse of 300 g with 6 ms for Cell 01, and 04 to 06.
The cell voltage dropped at the beginning of the acceleration pulse for every conducted test by at least 0.01 V. A drop of the cell voltage can result from pressed out electrolyte between the layers [40], reducing ion-conductivity, or from smaller separator pores, caused by the compression load. Cells 01 and 03–05 showed a voltage overshoot at the end (7.5 ms) of the acceleration pulse between 0.003 and 0.01 V and a more oscillating voltage response after the overshoot in comparison to Cell 02. The voltage of Cell 06 showed the most significant change in the voltage of 0.04 V after 1.9 ms, but it recovered to the initial voltage after the end of the loading phase. Cell 02 also showed a significant but lower voltage drop than Cell 06 after 1.4 ms of the constrained acceleration. In contrast, Cell 02 self-discharged within ten minutes observation time to 0 V after the test. Even though the cell voltage of Cell 03 recovered back to the initial voltage level (2.85 V) 7 milliseconds after the start of the constrained acceleration, the cell discharged after the test. A voltage drop from 2.85 V to 1.65 V could be observed ten minutes after the test and to 0.22 V after 10 days. Since different discharge times could be observed, it can be assumed that the short circuit resistance is different for each cell. In the literature, it was observed that different types of short circuit exist [41]. The short circuit resistance is dependent on the components that come into contact within the cell. According to this, different discharge resistances and discharge times might be observed. However, it was not possible to determine which type of internal short circuit occurred in the individual cells.
Considering the ratio of cells with and without permanent internal short circuit, it can be assumed that the tested load level represents a load threshold the investigated cell can barely sustain. Exceeding the latter leads to internal damage of the layup structure, resulting in an internal short circuit.
3.2. Internal Resistance Measurement
The cells were visually inspected to ensure that there was no previous damage or noticeable difference. The internal resistance was measured before the dynamic pre-load for all six cells. The mean value of the internal resistance of the cells before the dynamic pre-loading was 20.17 mOhm with a standard deviation of 0.45 mOhm.
Table 2 summarizes the results of the internal resistance measurement and the percentage change caused by the dynamic pre-load. Cell 04 had an internal resistance of 19.57 mOhm and increased to 20.79 mOhm (+1.22%) after the dynamic pre-load. Cell 05 also indicated an increase in the internal resistance from 19.80 mOhm to 20.36 mOhm (+0.56%). A reason for this phenomenon could be that the compression of the cell leads to a reduction of the distances between the single layers inside the cell. It is conceivable that this increases the resistance of the cell because the electrolyte has been forced out of the separator and interlayers.
Table 2.
Measurement results of internal resistance before and after the dynamic pre-load and percentage change of internal resistance.
The remaining cells (Cell 02 and 03) could not be used to determine the internal resistance because of the internal short circuit.
3.3. EIS Measurement
Analysis of the cell impedance of the three investigated fresh reference cells indicated a small spread. A statistical evaluation of fitted EC elements for nine measurements (three measurements on each reference cell) showed small standard deviations (sd) for all parameters of the EC elements except the inductance L0 (Mean = 1.50 × 10⁴, sd = 10.1%) and the resistance in the Warburg element Wo1-R (Mean = 0.00835, sd = 10.0%), as shown in Table 3. This evaluation indicated low manufacturing tolerance and allowed for a comparison of the fresh reference cells with the dynamic pre-loaded cells. Observed changes in electrochemical behavior after applying the dynamic pre-load can be attributed to internal cell changes. Appendix A contains further details about the EIS measurements performed on the three fresh reference cells.
Table 3.
Mean EC element values and standard deviation (sd) for three reference cells and after dynamic pre-load for Cell 04 and 05. Values in brackets are percentage deviation values in reference to the reference mean.
Figure 3 indicates deviations in impedance of Cell 04 and 05 after the dynamic pre-load. Over a large frequency range, Cells 04 and 05 lay outside of a one standard deviation corridor.
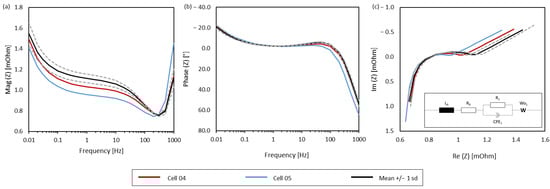
Figure 3.
Plot for mean impedance (black) and standard deviation corridor (grey) of fresh reference cells and for Cell 04 (red) and 05 (blue) after the dynamic pre-load with (a) magnitude of impedance, (b) phase of impedance and (c) Nyquist plot with equivalent circuit for curve fitting.
Further insights were obtained by the comparison of EC elements for the reference cells and after the dynamic pre-load, as shown in Table 3. The resistance R0 is correlated with the electrolyte resistance and was not affected by the dynamic pre-load. Cell 05 showed an increase in inductive behavior that might be attributed to the connection of the EIS measurement device and the cable layout. Cells 04 and 05 showed decreased R1 values by multiple standard deviations. The resistance R1 correlates in this case with the solid electrolyte interface (SEI) and charge-transfer resistance. Additionally, CPE1-T and Wo1-T increased for Cell 05 after the dynamic pre-load. CPE1-T and Wo1-T correlate with the double-layer capacity and diffusion, respectively. An irreversible and permanent compression of the battery cell and an uneven distribution of electrolyte caused by the dynamic pre-load could be a reason for the observed electrochemical behavior [12,42]. An analysis of video data of the dynamic pre-load test revealed that electrolyte within the cell was pressed towards the edges. Thickness changes of the battery cell and resulting changes in layer thicknesses and distances could influence the capacitive behavior and explain the changes observed for R1 and CPE1-T. Changes of other parameters of the equivalent circuit were within the range of two standard deviations of the reference measurements and were therefore found to be not significant.
3.4. Quasi-Static Abuse Tests
Cells 04 and 05 were subsequently subjected to an abuse test with a hemispherical impactor. In Figure 4, the force/displacement-curves of the indentation tests are shown. The colored lines are the dynamically pre-loaded cells, the black line represents the reference measurement with a fresh cell. The exact values of displacement until short circuit and the related force can be taken from Table 4. It was observed that for the cells which were dynamically pre-loaded, the intrusion of the impactor did not cause an earlier internal short circuit than for the reference cell. With a value of 22.19 kN, the maximum force at mechanical cell failure of compressed and accelerated cells is even higher compared to the value of 18.95 kN for the reference cell. A possible explanation of this phenomena could be the increase in the adhesion of the layers, caused by compression during the constrained acceleration test.
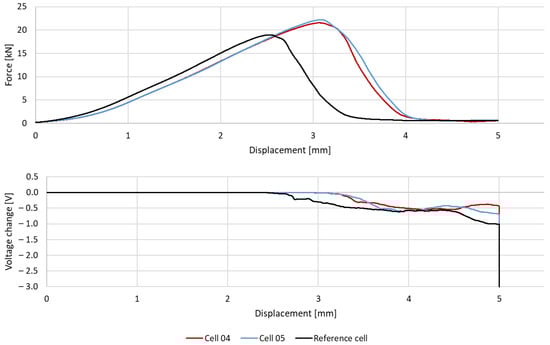
Figure 4.
Force vs. displacement and voltage change vs. displacement of the performed abuse tests.
Table 4.
Displacement and corresponding force values at ISC and their difference compared to the reference cell.
The peak force occurred at a range of intrusion of approximately 3.08 mm for the pre-loaded cells, compared to a value of 2.53 mm for the reference cell. As can be seen in Table 4, the dynamically pre-loaded cells failed at a lager deformation and were able to sustain a higher load level. The general behavior of the cell voltage during the test was comparable. For both pre-accelerated and fresh cells, a voltage drop was triggered at the mechanical failure of the cell. A shift of the short circuit could be assessed with the conducted abuse tests, which correlated with the different mechanical failure point. An immediate drop of the voltage to 0 V could be observed after the impactor is removed from the cell. The elastic recovery of the cell components led to a hard internal short circuit at this point [43].
3.5. Thermal Imaging
Figure 5 shows thermal images of Cells 02 and 03 with temperature hotspots on the cells’ surfaces. Cell 02 had a temperature hotspot located at the edge of the cell between both cell tabs with approximately 4 °C for a current pulse of 8 A. Cell 03 had a temperature hotspot fairly visible in the corner at the height of the cell tabs. Hotspots on the cell surface can be expected if an internal short circuit occurred within a pre-loaded cell due to local higher current densities. By comparing the two pictures, the assumption can be made that the ISC at Cell 03 is affecting a separator layer close to the upper surface while in the case of Cell 02, the ISC could be located in a layer in the middle of the cell. The thermal measurements were repeated on the opposite side of the cell. Nevertheless, no further hotspots could be detected. It seems that the different intensity of the hotspots between Cells 02 and 03 could be caused by a different short circuit mode [41,44]. At a short circuit with a still quite high resistance, the temperature increase is not so strong and therefore not so well visible with thermal imaging equipment.
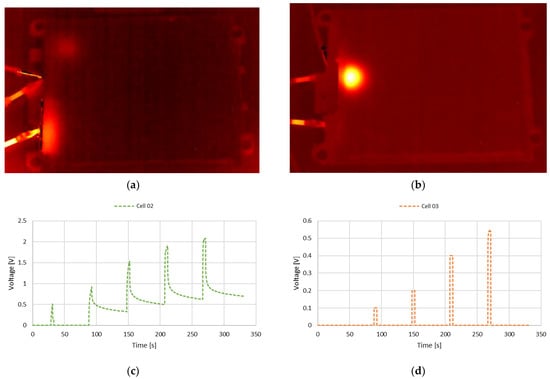
Figure 5.
(a) Temperature hotspot measured during charge current pulses by thermal imaging of Cell 02 (b) Temperature hotspot measured during charge current pulses by thermal imaging of Cell 03 (c) Voltage response of Cell 02 at current of 8 A. (d) Voltage response of Cell 03 at current of 8 A.
The result of voltage measurement in Figure 5 shows that both cells have an initial voltage of 0 V. A certain amount of energy could still be charged into Cell 02, indicating only a small separator defect with a still high electric resistance (Figure 5a,c). After removing the applied voltage, the voltage of the cell shows an exponential drop. The considered time period is too short to see a complete discharge due to the internal short circuit. In comparison, Cell 03, which showed a hotspot (Figure 5b), shows a clear sign of a hard internal short circuit in the voltage signal. The voltage drops immediately to 0 V after every charging pulse. Based on the voltage signal, it is only possible to detect a defect of the separator. If the anode or the cathode rupture, neither a hotspot in thermal analysis nor a change in the voltage is to be expected.
The cells that sustained the dynamic pre-load without a permanent voltage drop (Cell 05 and 06) were filmed with the thermal camera during one CC/CV charging procedure with 1 C. Thereby, it was found that the temperature distribution was homogeneous over the entire cell surface. A comparative measurement with a fresh cell did not show a difference in temperature or its distribution over the cell surface between the fresh and the dynamically pre-loaded cells. It can be summarized that the dynamically pre-loaded cells where no internal short circuit occurred do not show any internal damage which led to a change in the thermal behavior of the cells.
3.6. Post-Mortem Analysis
In order to determine the exact location of the ISC, Cells 02 and 03 were disassembled. For every cell, the reason for the ISC could be found. Since the separator is the most safety-relevant component within the cell, it was examined in greater detail. In Figure 6, the typically found pattern of damage is shown. In addition, Figure 6b shows the damage of the separator which can be assigned to the hotspot of Cell 03 in the upper layers. The found damage is significantly greater than expected. There were cracks in the separator and detached active material of anode or cathode observable. A detailed analysis of the separator layers showed that in both disassembled cells the separator suffered multiple damages. In Cell 03, 23 of 42 separator layers were found to be damaged (Figure 6b). In contrast, Cell 02 showed a number of 14 broken separator layers. There was no clear tendency demonstrated as to whether the separators located closer to the cell outer surface or the ones closer to the center of the cell are at higher risk of damage. The damage was distributed over the entire thickness of the cell.
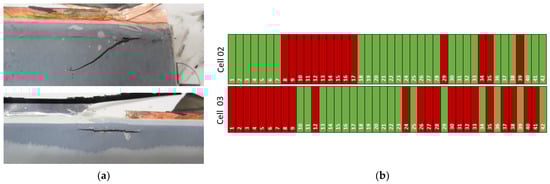
Figure 6.
(a) Damages inside the cell after dynamic pre-load tests at cell 04. (b) Evaluation of the damaged separator layers (red) for cell 03 and 04.
It is remarkable that the damage is exclusively in the area of the cell tabs. None of the damage is more than 30 mm away from the cell tabs. An inspection to determine whether the material properties in the area of the cell tabs differed from the rest of the cell did not reveal any findings.
When this area was examined with the aid of microscopy, it was found that an additional separator layer was used as reinforcement in the area of the cell tabs. However, only approximately 2 mm of the additional layer extend into the cell. Figure 7 illustrates a microscopy image of this area. In dark grey, the additional layer can be seen on the separator, which extends approximately 2 mm into the cell [36].
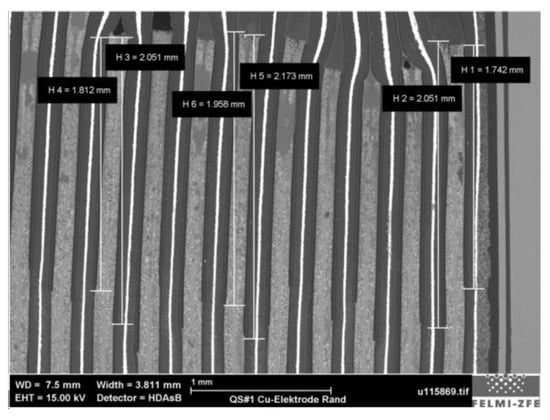
Figure 7.
Microscopy image of the cell near the cell tabs. The additional layer of separator is visible in dark grey and extends approx. 2 mm into the cell [36].
The additional layer of separator does not extend to the location where the damage in the cell was observed. Nevertheless, it cannot be excluded that this will increase the load on the separator in the neighboring area because the thickness of the cell parts with additional layers is different compared to other areas. Another explanation for the location could be the internal structure of the cells. Separator material can be found not only in the area between the anode and cathode, but also at the transition region to the terminal tabs, which might cause regions with higher stress peaks during mechanical loading and cause a separator failure.
3.7. Summary
The results of all six tested cells are summarized in Table 5. All cells except Cell 01 and Cell 06 were deeply analyzed after the dynamic pre-load, with different analysis methods depending on weather a short circuit occurred during the dynamic pre-load, as highlighted in Table 5.
Table 5.
Chronologic illustration and main results of the conducted tests with cells depending on whether a short circuit has occurred or not. Ri—internal resistance measurement, dyn. pre-load—constrained acceleration load, TI—thermal imagining, PA—post-mortem analysis, EIS—electrochemical impedance spectroscopy, QS—quasi-static testing.
4. Limitations
Battery cells are pre-loaded within a battery module for better ageing performance [45]. During their lifetime, irreversible chemical reactions cause a change in battery cell thickness, resulting in an increased pretension force over time [45] and a change in mechanical properties [14]. This might affect the mechanical response of the battery module and failure of the battery cells [46,47].
Geometrical changes of the battery, pretension variations, and different testing SOCs should be considered for future testing procedures to gain a deep understanding of the safety behavior of the used battery cells. Additional components within a battery module, such as cooling plates [46] or compression pads [47], directly influence the mechanical response during mechanical abuse and should also be considered in future research.
5. Conclusions
In this study, six pouch cells were constrained with a compressive force of about 9 MPa and dynamically pre-loaded with a 300 g acceleration pulse lasting 6 ms. Four cells were used for further investigations. Two of these cells (Cell 04 and 05) did not show a permanent voltage drop, indicating that no internal short circuit occurred, and were further analyzed with an internal resistance measurement, electrochemical impedance spectroscopy, and mechanical indentation test. All three tests revealed a change in reference measurements, indicating a change in properties caused by the mechanical pre-load. Two cells (Cell 02 and 03) had a permanent voltage drop, suggesting an internal short circuit, and were further analyzed by thermal imaging and post mortem analysis. Thermal imaging revealed hot spots located at the position of separator failure proven by a dissection of the cells to analyze the number of broken separator layers. In the following, the conclusions drawn from this study are summarized:
- The applied load as combination of acceleration and compression indicated a load limit for separator rupture as one third of the tested cells suffered from an internal short circuit. The other cells did not indicate an internal short circuit.
- High accelerations in the thickness direction of a constrained battery cell can lead to an internal short circuit by separator rupture. A separator rupture might be caused by high shear forces within the cell (e.g., electrolyte movement).
- Cells without internal short circuit after dynamic pre-load showed a change in electric and mechanical properties potentially causing safety-relevant issues, e.g., an increased inner resistance can cause greater heating of a cell during normal operation.
- Inner resistance measurements and electrochemical impedance spectroscopy can show changes in the electrical behavior of dynamic pre-loaded cells. Therefore, such measurements can be considered for non-destructive battery monitoring and analysis.
- Considering the level of load that needed to be applied to the cells, it has to be remarked that this exceeds by far the current regulatory requirements. The cell as such is considered to be robust. It is assumed that at such load levels as tested, other failure modes within a battery or a module are likely more critical.
The results of this study revealed that a high acceleration pulse under realistic boundary conditions can lead to critical changes in a battery cell’s properties. In some cases, these changes were not indicated by standard measurement quantities, e.g., voltage or temperature. More advanced measurement techniques such as EIS revealed property changes and might be used to find unsafe battery cells.
Constrained battery cells showed high load limits for acceleration loads. Further research is needed to find load limits for other load cases to be able to include battery cells in the load path of a battery system. For future investigations and safety assessments, the authors recommend taking into account the different behavior of dynamically pre-loaded cells.
Author Contributions
Conceptualization, C.E., P.H. and G.G.; methodology, C.E., P.H. and G.G.; formal analysis, C.E., P.H. and E.H.; investigation, C.E. and P.H.; writing—original draft preparation, C.E.; writing—review and editing, C.E., P.H., E.H., G.K. and G.G.; visualization, C.E., P.H., E.H. and G.K.; project administration, C.E. and G.G.; funding acquisition, C.E. All authors have read and agreed to the published version of the manuscript.
Funding
The presented work was conducted within the scope SafeLIB. The COMET Project SafeLIB was funded within the framework of COMET—Competence Centers for Excellent Technologies (Grant agreement No. 882506) by BMK, BMDW, the Province of Upper Austria, the province of Styria as well as SFG. The COMET Program is managed by FFG. Open Access Funding by the Graz University of Technology.
Data Availability Statement
The data presented in this study are available on request from the corresponding author. The data are not publicly available due to privacy restrictions.
Acknowledgments
The authors are grateful for insightful discussions about the approach and results with Wolfgang Sinz and for the support to get the funding for the project SafeLIB. The authors thank Clemens Dünser for help while performing the experiments.
Conflicts of Interest
The authors declare no conflict of interest.
Abbreviations
The following abbreviations are used in this manuscript:
| LIB | Lithium ion battery |
| EV | Electric vehicle |
| HEV | Hybrid electric vehicle |
| TR | Thermal runaway |
| ISC | internal short circuit |
| SOC | State of charge |
| NMC | Lithium nickel manganese cobalt oxide |
| CC | Constant current |
| CV | Constant voltage |
| DC | Direct current |
| EIS | Electrochemical impedance spectroscopy |
| ADC | Analog digital converter |
| EC | Equivalent circuit |
| SEI | Solid electrolyte interface |
| TI | Thermal imagining |
| PA | Post-mortem analysis |
| QS | Quasi-static |
Appendix A
Figure A1 illustrates the results of electrochemical impedance spectroscopy of the three fresh reference cells. Each reference cell was measured three times. These results were used to derive mean values and the standard deviations within the manuscript.

Figure A1.
Plot of electrochemical impedance measurement (EIS) results for three reference cells and three repetitions per cell with (a) magnitude of impedance, (b) phase of impedance and (c) Nyquist plot.
References
- Liu, B.; Jia, Y.; Yuan, C.; Wang, L.; Gao, X.; Yin, S.; Xu, J. Safety issues and mechanisms of lithium-ion battery cell upon mechanical abusive loading: A review. Energy Storage Mater. 2020, 24, 85–112. [Google Scholar] [CrossRef]
- Marcos, D.; Garmendia, M.; Crego, J.; Cortajarena, J.A. Functional Safety BMS Design Methodology for Automotive Lithium-Based Batteries. Energies 2021, 14, 6942. [Google Scholar] [CrossRef]
- Swornowski, P.J. Destruction mechanism of the internal structure in Lithium-ion batteries used in aviation industry. Energy 2017, 122, 779–786. [Google Scholar] [CrossRef]
- Brand, M.J.; Schuster, S.F.; Bach, T.; Fleder, E.; Stelz, M.; Gläser, S.; Müller, J.; Sextl, G.; Jossen, A. Effects of vibrations and shocks on lithium-ion cells. J. Power Sources 2015, 288, 62–69. [Google Scholar] [CrossRef]
- Zhang, L.; Ning, Z.; Peng, H.; Mu, Z.; Sun, C. Effects of Vibration on the Electrical Performance of Lithium-Ion Cells Based on Mathematical Statistics. Appl. Sci. 2017, 7, 802. [Google Scholar] [CrossRef]
- Berg, P.; Spielbauer, M.; Tillinger, M.; Merkel, M.; Schoenfuss, M.; Bohlen, O.; Jossen, A. Durability of lithium-ion 18650 cells under random vibration load with respect to the inner cell design. J. Energy Storage 2020, 31, 101499. [Google Scholar] [CrossRef]
- Hooper, J.; Marco, J.; Chouchelamane, G.; Lyness, C. Vibration Durability Testing of Nickel Manganese Cobalt Oxide (NMC) Lithium-Ion 18,650 Battery Cells. Energies 2016, 9, 52. [Google Scholar] [CrossRef]
- Geisbauer, C.; Wöhrl, K.; Mittmann, C.; Schweiger, H.-G. Review of Safety Aspects of Calendar Aged Lithium Ion Batteries. J. Electrochem. Soc. 2020, 167, 90523. [Google Scholar] [CrossRef]
- Werner, D.; Paarmann, S.; Wetzel, T. Calendar Aging of Li-Ion Cells—Experimental Investigation and Empirical Correlation. Batteries 2021, 7, 28. [Google Scholar] [CrossRef]
- Sui, X.; Świerczyński, M.; Teodorescu, R.; Stroe, D.-I. The Degradation Behavior of LiFePO4/C Batteries during Long-Term Calendar Aging. Energies 2021, 14, 1732. [Google Scholar] [CrossRef]
- Mussa, A.S.; Klett, M.; Lindbergh, G.; Lindström, R.W. Effects of external pressure on the performance and ageing of single-layer lithium-ion pouch cells. J. Power Sources 2018, 385, 18–26. [Google Scholar] [CrossRef]
- Barai, A.; Tangirala, R.; Uddin, K.; Chevalier, J.; Guo, Y.; McGordon, A.; Jennings, P. The effect of external compressive loads on the cycle lifetime of lithium-ion pouch cells. J. Energy Storage 2017, 13, 211–219. [Google Scholar] [CrossRef]
- Gao, T.; Lu, W. Mechanism and effect of thermal degradation on electrolyte ionic diffusivity in Li-ion batteries: A molecular dynamics study. Electrochim. Acta 2019, 323, 134791. [Google Scholar] [CrossRef]
- Kovachev, G.; Ellersdorfer, C.; Gstrein, G.; Hanzu, I.; Wilkening, H.M.R.; Werling, T.; Schauwecker, F.; Sinz, W. Safety assessment of electrically cycled cells at high temperatures under mechanical crush loads. eTransportation 2020, 6, 100087. [Google Scholar] [CrossRef]
- Essl, C.; Golubkov, A.W.; Fuchs, A. Influence of Aging on the Failing Behavior of Automotive Lithium-Ion Batteries. Batteries 2021, 7, 23. [Google Scholar] [CrossRef]
- Ansean, D.; Garcia, V.M.; Gonzalez, M.; Blanco-Viejo, C.; Viera, J.C.; Pulido, Y.F.; Sanchez, L. Lithium-Ion Battery Degradation Indicators Via Incremental Capacity Analysis. IEEE Trans. Ind. Appl. 2019, 55, 2992–3002. [Google Scholar] [CrossRef]
- Kovachev, G.; Astner, A.; Gstrein, G.; Aiello, L.; Hemmer, J.; Sinz, W.; Ellersdorfer, C. Thermal Conductivity in Aged Li-Ion Cells under Various Compression Conditions and State-of-Charge. Batteries 2021, 7, 42. [Google Scholar] [CrossRef]
- Xu, J.; Jia, Y.; Liu, B.; Zhao, H.; Yu, H.; Li, J.; Yin, S. Coupling Effect of State-of-Health and State-of-Charge on the Mechanical Integrity of Lithium-Ion Batteries. Exp. Mech. 2018, 58, 633–643. [Google Scholar] [CrossRef]
- Zhang, X.; Zhu, J.; Sahraei, E. Degradation of battery separators under charge–discharge cycles. RSC Adv. 2017, 7, 56099–56107. [Google Scholar] [CrossRef]
- Wu, Z.; Cao, L.; Hartig, J.; Santhanagopalan, S. (Invited) Effect of Aging on Mechanical Properties of Lithium Ion Cell Components. ECS Trans. 2017, 77, 199–208. [Google Scholar] [CrossRef]
- Spielbauer, M.; Berg, P.; Soellner, J.; Peters, J.; Schaeufl, F.; Rosenmüller, C.; Bohlen, O.; Jossen, A. Experimental investigation of the failure mechanism of 18650 lithium-ion batteries due to shock and drop. J. Energy Storage 2021, 43, 103213. [Google Scholar] [CrossRef]
- Wang, G.; Zhang, S.; Li, M.; Wu, J.; Wang, B.; Song, H. Deformation and Failure Properties of High-Ni Lithium-Ion Battery under Axial Loads. Materials 2021, 14, 7844. [Google Scholar] [CrossRef]
- Soudbakhsh, D.; Gilaki, M.; Lynch, W.; Zhang, P.; Choi, T.; Sahraei, E. Electrical Response of Mechanically Damaged Lithium-Ion Batteries. Energies 2020, 13, 4284. [Google Scholar] [CrossRef]
- Chen, X.; Yuan, Q.; Wang, T.; Ji, H.; Ji, Y.; Li, L.; Liu, Y. Experimental study on the dynamic behavior of prismatic lithium-ion battery upon repeated impact. Eng. Fail. Anal. 2020, 115, 104667. [Google Scholar] [CrossRef]
- Ruiz, V.; Pfrang, A.; Kriston, A.; Omar, N.; van den Bossche, P.; Boon-Brett, L. A review of international abuse testing standards and regulations for lithium ion batteries in electric and hybrid electric vehicles. Renew. Sustain. Energy Rev. 2018, 81, 1427–1452. [Google Scholar] [CrossRef]
- Wisch, M.; Ott, J.; Thomson, R.; Léost, Y.; Abert, M.; Yao, J. Recommendations and Guidelines for Battery Crash Safety and Safety and Post-Crash Safe Handling: EVERSAFE Project Deliverable D3.1. 2014. Available online: https://www.diva-portal.org/smash/get/diva2:1367933/FULLTEXT01.pdf (accessed on 19 December 2022).
- UL 1642; UL Standard for Safety Lithium Batteries. 6th ed. UL Standard: Northbrook, IL, USA, 12 October 2022.
- Ellersdorfer, C.; Sevarin, A.; Tomasch, E.; Sinz, W.; Ebner, A.; Deitermann, N.; Forster, M. Battery Safety Evaluation of Electric Driven Motorcycles from the Perspective of Accident Research. In Proceedings of the 30th International Electric Vehicle Symposium (EVS30), Stuttgart, Germany, 9–11 October 2017. [Google Scholar]
- Li, W.; Xia, Y.; Zhu, J.; Luo, H. State-of-Charge Dependence of Mechanical Response of Lithium-Ion Batteries: A Result of Internal Stress. J. Electrochem. Soc. 2018, 165, A1537–A1546. [Google Scholar] [CrossRef]
- Wang, W.; Yang, S.; Lin, C.; Shen, W.; Lu, G.; Li, Y.; Zhang, J. Investigation of mechanical property of cylindrical lithium-ion batteries under dynamic loadings. J. Power Sources 2020, 451, 227749. [Google Scholar] [CrossRef]
- Kisters, T.; Kuder, J.; Töpel, A.; Langkemper, R.; Nau, S.; Schopferer, S. Strain-rate dependence of the failure behavior of Lithium-Ion pouch cells under impact loading. J. Energy Storage 2021, 41, 102901. [Google Scholar] [CrossRef]
- Tancogne-Dejean, T.; Grolleau, V.; Mohr, D. Strain rate dependent plasticity of lithium-ion pouch cells: Experiments and simulations. Int. J. Impact Eng. 2022, 159, 104048. [Google Scholar] [CrossRef]
- Sprenger, M.; Dölle, N.; Schauwecker, F.; Raffler, M.; Ellersdorfer, C.; Sinz, W. Multiscale Analysis and Safety Assessment of Fresh and Electrical Aged Lithium-Ion Pouch Cells Focusing on Mechanical Behavior. Energies 2022, 15, 847. [Google Scholar] [CrossRef]
- Raffler, M.; Sevarin, A.; Ellersdorfer, C.; Heindl, S.F.; Breitfuss, C.; Sinz, W. Finite element model approach of a cylindrical lithium ion battery cell with a focus on minimization of the computational effort and short circuit prediction. J. Power Sources 2017, 360, 605–617. [Google Scholar] [CrossRef]
- Raffler, M.; Sinz, W.; Erker, S.; Brunnsteiner, B.; Ellersdorfer, C. Influence of loading rate and out of plane direction dependence on deformation and electro-mechanical failure behavior of a lithium-ion pouch cell. J. Energy Storage 2022, 56, 105906. [Google Scholar] [CrossRef]
- Kovachev, G.; Schröttner, H.; Gstrein, G.; Aiello, L.; Hanzu, I.; Wilkening, H.M.R.; Foitzik, A.; Wellm, M.; Sinz, W.; Ellersdorfer, C. Analytical Dissection of an Automotive Li-Ion Pouch Cell. Batteries 2019, 5, 67. [Google Scholar] [CrossRef]
- SAE J211-1; Instrumentation for Impact Test—Part 1—Electronic Instrumentation. SAE International: Warrendale, PA, USA, 2014.
- Schweiger, H.-G.; Obeidi, O.; Komesker, O.; Raschke, A.; Schiemann, M.; Zehner, C.; Gehnen, M.; Keller, M.; Birke, P. Comparison of several methods for determining the internal resistance of lithium ion cells. Sensors 2010, 10, 5604–5625. [Google Scholar] [CrossRef] [PubMed]
- Ivañez, I.; Fernandez-Cañadas, L.M.; Sanchez-Saez, S. Compressive deformation and energy-absorption capability of aluminium honeycomb core. Compos. Struct. 2017, 174, 123–133. [Google Scholar] [CrossRef]
- Zhu, J.; Luo, H.; Li, W.; Gao, T.; Xia, Y.; Wierzbicki, T. Mechanism of strengthening of battery resistance under dynamic loading. Int. J. Impact Eng. 2019, 131, 78–84. [Google Scholar] [CrossRef]
- Zhang, G.; Wei, X.; Tang, X.; Zhu, J.; Chen, S.; Dai, H. Internal short circuit mechanisms, experimental approaches and detection methods of lithium-ion batteries for electric vehicles: A review. Renew. Sustain. Energy Rev. 2021, 141, 110790. [Google Scholar] [CrossRef]
- Cannarella, J.; Arnold, C.B. Ion transport restriction in mechanically strained separator membranes. J. Power Sources 2013, 226, 149–155. [Google Scholar] [CrossRef]
- Arora, S.; Shen, W.; Kapoor, A. Review of mechanical design and strategic placement technique of a robust battery pack for electric vehicles. Renew. Sustain. Energy Rev. 2016, 60, 1319–1331. [Google Scholar] [CrossRef]
- Zhang, X.; Sahraei, E.; Wang, K. Li-ion Battery Separators, Mechanical Integrity and Failure Mechanisms Leading to Soft and Hard Internal Shorts. Sci. Rep. 2016, 6, 32578. [Google Scholar] [CrossRef]
- Li, R.; Li, W.; Singh, A.; Ren, D.; Hou, Z.; Ouyang, M. Effect of external pressure and internal stress on battery performance and lifespan. Energy Storage Mater. 2022, 52, 395–429. [Google Scholar] [CrossRef]
- Kalnaus, S.; Wang, H.; Watkins, T.R.; Kumar, A.; Simunovic, S.; Turner, J.A.; Gorney, P. Effect of packaging and cooling plates on mechanical response and failure characteristics of automotive Li-ion battery modules. J. Power Sources 2018, 403, 20–26. [Google Scholar] [CrossRef]
- Xia, Y.; Chen, G.; Zhou, Q.; Shi, X.; Shi, F. Failure behaviours of 100% SOC lithium-ion battery modules under different impact loading conditions. Eng. Fail. Anal. 2017, 82, 149–160. [Google Scholar] [CrossRef]
Disclaimer/Publisher’s Note: The statements, opinions and data contained in all publications are solely those of the individual author(s) and contributor(s) and not of MDPI and/or the editor(s). MDPI and/or the editor(s) disclaim responsibility for any injury to people or property resulting from any ideas, methods, instructions or products referred to in the content. |
© 2023 by the authors. Licensee MDPI, Basel, Switzerland. This article is an open access article distributed under the terms and conditions of the Creative Commons Attribution (CC BY) license (https://creativecommons.org/licenses/by/4.0/).