Review

Review and Stress Analysis on the Lithiation Onset of Amorphous Silicon Films

1
School of Aerospace Engineering and Applied Mechanics, Tongji University, Shanghai 200092, China
2
Clausthal Centre of Material Technology, Clausthal University of Technology, D-38678 Clausthal-Zellerfeld, Germany
3
Solid State Kinetics Group, Institute of Metallurgy, Clausthal University of Technology, D-38678 Clausthal-Zellerfeld, Germany
4
Jiangsu Key Laboratory of Engineering Mechanics, School of Civil Engineering, Southeast University, Nanjing 210096, China
5
Materials Program, Department of Chemical and Materials Engineering, University of Kentucky, Lexington, KY 40506, USA
*
Authors to whom correspondence should be addressed.
Batteries 2023, 9(2), 105; https://doi.org/10.3390/batteries9020105
Submission received: 14 November 2022 / Revised: 13 January 2023 / Accepted: 29 January 2023 / Published: 2 February 2023
(This article belongs to the Special Issue Electrode Materials for Rechargeable Lithium Batteries)

Abstract

:
This work aims to review and understand the behavior of the electrochemical lithiation onset of amorphous silicon (a-Si) films as electrochemically active material for new generation lithium-ion batteries. The article includes (i) a review on the lithiation onset of silicon films and (ii) a mechanochemical model with numerical results on the depth-resolved mechanical stress during the lithiation onset of silicon films. Recent experimental studies have revealed that the electrochemical lithiation onset of a-Si films involves the formation of a Li-poor phase (Li0.3Si alloy) and the propagation of a reaction front in the films. The literature review performed reveals peculiarities in the lithiation onset of a-Si films, such as (i) the build-up of the highest mechanical stress (up to 1.2 GPa) during lithiation, (ii) a linear increase in the mechanical stress with lithiation which mimics the characteristics of linear elastic deformation, (iii) only a minute volume increase during Li incorporation, which is lower than expected from the number of Li ions entering the silicon electrode, (iv) the largest heat generation appearing during cycling with only a minor degree of parasitic heat contribution, and (v) an unexpected enhanced brittleness. The literature review points to the important role of mechanical stresses in the formation of the Li-poor phase and the propagation of the reaction front. Consequently, a mechanochemical model consisting of two stages for the lithiation onset of a-Si film is developed. The numerical results calculated from the mechanochemical model are in good accord with the corresponding experimental data for the variations in the volumetric change with state of charge and for the moving speed of the reaction front for the lithiation of an a-Si film of 230 nm thickness under a total C-rate of C/18. An increase in the total C-rate increases the moving speed of the reaction front, and a Li-rich phase is likely formed prior to the end of the growth of the Li-poor phase at a high total C-rate. The stress-induced phase formation of the Li-poor phase likely occurs during the lithiation onset of silicon electrodes in lithium-ion battery.

1. Introduction

The necessity of incorporating silicon in lithium-ion batteries (LIBs) to achieve high-capacity charge storage has been discussed in many publications, e.g., in references [1,2,3,4,5,6,7,8,9,10,11,12,13,14,15,16,17], but the lithiation process of silicon is scarcely discussed in the literature, as stated in a recent letter (reference [1]). Briefly, silicon, which is well known to be technologically well established, benign, and naturally abundant, possesses the highest gravimetric (3579 mAhg−1) and volumetric (8334 mAhcm−3) capacities, next to Li metal, for storing Li ions. Consequently, there are great efforts to implement silicon as an anode material in next-generation LIBs, although the endeavours remain unsatisfactory. The desire to store large amounts of charge (Li ions) by using large amounts of silicon represents concomitantly its disadvantage due to the rapid development of electrode damage (pulverization of active material) within the first cycle. Thus, it is of interest to understand the lithiation process of silicon even in the first cycle.
This work aims to review and understand the behavior of the lithiation onset of amorphous silicon (a-Si) films. Literature data are addressed, with a focus on some peculiarities in the properties of silicon electrodes during the lithiation onset which have not been reviewed until yet. Recent experimental studies have revealed that the lithiation onset of silicon films involves the formation of a Li-poor phase (Li0.3Si alloy) and the propagation of a reaction front in the films (Figure 1e–g), instead of the formation of a layer between the solid electrode and the liquid electrolyte (solid electrolyte interphase, SEI, layer) (Figure 1a,b) widely reported in the literature, as discussed in reference [1]. These results challenge the conventional consensus that the lithiation onset of silicon films is due to the formation of solid electrolyte interphase and to the reduction of native surface oxide (Figure 1a,b). Figure 1 summarizes the two different points of view concerning the lithiation onset of a-Si films with explanations given in the figure caption. To address this issue, we propose a mechanochemical model consisting of two stages for the lithiation onset of a-Si film. The numerical results are in good accord with the corresponding experimental data for the variations in the radial stress and volumetric change with state of charge and for the moving speed of the reaction front for the lithiation of an a-Si film. The analysis suggests the presence of the stress-induced phase formation of a Li-poor phase for the lithiation onset of a-Si and likely resolves the debate associated with the lithiation onset, which plays an important role in the structural integrity of Si-based anodes and the applications of Si-based LIB, as outlined in the following.
The authors of this work chose to work on this topic because they consider that it contributes to an understanding of the lithiation process of silicon, which plays an important role in determining the performance and reliability of Si-based LIBs during operation. The appearance of the Li-poor phase (Figure 1) may be proper and important for the LIB operation. It is more likely to accept that the formation of the Li-poor phase avoids structural disruption. Pure silicon is in proximity to the Li-poor LixSi phase (x ~ 0.3) (Figure 1e,f) and not directly to a Li-rich LixSi phase (x > 2) (Figure 1c), and may be preferable for the LIB operation.
Moreover, the appearance of the Li-poor phase has an influence not only on the bonding between different phases inside the silicon at different lithiated stages (Figure 1c,e,f) but also on the bonding of the active material (silicon) to the current collector (Figure 1), which is mainly copper for negative electrodes. The latter, i.e., the bonding of the active material to the current collector, is of importance for the electrode’s integrity during LIB operation. On this issue, let us mention that experiments have shown that the Li-poor (x ~ 0.3) zone remains close to the copper current collector if the electrode is, electrochemically as possible, fully lithiated (Figure 1h), and also after several electrochemical cycles [1]. From that point of view, let us examine the literature on the bonding of the active material to the current collector. Before lithiation, the bonding of silicon to the current collector (copper) (Figure 1a) is experimentally and theoretically well known to be reasonably strong. The lithiation process inevitably increases the Li content in silicon in the vicinity of the current collector (Figure 1d,g,h). The ab initio molecular dynamics calculations at finite temperatures within the framework of density functional theory as implemented in the VASP code [18] predict that the bonding strength of the LixSi active material to the current collector decreases with the Li content in silicon. The reason for the weakened bonding at the a-Si/Cu interface represents a change in interfacial bonding upon lithiation [18]. According to the calculated interfacial work of separation versus Li content in the silicon electrode [18], the bonding strength of the Li poor silicide phase (x ~ 0.3) to copper (Figure 1g,h) is only about 2% lower than that for pure silicon bonded to copper (situation depicted in Figure 1a,e,f), but decreases for higher Li contents (situation depicted in Figure 1d), e.g., being seven times lower (i.e., 15%) for LixSi with x = 1. More drastic is the situation for the critical shear strength during sliding at the Si/Cu interface [18]. On the one hand, the interfacial work of separation (LixSi/Cu) is reduced by only ∼15% upon full lithiation (x ~ 3.75) (situation depicted in Figure 1d) compared to a Li poor phase (x ~ 0.3) (situation depicted in Figure 1g,h); on the other hand, the critical shear strength is reduced by an order of magnitude for the situation presented in Figure 1d compared to that in Figure 1g,h. Similarly, the net charge on copper [18] increases by one order of magnitude upon full lithiation (situation depicted in Figure 1d) compared to a Li-poor phase (situation depicted in Figure 1g,h). The calculated derivative of the interface energy along the sliding direction [18] shows a peaked profile (i.e., a great fluctuation) vs sliding distance for the Li-poor phase (for the situation depicted in Figure 1g,h), whereas the Li-rich phase possesses a smooth profile (for the situation depicted in Figure 1d). This allows for the “frictionless” sliding of the Li-rich phase at the LixSi/copper interface but not for the Li-poor-phase at the LixSi/copper interface, which likely suggests a separation of the Li-rich phase (Figure 1d) from the copper current collector similar to the behavior of tin-based LIBs [19], but not the Li-poor phase (Figure 1g,h). The inhibition of “frictionless” sliding is crucial to prevent LIB failure by the loss of electrical contact between the active material and the current collector. As mentioned, experiments have shown that a Li-poor (x ~ 0.3) layer remains close to the copper current collector also at full lithiation (Figure 1h). Consequently, it is more favorable to form the Li-poor phase first, and to maintain the Li-poor phase at the interface to the current collector (Figure 1g,h) during LIB cycling. In that context, this work is focused on the analysis of this initial lithiation process, i.e., on the apparition of the Li-poor phase, which is, as mentioned, scarcely discussed in the literature, and has, consequently, remained below public awareness.
The article is organized as follows. Section 2 presents a literature survey on the lithiation onset of a-silicon. Section 2.1 describes the lithiation onset of a-silicon. Section 2.2 presents literature data on some peculiarities in the properties of silicon electrodes during the lithiation onset which have not been reviewed until yet. Section 2.3 elaborates some explanatory reasons for the phase front mechanism in the lithiation onset. Section 3 presents numerical investigations (modeling). Section 3.1 introduces a mechanochemical model aiming to numerically investigate the lithiation onset of a-silicon. Section 3.2 presents the numerical results on the depth-resolved mechanical stress during the lithiation onset of a-silicon. The last section summarizes the findings of this work.

2. Literature Survey

2.1. Description of the Lithiation Onset of Amorphous Silicon

The lithiation onset of a-Si thin films (i.e., up to 10% SOC, and a gravimetric capacity of ~350 mA/g) is characterized by a predominant Li+ uptake, which takes place at a nearly constant potential of about 0.5 V in respect to lithium reference electrode [1], i.e., the flat plateau marked with roman number I in the potential profile of Figure 2. For information on the experimental procedure, see Figure A2 of Appendix A.1. The flat plateau I corresponds to a predominant Li+ uptake peak marked also with roman number I in the voltammograms (cyclic voltammetry, CV), and differential charge (dQ/dV plot) and capacity (dC/dV plot) curves presented in a recent letter [1]. The dC/dV curves are obtained by simply dividing the ordinate (dQ) of the dQ/dV plot by the electrode active mass, which is taken to be constant during cycling. Hence, the shape of dQ/dV curves is identical to that of dC/dV curves, and both are similar to voltammograms (for more details see references [1] and [2]). Most works in the literature usually attribute the lithiation onset to the formation of the SEI layer and to the reduction of native surface oxide [1].
The plateau I in Figure 2 was also observed for different liquid electrolytes (see reference [3]). It also appears when artificial solid-state SEI layers, i.e., a 60 nm thick oxide (Li3PO4) layer, are sputter-deposited on the top of a-Si thin layers [3]. The potential profiles presented by Wu et al. in reference [3] reveal, in addition to the flat plateau around 0.5 V, an additional flat plateau around 1 V. The latter is attributed to the formation of the SEI through the decomposition of carbonate-like solvents and lithium salts. The plateau around 1 V is rendered absent by capping the a-Si film electrode with an artificial SEI layer [3], but the plateau around 0.5 V remains present with a minor potential shift to approximatively 0.4 V. The origin of the plateau around 0.5 V (Figure 2) is not discussed in the work of Wu et al. [3]. In the communication of high-performance all-solid-state cells fabricated with silicon electrodes by Phan et al. [4], voltammograms are presented for the lithiation of sputter-deposited a-Si films of 400 nm in thickness, which were cycled with liquid electrolytes and, separately, with solid-state electrolytes. In both cases, i.e., for liquid and solid-state electrolytes, the lithiation onset is characterized by two predominant Li+ uptakes, a smaller one around 0.5 V and a sharper one around 0.3 V, the latter denoted with the roman number I in reference [4]. The latter is attributed to the reduction in silicon oxide existing at the interface between silicon and the solid-state electrolyte. The Li+ uptake positioned at 0.5 V is attributed to an irreversible reaction process independent of the nature of the substrate and electrolyte [4], pointing to an origin different from the formation of SEI layer.
Concerning the SEI formation, many reports find that it does not occur exclusively at the lithiation onset of silicon, but over the whole potential range, predominantly at lower potentials [5,6,7,8,9,10,11,12,13,14,15,16,17], where the carbonate-based electrolytes are unstable [20]. Investigations on the lithiation process of a-Si oxide films [21] and particles [22,23] have also found a predominant Li+ uptake peak at the lithiation onset similar to that for the lithiation of a-Si films (corresponding to the plateau I in Figure 2). For SixO electrodes, the lithiation onset is ascribed to the Li bonding on defects inside the SixO electrodes [21,22,23], such as reactive oxygen available for Li bonding. Recent experimental results indicate that the Li+ uptake in region I may also appear due to an intrinsic property of silicon lithiation [1], and it cannot be attributed to the SEI formation but to an in-depth lithiation of silicon [1,24]. Details on the lithiation onset of a-Si thin films are given in reference [1]. Briefly, the migration of Li in the silicon film experiences a two-phase lithiation process where a lithiated zone with a “constant” Li-concentration of x ~ 0.3 (Li-poor phase) is sharply delimited from non-lithiated silicon (see Figure 1e–g, and references [1,24]). The reaction front is planar and parallel to the film surface and propagates through the entire silicon film during the lithiation, as schematically shown in Figure 1 of this work.
The analysis of operando neutron reflectometry reveals that clean and well-ordered crystalline (100) oriented silicon wafers are initially also lithiated with the presence of a Li-poor region via a reaction front delimiting the Li-poor region from pure silicon [25]. This result indicates the appearance of the Li-poor silicide (Li0.3Si) as an intrinsic property during the lithiation onset of pure and “defect-free” silicon. However, Hüger et al. [1] demonstrate that the modification of Li+-uptake I, i.e., the appearance of the Li-poor phase, can be tailored by a change in the SEI layer and/or a change in the mechanical stress during the silicon lithiation. Cycling experiments with multiple pure silicon layers of each layer capped by a thin carbon layer are presented in the supplementary material of reference [1]. Two different Si/C multilayer (ML) electrodes were cycled with constant current. The liquid electrolyte was in direct contact with a silicon layer and a carbon layer for the first ML ([Si(14 nm)/C(16 nm)] × 10 ML) and the second ML [C(16 nm)/Si(14 nm)] × 10 ML, respectively. For both MLs, Li+ uptake I is not present [1], indicating that the appearance of Li+ uptake I can be tailored. The experiments reveal that the absence of Li+ uptake I is not dependent on the individual surface layer of the ML material (carbon or silicon) which is in direct contact with the electrolyte, but potentially on another factor. A possible difference of the mechanical stress inside the ML-film electrode in respect to that in single silicon-film electrodes may be responsible for the lack of the Li+ uptake I in the MLs [1]. Consequently, the aim of this work represents, besides the literature survey, the calculation of the lithiation-induced depth-resolved mechanical stress on the phase boundary between a growing Li0.3Si phase which consumes a clean and “defect-free” silicon film. Before doing so in Section 3, elaborations on the changes in the physical properties of silicon during the lithiation onset and on the reasons for the appearance of the phase front delimiting Li0.3Si from a-silicon are presented.

2.2. Changes in Physical Properties of Silicon during the Lithiation Onset

Reviewing the experiments performed during the lithiation onset of silicon, one finds that the predominant Li+ uptake I (which builds up the Li0.3Si phase) is connected with the appearance of peculiarities which are absent at other states of charge. They are (i) the build-up of the highest mechanical stress (up to 1.2 GPa) during silicon lithiation, (ii) a linear increase in the mechanical stress with lithiation which mimics the characteristics of linear elastic deformation, (iii) only a minute volume increase during Li incorporation which is lower than expected from the number of Li ions entering the silicon electrode, (iv) the largest heat generation appearing during cycling with only a minor degree of parasitic heat contribution, and (v) an unexpected enhanced brittleness.
Figure 3 presents the potential profile measured during the first lithiation process of an a-Si film of 230 nm thick (Figure 3a) in direct comparison with sketches of corresponding mechanical stress (Figure 3b) and volume change of silicon (film thickness) (Figure 3c) during the first lithiation process of a-Si thin films. Note that although Figure 3a represents experimental data collected by the authors of the present work, Figure 3b represents only an outline (sketch) of a typical mechanical stress curve during the lithiation of an a-Si film published in the literature, e.g., in reference [26] and reference [27]. Additionally, Figure 3c of this work represents only an outline of the volume change during lithiation as measured operando with neutron reflectometry (reference [28]) and microscopy (reference [29]).
The in situ measured mechanical stresses during lithiation of a-Si films with thicknesses of 50 nm [26,30], 100 nm [30,31], 150 nm [30], 200 nm [31], 250 nm [27,30,32], 300 nm [33] and 325 nm [34] reported in the literature all exhibit similar behavior during lithiation and de-lithiation. Note also that the electrochemical Li+ uptake and release is similar for different film thicknesses, suggesting the negligible effect of film thickness on the lithiation processes [1]. The substrate (current collector) confines the in-plane expansion and contraction of the active film during lithiation and delithiation, respectively. Consequently, lithiation-induced compressive stress appears and linearly increases up to ~1.2 GPa at ~10% SOC (x ~ 0.3 in LixSi) during lithiation (Figure 3b). The rapidly linear increase likely suggests a lack of plasticity during the initial lithiation process, corresponding to the predominant Li+ uptake I in Figure 2 and Figure 3a. Furthermore, the increase in the film volume (i.e., film thickness) during Li+ uptake I is much less than that predicted from the inserted amount of Li (Figure 3c). Beyond 10% SOC, the volume expansion of the silicon film caused by the lithiation is in consistence with the trend predicted theoretically with the increase in the inserted Li amount (Figure 3c), which involves plastic deformation (Figure 3b).
An unexpected result was also obtained in the measurement of heat flow during lithiation process I. Housel et al. [35] performed isothermal microcalorimetry to detect the heat flow generated during the lithiation and delithiation of a silicon electrode produced from crystalline silicon powder. The highest entropic heat flow (~50 mW/g) appeared for up to 10% SOC of the first cycle, which corresponds to lithiation process I in Figure 2 and Figure 3a. Beyond 10% SOC, the entropic heat flow decreased markedly [35]. The contribution of parasitic heat, which indicates SEI growth, was obtained from a comparison between the total heat flow and the sum of polarization heat flow and entropic heat flow [35]. Unexpectedly, during the first lithiation, the lowest dissipated heat flow associated with parasitic reactions appeared between 1% and 10% SOC, and, hence, in the region of lithiation process I.
Figure 3. (a) Potential profile during the initial lithiation of an a-Si thin film of 230 nm in direct comparison with outlines (sketches) of (b) a typical mechanical stress curve during the lithiation of an a-Si film, and of (c) the typical volume increase curve during the lithiation of an a-Si film. All the values are plotted versus state of charge (SOC). 100% SOC corresponds to Li3.75Si (x = 3.75). V0 represents the silicon film volume before lithiation. The dashed line represents the end of the predominant Li+ uptake marked with roman number I in Figure 2 and Figure 3a.
Batteries 09 00105 g003
For a-Si films, nanoindentation measurements [34] reveal the dependence of the fracture behavior on the Li concentration of lithiated silicon. During initial lithiation, the fracture toughness decreases first from unlithiated a-silicon to a minimum value for a lithiated SOC corresponding to Li0.31Si (~10% SOC). For a higher Li content, the fracture toughness becomes higher than that of pure silicon [34], which is as expected. Lithiated silicon has been found to exhibit tensile deformation in contrary to the brittle behaviour of pure silicon [34]. The increase in fracture toughness indicates a brittle-to-ductile transition in lithiated silicon with the increase in Li concentration, which is as expected. This behaviour is in line with an increase in ductility with the insertion of Li due to the introduction of a more metallic character of atomic bonding with increased Li concentration. The atomistic mechanism for the brittle-to-ductile transition in amorphous LixSi is thought to be the decrease in strong covalent Si bonds (Si–Si) and the concomitant increase in delocalized (metallic) Li bonds (Li-Si) [34,36], giving rise to an alteration in the dominant atomic-level processes of deformation and fracture with increasing Li concentration. Thus, the ductility should increase with the increase in Li incorporation into silicon, but this is not the case for Li concentrations of up to x ~ 0.31 [34]. The Li insertion firstly decreases the fracture toughness up to x ~ 0.31, indicating lithiation-induced embrittlement [34]. There is an unexpected embrittlement increase for Li insertion up to x ~ 0.31, which corresponds to Li+ uptake process I. This means an increase in atomic bonds and in the cohesive strength during lithiation process I. This is in line with the measurement of only a minute volume change in contrast to that expected from the amount of Li inserted for SOC up to 10% (Figure 3c). The smaller volume increase may result in a higher atomic density in amorphous Li0.3Si in respect to pure a-silicon, which is indicative of stronger cohesive strength in Li0.3Si than in pure silicon.

2.3. Reasons for the Appearance of the Phase Front Delimiting Li0.3Si from a-Silicon

The following elaboration gives some explanations as to (i) why the lithiation onset of silicon involves a phase front which delimits the Li-poor phase from unreacted silicon, and (ii) why the Li-poor phase possesses the particular Li concentration corresponding to x ~ 0.3 in LixSi.
The appearance of the Li-poor silicide (Li0.3Si) as an intrinsic property during the lithiation onset of pure and “defect-free” silicon is unexpected, since no stable LixSi silicide phases appear for x < 1 at ambient pressure in the Li-Si phase diagram [37,38,39,40,41,42]. The first principle calculation predicts that mechanical pressure above 8 GPa [41] is necessary for the Li-poor silicide with x ~ 0.3 (LiSi3) to become stable. Such a high mechanical pressure has not been measured during the lithiation of a-Si thin films [26,27,30,31,32,33,34]. The mechanical pressure needed to produce the energy barriers around the x ~ 0.3 phase in order to change its instability into metastability is probably lower for an amorphous network. Nanometric zones of crystalline LiSi3 with dimensions below 2 nm and without a long-range order may also appear, mimicking an amorphous network, and may need a lower mechanical pressure for the occurrence of the LiSi3 phase compared to bulk crystalline LiSi3. It should be noted that the first principle calculation was performed at 0 K and that the energy barrier (mechanical pressure) for the presence of the stable Li-poor silicide is probably less than 8 GPa at a higher temperature (room temperature).
The analysis of the experimental data in reference [1] shows that the Li-poor phase, which builds up during the Li+ uptake I, is not formed from an invariant reaction because it does not always occur at the same potential [1]. This might hint at a metastable reaction that is irreversible upon the first cycle [1]. A metastable state points to the existence of energy barriers between the metastable state and the global minimum of energy. Even if the metastable state appears and is stable at room temperature, temperatures higher than room temperature often cause the transition of the metastable phase into a phase of a lower energy minimum, or it is not even developed at that temperature. Consequently, it is obvious that the amorphous and metastable Li-poor phase formed at room temperature during the Li+ uptake I is not found in the Li-Si phase diagram [37,38,39,40,41,42].
The presence of a reaction front associated with the Li-poor phase at the lithiation onset of silicon (Figure 1e–g) is likely attributed to the coupling between lithiation-induced stress (chemical stress) and lithium diffusion. The lithium diffusion is controlled simply by the gradient of Li concentration if no stress gradient is present. Under the action of stress, the driving force for the lithium diffusion is the gradient of chemical potential, which consists of the contributions of the gradient of Li concentration and the stress gradient [43]. The compositional change in a silicon electrode (the formation of an intermetallic compound) corresponding to Li+ uptake I under a stress is calculated to be more than the Li concentration in the silicon electrode at an SOC of 10% (x ~ 0.3 in LixSi), i.e., it amounts to Δx ~ −0.5 as obtained from the curve for stress-induced composition changes in silicon films presented in reference [26]. This suggests that the stress gradient produced in Li+ uptake I hinders Li migration into silicon. That is to say, the chemical stress introduced by the lithium diffusion has the tendency to reject a significant amount of lithium (Δx ~ −0.5) from the silicon electrode as it would be maximal at Li+ uptake I (x ~ 0.3). This process should continue for lithiation up to x ~ 0.5. Therefore, there are two opposite processes involving the lithiation onset of a silicon electrode—one is the electrochemical lithiation under the gradient of Li concentration, which drives lithium through the Li-poor phase and into the un-lithiated silicon to produce a LixSi phase, and the other is a stress-limited process with the chemical stress trying to hold the silicon electrode free of lithium during the lithiation. The interaction between these two processes may lead to a two-phase lithiation mechanism with the formation of a sharp interface (reaction front) delimiting non-lithiated silicon from lithiated silicon with x < 0.5 as depicted in Figure 1e–g.
From experimental results obtained in Li isotope exchange experiments and secondary ion mass spectrometry (SIMS) depth profiling [44,45,46], one can estimate the Li flux (Li permeability) at room temperature through sputter-deposited a-Si thin films (e.g., Table 2 in reference [45]). The Li flux (Li permeability) in a-Si thin layers of ~100 nm is estimated to be ~10−38 m2s−1, which is 17 orders of magnitude lower than ~10−21 m2s−1 in the amorphous Li0.3Si phase, using the kinetical data given in references [44,45,46] to determine Li permeability. This means that the high Li flux through the Li-poor phase toward un-lithiated silicon does not permeate inside the un-lithiated silicon, but actually stops at the interface between the Li-poor phase and the un-lithiated silicon. At that interface, silicon is converted into the Li-poor phase, as schematically shown in Figure 1e–g. Further discussion on Li diffusivity and Li solubility at room temperature in un-lithiated a-silicon and in the Li0.3Si phase is given in the next section. However, the question still remains open as to why the Li poor phase possesses the particular Li content of x ~ 0.3.
First principle calculations found that the formation energy of LixSi phases becomes negative only for x ≥ 0.3 [47,48]. This means that the formation of a LixSi phase is energetically favorable only for x ≥ 0.3. Thus, firstly, the total energy calculation predicts that pure silicon does not allow Li with a concentration of x < 0.3 to be incorporated into silicon above its extremely low Li solubility limit [45]. Consequently, the lithiation of silicon starts by the formation of Li0.3Si. Secondly, as mentioned above, stresses due to lithiation have the tendency to repel Li atoms from silicon for x < 0.5. Finally, the Li permeation (Li flux) in the Li0.3Si phase is, as stated above, 17 orders of magnitude higher than that in pure silicon. Thus, there are three factors—(i) extremely low Li permeability in pure silicon and relative high Li permeability in Li0.3Si phase, (ii) Li repulsion from pure silicon due to mechanical stress, and (iii) energy gain by the formation of LixSi only for x ≥ 0.3—which likely contribute to why initially a two-phase lithiation mechanism appears which sharply delimits pure silicon from a LixSi phase of x ~ 0.3 (Figure 1e–g). In order to investigate the peculiar lithiation onset of a-Si films, we present and apply in this work a mechanochemical model to analyze the stress evolution during the lithiation onset of an a-Si film for a planar phase-front mechanism (Figure 4) by modelling the interaction between diffusion and stress in the lithiation onset of Si-based electrodes.

3. Numerical Investigation

A mechanochemical model is introduced in this work and used to analyze the stress evolution during the lithiation onset of an a-Si film. Numerical simulation was performed by taking into consideration the experimental results of (i) the phase-front lithiation mechanism of a Li-poor phase consuming unreacted silicon, and (ii) a Li-poor phase with a Li concentration corresponding to x ~ 0.3 in LixSi. The appearance of the planar phase-front lithiation mechanism, and the Li concentration of the Li-poor phase, are not a result of the simulation, but instead represent the ingredients of the simulation.
There are studies on the stress analysis of the lithiation of silicon, e.g., references [34,49,50], but none of them have focused on the subject presented in this work, i.e., the phase front mechanism appearing in the lithiation plateau I in Figure 2. Currently, most modeling analyses have been based on the concept of diffusion-induced stress (with and without the contribution of stress-limited diffusion) and the concentration dependence of mechanical properties in the framework of elasticity [51,52,53], elastoplasticity [54,55] or viscoplasticity [56,57,58]. To address the lithiation of electrode materials with the possible presence of the reaction front, phase-field models have also been developed to study stress evolution in electrode materials during electrochemical cycling [59,60]. It should be noted that there are few works addressing the formation of new compounds in the analysis [61,62,63], even though Yang [64] had formulated the formulas with the contributions of chemical reactions to the mass transport and the stress evolution.

3.1. Mechanochemical Model

The analysis in this work focuses on the stress evolution and the motion of the reaction front for the growth of the Li-poor phase in an a-Si film, which is based on the theory of linear elasticity and the coupling between diffusion and stress [43]. A moving boundary condition is used to describe the propagation of the reaction front. The temporal evolution of the stresses is illustrated, and a comparison between the numerical results and those reported in the literature is performed.
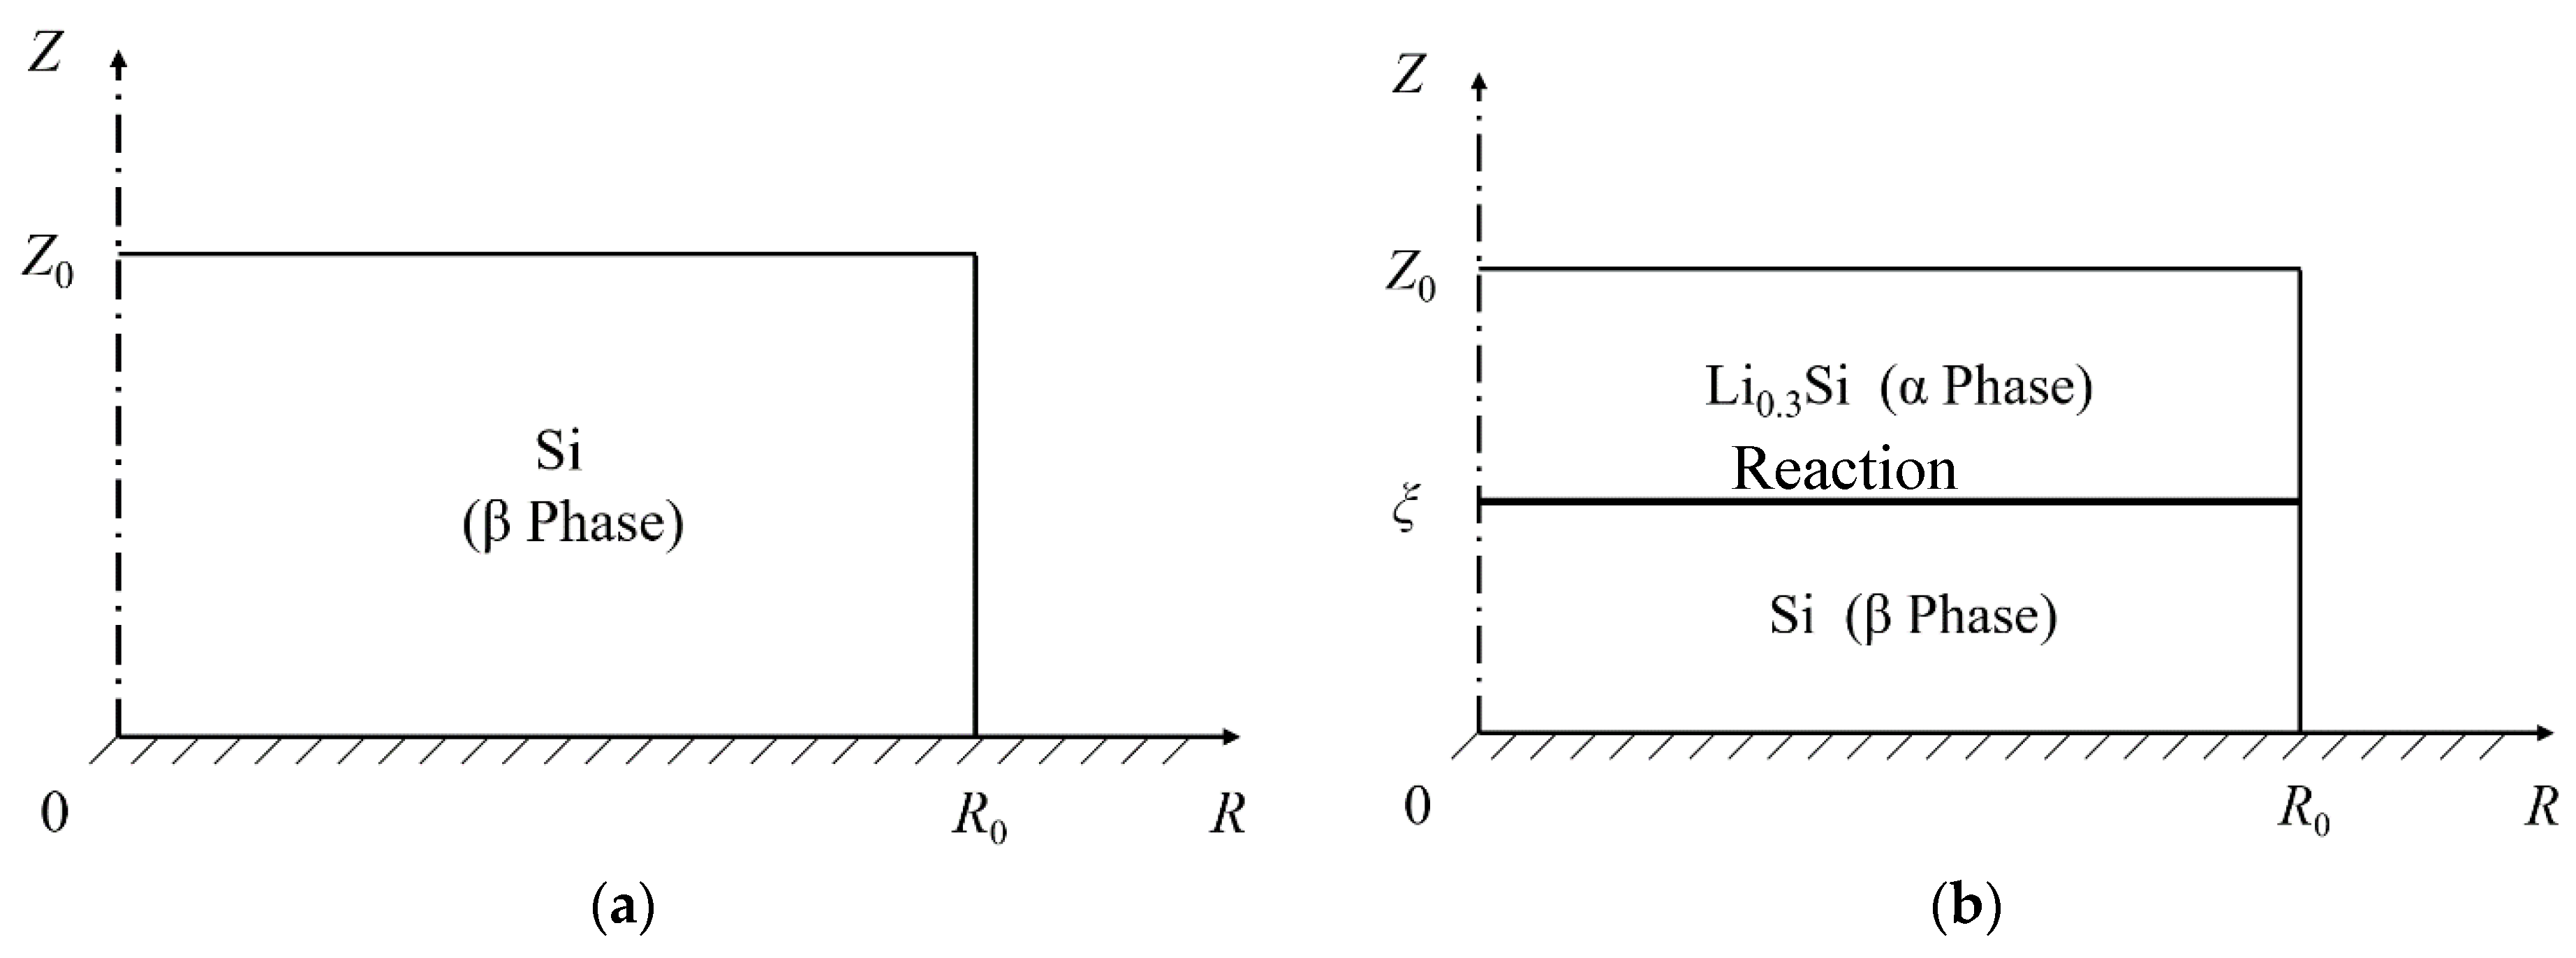
According to the lithiation experiment (i.e., Figure 2), we consider a silicon disk of 200 nm in thickness and 2000 nm in radius instead of ~1 cm used in experiments by Hüger et al. [1,65] Note that the results obtained with the radius of 2000 nm are the same as those with the radius of ~1 cm for the region far away from the disk edge (see Figure A1 in Figure A2 of Appendix A.2 for more detail). A cylindrical coordinate system, (R, Θ, Z), shown in Figure 4, is used, and the constitutive equations of the disk are [66]
σ = ν E ( 1 + ν ) ( 1 2 ν ) [ T r ( ε ) Ω C ] I + E 1 + ν ( ε 1 3 Ω C I )
where σ, ε and I are the stress, strain and unit tensors, respectively, Ω is the partial molar volume, C is the Li-concentration, and E and ν are Young’s modulus and Poisson’s ratio of silicon, respectively. The normal strain components and stress components are εi and σi (i = R, Θ, Z), respectively. Note that the contribution of surface elasticity [67] is not considered in this model since the analysis is focused on the planar surface and interface.
With axisymmetric characteristics, the strain components are calculated from nonzero radial and axial displacements, (u, w), as
ε R = u R ,   ε Θ = u R ,   ε Z = w Z ,   ε Z R = 1 2 u Z + w R .
The equilibrium equations without body force are
σ R R + τ Z R Z + σ R σ Θ R = 0 σ Z Z + τ R Z R + τ Z R R = 0 .
The boundary conditions are
σ R R = R 0 = 0 ,   σ Z Z = Z 0 = 0 ,   τ R Z Z = Z 0 = 0 ,   u Z = 0 = 0   and   u R = 0 = 0 .
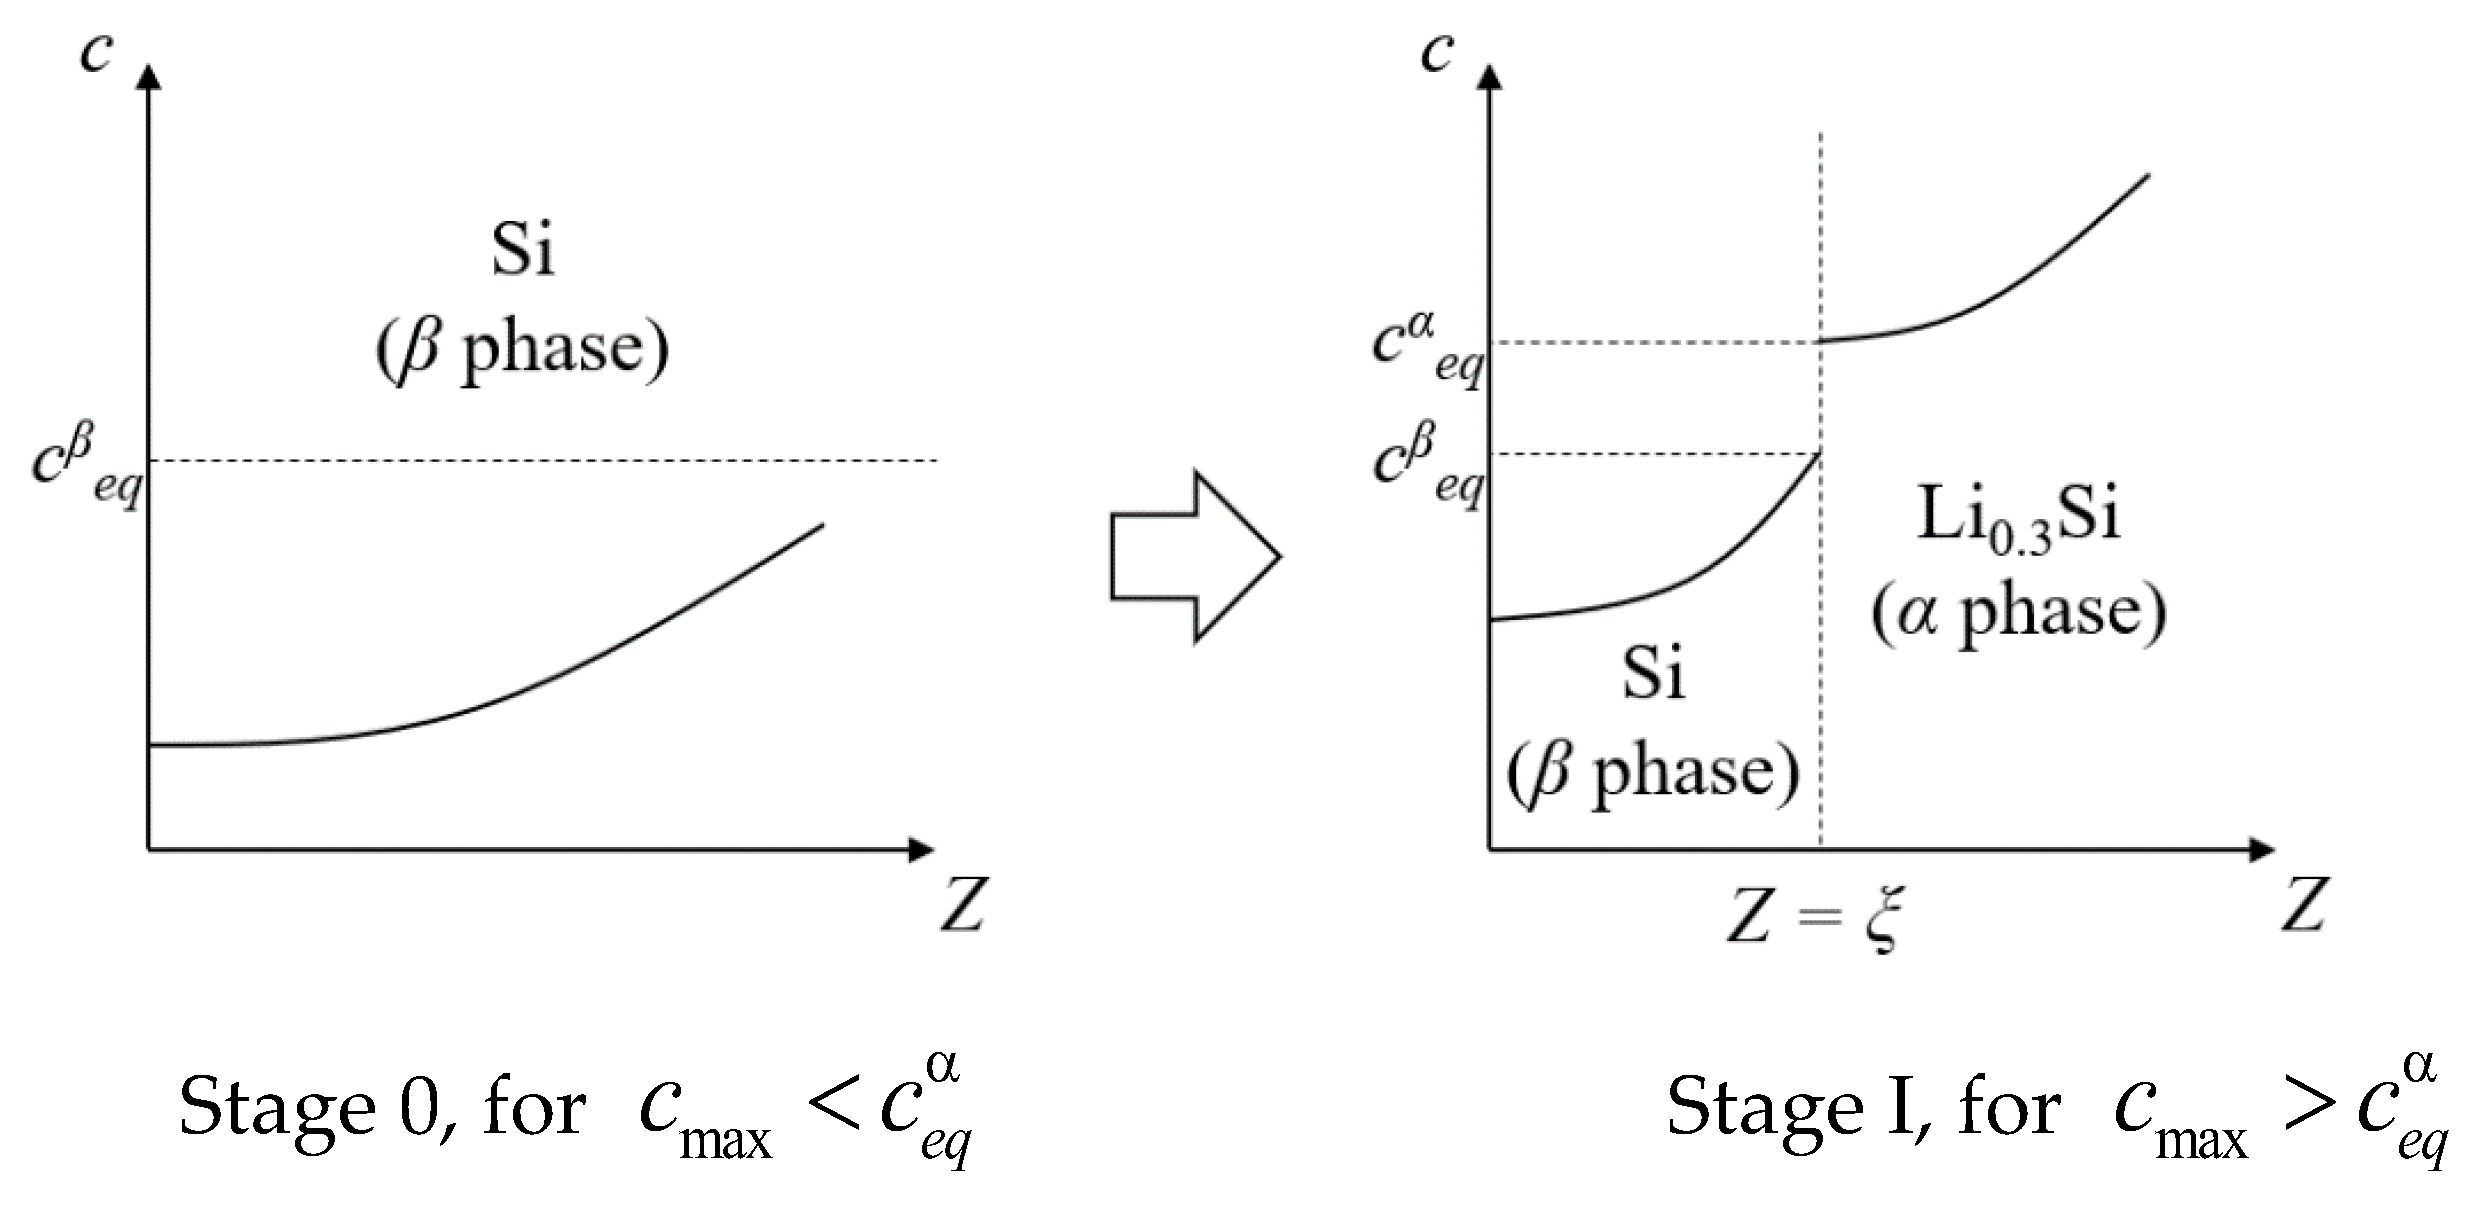
For the diffusion of lithium into the Si thin film involving the formation of a Li0.3Si phase, we divide the diffusion process into two stages, as shown in Figure 5: stage 0 is the diffusion of lithium in a single-phase system before the lithium concentration reaches the critical value for the formation of a new phase, and stage I is the diffusion of lithium in a bi-phase system with the new phase.
At the onset of the lithiation, there is only β phase (Si). Increasing the lithiation time leads to the diffusion of lithium into the Si thin film and to the increase in Li concentration. When the Li concentration at the surface of the Si thin film reaches the equilibrium concentration, cαeq, for the formation of α phase (Li0.3Si), the α phase is formed and stage I starts. In stage I, there are two phases of α and β, which are separated by an interface, ξ (Figure 5b). The Li concentrations in each phase at the interface are cαeq and cβeq, respectively. The interface moves towards the surface of the rigid substrate (current collector, at Z = 0) and causes the change in lithium concentration from cβeq to cαeq.
For the diffusion of Li, the diffusional flux, J, is calculated as
J = M C max c   grad μ   and   μ = μ 0 + R T ln c σ h Ω ,
with M (=D/RgT) as the mobility, c (=C/Cmax) as the normalized concentration, Cmax as the maximum stoichiometric concentration of Li, μ as the chemical potential of Li, D as the diffusion coefficient, Rg as the gas constant, T as the absolute temperature, and σh (=[σR + σΘ + σZ]/3) as hydrostatic stress. The diffusion equation is
c α t Z D α c α Z Ω c α R g T σ h Z = 0 , Z ( ξ , Z 0 ] c β t Z D β c β Z Ω c β R g T σ h Z = 0 , Z [ 0 , ξ ) ,
where the superscripts of α and β represent the corresponding parameters in the α and β phases, respectively. Note that we consider the dependence of Li concentration only on variable Z for the disk thickness much less than the disk radius.
At stage 0, lithium diffuses into the thin film from the surface of Z = Z0, as shown in Figure 2a. The initially un-lithiated film gives
c β R , Z t = 0 = 0 .
The galvanostatic operation of the film [66] follows
D β c β Z Ω c β R g T σ h Z Z = Z 0 = J 0 ,
and the impermeable condition of the substrate yields
c β Z Ω c β R g T σ h Z Z = 0 = 0 .
At stage I, the phase formation occurs after the maximum normalized concentration reaches the critical value. A phase interface of ξ is formed, delimiting the Si thin film into Li0.3Si alloy (α phase) and Si-solution (β phase), as shown in Figure 4b and Figure 5b. A continuous influx of Li causes the motion of ξ from Z = Z0 to Z = 0. The Li concentrations on the either side of the interface are
c α Z = ξ + = c e q α , c β Z = ξ = c e q β .
The moving speed of the interface is determined by the following equation
( c e q α c e q β ) d ξ d t = D α c α Z Ω c α R g T σ h Z D β c β Z Ω c β R g T σ h Z .
The boundary condition at the surface of the thin film is
D α c α Z Ω c α R g T σ h Z Z = Z 0 = J 0 .
The boundary condition at the bottom of the thin film is the same as Equation (9).
The numerical method was used to solve the coupled equations given above via the partial differential equation (PDE) module of COMSOL Multiphysics. There are 1000 nodes along the Z direction and 5000 nodes along the R direction for the finite element model.
Consider the presence of the Li0.3Si phase as the phase formation introduced by Li diffusion. The normalized equilibrium concentration for the Li0.3Si phase is determined as the ratio of the Li fraction in the compound to the maximum Li fraction in Si as
c ^ e q α = c ^ L i 0.3 S i c ^ L i 3.75 S i = 0.3 3.75 = 0.08 .
The equilibrium concentration of lithium for the un-lithiated phase should be equal to the Li solubility limit of the a-Si film. Li solubility in silicon is very low (see reference [45]). Consequently, it was possible to measure Li solubility only at temperatures where the solubility attains higher values than at room temperature. The Li solubility of ~100 nm a-Si thin film sputter-deposited within the same laboratory, and using the same ion beam coater as in the present work, was experimentally determined from SIMS depth profiling for samples annealed at temperatures in between 513 K and 773 K [45]. At the lowest temperature, i.e., at 513 K, Li solubility amounts to about one Li atom per 105 silicon atoms, (directly notified as 10−5). The experimentally determined temperature dependence of Li solubility follows an Arrhenius law [45]. The extrapolation of the Li solubility to room temperature gives a Li solubility of ~10−9 (Li atoms per Si atoms, [46]). Hence, experimental results reveal that the equilibrium concentration for the un-lithiated phase should be equal to ~10−9, and in that manner the equilibrium concentration for the un-lithiated phase can be assumed to be zero.
The Li diffusivity of a-silicon is actually unknown. The newest experiments to electrochemically measure Li diffusivity at room temperature by GITT (Galvanostatic Intermittent Titration Technique) [68] reveal the Li chemical diffusivity as well as the Li tracer diffusivity at the onset of the lithiation process to be almost independent of Li concentration in LixSi for x < 0.35. This is consistent with the fact that a phase (i.e., the Li-poor phase) with a constant Li concentration of x ~ 0.3 grows into the a-Si film electrode (references [1,24,68]). The Li tracer diffusivity was measured by GITT to be around 10−20 m2·s−1 [68]. Tracer diffusivities at temperatures in between 573 K and 773 K were measured by SIMS in a Li0.25Si alloy produced by co-sputtering of lithium-metal and silicon-wafer sputter-targets (reference [46]). The Li diffusivity obtained by extrapolation to room temperature is of about 10–20 m2s−1 for the composition of Li0.25Si, in accord with the Li tracer diffusivities obtained by GITT [68]. Consequently, the Li diffusion coefficient in the α phase (i.e., Li0.3Si) was taken in the present model to be 1.5 × 10⁻²⁰ m2·s−1. Non-electrochemical-based experiments performed at elevated temperatures up to 773 K (reference [45]) indicate that the Li tracer diffusion coefficient in ~100 nm a-Si thin films extrapolated to room temperature attains an inexplicable 10 orders of magnitude lower diffusivity, ~10−30 m2·s−1 if the Li diffusivity was estimated from Li permeability values, or ~ 10−29 m2·s−1 if the Li diffusivity was determined by the lag-time method (reference [45]). This is in accordance with the value of about 10–29 m2·s−1 extrapolated to room temperature from tracer diffusivities (determined from SIMS experiments) at higher temperatures measured by Strauß et al. [46] for the alloy of Li0.02Si which represents almost pure silicon. The estimated Li diffusivity of only ~10−30 m2·s−1 at room temperature in un-lithiated silicon is inexplicably low, and in the opinion of the authors it may be unrealistically low. It may be possible that the correlation between diffusivity and temperature changes at low temperatures down to room temperature, due to a possible change in Li diffusion and solubility mechanism at low temperatures. Consequently, we consider in the present model a higher Li diffusion coefficient in the β phase, i.e., that of the α phase (1.5 × 10⁻²⁰ m2·s−1). The effects of the difference of Li diffusivities between the α phase (Li0.3Si) and β phase (a-Si) on the spatial evolution of the interface position are analyzed in Figure A2 of Appendix A.2.
Consider that the silicon thin film is lithiated under a total C-rate of C/14. The corresponding Li influx at the surface is
J 0 = Volume · C - rate Surface   area · 3600 = Z 0 / 14 3600 = 3.97 × 10 12   mol · m 2 · s 1 .
The film thickness, Z0, is 200 × 10−9 m. Finally, Table 1 lists the parameters used in the numerical calculation.

3.2. Numerical Results and Discussion

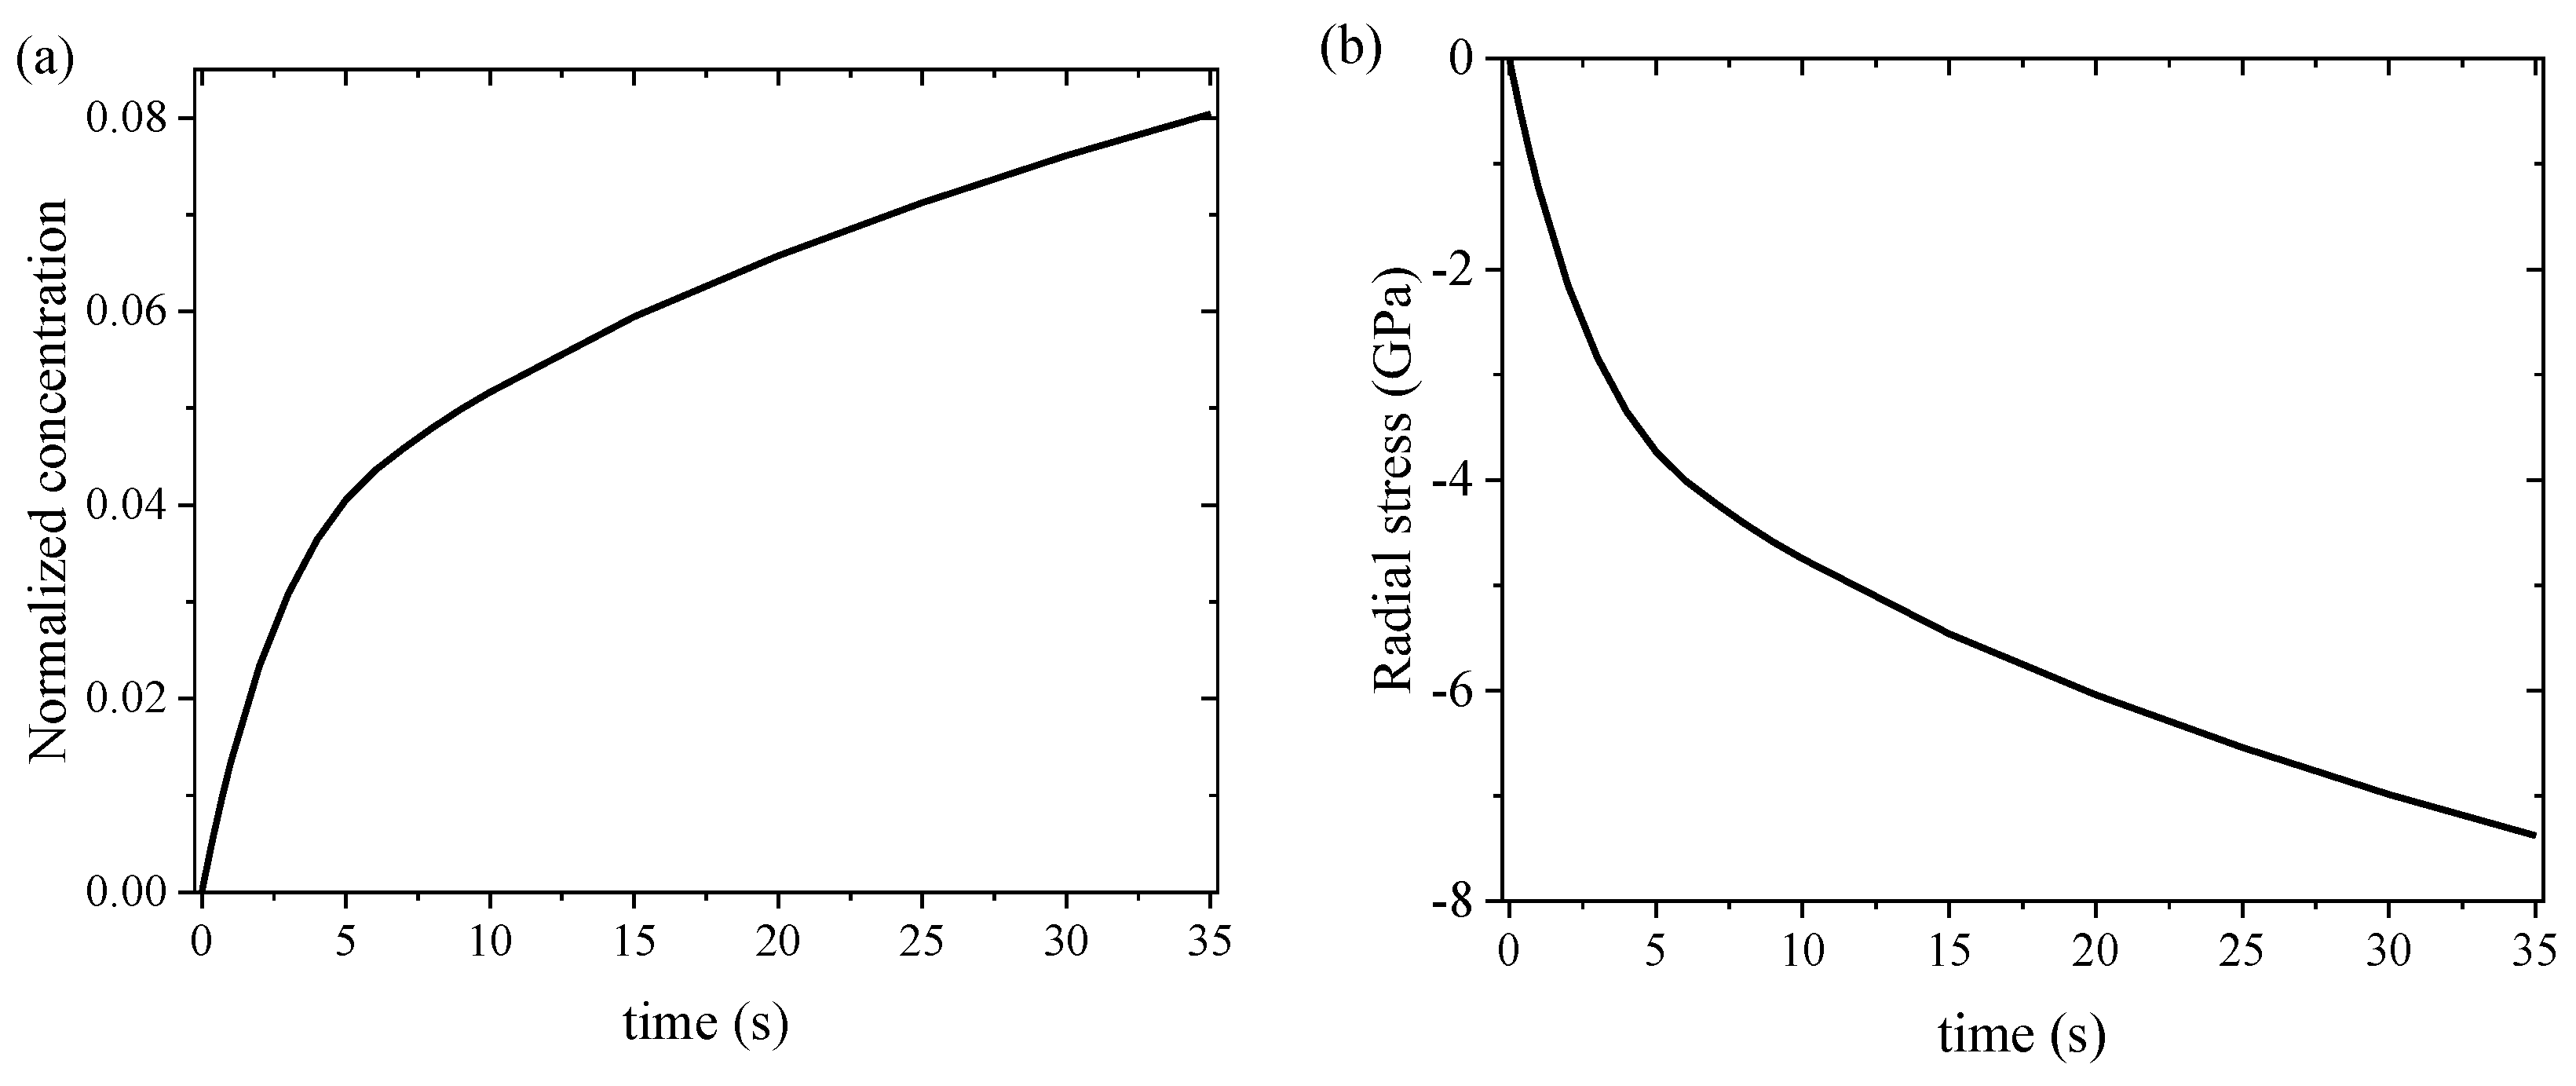
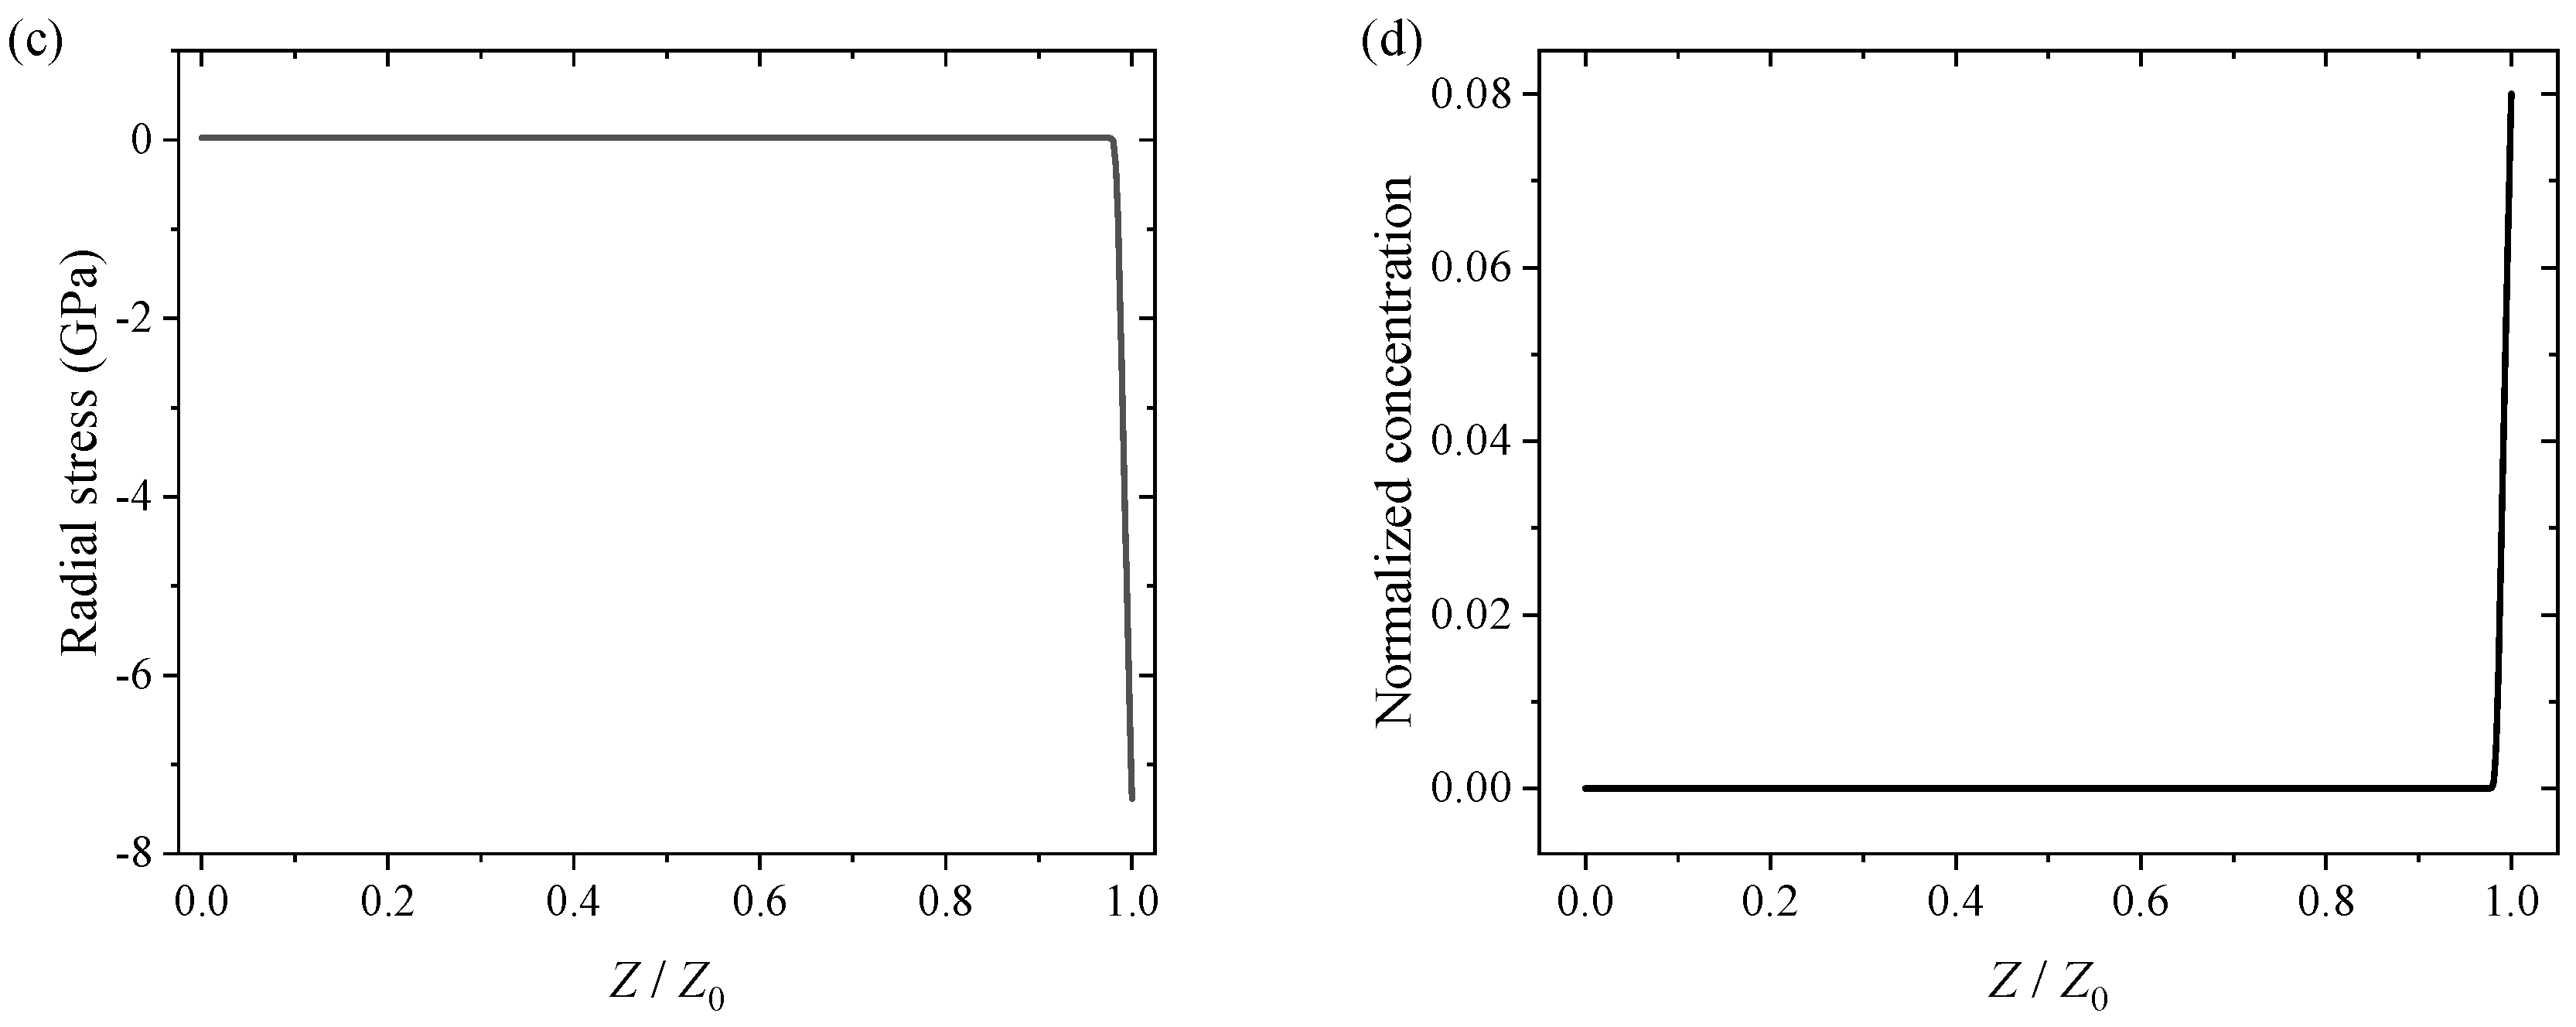
Figure 6 shows temporal evolution of the normalized concentration and radial stress at the center of the free surface. The Li concentration at the surface of the Si thin film increases with the increase in diffusion time (Figure 6a), revealing more lithium in the Si film with increasing the diffusion time. It takes only ~35 s for the Li concentration at the surface of the Si film to reach the equilibrium concentration of c ^ e q α = 0.08. This result suggests that stage 0 ends at ~35 s with the onset of stage I. However, the radial stress near the surface is compressive, and the magnitude of the radial stress increases sharply during this short time from 0 to about 7.4 GPa (corresponding to a hydrostatic stress of −4.7 GPa and a shear stress of 3.7 GPa) (Figure 6b), slightly less than the theoretically predicted 8 GPa for the stabilization of Li-poor silicide with x ~ 0.3 [41]. The latter, i.e., the 8 GPa threshold to initiate the formation of the Li-poor phase, may be, as previously mentioned, lower in amorphous silicon and at a finite (room) temperature. This result indirectly confirms the stress-induced phase formation of Li0.3Si at the end of stage 0. Note that the large radial stress is only present around the top surface of the Si film, and most of the Si film remains in a nearly stress-free state, as revealed by the spatial distributions of the radial stress and the Li concentration in Figure 6c,d, respectively.
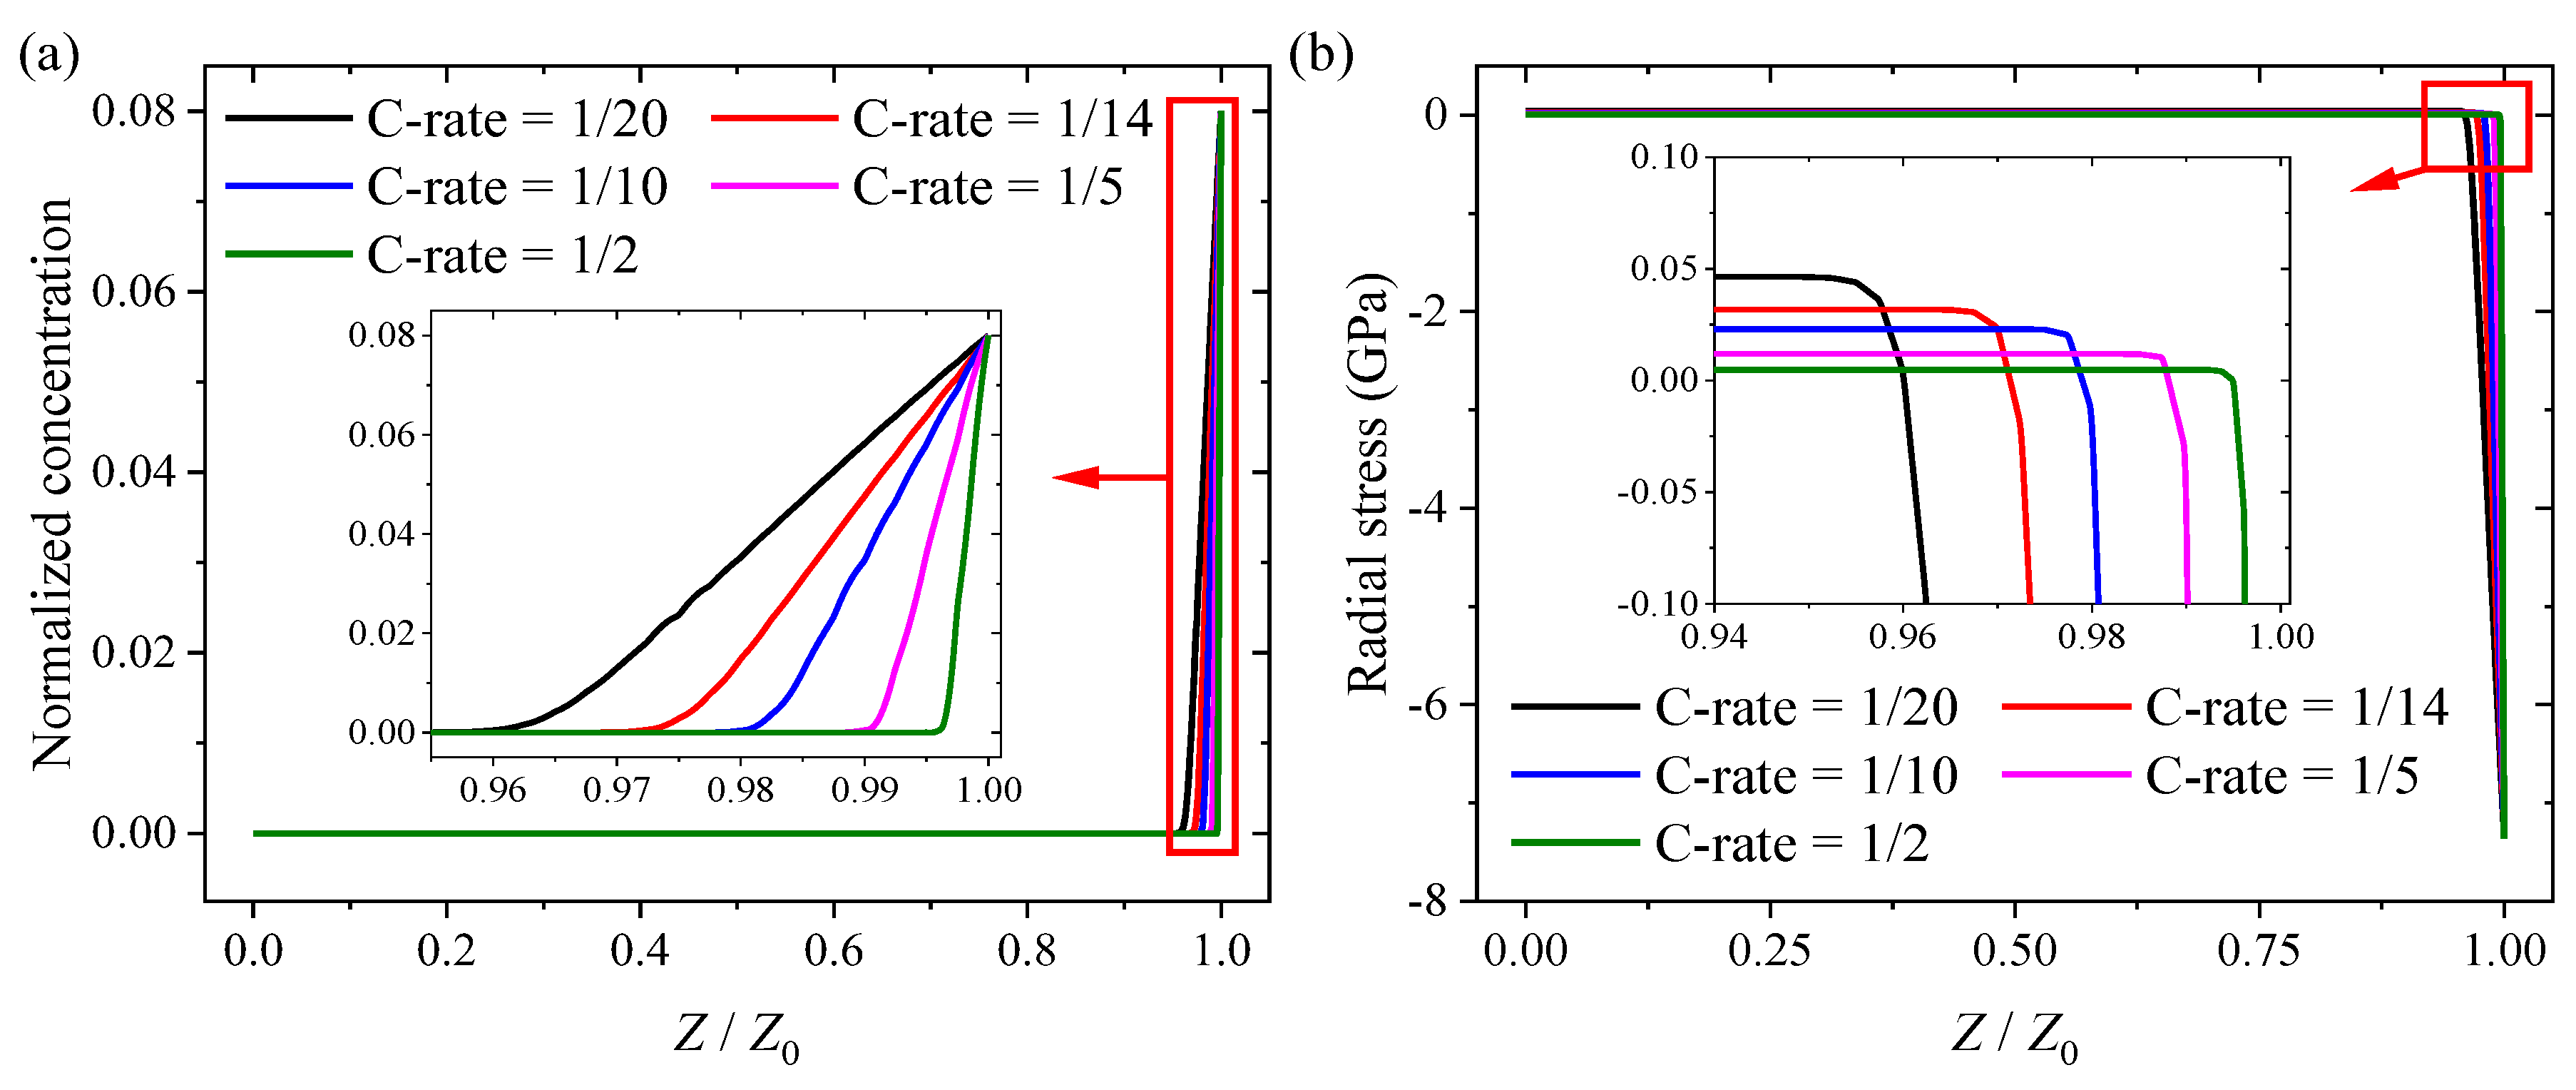
Figure 7 depicts spatial variations in normalized concentration and radial stress along the axisymmetric axis under different total C-rates at the end of stage 0. A large amount of Li accumulates near the top surface of the thin film (Figure 7a). The larger the C-rate, the sharper the drop in Li-concentration and the narrower the diffusion zone, as expected. According to Figure 7b, the larger the C-rate, the narrower the compressive-stress zone at the surface. Note that the un-lithiated Si experiences tensile stress, whose magnitude increases with the decrease in the C-rate at the end of stage 0. Moreover, the magnitude of the radial stress at the surface of the a-Si film (Z/Z0 = 1) is about 7.4 GPa at the end of stage 0, independent of the total C-rate used for the lithiation.
It should be pointed out that such a high stress can cause the separation of the Si film from the substrate, wrinkling, surface cracks or phase formation to relieve the stress. Note that the local stress near the free surface can hardly be measured with the commonly used techniques, such as MOS (multibeam optical sensor), since the MOS system records the curvature of the film, while the local stress in such a narrow region rarely affects the curvature. An ocular inspection of silicon film electrodes lithiated at different states up to the end of stage I, and disassembled from the electrochemical cell inside a glovebox filled with protective argon gas overpressure, revealed a smooth surface without wrinkling and cracks. The smoothness of the lithiated Si-film electrode surface remains intact after being washed with propylene carbonate, isopropanol and even acetonitrile. This ocular observation was affirmed by light microscopy performed in the high-vacuum of a secondary ion mass spectroscopy (SIMS) device. Interestingly, the electrode surface remains smooth after the electrode has been stored over a long time (months) inside vacuum or protective argon gas. This experimental observation suggests that phase formation up to the end of lithiation process I does not cause structural damage and is likely responsible for the stress relief.
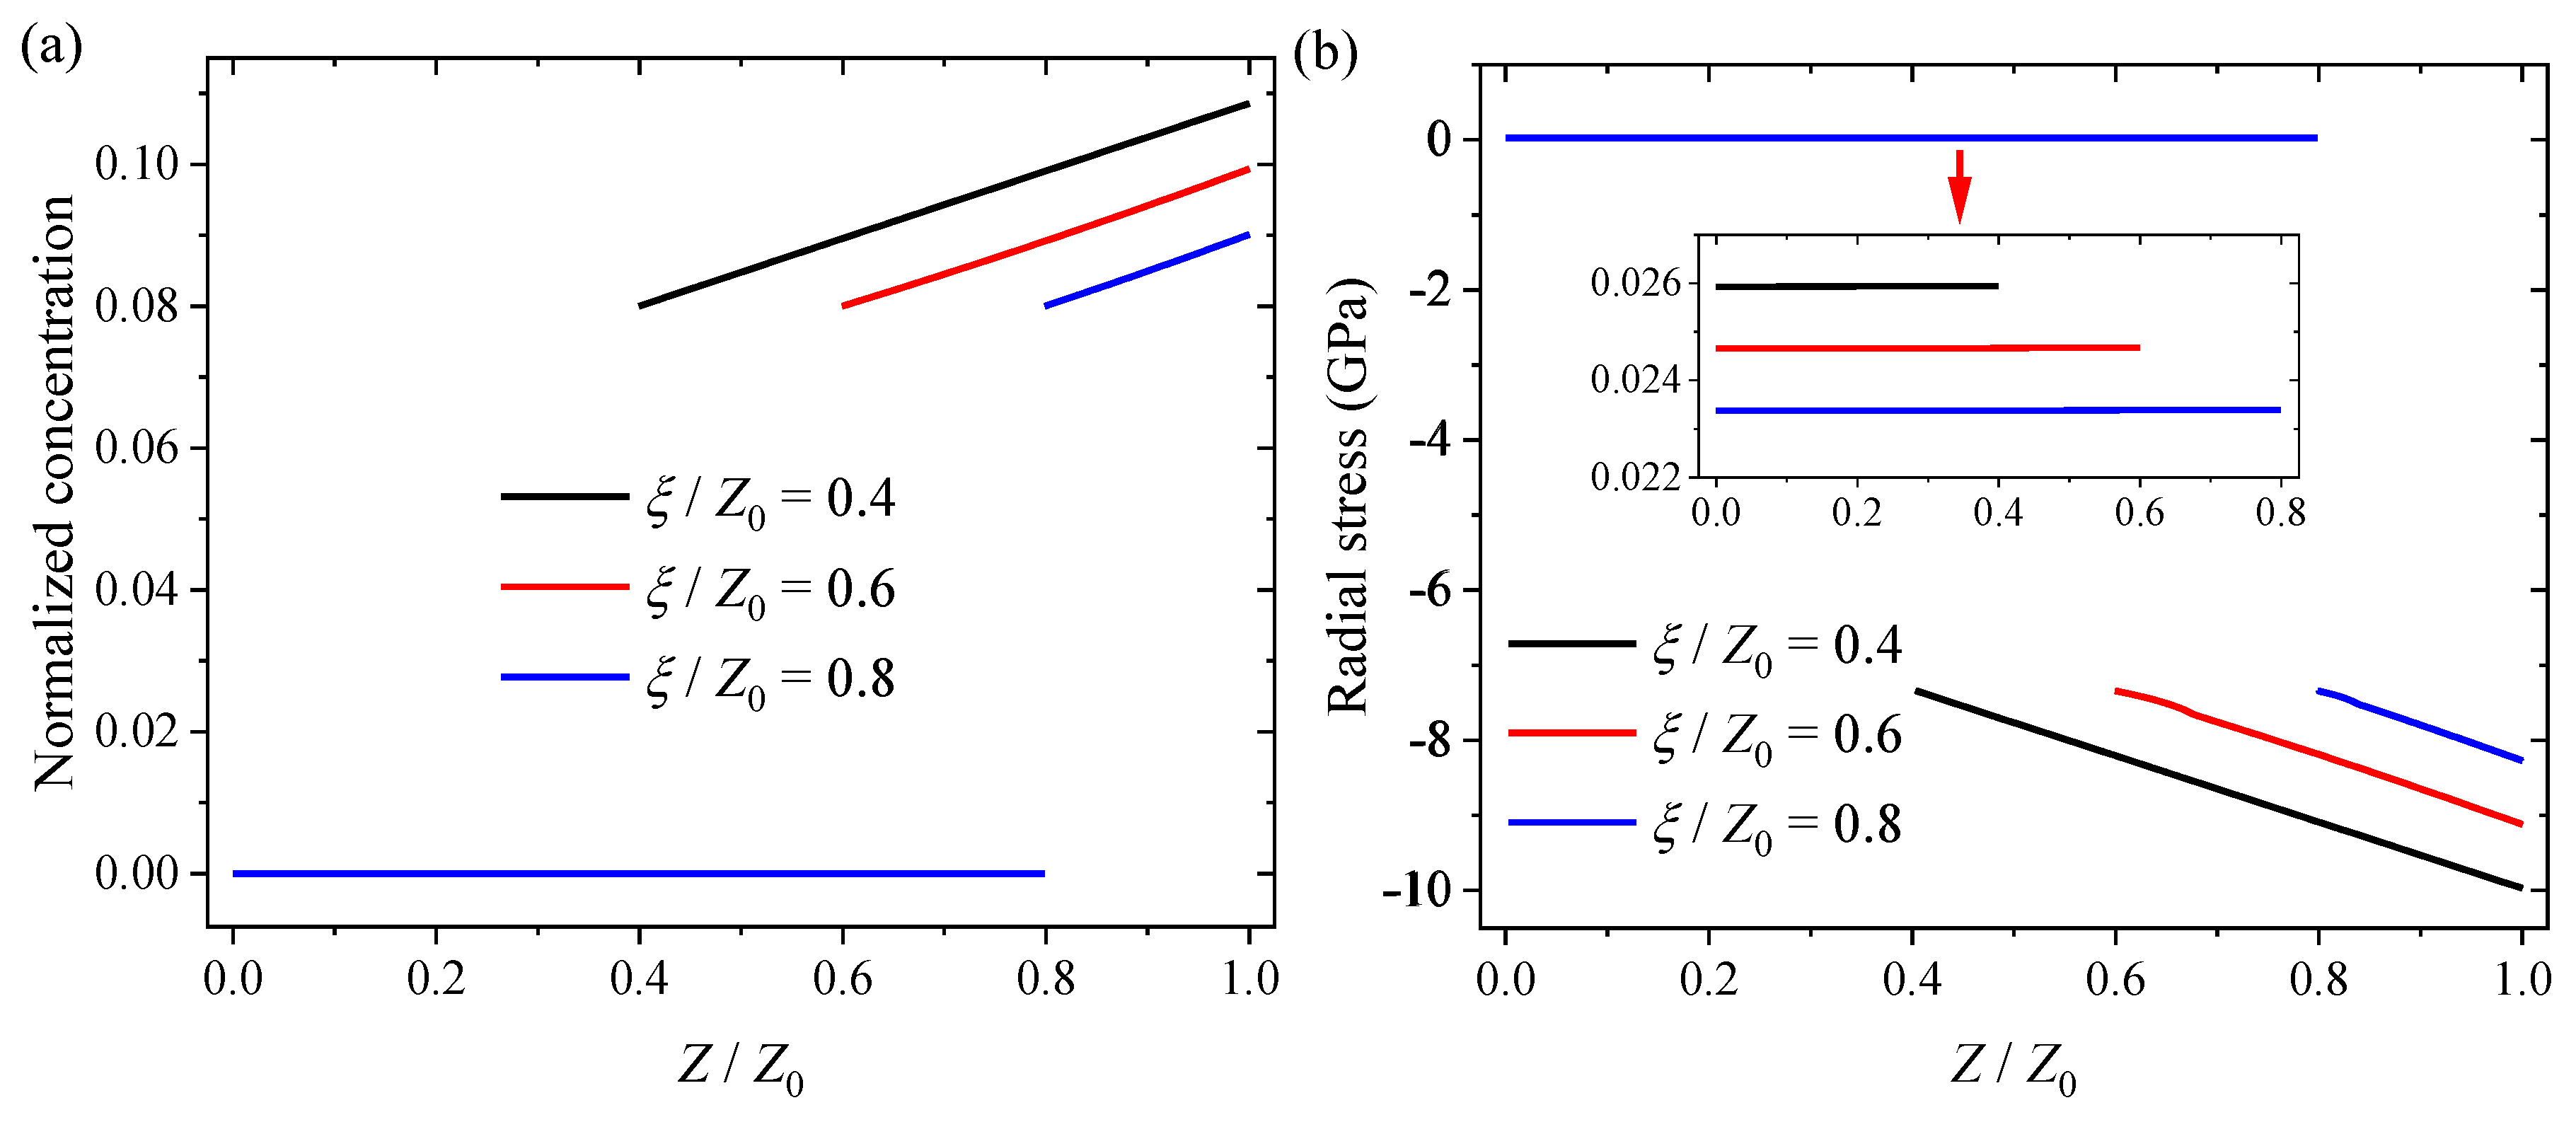
Figure 8 displays spatial variations in the normalized concentration and radial stress along the thickness at the axisymmetric axis for different positions of the interface at stage I for a total C-rate of 1/14 C, in which the strain energy generated in stage 0 is used for the formation of the Li0.3Si phase. It is evident that there are two distinct regions in the Si thin film—one with a Li-poor phase and the other with un-lithiated Si. The Li concentration in the Li-poor phase increases as the interface approaches the substrate (Figure 8a), as expected from the diffusion theory. More lithium atoms are needed to form the Li0.3Si phase, which requires Li diffusion through the formed Li0.3Si layer. It should be noted that the spatial distribution of Li concentration in the Li-poor layer is different from the constant normalized Li concentration of 0.08 experimentally observed by Hüger et al. [1,65], suggesting that there are other factors likely controlling the migration of Li in the Li-poor layer. On the other hand, the constant normalized Li-concentration of 0.08 over the whole film depth was reported from SIMS depth profiling measurements [1,24,65]. However, the sputtering process affiliated with the SIMS measurements may mask a possible low gradient in Li concentration with a decrease in Li concentration from the electrode surface toward the Li0.3Si/Si phase front. Note that such a decrease in Li concentration may be expected to be necessary for Li diffusion from the electrode surface toward the Li0.3Si/Si phase front.
According to Figure 8b, the Li0.3Si layer experiences compressive stress and the un-lithiated Si layer experiences tensile stress. The magnitude of the compressive stress is much larger than that of the tensile stress.
As pointed out above, the strain energy generated in stage 0 is likely relaxed through the formation of the Li0.3Si phase, i.e., there are likely no residual stresses at the onset of stage I. Thus, we can assume that the Si thin film is at a stress-free state at the onset of stage I and the strain energy associated with the radial stress of −7.4 GPa during the lithiation is used for the formation of the Li0.3Si phase. The following analysis is based on the stress-free state of the Si thin film at the onset of stage I and the relaxation of the stresses corresponding to the radial stress of −7.4 GPa due to the formation of the Li0.3Si phase.
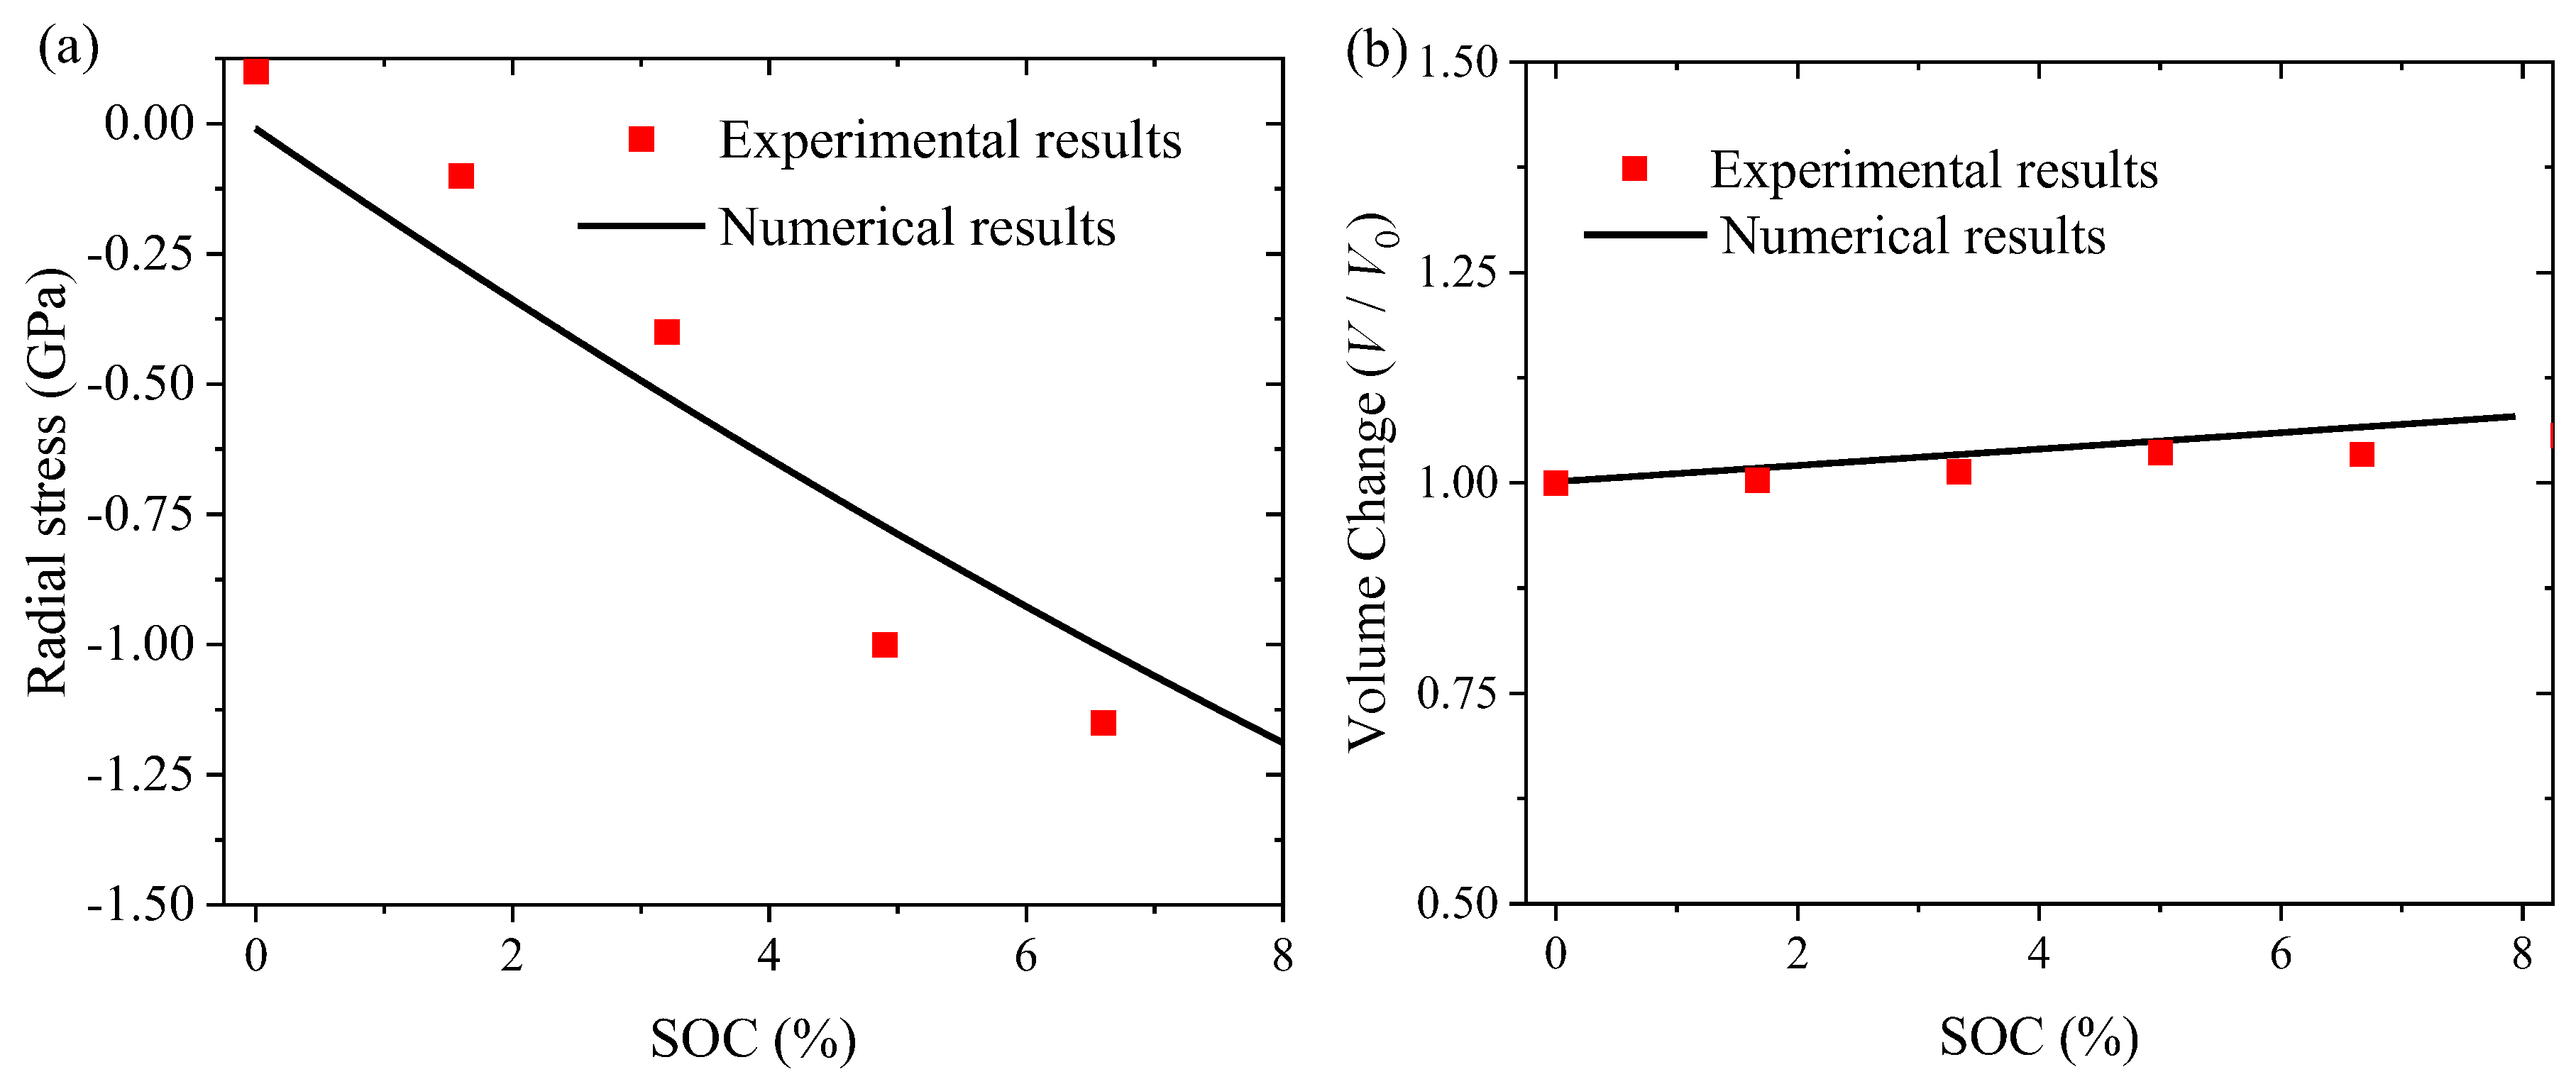
Figure 9a presents the variation in radial stress at the center of the top surface of the Si thin film with SOC for a total C-rate of 1/14 C. For comparison, the experimental results given by Pharr et al. [33] are included in the figure. Note that the stress measured experimentally by MOS is an average stress along the thickness direction. With the ultrathin Si film, we directly compare the numerical results of the stress at the top surface with the experimental results. The magnitude of the radial stress increases from 0 to ~1.2 GPa when the SOC is increased from 0 to ~8%. Such a trend is qualitatively in accord with the experimental results.
Figure 9b shows the volumetric change of the Si thin film with SOC. The volumetric change in the Si thin film is a linearly increasing function of SOC. The experimental results given by Uxa et al. [24] are also included in the figure. It is evident that the numerical results are consistent with the experimental results. Note that the linear dependence of the volumetric change of the Si thin film on SOC is consistent with the constitutive relations of Equation (1).
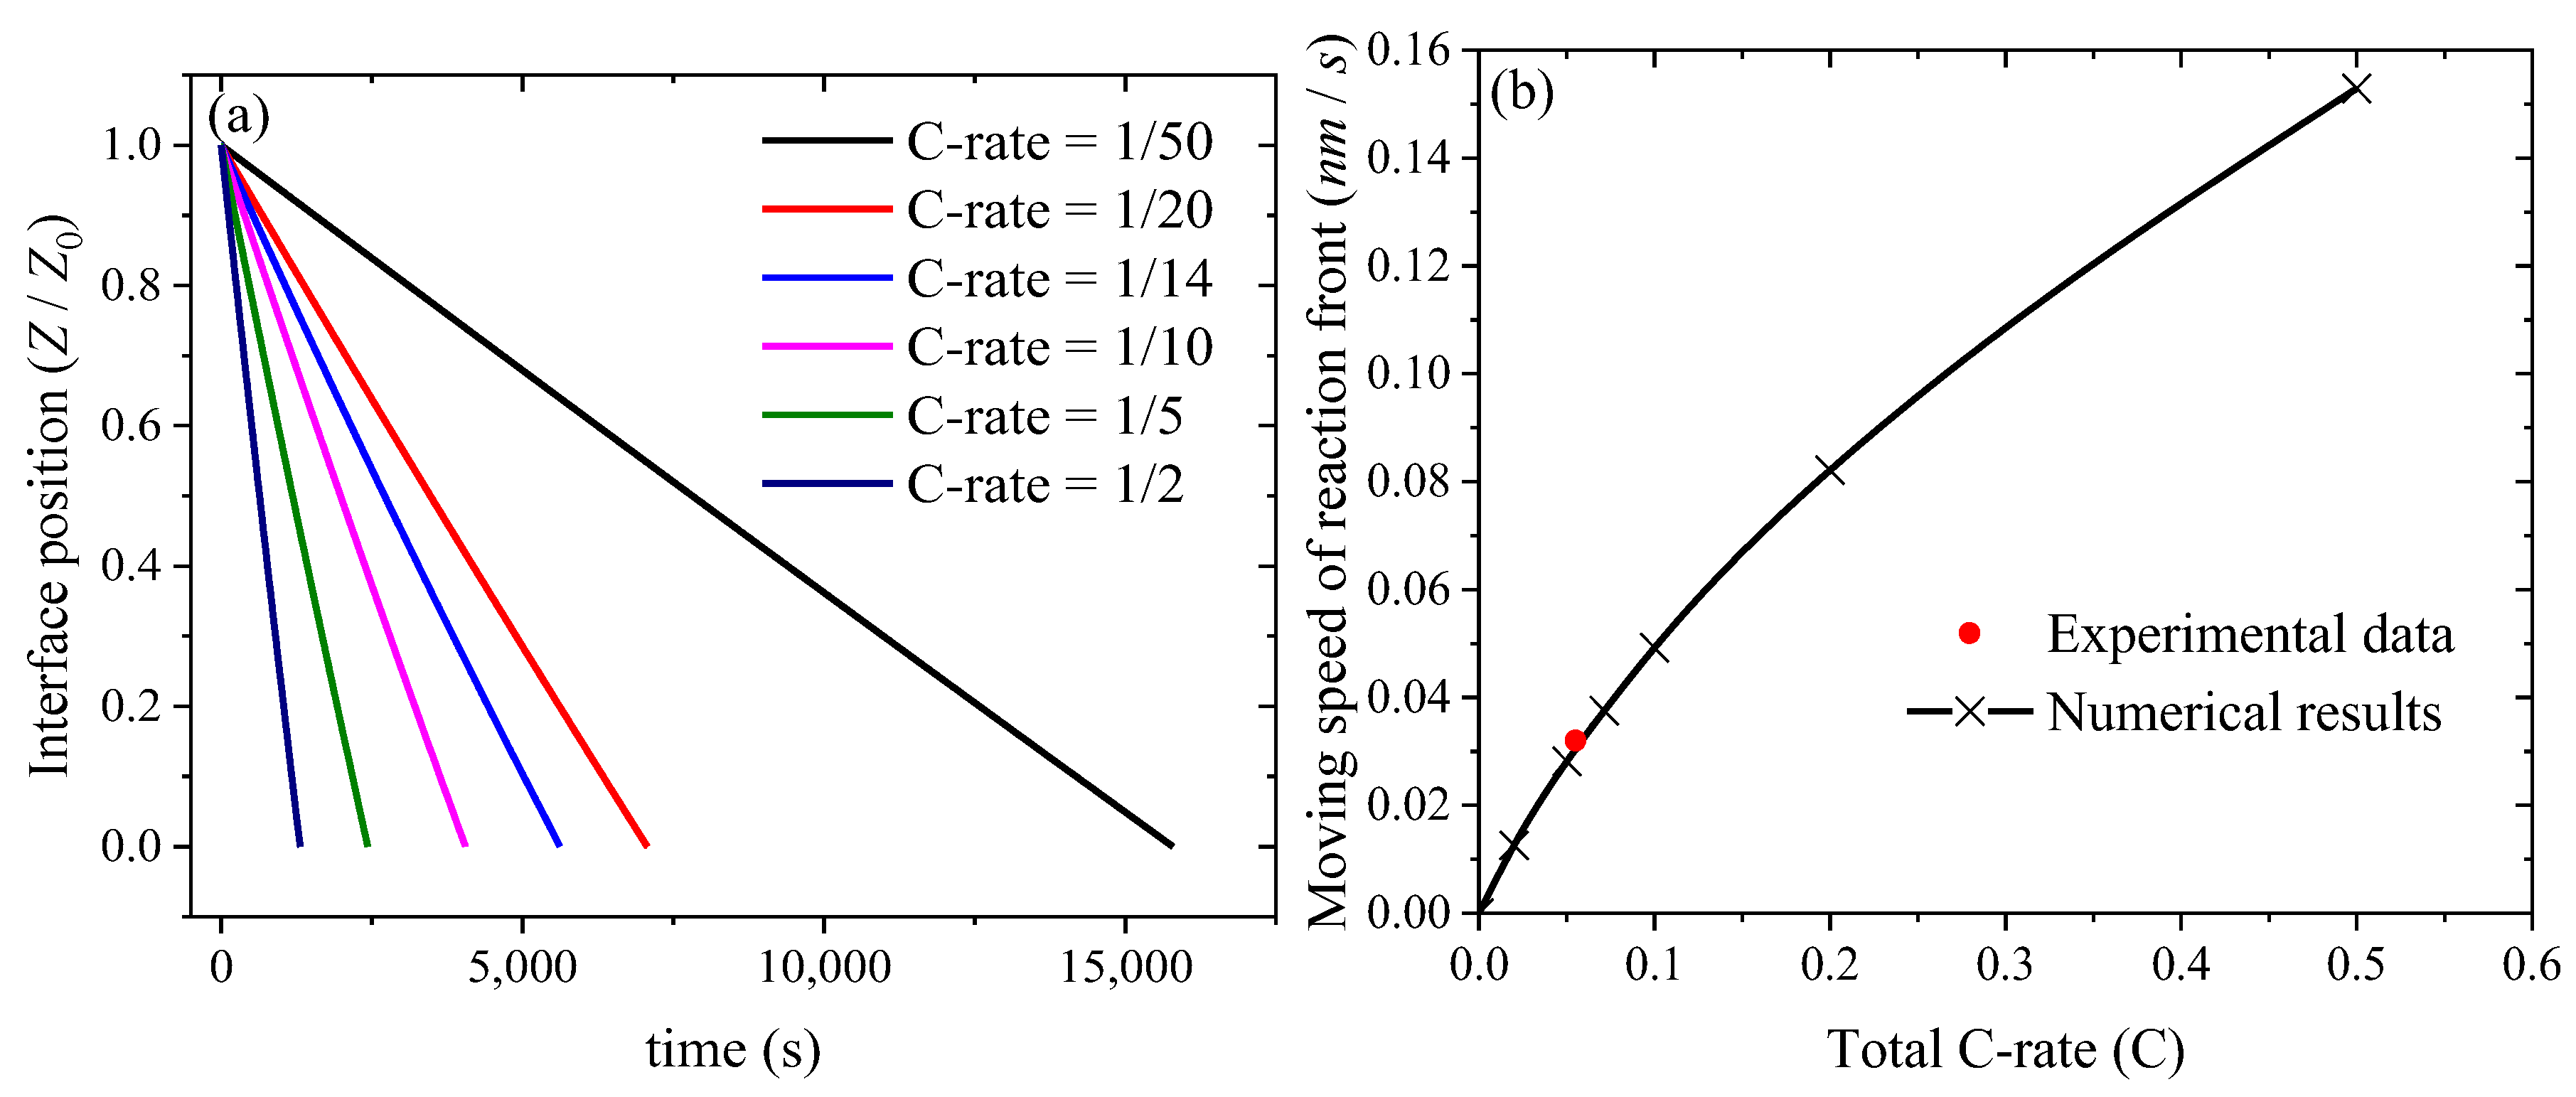
Figure 10a shows the temporal evolution of the interface position separating the Li-poor phase (Li0.3Si) from the un-lithiated Si phase under different C-rates. The interface approaches the substrate with the increase in lithiation time and is a nearly linear function of the lithiation time. From Figure 10a, we calculate the moving speed of the phase-interface between the Li-poor phase and the un-lithiated silicon. Figure 10b depicts the variation in the moving speed of the phase-interface with the total C-rate. It is evident that the moving speed of the phase-interface (reaction front) is a nonlinearly increasing function of the total C-rate. To prevent the occurrence of the stage II lithiation before the end of stage I, one can use a small C-rate to pre-lithiate Si electrodes to form a lithium-poor phase. A description of the stage II lithiation (Li-rich phase) is given in references [1,24].
The measured potential profile presented in Figure 2 shows that full lithiation with a constant current of 11 µA/cm2 takes about 18 h. Hence, the total C-rate amounts to C/18 (0.055 C). Figure 2 shows also that the duration of Li+ uptake I amounts to approximatively 2 h. This means that the Li0.3Si/Si phase front reaches the current collector, i.e., the Li0.3Si phase consumes all unreacted silicon, in about two hours. Consequently, a phase-front velocity of 0.032 nm/s is obtained by dividing the film thickness of 230 nm with the time interval of two hours. The obtained experimental result of (0.055 C, 0.032 nm/s) is plotted as a red dot in Figure 10b. The numerical result is in good accord with the experimental result, supporting the mechanochemical model used in this work.
The comparison between the numerical results shown in Figure 9 and Figure 10b and the corresponding experimental results and the agreement of the numerical result of the moving speed of the reaction front with the experimental result reveal that the mechanochemical model used in this work can effectively describe the diffusion of Li in the a-Si film with the formation of only one new phase of Li0.3Si during the lithiation onset.
The experimental and numerical results presented and discussed in this work suggest the stress-induced phase formation of a Li-poor phase for the lithiation onset of a-Si. With this finding, one may assess some explanations for two important issues: (i) the main difference between the lithiation onset of a-Si and nanocrystalline silicon, and (ii) their roles in the lithiation onset of a-Si given that a-Si has a huge internal stress and high defect density in comparison to c-Si. According to the insights obtained from the experimental results, we can address these two issues as follows. At first view, there seems to be no major difference between the lithiation onset of c-Si (crystalline silicon) and a-Si concerning the formation of the Li-poor phase. The higher internal stress and defect density of a-Si compared to those of c-Si may lead to a higher Li content in the Li-poor zone in the case of a-Si compared to that of c-Si. The appearance of the Li-poor phase and its Li content in polycrystalline silicon may be influenced by the preferential texture (preferential orientation) and by a change in mechanical stress in polycrystalline silicon, e.g., due to the presence of additives and binders. Note that silicon is cubic structure, which exhibits isotropic behavior in diffusion and anisotropic behavior in elastic deformation. The anisotropic behavior in elastic deformation can lead to a stress state different from that of isotropic deformation for a-silicon under the same cycling conditions.
As mentioned in the literature survey presented in Section 2, operando NR investigations [25] also found the appearance of the Li-poor phase in the lithiation process of bulk c-silicon, i.e., in that of 10 mm thick (100) oriented silicon wafer. The Li content of the Li-poor phase was estimated by fitting NR simulations on NR experimental data, and was found to be Li0.1Si (x ~ 0.1), which is lower than x = 0.3. Operando NR experiments performed later by another group [72] also found two distinct lithium silicide zones with high and low Li concentrations, initially separated by a sharp interface which broadens with cycling. The Li-poor zone was always in between the Li-rich zone and unlithiated silicon, i.e., the Li-poor zone was in direct contact with unlithiated silicon [72] (similar to the situations presented in Figure 1e–g). From the neutron scattering length densities (SLD) obtained from their NR data [72], the ratio of Li to Si in the Li-poor zone is evaluated to be between x ~ 0.05 and x ~ 0.35. Note that, although NR is sensitive to Li incorporation into silicon, NR is generally unable to exactly distinguish between low Li contents such as x = 0.1 and x = 0.3. In contrast to NR, and especially in contrast to a large range of often applied measurement techniques including electron spectroscopy and microscopy, SIMS is able to detect low traces of Li in silicon. Lithium has a high ionization cross-section for Li+-ions. Hence, the Li+ SIMS signal is of an extremely high intensity, as proved in our laboratory, especially for SIMS operated with O2+ primary ion beams. Li SIMS signals of more than 1 million counts per second can be measured for the Li-poor phase. Hence, future SIMS investigations on the lithiation process of bulk c-silicon (e.g., Si wafers) are of great interest. Moreover, the experiments on silicon wafers [25,72] were performed only on (100) oriented wafers. Mechanical stresses may be dependent on crystal orientations. Consequently, SIMS experiments and calculations on the lithiation of silicon wafers with different orientations may be of interest to examine the appearance of the stress-induced phase formation of the Li-poor phase in single Si crystals.
Polycrystalline films often possess a textured structure. A possible preferential orientation of polycrystalline silicon film, e.g., produced by heating treatments, may impede the lithiation process, as has been observed for the case of LiNixMnyCozO2 (x + y + z = 1, NMC) active materials of positive electrodes (e.g., ref. [73]), due to reduced Li kinetics and changed mechanical stress. Polycrystalline (e.g., silicon) electrodes are mostly produced by crystalline powder embedded in carbon-like additives and binders, which also exercises mechanical stress and different phenomena (e.g., Schottky contacts) on the Si particles before and during lithiation and delithiation. In that manner, the material in contact with silicon may influence the diffusion of lithium and the appearance of the Li-poor phase. For the case of silicon wafers, there are reports about experiments performed with a thin surface layer of aluminium oxide to suppress the SEI layer formation [72]. The Li-poor phase also appeared in that case, further showing that the Li-poor phase is an intrinsic product during the lithiation of silicon, and that, in that example, it is not dependent on the SEI layer. On the other hand, this may not always be the case. As mentioned in the second section, Li+ uptake I, which produces the Li-poor phase, is not detectable during the lithiation of amorphous Si/C ML, as presented in the supplementary material of reference [1]. The mechanical stress inside Si/C ML may interact with the chemical stress introduced by the lithiation process, interfering in the buildup of the Li-poor phase. Alternatively, the Li-poor phase may be built up in the Si/C ML but may possess a lower Li content of e.g., x ~ 0.1, which needs a much lower Li+-uptake than that of x ~ 0.3, and in that case does not recognizably remain in the potential profile of the lithiation process. Its examination constitutes a prime subject for SIMS investigation due to the mentioned high sensitivity of SIMS to very low Li contents in silicon. Additionally, different individual layer thicknesses inside the Si/C ML may produce different mechanical stresses and different Schottky barrier (space charge) strengths before and during ML lithiation, which may promote or interfere in the formation of the Li-poor phase and also affects its Li content. Hence, future SIMS investigations on the lithiation process of multilayers (e.g., Si/C MLs) are also of interest. The examination of the Si/C MLs may also be of interest for polycrystalline silicon electrodes produced by c-Si powder embedded in carbon-like additives and binders.
Finally, it is of interest to examine whether the stress-induced phase formation of the Li-poor phase represents a universal phenomenon, i.e., if a stress-induced phase formation of the Li-poor phase appears also in other well desired LIB electrode materials such as in (amorphous and crystalline) germanium.

4. Conclusions

In summary, the lithiation onset of a-Si films was reviewed, and a mechanochemical model for the lithiation onset of a-Si film was developed. The electrochemical lithiation onset of silicon films involving the formation of a Li-poor phase (Li0.3Si alloy) and the propagation of a reaction front in the films delimiting the Li0.3Si alloy from un-lithiated silicon, as revealed experimentally, constitute the foundation for a deeper examination of the lithiation onset of a-silicon. For that, (i) a literature review was performed to describe (i.1) the lithiation onset, (i.2) the changes in material properties at the lithiation onset and (i.3) the reason for the appearance of the reaction front, after which (ii) numerical calculations of depth-resolved mechanical stress during the lithiation onset were performed.
The literature survey elaborated the following five peculiar changes in the behavior of the active electrode material during the lithiation onset of a-silicon: (i) the build-up of the highest mechanical stress (up to 1.2 GPa) during lithiation, (ii) a linear increase in the mechanical stress with lithiation which mimics the characteristics of linear elastic deformation, (iii) only a minute volume increase during Li incorporation which is lower than that expected from the amount of Li ions entering the silicon electrode, (iv) the largest heat generation appearing during cycling with only a minor degree of parasitic heat contribution, and (v) an unexpected enhanced brittleness.
A further literature review was performed to examine (i) why the lithiation onset of silicon occurs via a phase front which delimits the Li-poor phase from unreacted silicon, and (ii) why the Li-poor phase possesses the particular Li concentration corresponding to x ~ 0.3 in LixSi. The following three factors—(i) extremely low Li permeability in pure silicon and relative high Li permeability in Li0.3Si, (ii) Li repulsion from pure silicon due to mechanical stress, and (iii) energy gain by LixSi formation only for x ≥ 0.3—were found to qualitatively explain why initially a two-phase lithiation mechanism appears which sharply delimits pure silicon from a Li-poor LixSi phase with x ~ 0.3.
The literature review shows that the appearance of the Li-poor silicide (Li0.3Si) as an intrinsic property during the lithiation onset of pure and “defect-free” silicon is unexpected, since no stable LixSi silicide phases appear for x < 1 at ambient pressure in the Li-Si phase diagram. The first principle calculation predicts that mechanical pressure above 8 GPa is necessary for the Li-poor silicide with x ~ 0.3 (LiSi3) to become stable at 0 K. This points to the fact that the peculiar lithiation onset of a-silicon may be quantitatively explained by the depth-resolved mechanical stress appeared during the lithiation onset. Consequently, a mechanochemical model was elaborated and the lithiation onset was simulated on the stress evolution and the motion of the reaction front for the growth of the Li-poor phase in an a-Si film, based on the theory of linear elasticity and the coupling between diffusion and stress. A moving boundary condition was used to describe the propagation of the reaction front. The temporal evolution of the stresses was illustrated, and the comparison between the numerical results and those reported in the literature was performed.
The mechanochemical model consists of two stages, with stage 0 involving the diffusion of lithium in the Si film without the formation of the Li-poor phase and stage I involving the formation of the Li-poor phase with the propagation of the reaction front at the end of stage 0. The magnitude of the compressive radial stress at the end of stage 0 can reach around 8 GPa, likely corresponding to the formation of the Li0.3Si phase under high stress. No experimental observations of cracking and wrinkling for stress relief points to a stress relaxation by the phase formation up to the end of lithiation stage I. Increasing the total C-rate reduces the layer thickness of the high compressive-radial stress around the surface of the Si film at the end of stage 0.
For the lithiation of the Si film at stage I, the numerical results for the variations of the radial stress and volumetric change with SOC and for the moving speed of the reaction front for the lithiation under 0.055 C (C/18) are in good accord with the corresponding experimental data. These results support the mechanochemical model developed in this work, revealing the important role of the interaction of diffusion and stress in the lithiation onset of Si-based electrodes used in lithium-ion batteries and in the stress-induced phase formation of the Li0.3Si phase.

Author Contributions

Conceptualization, K.Z., E.H., Y.L. and F.Y.; methodology, K.Z., E.H. and F.Y.; validation, K.Z., E.H., Y.L. and F.Y.; formal analysis, K.Z., E.H., Y.L. and F.Y.; investigation, K.Z., E.H. and F.Y.; resources, E.H., H.S. and F.Y.; data curation, K.Z., E.H. and Y.L.; writing—K.Z., E.H., Y.L. and F.Y.; writing—review and editing, E.H. and F.Y.; supervision, E.H. and F.Y.; project administration, E.H., H.S. and F.Y. All authors have read and agreed to the published version of the manuscript.

Funding

This research received no external funding.

Data Availability Statement

Data are available upon request.

Conflicts of Interest

The authors declare no conflict of interest.

Appendix A

Appendix A.1. Experimental Procedure

For the lithiation and delithiation processes, a working electrode possessing a-Si film, a Li–metal reference electrode and a Li-metal counter electrode was used, together with a liquid carbon-based electrolyte (propylene carbonate) with a 1 M LiClO4 salt. A 1-inch copper disk with a thickness of 1 mm was used as a current collector and a substrate for the ion-beam deposition of a-Si electrochemical active material of 230 nm thickness. The ion beam coater IBC 681 (Gatan Inc., Pleasanton, CA, USA) was used for the film deposition, as described in reference [45]. Grazing incidence X-ray diffraction, performed with a Bruker D8 DISCOVER diffractometer, found the deposited silicon films to be amorphous. The electrochemical lithiation and delithiation were performed at room temperature on a Biologic SP150 potentiostat with the EC-lab software.

Appendix A.2. Additional Figures and Information on the Mechanochemical Simulation
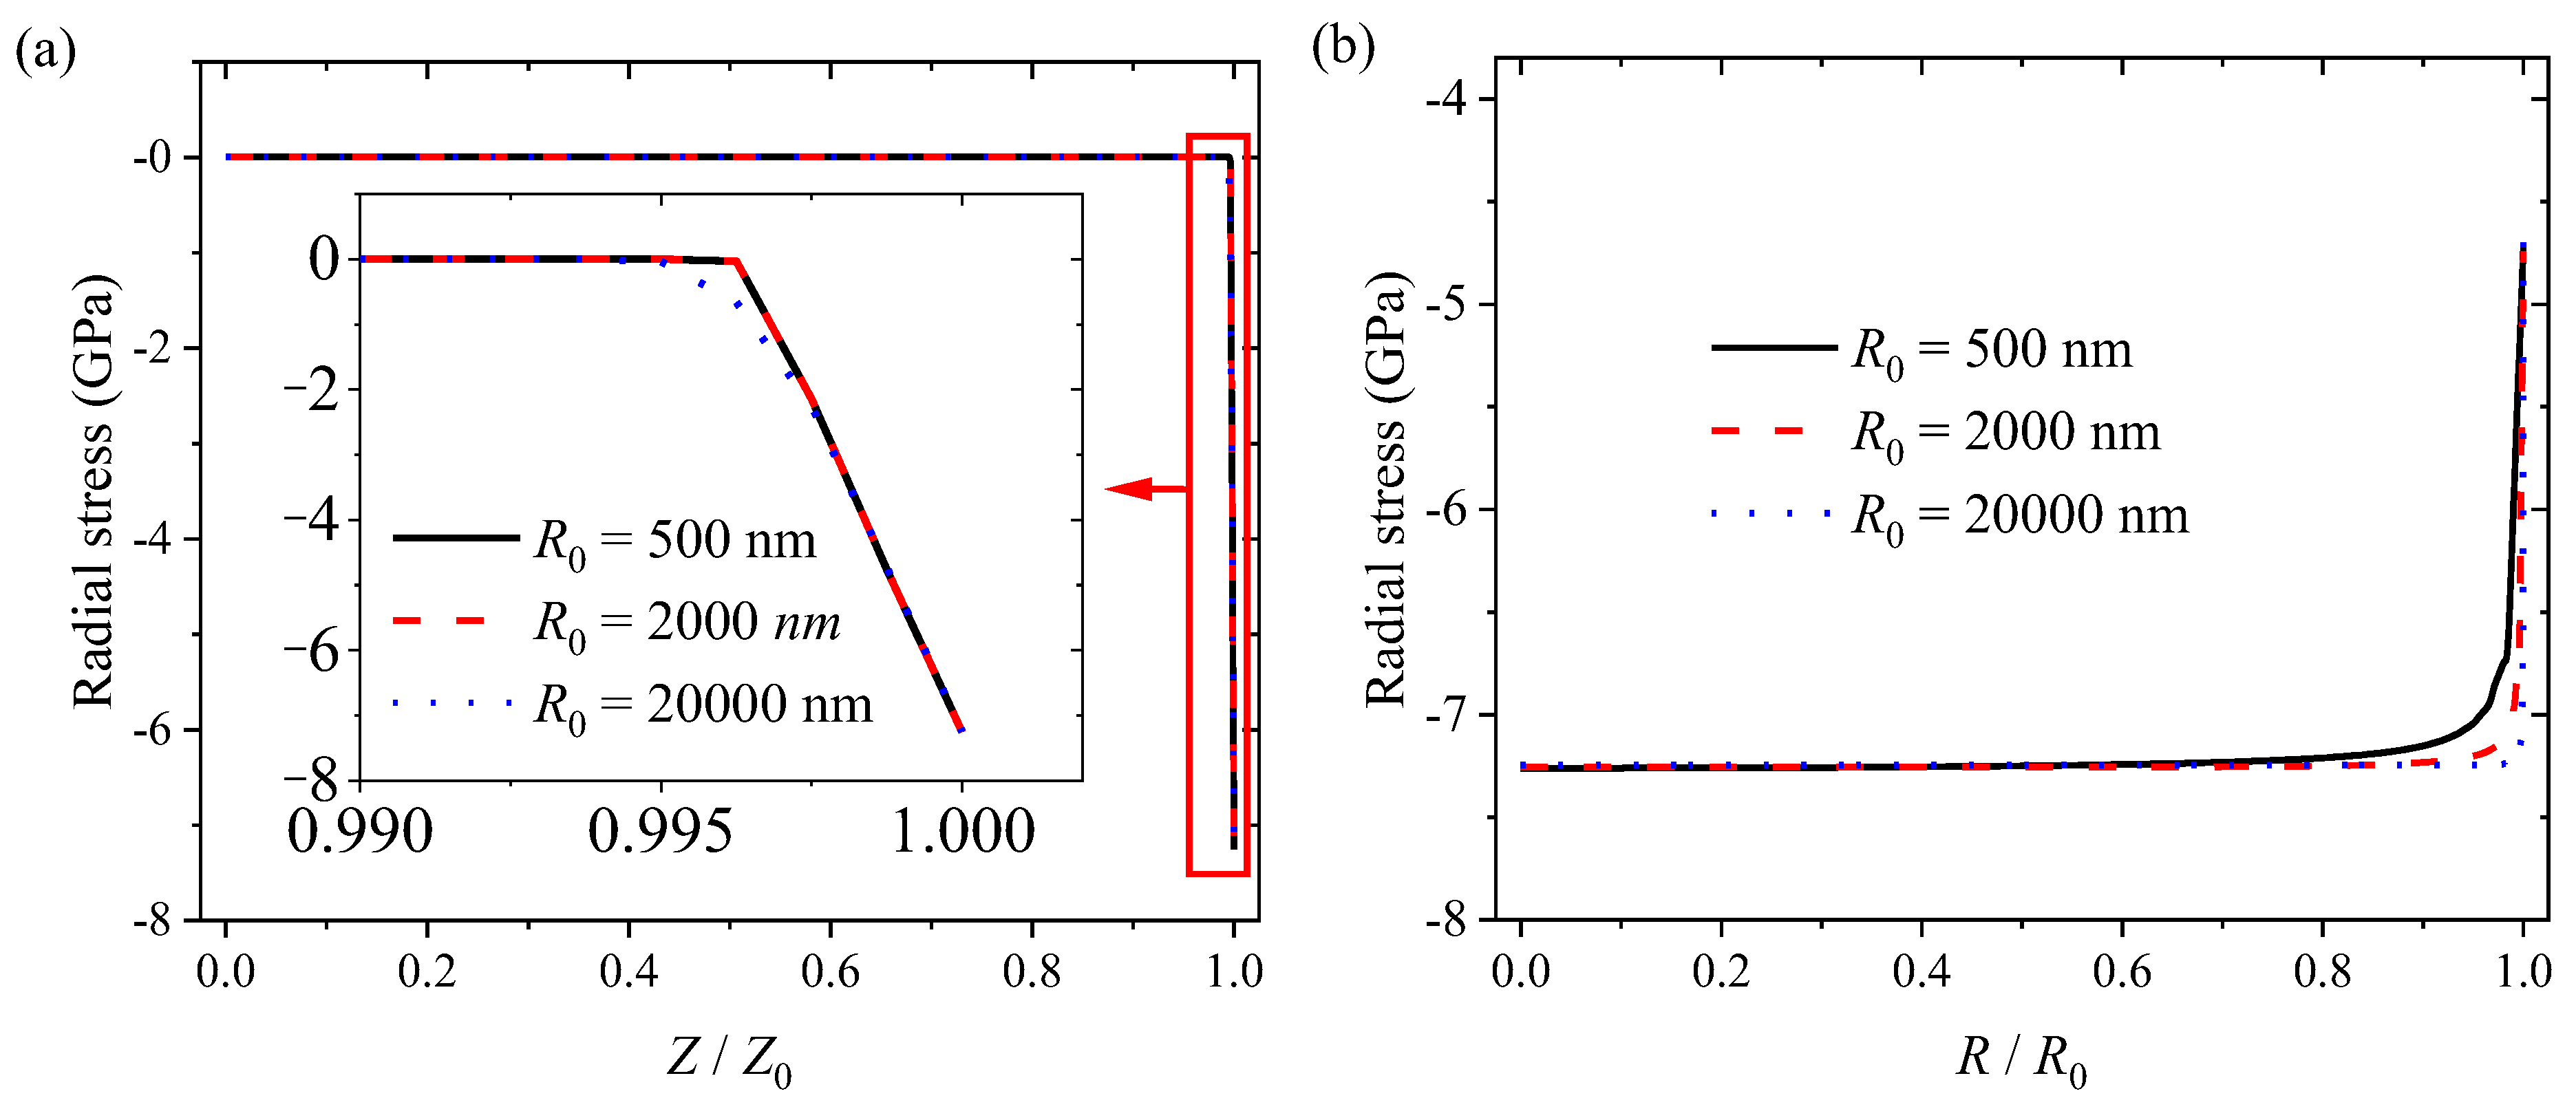
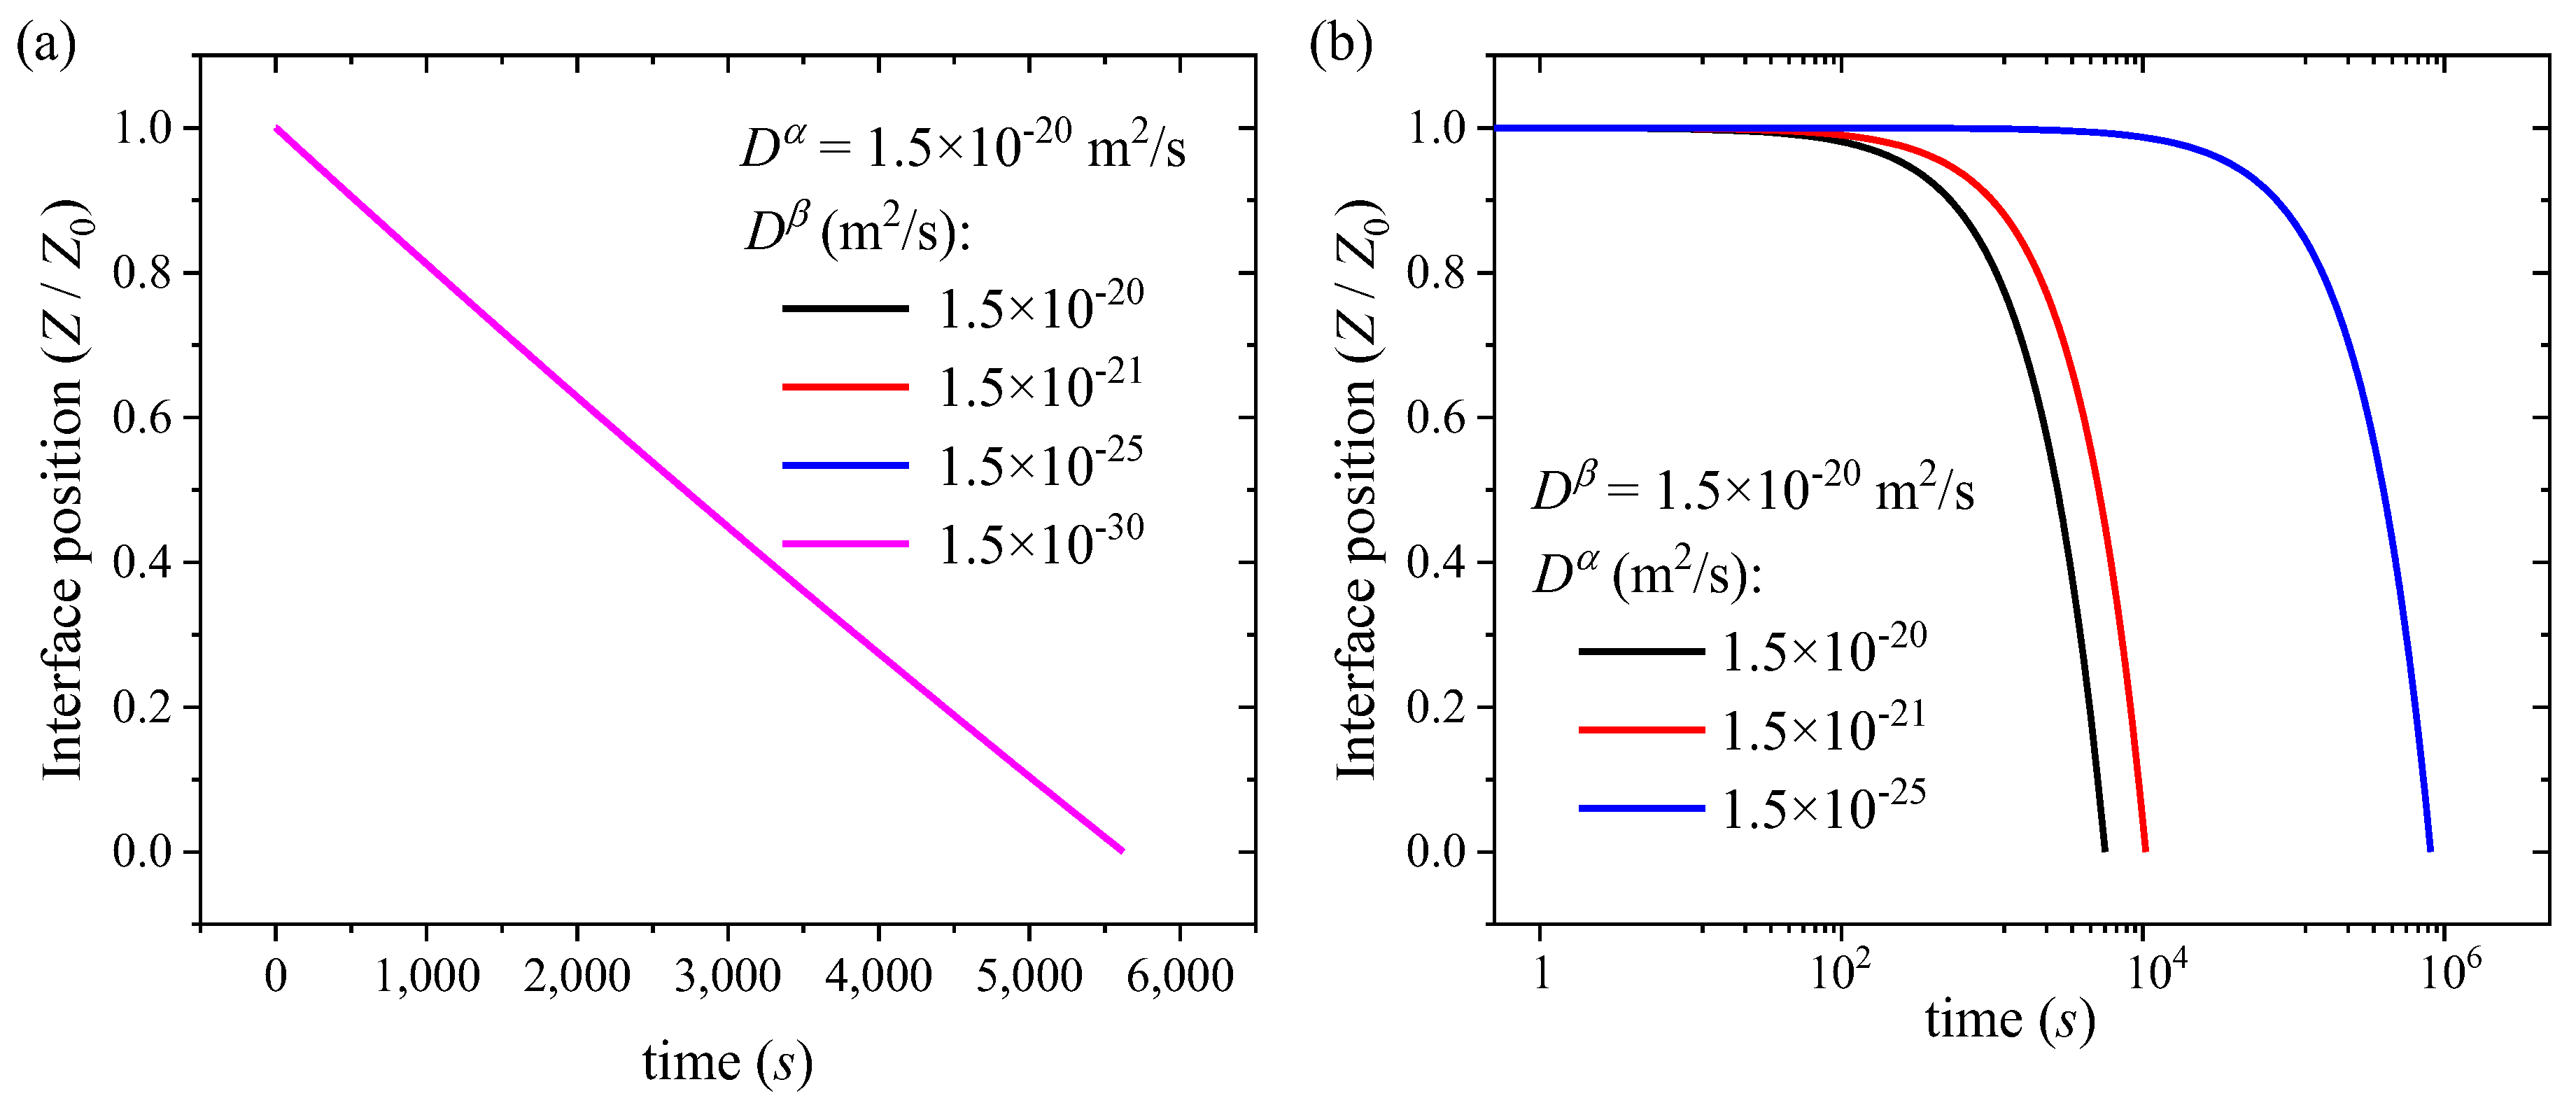
Figure A2a shows temporal variations of the interface position in the thin film electrode for Dβ (Li diffusivity in a-Si) in a range of 1.5 × 10⁻²⁰ to 1.5 × 10⁻³⁰ m2/s and Dα (Li diffusivity in Li0.3Si) being 1.5 × 10⁻²⁰ m2/s. It is evident that there is no observable difference for the spatial position of the interface at the same lithiation time. The Li diffusivity in the a-Si has a negligible effect on the migration rate of the interface. Figure A2b shows temporal variations of the interface position in the thin film electrode for Dα in a range of 1.5 × 10⁻²⁰ to 1.5 × 10⁻²⁵ m2/s and Dβ being 1.5 × 10⁻²⁰ m2/s. For the lithiation time less than 10 s, there is no observable difference for the spatial position of the interface at the same lithiation time. For the lithiation time larger than 10 s, the larger the diffusivity of the α phase, the closer the interface to the current collector at the same lithiation. This result suggests that the larger the diffusivity of the α phase, the larger is the migration rate of the interface. The Li diffusivity in the Li-poor phase has a dominant effect on the migration rate of the interface.
Figure A1. Variations in the radial stress along (a) the film thickness at axisymmetric axis and (b) the radial direction on the top surface at end of stage 0. Results of the disk with different initial radii of 500, 2000 and 200,000 nm are depicted. The numerical results show that there are no observable differences between the corresponding stresses in the region far away from the disk edge. Here, Z = 0 corresponds to the interface between the a-Si and the current collector and Z = Z0 corresponds to the interface between the a-silicon electrode and electrolyte.
Batteries 09 00105 g0a1
Figure A2. Temporal variation in the interface position between pure silicon (β phase) and the Li-poor phase (α phase) in the thin film electrode for different values of (a) Dβ (Li diffusivity in a-Si-β phase) and Dα (Li diffusivity in Li0.3Si-α phase) =1.5 × 10⁻²⁰ m2/s, and (b) Dα and Dβ = 1.5 × 10⁻²⁰ m2/s.
Batteries 09 00105 g0a2

References

  1. Hüger, E.; Uxa, D.; Yang, F.; Schmidt, H. The lithiation onset of amorphous silicon thin-film electrodes. Appl. Phys. Lett. 2022, 121, 133901. [Google Scholar] [CrossRef]
  2. Hüger, E.; Jin, C.; Schmidt, H. Electrochemical investigation of ion-beam sputter-deposited carbon thin films for Li-ion batteries. J. Appl. Electrochem. 2022, 52, 1715–1732. [Google Scholar] [CrossRef]
  3. Wu, B.; Chen, C.; Danilov, D.L.; Jiang, M.; Raijmakers, L.H.; Eichel, R.d.-A.; Notten, P.H. Influence of the SEI formation on the stability and lithium diffusion in Si electrodes. ACS Omega 2022, 7, 32740–32748. [Google Scholar] [CrossRef]
  4. Phan, V.P.; Pecquenard, B.; Le Cras, F. High-Performance all-solid-state cells fabricated with silicon electrodes. Adv. Funct. Mater. 2012, 22, 2580–2584. [Google Scholar] [CrossRef]
  5. Cao, C.; Abate, I.I.; Sivonxay, E.; Shyam, B.; Jia, C.; Moritz, B.; Devereaux, T.P.; Persson, K.A.; Steinrück, H.-G.; Toney, M.F. Solid electrolyte interphase on native oxide-terminated silicon anodes for Li-ion batteries. Joule 2019, 3, 762–781. [Google Scholar] [CrossRef]
  6. Browning, K.L.; Browning, J.F.; Doucet, M.; Yamada, N.L.; Liu, G.; Veith, G.M. Role of conductive binder to direct solid–electrolyte interphase formation over silicon anodes. Phys. Chem. Chem. Phys. 2019, 21, 17356–17365. [Google Scholar] [CrossRef]
  7. Philippe, B.; Dedryvère, R.M.; Allouche, J.; Lindgren, F.; Gorgoi, M.; Rensmo, H.K.; Gonbeau, D.; Edström, K. Nanosilicon electrodes for lithium-ion batteries: Interfacial mechanisms studied by hard and soft X-ray photoelectron spectroscopy. Chem. Mater. 2012, 24, 1107–1115. [Google Scholar] [CrossRef]
  8. Schroder, K.W.; Celio, H.; Webb, L.J.; Stevenson, K.J. Examining solid electrolyte interphase formation on crystalline silicon electrodes: Influence of electrochemical preparation and ambient exposure conditions. J. Phys. Chem. C 2012, 116, 19737–19747. [Google Scholar] [CrossRef]
  9. Yin, Y.; Arca, E.; Wang, L.; Yang, G.; Schnabel, M.; Cao, L.; Xiao, C.; Zhou, H.; Liu, P.; Nanda, J. Nonpassivated silicon anode surface. ACS Appl. Mater. Interfaces 2020, 12, 26593–26600. [Google Scholar] [CrossRef]
  10. Schnabel, M.; Harvey, S.P.; Arca, E.; Stetson, C.; Teeter, G.; Ban, C.; Stradins, P. Surface SiO2 thickness controls uniform-to-localized transition in lithiation of silicon anodes for lithium-ion batteries. ACS Appl. Mater. Interfaces 2020, 12, 27017–27028. [Google Scholar] [CrossRef]
  11. Schnabel, M.; Arca, E.; Ha, Y.; Stetson, C.; Teeter, G.; Han, S.-D.; Stradins, P. Enhanced interfacial stability of Si anodes for Li-ion batteries via surface SiO2 coating. ACS Appl. Energy Mater. 2020, 3, 8842–8849. [Google Scholar] [CrossRef]
  12. Hasa, I.; Haregewoin, A.M.; Zhang, L.; Tsai, W.-Y.; Guo, J.; Veith, G.M.; Ross, P.N.; Kostecki, R. Electrochemical reactivity and passivation of silicon thin-film electrodes in organic carbonate electrolytes. ACS Appl. Mater. Interfaces 2020, 12, 40879–40890. [Google Scholar] [CrossRef]
  13. Stetson, C.; Schnabel, M.; Li, Z.; Harvey, S.P.; Jiang, C.-S.; Norman, A.; DeCaluwe, S.C.; Al-Jassim, M.; Burrell, A. Microscopic observation of solid electrolyte interphase bilayer inversion on silicon oxide. ACS Energy Lett. 2020, 5, 3657–3662. [Google Scholar] [CrossRef]
  14. Huang, W.; Wang, J.; Braun, M.R.; Zhang, Z.; Li, Y.; Boyle, D.T.; McIntyre, P.C.; Cui, Y. Dynamic structure and chemistry of the silicon solid-electrolyte interphase visualized by cryogenic electron microscopy. Matter 2019, 1, 1232–1245. [Google Scholar] [CrossRef]
  15. Steinrück, H.-G.; Cao, C.; Veith, G.M.; Toney, M.F. Toward quantifying capacity losses due to solid electrolyte interphase evolution in silicon thin film batteries. J. Chem. Phys. 2020, 152, 084702. [Google Scholar] [CrossRef] [PubMed]
  16. Kohler, T.; Hadjixenophontos, E.; Joshi, Y.; Wang, K.; Schmitz, G. Reversible oxide formation during cycling of Si anodes. Nano Energy 2021, 84, 105886. [Google Scholar] [CrossRef]
  17. Cao, C.; Steinrück, H.-G.; Shyam, B.; Stone, K.H.; Toney, M.F. In situ study of silicon electrode lithiation with X-ray reflectivity. Nano Lett. 2016, 16, 7394–7401. [Google Scholar] [CrossRef] [PubMed]
  18. Stournara, M.E.; Xiao, X.C.; Qi, Y.; Johari, P.; Lu, P.; Sheldon, B.W.; Gao, H.J.; Shenoy, V.B. Li segregation induces structure and strength changes at the amorphous Si/Cu interface. Nano Lett. 2013, 13, 4759–4768. [Google Scholar] [CrossRef]
  19. Guo, M.Q.; Meng, W.J.; Zhang, X.G.; Bai, Z.C.; Wang, G.W.; Wang, Z.H.; Yang, F.Q. Structural degradation of Cu current collector during electrochemical cycling of Sn-based lithium-ion batteries. J. Electron. Mater. 2019, 48, 7543–7550. [Google Scholar] [CrossRef]
  20. Yang, Y.; Zhao, J.B. Wadsley-roth crystallographic shear structure niobium-based oxides: Promising anode materials for high-safety lithium-ion batteries. Adv. Sci. 2021, 8, 2004855. [Google Scholar] [CrossRef]
  21. Al-Maghrabi, M.; Suzuki, J.; Sanderson, R.; Chevrier, V.; Dunlap, R.; Dahn, J. Combinatorial studies of Si1-xOx as a potential negative electrode material for Li-ion battery applications. J. Electrochem. Soc. 2013, 160, A1587. [Google Scholar] [CrossRef]
  22. Cao, Y.; Bennett, J.C.; Dunlap, R.; Obrovac, M. A simple synthesis route for high-capacity SiOx anode materials with tunable oxygen content for lithium-ion batteries. Chem. Mater. 2018, 30, 7418–7422. [Google Scholar] [CrossRef]
  23. Cao, Y.; Dunlap, R.; Obrovac, M. Electrochemistry and thermal behavior of SiOx made by reactive gas milling. J. Electrochem. Soc. 2020, 167, 110501. [Google Scholar] [CrossRef]
  24. Uxa, D.; Jerliu, B.; Hüger, E.; Dörrer, L.; Horisberger, M.; Stahn, J.; Schmidt, H. On the lithiation mechanism of amorphous silicon electrodes in Li-ion batteries. J. Phys. Chem. C 2019, 123, 22027–22039. [Google Scholar] [CrossRef]
  25. Seidlhofer, B.-K.; Jerliu, B.; Trapp, M.; Hüger, E.; Risse, S.; Cubitt, R.; Schmidt, H.; Steitz, R.; Ballauff, M. Lithiation of crystalline silicon as analyzed by operando neutron reflectivity. ACS Nano 2016, 10, 7458–7466. [Google Scholar] [CrossRef]
  26. Sheldon, B.W.; Soni, S.K.; Xiao, X.; Qi, Y. Stress contributions to solution thermodynamics in Li-Si alloys. Electrochem. Solid-State Lett. 2011, 15, A9. [Google Scholar] [CrossRef]
  27. Sethuraman, V.A.; Srinivasan, V.; Bower, A.F.; Guduru, P.R. In situ measurements of stress-potential coupling in lithiated silicon. J. Electrochem. Soc. 2010, 157, A1253. [Google Scholar] [CrossRef]
  28. Jerliu, B.; Hüger, E.; Dorrer, L.; Seidlhofer, B.-K.; Steitz, R.; Oberst, V.; Geckle, U.; Bruns, M.; Schmidt, H. Volume expansion during lithiation of amorphous silicon thin film electrodes studied by in-operando neutron reflectometry. J. Phys. Chem. C 2014, 118, 9395–9399. [Google Scholar] [CrossRef]
  29. Beaulieu, L.; Hatchard, T.; Bonakdarpour, A.; Fleischauer, M.; Dahn, J. Reaction of Li with alloy thin films studied by in situ AFM. J. Electrochem. Soc. 2003, 150, A1457. [Google Scholar] [CrossRef]
  30. Soni, S.K.; Sheldon, B.W.; Xiao, X.; Tokranov, A. Thickness effects on the lithiation of amorphous silicon thin films. Scr. Mater. 2011, 64, 307–310. [Google Scholar] [CrossRef]
  31. Nadimpalli, S.P.; Sethuraman, V.A.; Bucci, G.; Srinivasan, V.; Bower, A.F.; Guduru, P.R. On plastic deformation and fracture in Si films during electrochemical lithiation/delithiation cycling. J. Electrochem. Soc. 2013, 160, A1885. [Google Scholar] [CrossRef]
  32. Sethuraman, V.A.; Chon, M.J.; Shimshak, M.; Srinivasan, V.; Guduru, P.R. In situ measurements of stress evolution in silicon thin films during electrochemical lithiation and delithiation. J. Power Sources 2010, 195, 5062–5066. [Google Scholar] [CrossRef]
  33. Pharr, M.; Suo, Z.; Vlassak, J.J. Measurements of the fracture energy of lithiated silicon electrodes of Li-ion batteries. Nano Lett. 2013, 13, 5570–5577. [Google Scholar] [CrossRef]
  34. Wang, X.; Fan, F.; Wang, J.; Wang, H.; Tao, S.; Yang, A.; Liu, Y.; Beng Chew, H.; Mao, S.X.; Zhu, T.; et al. High damage tolerance of electrochemically lithiated silicon. Nat. Commun. 2015, 6, 8417. [Google Scholar] [CrossRef] [PubMed]
  35. Housel, L.M.; Li, W.Z.; Quilty, C.D.; Vila, M.N.; Wang, L.; Tang, C.R.; Bock, D.C.; Wu, Q.Y.; Tong, X.; Head, A.R.; et al. Insights into reactivity of silicon negative electrodes: Analysis using isothermal microcalorimetry. ACS Appl. Mater. Interfaces 2019, 11, 37567–37577. [Google Scholar] [CrossRef]
  36. Yang, F.Q. Cycling-induced structural damage/degradation of electrode materials—Microscopic viewpoint. Nanotechnology 2022, 33, 065405. [Google Scholar] [CrossRef] [PubMed]
  37. Wang, P.; Kozlov, A.; Thomas, D.; Mertens, F.; Schmid-Fetzer, R. Thermodynamic analysis of the Li–Si phase equilibria from 0 K to liquidus temperatures. Intermetallics 2013, 42, 137–145. [Google Scholar] [CrossRef]
  38. Zeilinger, M.; Kurylyshyn, I.M.; Haussermann, U.; Fässler, T.F. Revision of the Li–Si phase diagram: Discovery and single-crystal X-ray structure determination of the high-temperature phase Li4.11Si. Chem. Mater. 2013, 25, 4623–4632. [Google Scholar] [CrossRef]
  39. Morris, A.J.; Grey, C.; Pickard, C.J. Thermodynamically stable lithium silicides and germanides from density functional theory calculations. Phys. Rev. B 2014, 90, 054111. [Google Scholar] [CrossRef]
  40. Braga, M.H.; Dębski, A.; Gąsior, W. Li–Si phase diagram: Enthalpy of mixing, thermodynamic stability, and coherent assessment. J. Alloys Compd. 2014, 616, 581–593. [Google Scholar] [CrossRef]
  41. Zhang, S.; Wang, Y.; Yang, G.; Ma, Y. Silicon framework-based lithium silicides at high pressures. ACS Appl. Mater. Interfaces 2016, 8, 16761–16767. [Google Scholar] [CrossRef]
  42. Chiang, H.-H.; Lu, J.-M.; Kuo, C.-L. First-principles study of the structural and dynamic properties of the liquid and amorphous Li–Si alloys. J. Chem. Phys. 2016, 144, 034502. [Google Scholar] [CrossRef] [PubMed]
  43. Yang, F. Interaction between diffusion and chemical stresses. Mater. Sci. Eng. A 2005, 409, 153–159. [Google Scholar] [CrossRef]
  44. Strauß, F.; Hüger, E.; Julin, J.; Munnik, F.; Schmidt, H. Lithium diffusion in ion-beam sputter-deposited lithium–silicon layers. J. Phys. Chem. C 2020, 124, 8616–8623. [Google Scholar] [CrossRef]
  45. Hüger, E.; Dörrer, L.; Schmidt, H. Permeation, solubility, diffusion and segregation of lithium in amorphous silicon layers. Chem. Mater. 2018, 30, 3254–3264. [Google Scholar] [CrossRef]
  46. Strauß, F.; Dörrer, L.; Bruns, M.; Schmidt, H. Lithium tracer diffusion in amorphous LixSi for low Li concentrations. J. Phys. Chem. C 2018, 122, 6508–6513. [Google Scholar] [CrossRef]
  47. Chevrier, V.L.; Dahn, J.R. First principles model of amorphous silicon lithiation. J. Electrochem. Soc. 2009, 156, A454–A458. [Google Scholar] [CrossRef]
  48. Artrith, N.; Urban, A.; Ceder, G. Constructing first-principles phase diagrams of amorphous LixSi using machine-learning-assisted sampling with an evolutionary algorithm. J. Chem. Phys. 2018, 148, 241711. [Google Scholar] [CrossRef] [PubMed]
  49. Bucci, G.; Swamy, T.; Bishop, S.; Sheldon, B.W.; Chiang, Y.M.; Carter, W.C. The effect of stress on battery-electrode capacity. J. Electrochem. Soc. 2017, 164, A645–A654. [Google Scholar] [CrossRef]
  50. Stournara, M.E.; Kumar, R.; Qi, Y.; Sheldon, B.W. Ab initio diffuse-interface model for lithiated electrode interface evolution. Phys. Rev. E 2016, 94, 012802. [Google Scholar] [CrossRef]
  51. Hirai, K.; Ichitsubo, T.; Uda, T.; Miyazaki, A.; Yagi, S.; Matsubara, E. Effects of volume strain due to Li–Sn compound formation on electrode potential in lithium-ion batteries. Acta Mater. 2008, 56, 1539–1545. [Google Scholar] [CrossRef]
  52. Li, Y.; Zhang, K.; Zheng, B.; Yang, F. Effect of local deformation on the coupling between diffusion and stress in lithium-ion battery. Int. J. Solids Struct. 2016, 87, 81–89. [Google Scholar] [CrossRef]
  53. Zhang, F.; Wang, J.; Liu, S.; Du, Y. Effects of the volume changes and elastic-strain energies on the phase transition in the Li-Sn battery. J. Power Sources 2016, 330, 111–119. [Google Scholar] [CrossRef]
  54. Selvi, G.T.; Jha, S.K. Anomalous interfacial stress generation and role of elasto-plasticity in mechanical failure of Si-based thin film anodes of Li-ion batteries. Bull. Mater. Sci. 2022, 45, 23. [Google Scholar] [CrossRef]
  55. Li, J.; Fang, Q.; Wu, H.; Liu, Y.; Wen, P. Investigation into diffusion induced plastic deformation behavior in hollow lithium ion battery electrode revealed by analytical model and atomistic simulation. Electrochim. Acta 2015, 178, 597–607. [Google Scholar] [CrossRef]
  56. Li, Y.; Zhang, J.; Zhang, K.; Zheng, B.; Yang, F. A defect-based viscoplastic model for large-deformed thin film electrode of lithium-ion battery. Int. J. Plast. 2019, 115, 293–306. [Google Scholar] [CrossRef]
  57. Bagheri, A.; Arghavani, J.; Naghdabadi, R.; Brassart, L. A theory for coupled lithium insertion and viscoplastic flow in amorphous anode materials for Li-ion batteries. Mech. Mater. 2021, 152, 103663. [Google Scholar] [CrossRef]
  58. Zhang, K.; Zhou, J.; Yang, F.; Zhang, Y.; Pan, Y.; Zheng, B.; Li, Y.; Yang, F. A stress-control charging method with multi-stage currents for silicon-based lithium-ion batteries: Theoretical analysis and experimental validation. J. Energy Storage 2022, 56, 105985. [Google Scholar] [CrossRef]
  59. Zuo, P.; Zhao, Y.-P. A phase field model coupling lithium diffusion and stress evolution with crack propagation and application in lithium ion batteries. Phys. Chem. Chem. Phys. 2015, 17, 287–297. [Google Scholar] [CrossRef] [PubMed]
  60. Deng, J.; Wagner, G.J.; Muller, R.P. Phase field modeling of solid electrolyte interface formation in lithium ion batteries. J. Electrochem. Soc. 2013, 160, A487. [Google Scholar] [CrossRef]
  61. Liu, Z.; Cai, R.; Chen, B.; Liu, T.; Zhou, J. Effect of electrochemical reaction on diffusion-induced stress in hollow spherical lithium-ion battery electrode. Ionics 2017, 23, 617–625. [Google Scholar] [CrossRef]
  62. Zhang, T.; Guo, Z.; Wang, Y.; Zhu, J. Effect of reversible electrochemical reaction on Li diffusion and stresses in cylindrical Li-ion battery electrodes. J. Appl. Phys. 2014, 115, 083504. [Google Scholar] [CrossRef]
  63. Suo, Y.; Yang, F. Transient analysis of diffusion-induced stress: Effect of solid reaction. Acta Mech. 2019, 230, 993–1002. [Google Scholar] [CrossRef]
  64. Yang, F. Effect of local solid reaction on diffusion-induced stress. J. Appl. Phys. 2010, 107, 103516. [Google Scholar] [CrossRef]
  65. Hüger, E.; Jerliu, B.; Dörrer, L.; Bruns, M.; Borchardt, G.; Schmidt, H. A secondary ion mass spectrometry study on the mechanisms of amorphous silicon electrode lithiation in Li-ion batteries. Z. Phys. Chem. 2015, 229, 1375–1385. [Google Scholar] [CrossRef]
  66. Li, J.C.-M. Physical chemistry of some microstructural phenomena. Metall. Trans. A 1978, 9, 1353–1380. [Google Scholar]
  67. Zang, J.-L.; Zhao, Y.-P. A diffusion and curvature dependent surface elastic model with application to stress analysis of anode in lithium ion battery. Int. J. Eng. Sci. 2012, 61, 156–170. [Google Scholar] [CrossRef]
  68. Uxa, D.; Hüger, E.; Schmidt, H. Li diffusion in thin-film LiySi electrodes: Galvanostatic intermittent titration technique and tracer diffusion experiments. J. Phys. Chem. C 2020, 124, 27894–27899. [Google Scholar] [CrossRef]
  69. Hertzberg, B.; Benson, J.; Yushin, G. Ex-situ depth-sensing indentation measurements of electrochemically produced Si–Li alloy films. Electrochem. Commun. 2011, 13, 818–821. [Google Scholar] [CrossRef]
  70. Kuznetsov, V.; Zinn, A.-H.; Zampardi, G.; Borhani-Haghighi, S.; La Mantia, F.; Ludwig, A.; Schuhmann, W.; Ventosa, E. Wet nanoindentation of the solid electrolyte interphase on thin film Si electrodes. ACS Appl. Mater. Interfaces 2015, 7, 23554–23563. [Google Scholar] [CrossRef] [PubMed]
  71. Gao, F.; Hong, W. Phase-field model for the two-phase lithiation of silicon. J. Mech. Phys. Solids 2016, 94, 18–32. [Google Scholar] [CrossRef]
  72. Ronneburg, A.; Silvi, L.; Cooper, J.; Harbauer, K.; Ballauff, M.; Risse, S. Solid Electrolyte Interphase Layer Formation during Lithiation of Single-Crystal Silicon Electrodes with a Protective Aluminum Oxide Coating. ACS Appl. Mater. Interfaces 2021, 13, 21241–21249. [Google Scholar] [CrossRef] [PubMed]
  73. Strafela, M.; Fischer, J.; Music, D.; Chang, K.; Schneider, J.; Leiste, H.; Rinke, M.; Bergfeldt, T.; Seifert, H.; Ulrich, S. Dependence of the constitution, microstructure and electrochemical behaviour of magnetron sputtered Li–Ni–Mn–Co–O thin film cathodes for lithium-ion batteries on the working gas pressure and annealing conditions. Int. J. Mater. Res. 2017, 108, 879–886. [Google Scholar] [CrossRef]
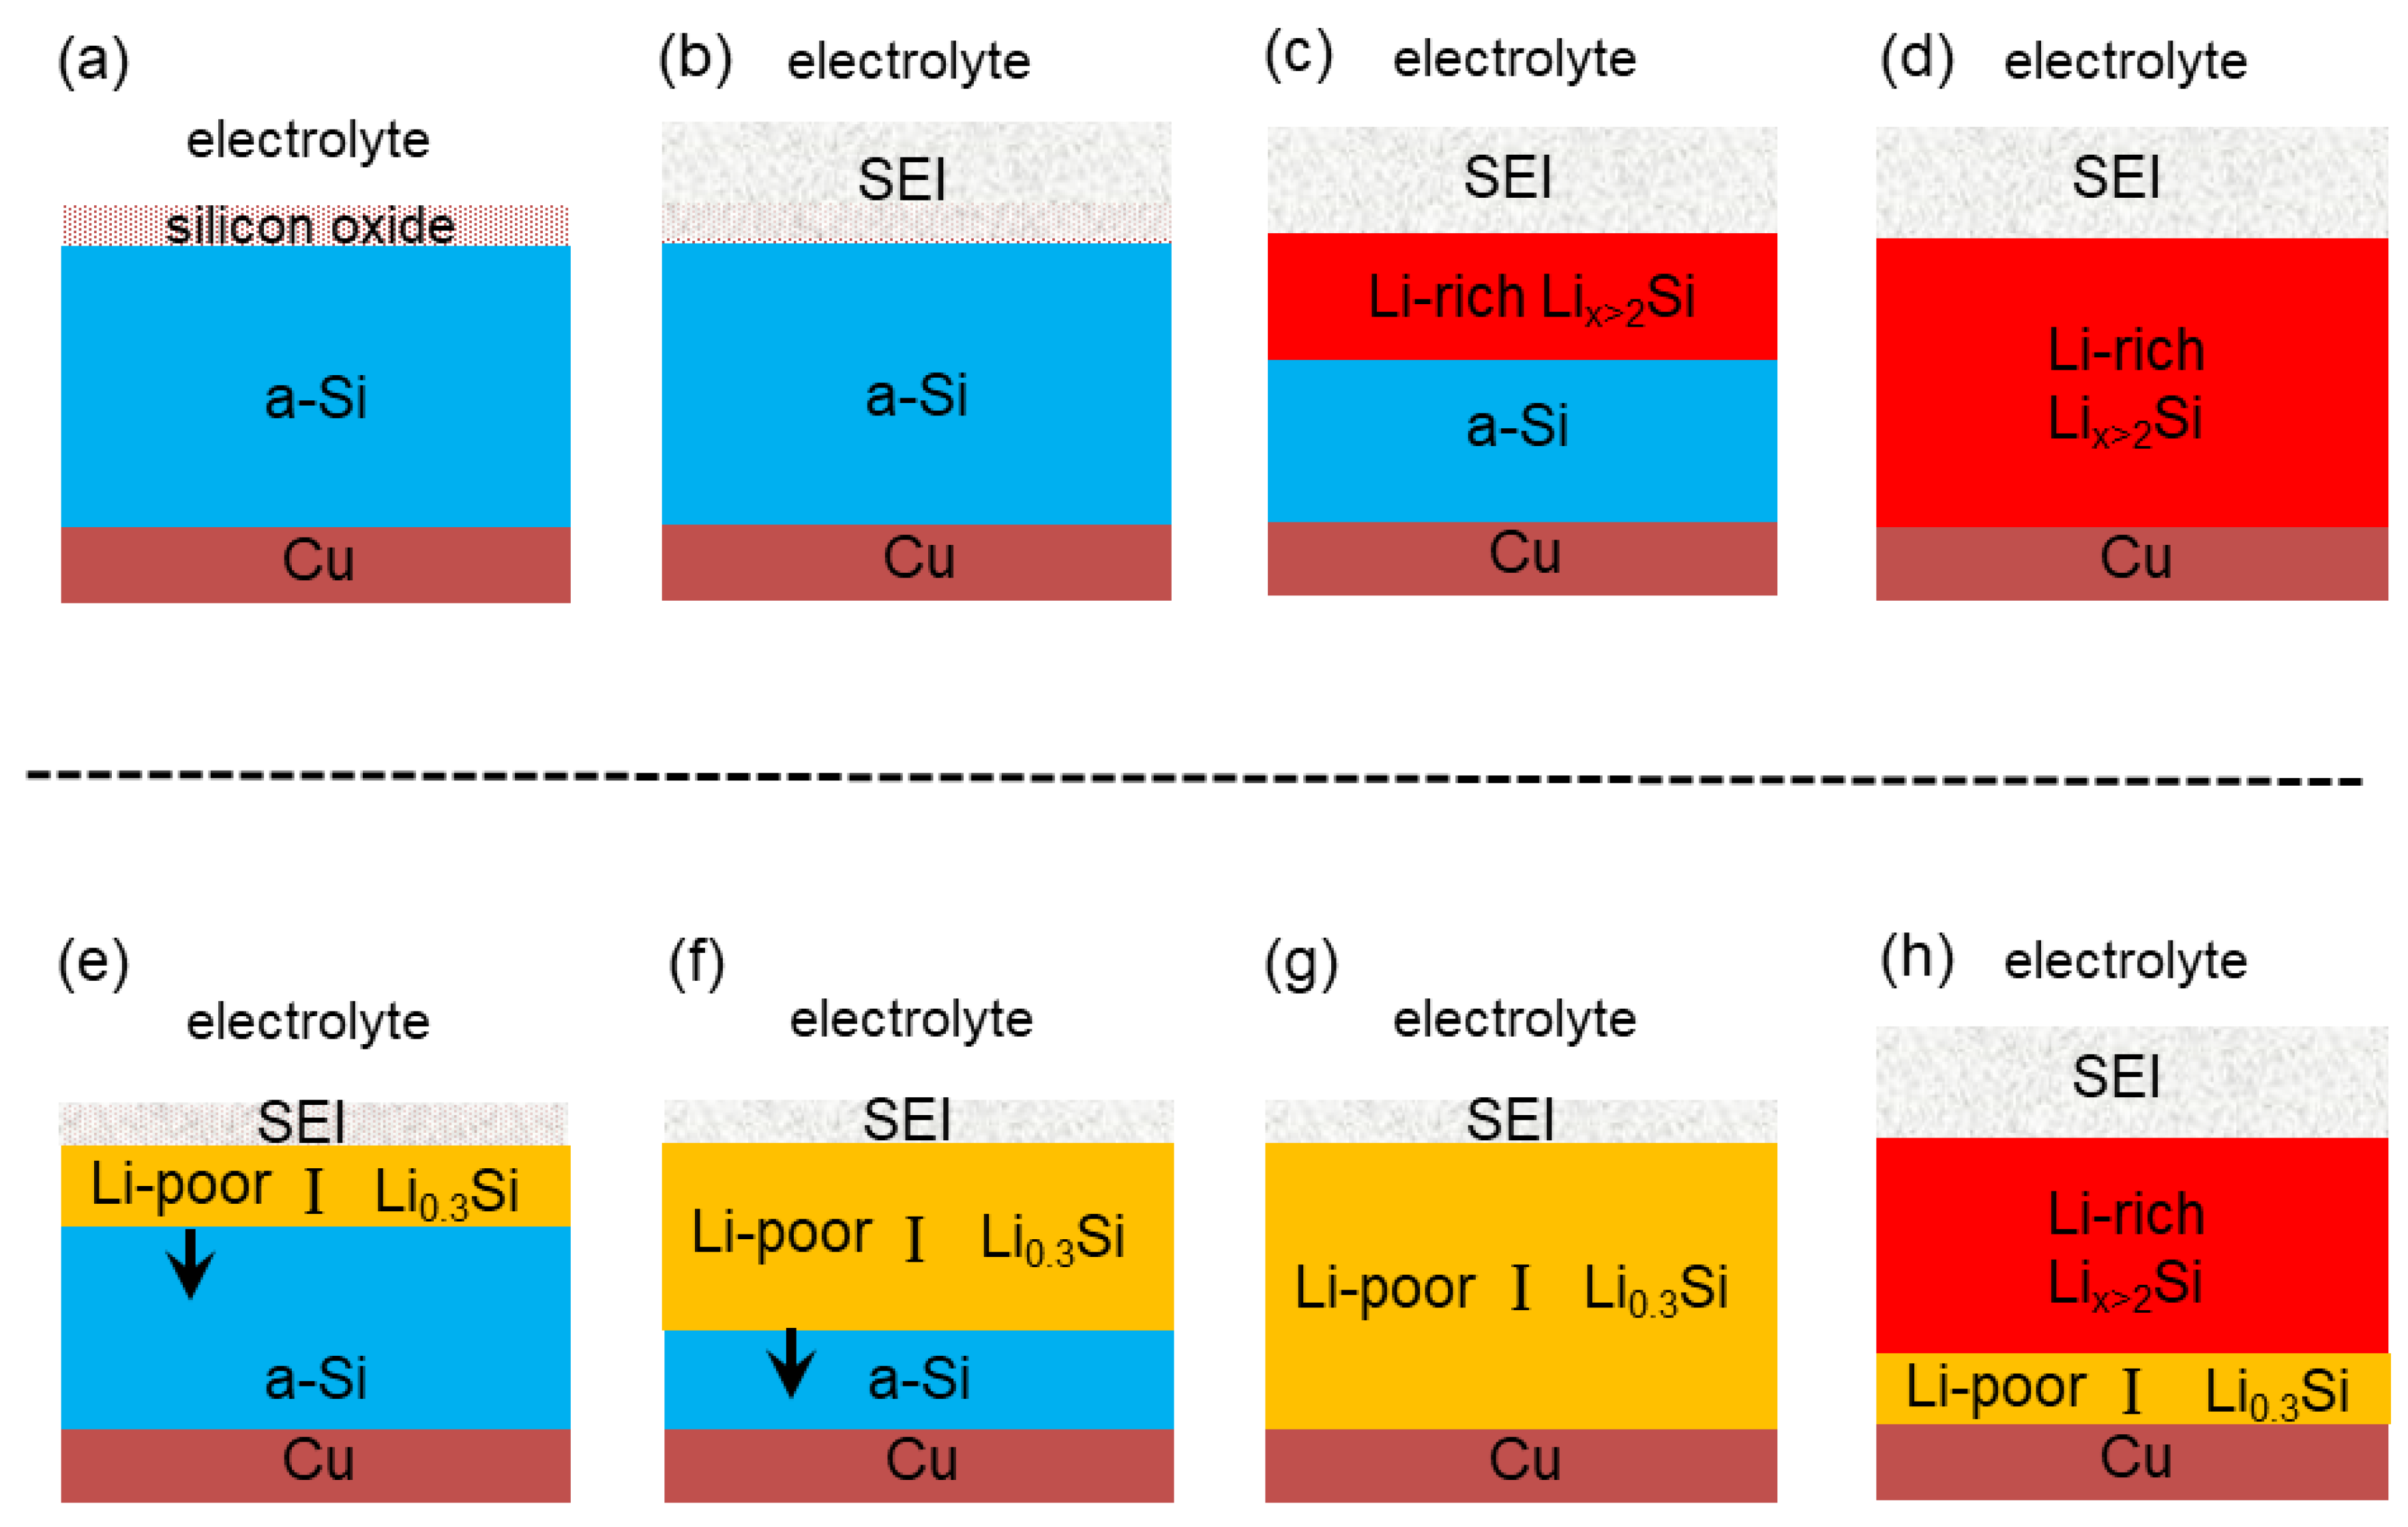
Figure 1. Schematic of two possible lithiation mechanisms (with and without a Li-poor silicide phase) of an a-Si film in the first lithiation process, summarizing the introduction section of this work. Shown are cross sections of the Si film (blue) during the lithiation of the first cycle. The copper current collector is marked with brown. (ad) Schematic of the lithiation process of the a-Si film according to the conventional consensus without the formation of the Li-poor phase. (a) Virgin silicon film electrode, i.e., before lithiation. The native surface oxide is approximatively 2 nm thick. The copper current collector is very thick (well above 1 µm). The thickness of the a-Si film can be 1 µm or less. (b) Lithiation onset corresponding up to 10% state of charge (SOC) where firstly a solid electrolyte interphase (SEI) layer (marked with marbled gray) grows on un-lithiated silicon. The thickness of the SEI layer is considered to be some tens of nanometers (e.g., ~30 nm in reference [1]). (c) Further lithiation produces only a Li-rich lithium silicide (LixSi with 2 < x < 3.75) underneath the SEI layer. (d) At full lithiation, the Li-rich layer reaches the current collector. (eh) Schematic of the lithiation process in the presence of a Li-poor phase (yellow) as discussed in the present work. (e) The lithiation onset may produce an SEI layer (e.g., the reduction of the native surface oxide layer (panel (a)), but of lower extent than in panel (b). (eg) A Li-poor region (Li0.3Si) builds up during the lithiation onset which corresponds to the Li+ uptake marked with roman number I in Figure 2. The lithiation process I continues until all silicon is converted into a Li-poor phase (panel (g)) at approximatively 10% SOC. The main part of the Li+-uptake I in Figure 2 is not consumed for the SEI formation but for the lithiation of amorphous silicon [1]. (h) The rest of the Li-poor phase remains sandwiched between the current collector and a Li-rich phase. The SEI layer becomes thicker at the end of the lithiation process.
Batteries 09 00105 g001
Figure 2. Variation in Si electrode potential with lithiation time during the first lithiation process of an a-Si thin film of 230 nm thickness at a constant current density of 11 µA/cm2. Unpublished experimental data collected by the authors of the present work.
Batteries 09 00105 g002
Figure 4. Schematic of Li diffusion in an a-Si thin film electrode at (a) stage 0, and (b) stage I with the formation of Li-poor phase Li0.3Si (α phase) and a phase boundary (reaction front), ξ. In a cylindrical coordinate (R, Θ, Z), lithium diffuses into the thin film from the surface of Z = Z0 and the thin film is fixed on the substrate at Z = 0. The pristine un-lithiated silicon is denoted as β phase.
Batteries 09 00105 g004
Figure 5. Schematic of the Li concentration distribution at two different stages during the lithiation of the Si thin film.
Batteries 09 00105 g005
Figure 6. Temporal evolutions of (a) the normalized concentration and (b) the radial stress at the center of the top surface of the Si thin film at stage 0; spatial distribution of (c) the radial stress and (d) the normalized concentration along the film thickness at the end of stage 0.
Batteries 09 00105 g006aBatteries 09 00105 g006b
Figure 7. Spatial variations of (a) normalized Li concentration, and (b) radial stress along the thickness direction at the axisymmetric axis under different total C-rates at the end of stage 0.
Batteries 09 00105 g007
Figure 8. Spatial variations of (a) normalized concentration, and (b) radial stress along the thickness direction at the axisymmetric axis for different positions of the interface at stage I. (Total C-rate: 1/14 C).
Batteries 09 00105 g008
Figure 9. Variations of (a) radial stress at the center of the top surface, and (b) the volumetric change of the Si thin film with SOC at stage I. (Total C-rate: C/14).
Batteries 09 00105 g009
Figure 10. (a) Temporal variation in the phase-interface position under different total C-rates, and (b) variation of the moving speed of the reaction front with total C-rate, and a Si film thickness of 230 nm.
Batteries 09 00105 g010
Table 1. Material properties and parameters used in the numerical calculation.
SymbolParameterNumerical Value
DαDiffusion coefficient in α phase1.5 × 10−20 m2·s−1
DβDiffusion coefficient in β phase1.5 × 10−20 m2·s−1
Z0Initial thickness of the silicon thin film200 × 10−9 m
c ^ e q α Normalized equilibrium value of α phase0.08
c ^ e q β Normalized equilibrium value of β phase0
EElastic modulus92 GPa [69]
νPoisson’s ratio0.28 [70]
ΩPartial molar volume8.18 × 10−6 m3·mol−1 [71]
CmaxMaximum concentration3.67 × 10−5 mol·m−3 [33]
RGas constant8.314 J·mol−1·K−1
TAbsolut temperature300 K
Disclaimer/Publisher’s Note: The statements, opinions and data contained in all publications are solely those of the individual author(s) and contributor(s) and not of MDPI and/or the editor(s). MDPI and/or the editor(s) disclaim responsibility for any injury to people or property resulting from any ideas, methods, instructions or products referred to in the content.