Article

Battery Internal Temperature Measurement Using LC Resonant Tank for Battery Management Systems

by
Desmon Simatupang
*,
Abdulraouf Benshatti
and
Sung-Yeul Park
Electrical and Computer Engineering Department, University of Connecticut, Storrs, CT 06269, USA
*
Author to whom correspondence should be addressed.
Batteries 2023, 9(2), 104; https://doi.org/10.3390/batteries9020104
Submission received: 21 December 2022 / Revised: 24 January 2023 / Accepted: 31 January 2023 / Published: 2 February 2023
(This article belongs to the Special Issue Maximizing the Use of Batteries of Electric Vehicles)

Abstract

:
This paper suggests an embedded battery impedance measurement based on an Inductor Capacitor (LC) resonant tank to measure the battery’s internal temperature for battery management systems (BMS). The purpose of the BMS is to provide state-of-charge (SoC) balancing and the preheating mechanism at sub-zero temperatures. Battery Impedance Spectroscopy (BIS) for battery internal temperature measurement is achieved by an LC resonant tank connected to the batteries in parallel to induce created resonant current and voltage into the battery. The peaks of the voltage and current waveforms are measured and recorded. Then, the resistance of the battery can be calculated by comparing the peak voltage and current waveforms. Since the resistance of the battery is affected by the battery’s internal temperature, the internal temperature of the battery can be estimated. The benefit of using the LC tank for the battery’s internal temperature is to reduce data processing since no window and Fast Fourier Transform (FFT) is needed for this method. In addition, the proposed method measures the battery’s internal temperature without any internal or external temperature sensor. Power Simulation (PSIM) simulation software is used in this proposed method. Panasonic batteries 18650 and a dSPACE DS1104 are used for the experiment to verify the proposed method. The proposed method shows that the LC resonant tank can measure three batteries B1, B2, and B3 internal resistance with 17.87%, 18.14%, and 17.73% errors compared to the Frequency Response Analyzer (FRA). In addition, the total time needed for balancing is 400 s, and the total energy consumed by the preheating mechanism is 0.214%/°C to preheat the lithium-ion batteries (LIBs) from −5 °C to 10 °C.

1. Introduction

The battery as an energy storage system is an emerging technology nowadays. The development of battery energy storage systems (BESS) has been increasing significantly. The total BESS energy deployed globally was 11 GWh in 2017 and increased to 100–167 GWh by 2030 [1]. Within usage, such as grid applications [2,3], electric vehicles [4], and electric aircrafts [5], utilize BESS to store and deliver energy when the loads require it. Lithium-ion batteries (LIB) have a larger demand in the world market compared to other batteries. The LIB has a longer lifespan, lower maintenance, higher energy density, and is more efficient compared to other batteries [6].
The main concept being investigated is how the aging of LIBs due to charge and discharge cycles and high current fast charging. This will provide insights into the safety and reliability of BESS systems. To measure the battery’s reliability, the manufacturers assume that if the LIB capacity is reduced by 20% of its initial or rated capacity, the LIB is in end-of-life (EOL). This is due to the fact that the capacity reduces rapidly after EOL [7]. To increase the battery’s safety, battery management systems (BMS) are utilized to make sure there is no over-charging or over-discharging of each battery. In this case, battery balancing based on the BMS is needed. In addition, the BMS should monitor the internal temperature of the battery to mitigate thermal runaway and the performance of LIB. This internal temperature measurement is required to maintain the LIB’s lifetime and maximize the use of LIB.
Despite the extreme growth of LIB, there are limitations to estimating the LIB internal temperature rapidly and effectively. The main functions of LIB, such as aging [8,9], safety [8], and performance [8,9], are extremely affected by temperature. Ref. [8] found that the LIB’s capacity was reduced by 98.75% at −40 °C. This means the performance decreases significantly, and the LIB does not generate maximum energy to the load. Moreover, since the LIB’s impedance increases, the heat generated by the internal resistance can reduce the LIB’s lifetime. In [9], the author explained how LIB degradation also accelerates with temperature, which can damage LIB at high temperatures and reduce performance at low temperatures. Ref. [10] explained that the LIB’s thermal runaway is affected by electrical abuse, such as overcharge, and heat abuse, such as high environmental temperatures. The ability to estimate the LIB internal temperature during the operation as early detection is a necessary function of BMS. This is due to the non-linear behavior of LIB, which can reduce performance at low temperature and trigger thermal runaway at high temperature. Moreover, in electric mobility applications such as electric vehicles, the LIB’s internal temperature estimation is urgently needed since there is extreme fluctuation of temperature during winter and summer. Consequently, the ability to track and measure the LIB’s internal temperature for BMS as early detection is critical to maintain the LIB’s lifetime and maximize the use of LIB.
The existing methods for measuring the LIB internal temperature use a temperature sensor mounted on the surface of the LIB [11,12]. Surface-mounted thermistors or thermocouples are common strategies for estimating the surface temperature of LIB. The data show that the temperature sensor can detect the surface or the external temperature of the LIB, but it cannot detect the LIB’s internal temperature. Moreover, in certain scenarios, for high current charging and discharging, the LIB internal temperature is significantly different compared to the surface temperature. Ref. [13] suggested a pulse resistance approach by calculating the load fluctuations based on the load profile. This method is promising, but the sensing board needs to be sensitive, and the probability of achieving pulse load can depend on the applications. Ref. [14] proposed an optic cable, Fiber Bragg Grating (FBG), to measure the LIB’s internal temperature. However, it needs to be put inside battery cells. Another temperature measurement approach is to use mathematical model-based estimators [15]. The mathematical model provides a way to apply the general laws of thermodynamics to an LIB. However, this method has a high computation, and additional information needs to be added before the equation can model the thermodynamic law.
Normally, the models are described using different types of observer-based methods, as they can account for nonlinear dynamic behaviors and the variation of uncertainties [16]. This method is promising; however, data processing is burdening the LIB internal temperature. In addition, as prediction precision highly depends on the aforementioned parameters, parameterization test data need to be done for all possible scenarios, such as high charging and discharging, at low and high temperatures to be sufficiently representative. To accommodate the LIB internal temperature measurement, electrochemical impedance spectroscopy (EIS) based on an Inductor Capacitor (LC) resonant tank is proposed in this paper.
EIS [17] is the method used to inject current or voltage into the LIB and measure the response of voltage or current in the LIB terminal. The voltage and current data can be used to estimate the LIB lifetime since the battery resistance is influenced by the LIB internal temperature. Scientists have proposed some EIS methods to measure LIB’s impedance. The common method [12] is to use a frequency response analyzer (FRA) to measure LIB impedance. This method gives high accuracy; however, this method is costly and bulky since this method needs a commercial analyzer. In addition, this method cannot be utilized as an online impedance measurement due to the fact that the LIB needs to be unplugged from the systems and connected to the analyzer before testing.
There are many papers describing the impedance characteristics of LIB with an increase in temperature [18]. Observations of SoC-independence and temperature-dependence of the charge transfer resistance (Rct) and ohmic resistance (Rohm) were also reported in [19,20]. The charge transfer is an intrinsic property of almost all Li-ion cells that transforms a solvated Li+ in the electrolyte on both sides of the electrode. The resistance associated with the charge transfer process derives the indicator to measure the LIB internal temperature. However, estimating Rct and Rohm requires a wide range of frequency impedance measurements and curve fitting of the collected data to an electrical equivalent circuit model (ECM).
The authors of [21], as shown in Figure 1a, used the BMS topology to measure the LIB’s impedance. However, the data processing of windows [21] and Fast Fourier Transform (FFT) of the impedance measurement burden the BMS. Furthermore, data acquisition (DAQ) is needed to process the data from the voltage and current sensing board. The authors of [22], as shown in Figure 1b, proposed embedded impedance spectroscopy into a bidirectional battery charger/converter. This method injected the sinusoidal current into the LIB during charging or released the sinusoidal current into the load during discharging, and measured the voltage and current responses from the LIB. The voltage and current data were processed (voltage and current peak, angle estimation, and frequency) to estimate the LIB impedance. However, this method burdens the data processing and needs an additional control modification in the bidirectional battery charger/converter since the sinusoidal signal is formed by the converter. Moreover, during the discharging mode, the load can be affected by the ripple injected by the battery.
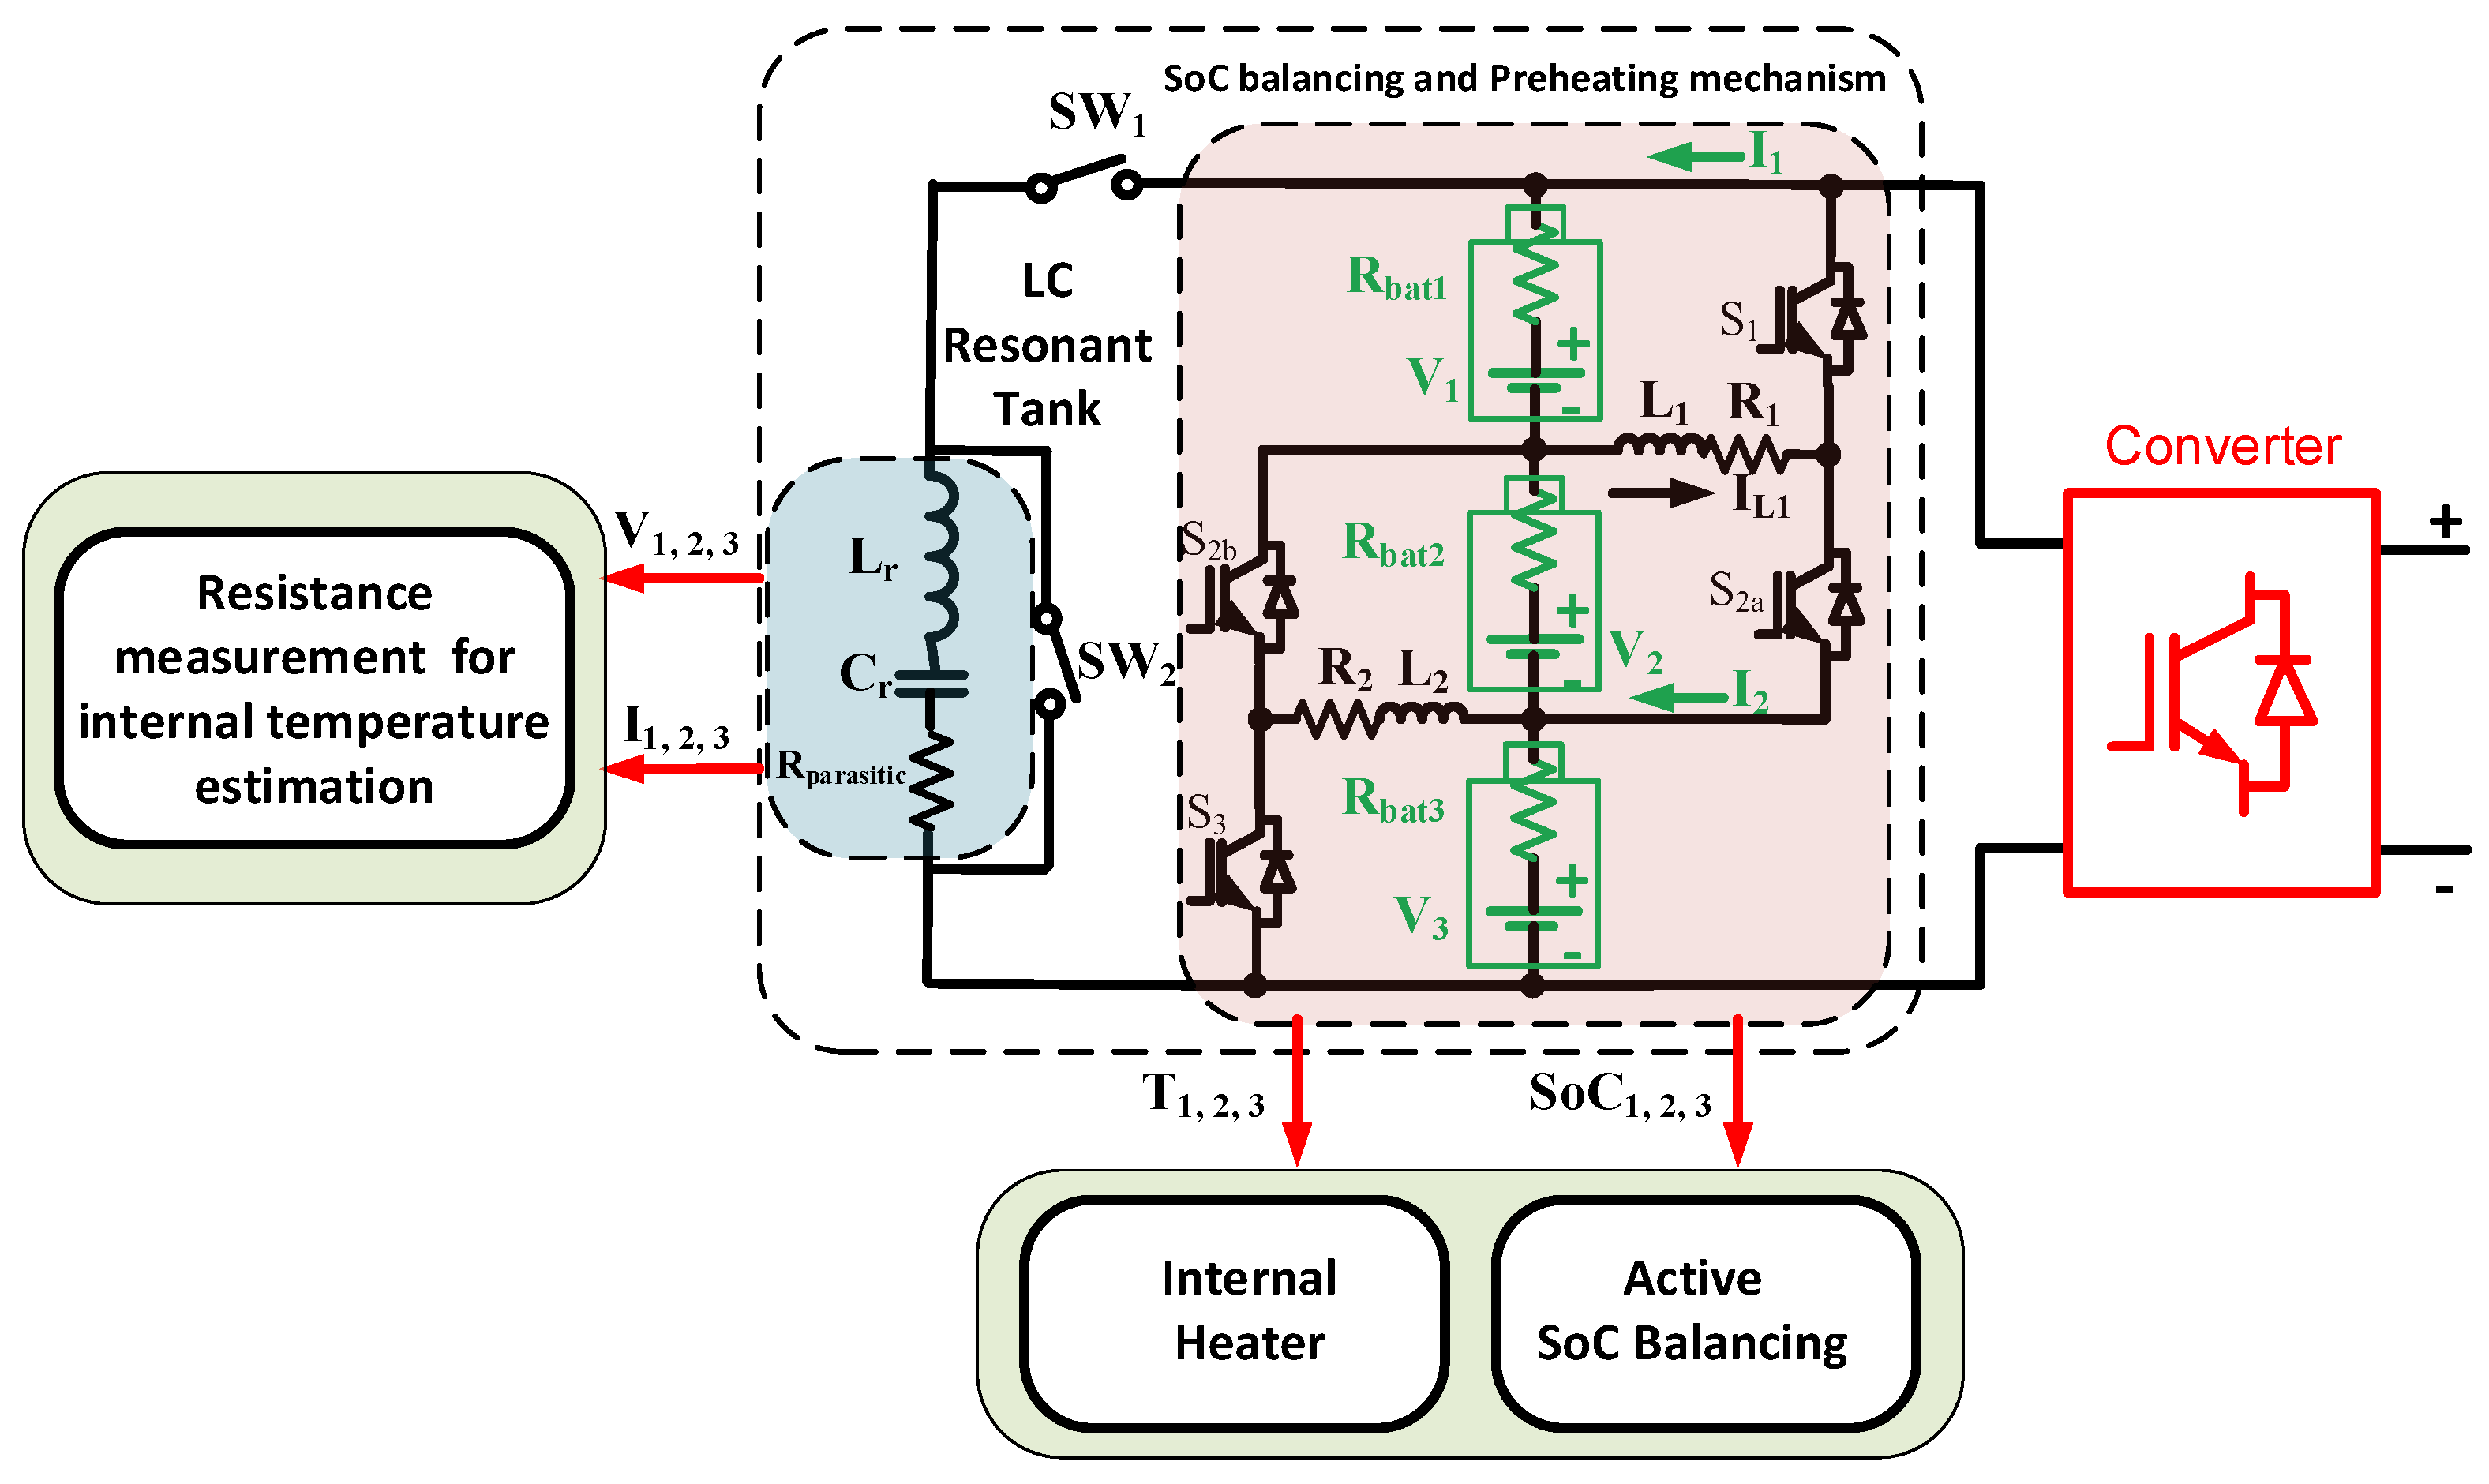
This paper proposes an internal resistance measurement using an LC resonant tank [23] to estimate the LIB internal temperature for the BMS, as shown in Figure 2. The LC resonant tank will inject an oscillation current into the battery pack due to the resonation of the inductor and capacitor. The voltage in the terminal batteries responds to the current depending on the internal resistance of the batteries. The voltage and current will be measured, and the battery’s internal resistance can be obtained. The LIB internal temperatures can be estimated based on the LIB internal measurements. Since there is no phase angle between voltage and current estimation, Fast Fourier Transform (FFT) is not needed. Data processing needs to detect the first cycle of the voltage and current peak only. In addition, the heating mechanism, and the state-of-charge (SoC) balancing modes can be used with the same topology. The internal preheating mechanism mode exists to warm up the battery at a temperature lower than zero. This is due to the LIB impedance behavior, which can be far higher at low temperatures compared to room temperature. The active SoC balancing mode equalizes the SoC level in each LIB. This strategy is to ensure no over-charging or under-charging of the LIBs. Moreover, SoC balancing helps to simplify the impedance measurement, since the LIB’s impedance data depend on the SoC level.
The advantages of the proposed paper are based on the following:
  • A new method to measure the LIB’s resistance for LIB internal temperature measurement based on an LC resonant tank.
  • The proposed LC resonant tank for LIB resistance measurement reduces data processing since windows and FFT are not needed.
  • To integrate the LC resonant tank into the BMS.
This paper is organized as follows: Section 2 describes the method of the LC resonant tank method, the preheating mechanism, and SoC balancing. Section 3 explains the battery management systems used in this proposed method. Section 4 gives the simulation and experimental results to validate the proposed LIB internal temperature measurement method. Finally, Section 5 elaborates the conclusions.

2. Principle of Operation of the Proposed Method

The proposed system, as shown in Figure 2, consists of the LC resonant tank (Lr and Cr) and the BMS components connected in between the LC resonant tank, and batteries 18650. The topology is the inductor ladder, with a series 18650 batteries pack in the middle. The battery pack consists of batteries B1, B2, and B3, and the internal resistance of the LIBs are Rbat1, Rbat2, and Rbat3. Power semiconductor switches S1, S2a, S2b, and S3 are connected in series using a switches ladder topology. The inductors L1, and L2 are connected between the battery and the switch to store the energy from one battery and deliver the energy to another battery during the balancing condition. R1, R2 in this topology is representative of the parasitic resistance in inductors L1, and L2. Due to this parasitic resistance, there will be energy loss during the balancing condition.

2.1. EIS Using LC Resonant

2.1.1. LC Resonant and Frequency Selection

f L C = 1 2 π   L C
Z ( ω ) = j L ( ω 2 ω 0 2 ω )
where, fLC is the resonant frequency, L is the inductance in the inductor, C is the capacitance in the capacitor, Z(ω) is the impedance in the angular (ω) frequency, ω0 is the angular frequency at the resonance frequency, j is the imaginary unit, and ω is the frequency of the LC resonant tank. The parasitic resistance is neglected in (1).
An LC tank is utilized to inject the battery with an oscillating voltage and current, which will be used for the LIB internal resistance measurement. Simply, the LC resonant tank is an inductor (Lr) and capacitor (Cr) connected in series in this topology. The series LC resonant tank is chosen since the impedance of the LC resonant tank is lower compared to the parallel LC resonant tank. Therefore, the peak current can be sensed with high accuracy. After being fully charged, the LC resonant tank injects a damped oscillating voltage and current at a specified frequency to the LIB. This frequency, fLC, is the resonant frequency that can be calculated using (1) as a simplified model. It is shown in (2) that the impedance reaches its minimum when the frequency becomes the resonant frequency. Moreover, (1) can be changed based on the parameters included in the analysis, such as the parasitic of the Lr and Cr and the connector parasitic.
During the first positive stage, when switch one (SW1) is turned on, the current flows from the battery to the LC resonant tank to charge the capacitor and produce an underdamped oscillation current that can run back into the Li-ion batteries, as shown in Figure 3a. The impedance is minimum, and the current is maximum at the resonant frequency, as shown in Figure 3b. To dissipate the resonant energy in the LC tank, switch two (SW2) is turned on, and SW1 is turned off. Thus, the LC tank energy is dissipated by the parasitic resistance in the LC resonant components.
Consider a signal injected from the battery, as shown in Figure 3, where the parasitic resistance (underdamped signal decay) is included in (1), and the resonant frequency and the underdamped factors are
ω = 1 L C R t o t a l 2 4 L 2    
α = R t o t a l 2 L
where, α is the damping factor, and Rtotal is the total parasitic resistances in the battery, inductor, and capacitor. The underdamped condition is achieved when the α < ωLC (angular resonant frequency).
The solution of the differential equation for the underdamped oscillation current (Io) and voltage (Vo) at the capacitor terminal is
I ( t ) = I 0   e R t o t a l 2 L t   s i n   ( ω t θ )
V c ( t ) = 1 C I ( t ) d t = V 0   e R t o t a l 2 L t   c o s   ( ω t θ )  
where t is the time to charge or discharge.
Due to the behavior in the LC resonant tank, where the inductor and capacitor cancel each other’s reactance, by comparing the peak battery voltage and current, the resistance of the battery can be determined using (7)
R b a t t ( ω ) = V 0 ( ω ) I 0 ( ω )  
The resonant frequency selection is the most important component used in estimating ohmic and charge transfer resistance. Ref. [24] demonstrated that the Rct has a strong relationship with temperature, while it is independent of SoC level. Even though at higher temperatures, the film of the Solid Electrolyte Interphase (SEI) layer becomes thicker, the Rct resistance decreases [25]. In [26], the authors mentioned that the Rohm has less effect on the SoC, but it is affected by the internal temperature of the cell due to the sensitivity of the electrolyte diffusion rate on the internal temperature. These findings were validated by others [27,28]. Therefore, the LC resonant frequency should also cover the Rohm and Rct. In this paper, the resonant frequency is 56 Hz, which is suitable for tracking the battery Rohm and Rct as shown in Figure 4.

2.1.2. Voltage and Current Peak Estimation and Accuracy

To estimate highly accurate peak voltage and current, the voltage and current sensors and the data processing capabilities need to be investigated. The hardware in the loop (HIL) used for this proposed method is dSPACE DS1104. The Analog Digital Converter (ADC) capability of Hardware-in-the-loop (HIL) is 16-bit for the multiplexed channels, and in the parallel channels, it has 12-bit only. The HIL voltage range is ±10 V. Due to the higher capability of the multiplexed channels compared to the parallel channels (4.88 mV/bit), the multiplexed channels are deployed to investigate the proposed method. In addition to that, the HIL has more than an 80 dB signal-to-noise ratio. The multiplexed channels are used to verify the proposed method.
The voltage sensor utilized in this proposed method is INA154U/2k5 with a maximum low gain error of ±0.05%. The initial offset voltage is 750 µV, which is insignificant compared to the peak resonant voltage. The output voltage noise is 1.83 nV with a slew rate of 14 V/µs, which can oversee a 560 Hz resonant pulse without any issue. The current sensor used to verify this proposed method is ACS712, with a low-noise analog signal path and a sensitivity of 100 mV/A. The sensitivity slope is 0.007 mV/A/°C, with which the current sensor can detect a high slope current. The total output error is ±1.5%. Since the offset can be controlled directly from data processing in HIL, clipping, or an offset circuit are not needed in this proposed method.
For the oscilloscope measurement, the voltage probe is Tektronix TPP0101, with a specification of 10 MΩ input resistance and 100 MHz bandwidth capability. Compared to the damped oscillation frequency, the maximum propagation delay of Tektronix is far smaller; thus, this delay can be neglected. For the offset and clipping method, voltage and current probes can be adjusted to achieve zero initial conditions. Therefore, there is no additional offset or clipping method. As a current probe has a higher AC to DC ratio, the analysis of measurement of the ripple current is easier. The current probe is Yokogawa 701933, with 50 MHz and 30 Arms and a 0.1 V/1 A gains ratio. The propagation delay of the current sensor is 14 ns, which is far smaller; thus, this delay can be neglected.

3. Battery Management Systems

The batteries deployed in this proposed method are LIB 18650, which has the same internal and surface temperatures described in [16]. Thus, the thermodynamical model for the battery’s internal resistance and losses is:
R b a t ( n ) = V m , b a t ( n ) V d c , b a t ( n ) I m
m c   T t = R b a t ( n )   i 2 ( n ) ,   r m s h S ( T T a m b )
P l o s s e s ( n ) ( t ) = Q g e n e r a t e d = R b a t ( n )   i 2 ( n ) , r m s = R b a t t ( n )   ( 1 T   0 t i 2 ( n ) ( t ) d t ) 2
E L ( n ) ( t ) = 1 2   L ( n ) i 2 ( n ) ,   r m s = 1 2   L ( n )   ( 1 T   0 t i 2 ( n ) ( t ) d t ) 2
where m is the LIB’s mass, T is the cell temperature, Tamb is the cell ambient/room temperature, c is the specific heat capacity of the cell, h is the equivalent heat transfer coefficient, Rbat(n) is the internal LIB B(n) resistance, i(n) is the current in LIB B(n), and S is the LIB’s surface area, Plosses(n) is the power used for the heating mechanism in LIB B(n), i(n),rms is the rms current in LIB B(n), and EL(n) is the energy in inductor L(n).
The preheat mechanism condition is activated if the internal resistance based on the LC resonant tank detects the maximum resistance. The balancing condition is triggered during the battery charging or discharging condition, since the balancing is active balancing. For the preheating mechanism, the duty cycle is 0.5 to ensure that all series LIBs have the same energy of heating mode, as described in Figure 5. Figure 5a shows the current flow at the upper loop of the proposed circuit. The current flows from the LIB to the inductor to charge the inductor. When the inductor voltage is higher than the inductor, the current flows back to the LIB. The same current flows occur in the lower circuit, as shown in Figure 5b. Due to the current flows forward and backward, the internal resistance and the electrochemical reaction create heat, as in (9–10). This heat is utilized to preheat the battery during the sub-zero condition. In this case, the rms current and the internal resistance are the main factors that determine how fast the LIBs can be heated up from −5° to 10° Celsius.
The balancing mode is activated when SoC B1, B2, and B3 are not at the same level. If the SoC level is not the same, the higher SoC level LIB will supply power to the other LIBs, which have a lower SoC level. Figure 5a shows the current flow at the upper loop of the balancing circuit. The current flows from the LIB to the inductor to charge the inductor. When the inductor voltage is higher than the LIB, the current flows back to the LIB. The same current flows occur in the lower circuit, as shown in Figure 5b. To make sure the energy is transferred from the higher SoC level to the lower SoC level, the duty cycle is set to 60%. It is different from the preheating mechanism, since the preheating mechanism needs to ensure that the preheating in each LIB is the same. Active balancing ensures that the balancing mode can be operated simultaneously during the charge or discharge load conditions. The duty cycle varies for the SoC balancing condition, and it is based on how much the SoC differs between each LIB. To ensure that the inductor can be protected from high current, the maximum duty cycle is 0.6 to limit the current.

4. Simulation and Experiment Results

The simulation used for this proposed method is PSIM, and the system parameters for the simulation are shown in Table 1. As in Figure 2, three series LIBs are used for the simulation, while two inductors are utilized to store the energy from the LIBs. Figure 6 shows the balancing and preheating modes.
As shown in Figure 6, the heating mechanism duration is the first 100 s. The slope of the SoC level of each LIB is negative due to the losses during the preheating mechanism. In Figure 6a, battery B1 delivers the power to inductor L1, and the current returns to B1 to heat up B1. In the lower circuit, B2 injects power to L1 (with the S1 and S2a are compliment switches) and the current returns to B2 to heat up B2 as shown in Figure 6b. The losses are the energy needed to heat up the battery due to the LIB’s internal resistance. In addition, there are losses due to the parasitic in the L1. When the LC resonant tank detects that the internal resistance is lower than at zero temperature, the preheating mechanism will be stopped.
For the condition after 100 s, the SoC levels are not the same; thus, the balancing is activated. The S1 is triggered on since the B1 has a higher SoC level. L1 will receive energy from the charger and transfer it to the B2 or B3 as shown in Figure 6a for charging conditions. While B1 will be charged slowly due to the S1 being on. For the discharging condition, The S2a is triggered off since the B2 has a higher SoC level. L1 will receive energy from the B2 and transfer it to the B1. Additionally, L2 will receive energy from the B2 and transfer it to the B3 as shown in Figure 6b for the discharging condition. When the SoC levels are the same, the switches are triggered off, and the balancing condition is deactivated. The duration of balancing during charging is 450 s, while balancing during discharging is 550 s.
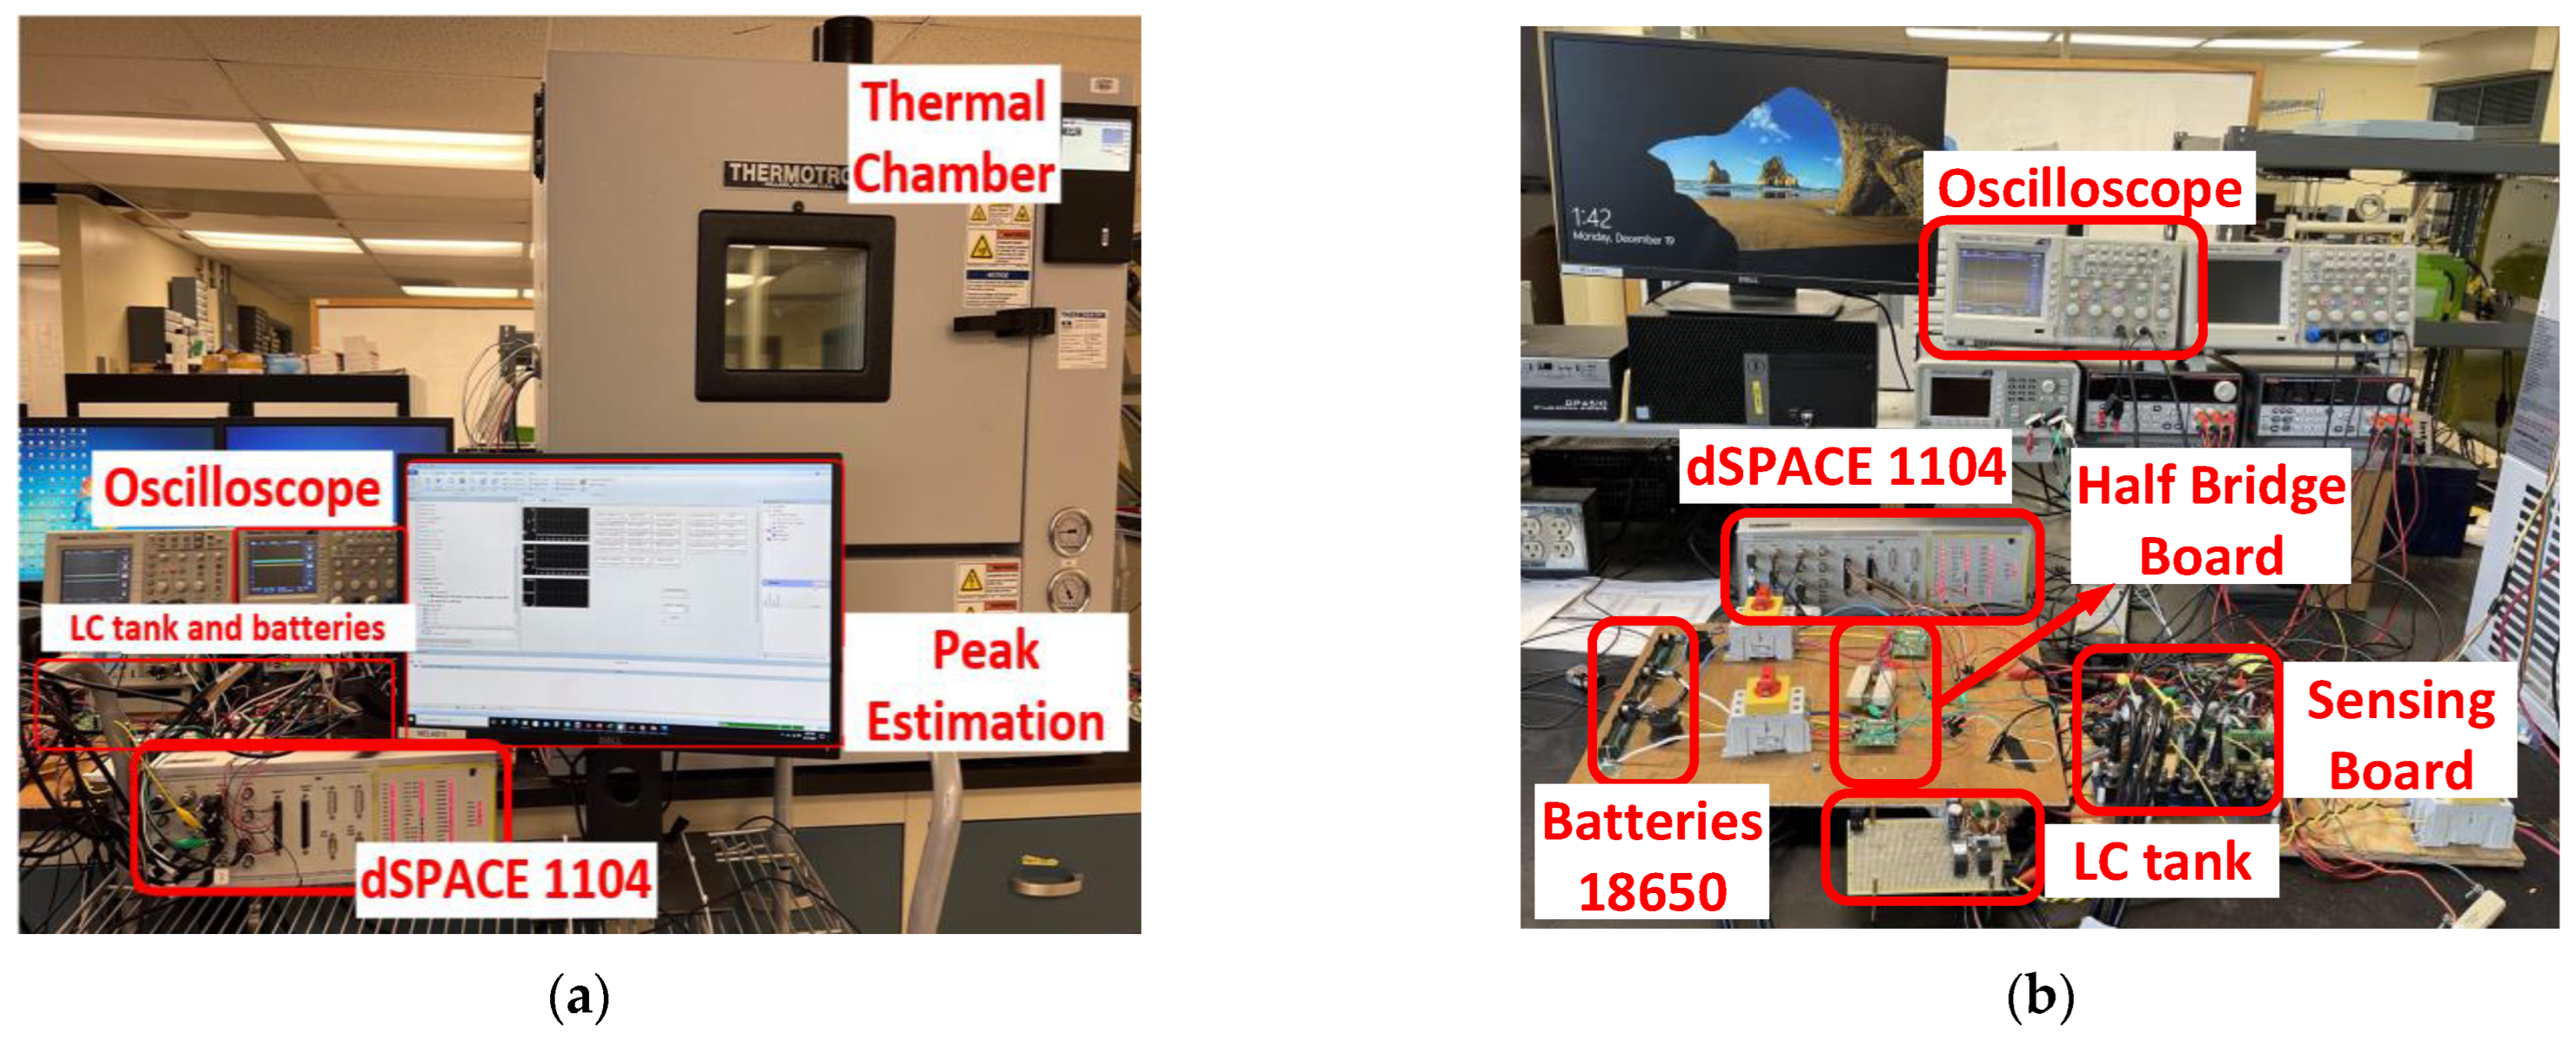
Figure 7 shows the experimental setup of the LC resonant, preheating mechanism, and SoC balancing. Figure 7a shows the testbed for the preheating mechanism. Three LIBs (18650) are placed inside the thermal chamber, and dSPACE 1104 is used to control the preheating mechanism. Two half-bridge boards are used for the inductor ladder converter. The thermal camera FLIR ONE is used to measure the batteries’ body temperature. For balancing and LC resonant tanks, a thermal chamber is not needed. The LC resonant tank for internal resistance spectroscopy is shown in Figure 7b. It has a resonant inductor and capacitor (Lr = 1.4 mH, Cr = 5600 uF), a sensing board, an oscilloscope, and dSPACE 1104. The scope records the current and voltage when the resonant occurs. Afterward, dSPACE 1104 measures the peak of the voltage and current and estimates the resistance. Once the resistance is recorded, it can be used to estimate the batteries’ lifetime.
Figure 8 shows the experimental results of SoC balancing LIBs in series. Figure 8a shows the experimental waveforms of SoC balancing during charging. B2 SoC is 70%, while the SoC in B1 and B3 are 60% and 50%, respectively. The B2 SoC is higher than B1 and B3 SoC, thus the B2 transfers energy to B1, and B3. After B2 and B1 reach the same SoC level, both of B2 and B1 will transfer the energy to B3. The total time needed for balancing is 410 s. Figure 8b shows the experimental waveforms of SoC balancing during discharging. B1 SoC is 70%, while the SoC in B2 and B3 are 60% and 50%, respectively. The B1 SoC is higher than B2 and B3 SoC, thus the B1 transfers energy to B2, and B3. After B1 and B2 reach the same SoC level, both of B1 and B2 will transfer energy to B3. The total time needed for balancing is 400 s.
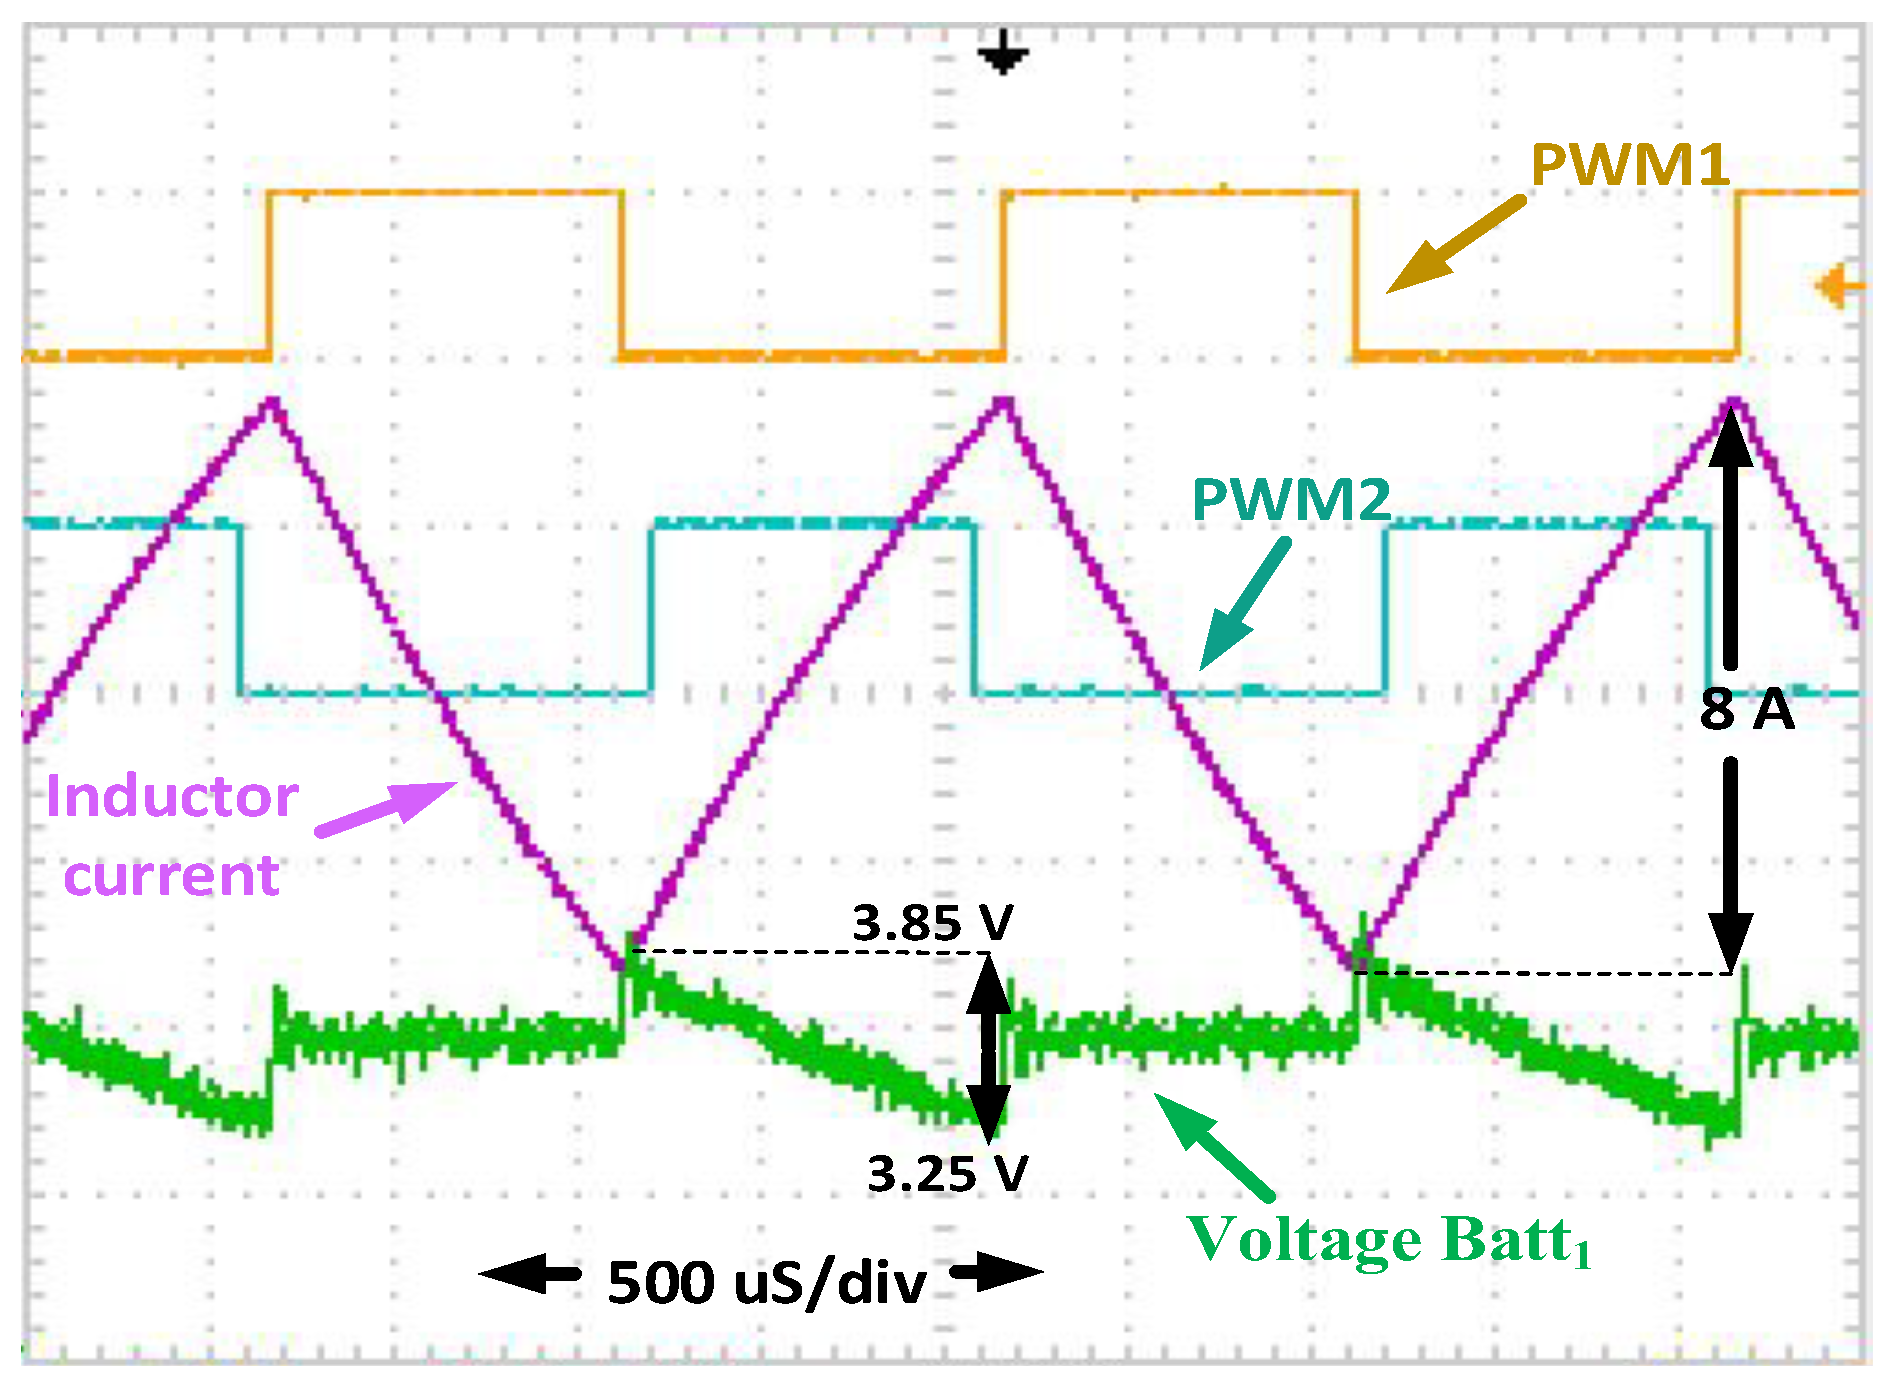
Figure 9 shows the preheating mechanism waveforms. It shows the current through the inductor, PWM1 and PWM2, and the voltage of B1 during preheating. When the PWM1 is turned on and the PWM2 is turned off, the current is circulating in B1. The B1 is discharging L1 when the voltage in B1 is higher than the voltage in L1. When the voltage of L1 is higher than the voltage of B1, the current flows from L1 to B1. It is shown that the inductor current increases and decreases while B1 is charging or discharging. In this condition, the duty cycle is 50% to ensure that the energy is balanced between B1 and L1.
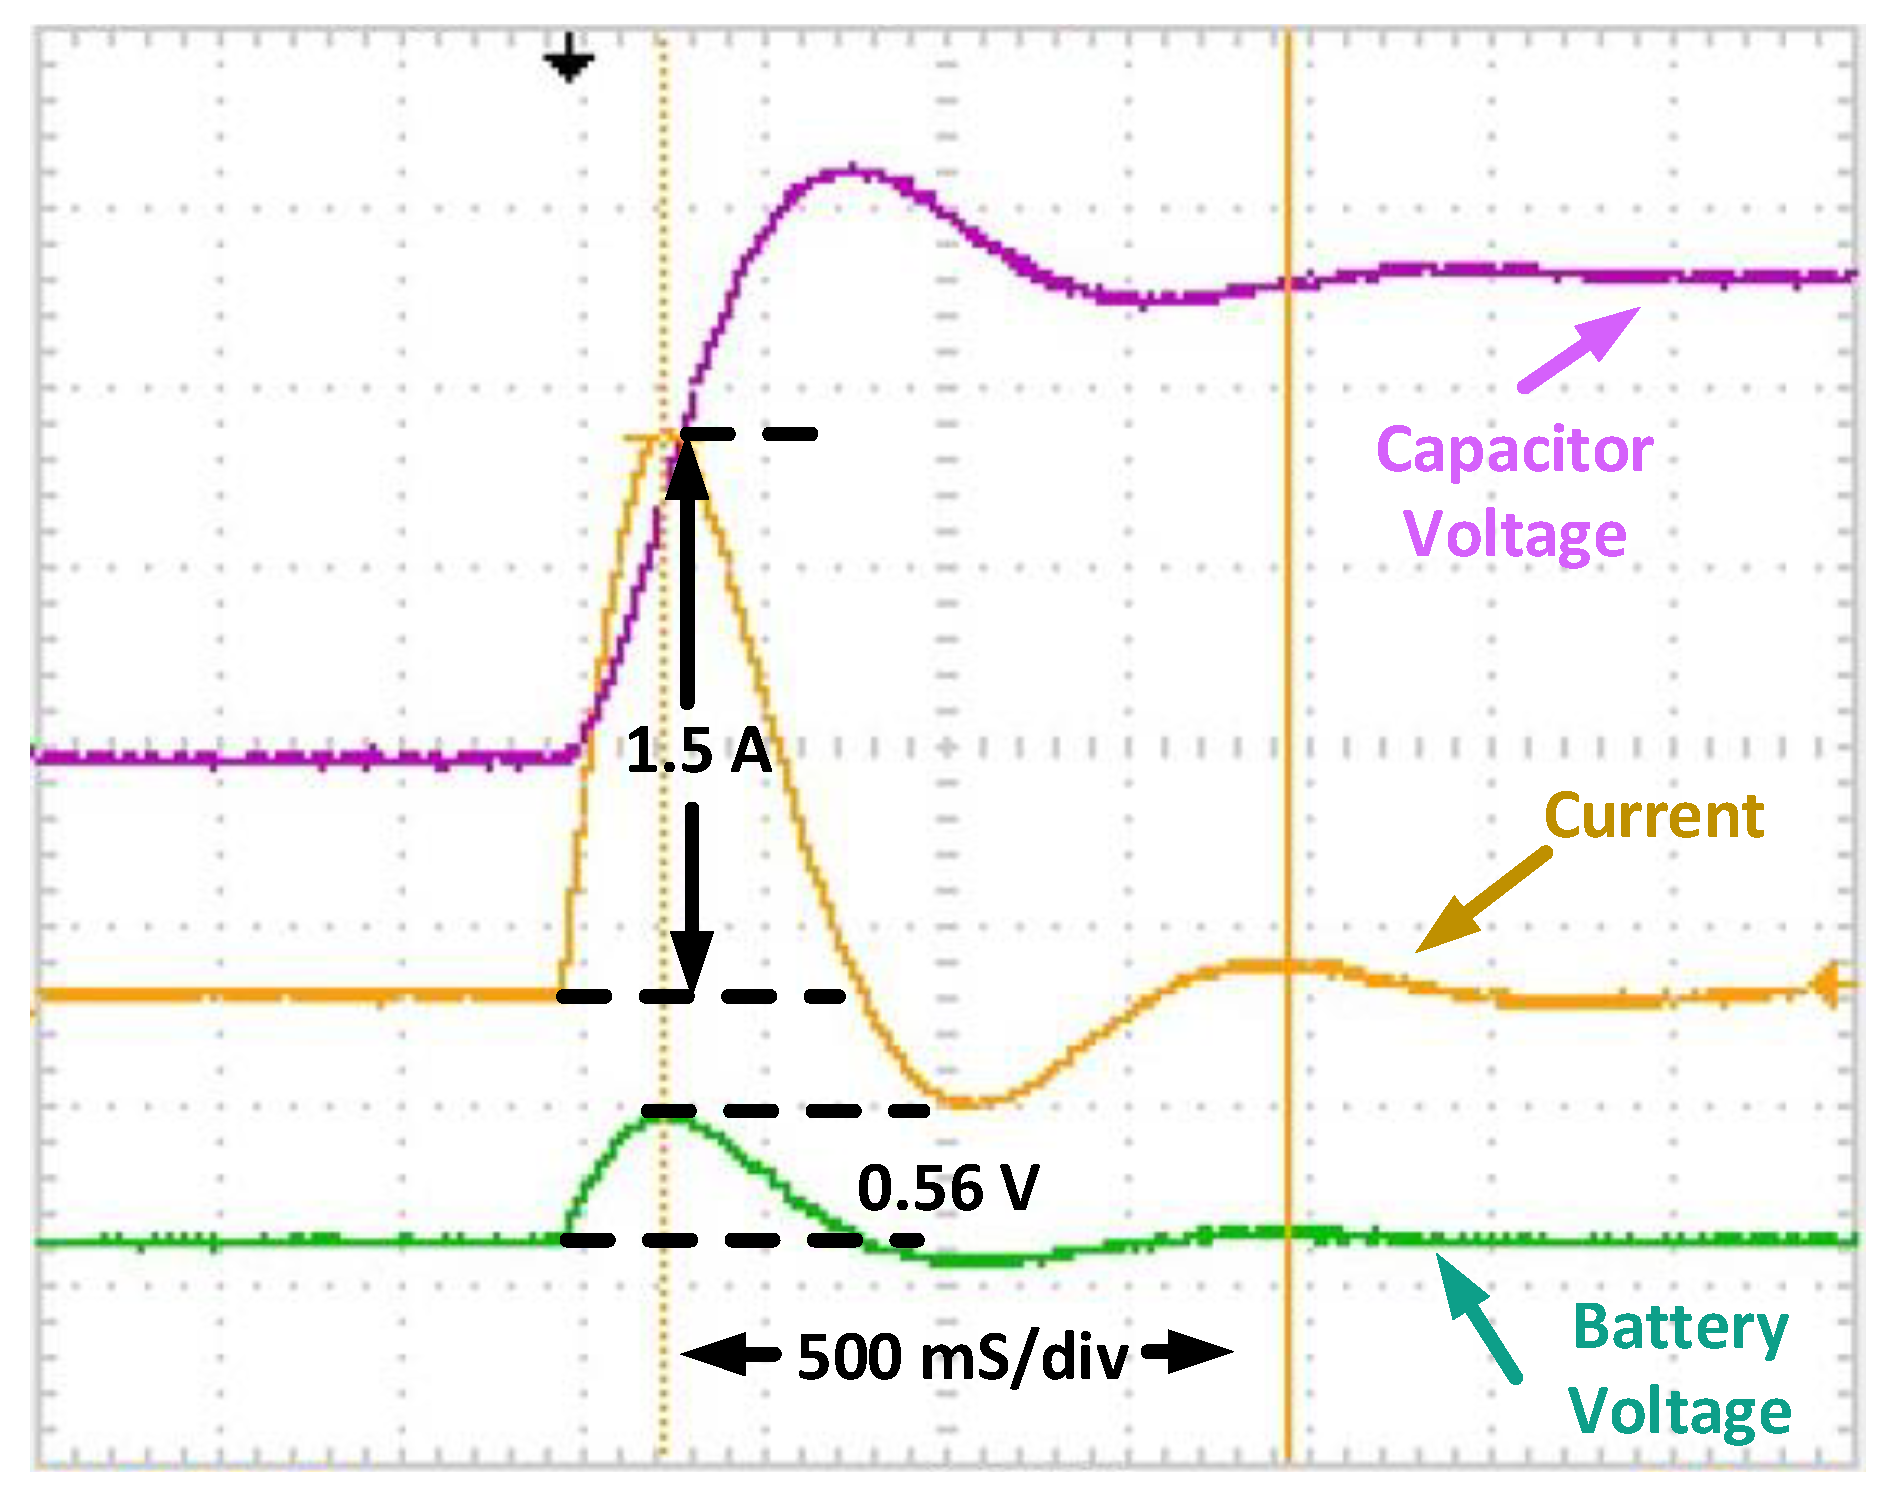
Figure 10 explains the experimental waveforms of LC resonant tank conditions. In this mode, the battery is injecting current into the LC resonant tank, and oscillation occurs at the resonant frequency. The peak current and voltage of the oscillation at the resonant frequency are measured, and the resistance can be calculated from (3 and 7). dSPACE DS1104 is utilized to track the peak and the mean of the current and voltage. Through this, FFT and additional data processing are not needed. Moreover, the LC resonant tank can keep the resonant frequency stable at 56 Hz as a resonant frequency of Lr = 1.4 mH, Cr = 5600. The LIB voltage and current are in phase, with a peak of 3.92 V (or 0.56 V from the rated 2.8 V) and 1.5 A.
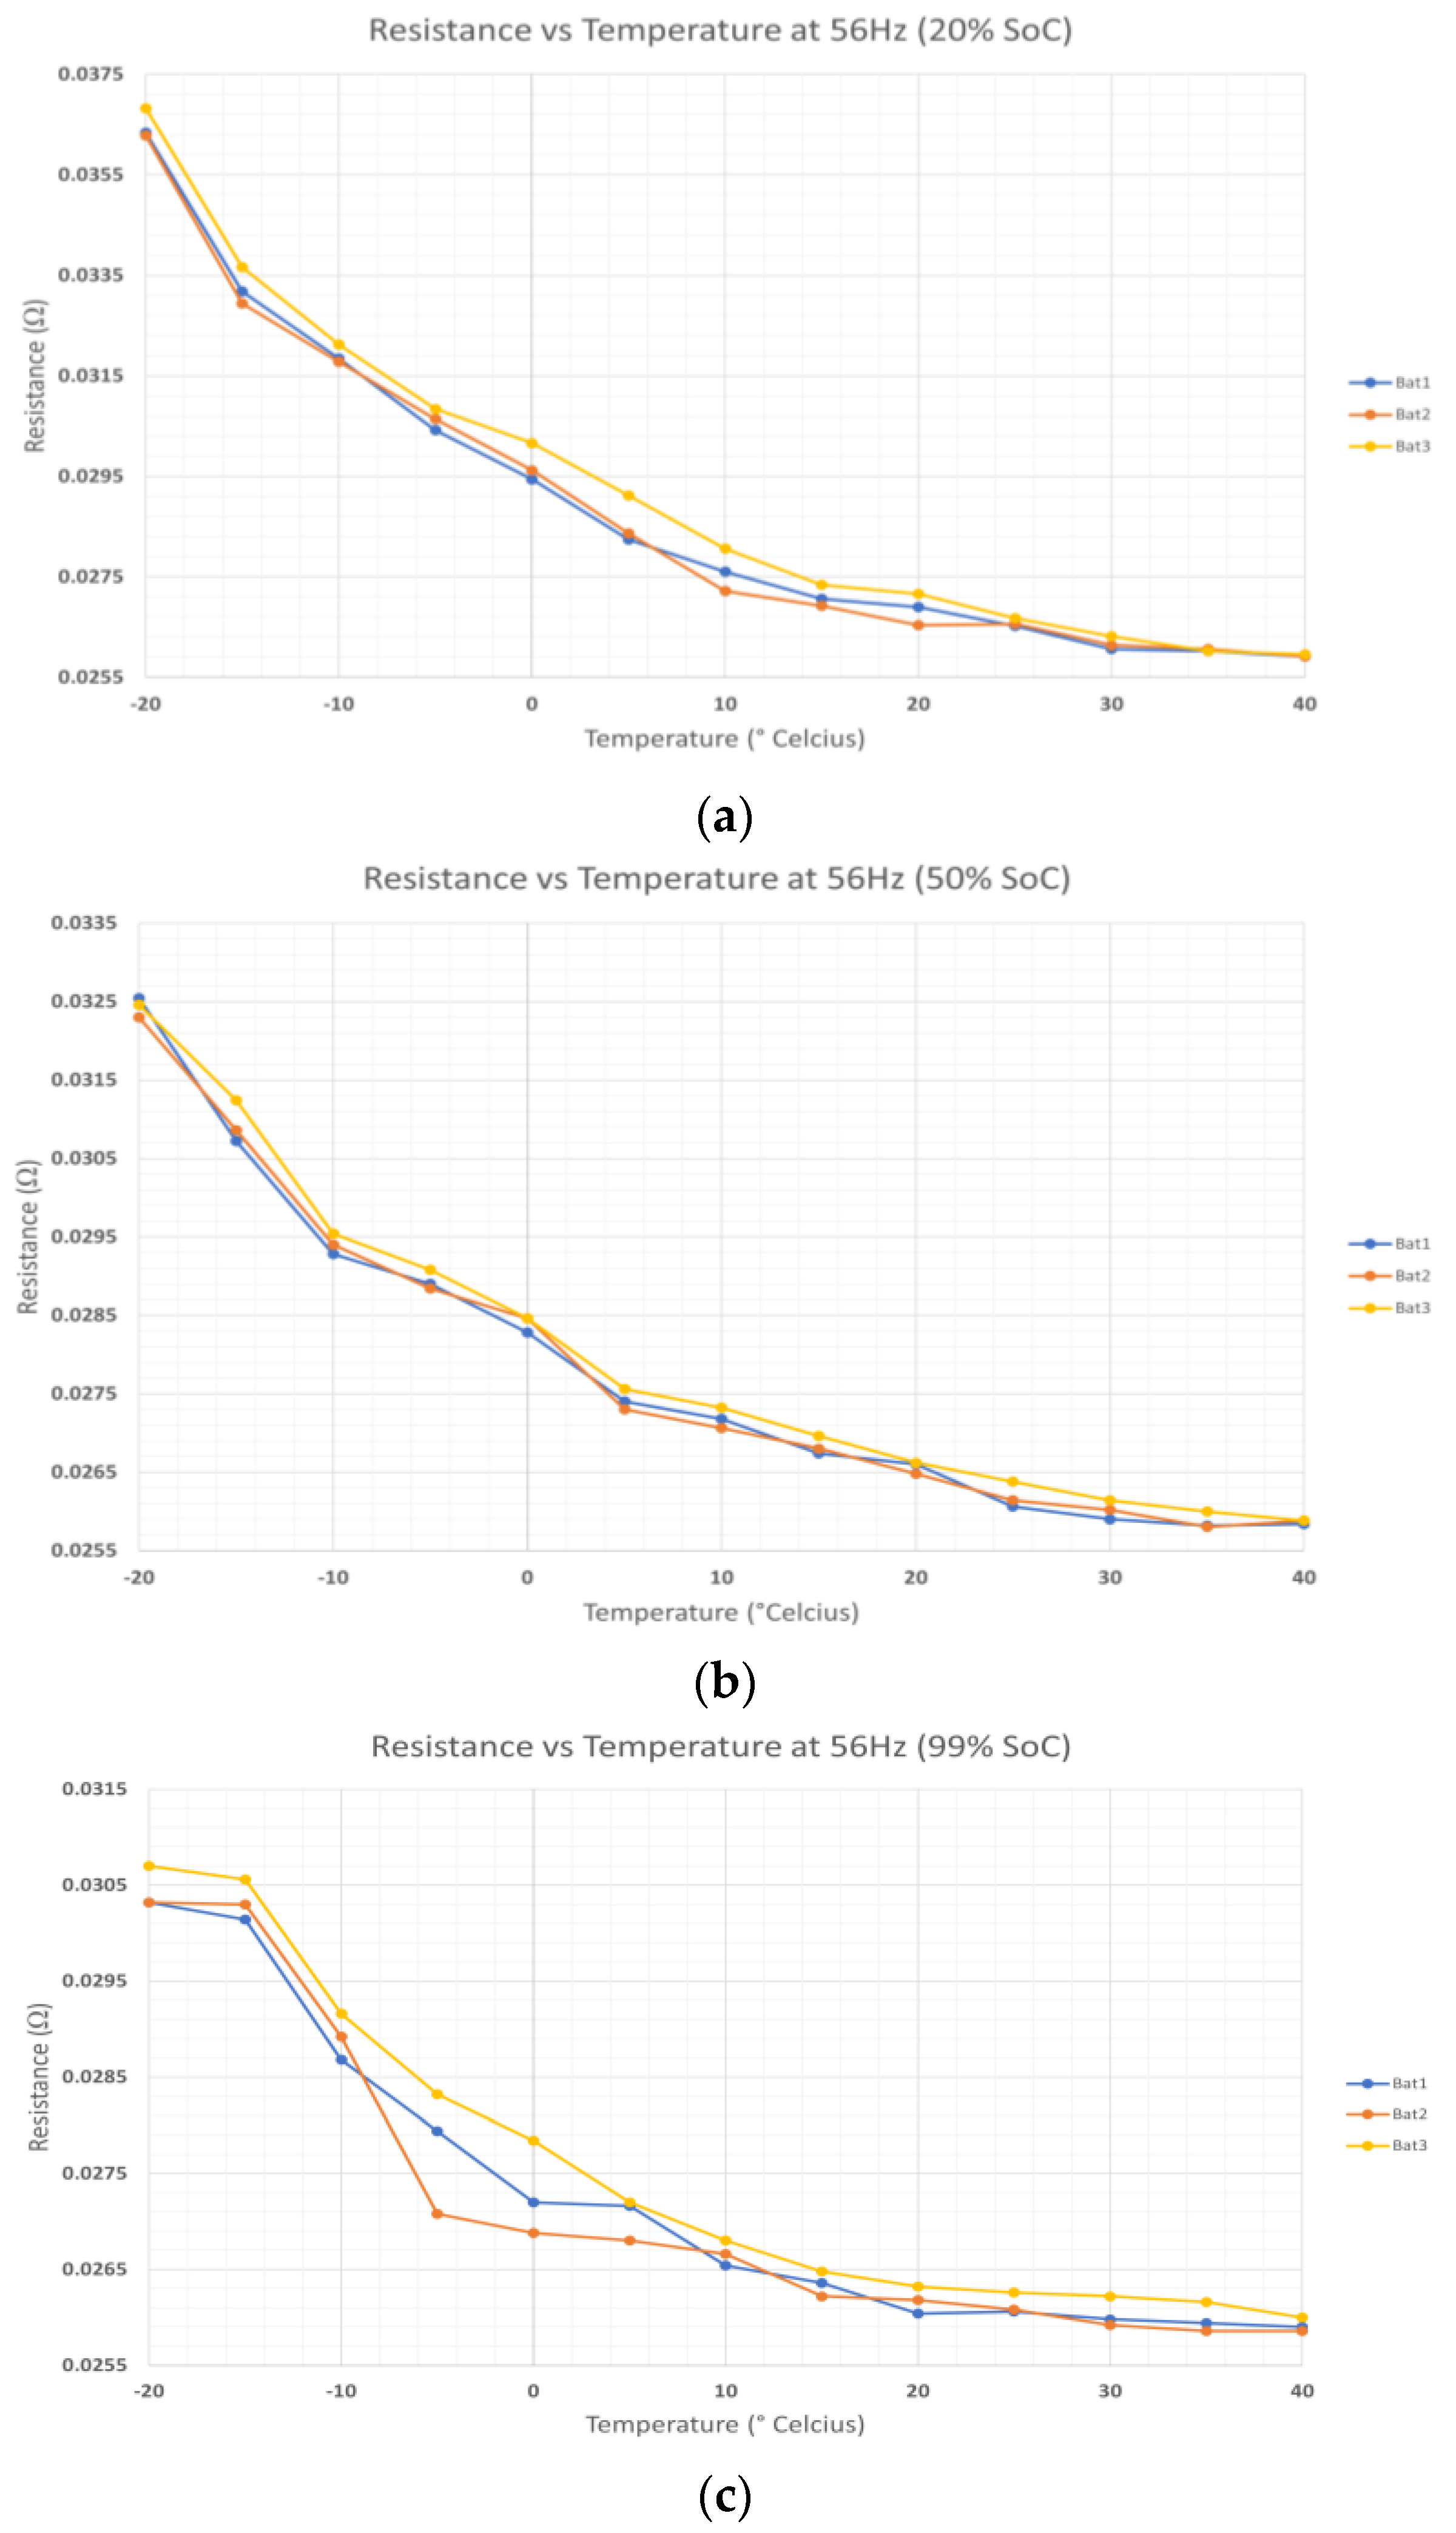
Figure 11 shows the resistance data of B1, B2, and B3. The data are obtained by putting the LIBs inside the thermal chamber to control the temperature. Then, the LIBs are connected to the LC resonant tank and the BMS. The temperature is set from −20 to 40 °C with an interval of 5 °C. The data show that Rohm and Rct are affected by temperature. At low temperatures, Rohm and Rct are higher due to the kinetics of the reactions. In addition, the free ions due to the dissociation of molecule scattering during collisions with the solvent molecules increase the Rohm. While, at high temperatures, Rohm and Rct are significantly lower than at high temperatures. In addition, B3 has the highest resistance compared to the other LIBs at each interval temperature. This can be due to the different characteristics of each battery.
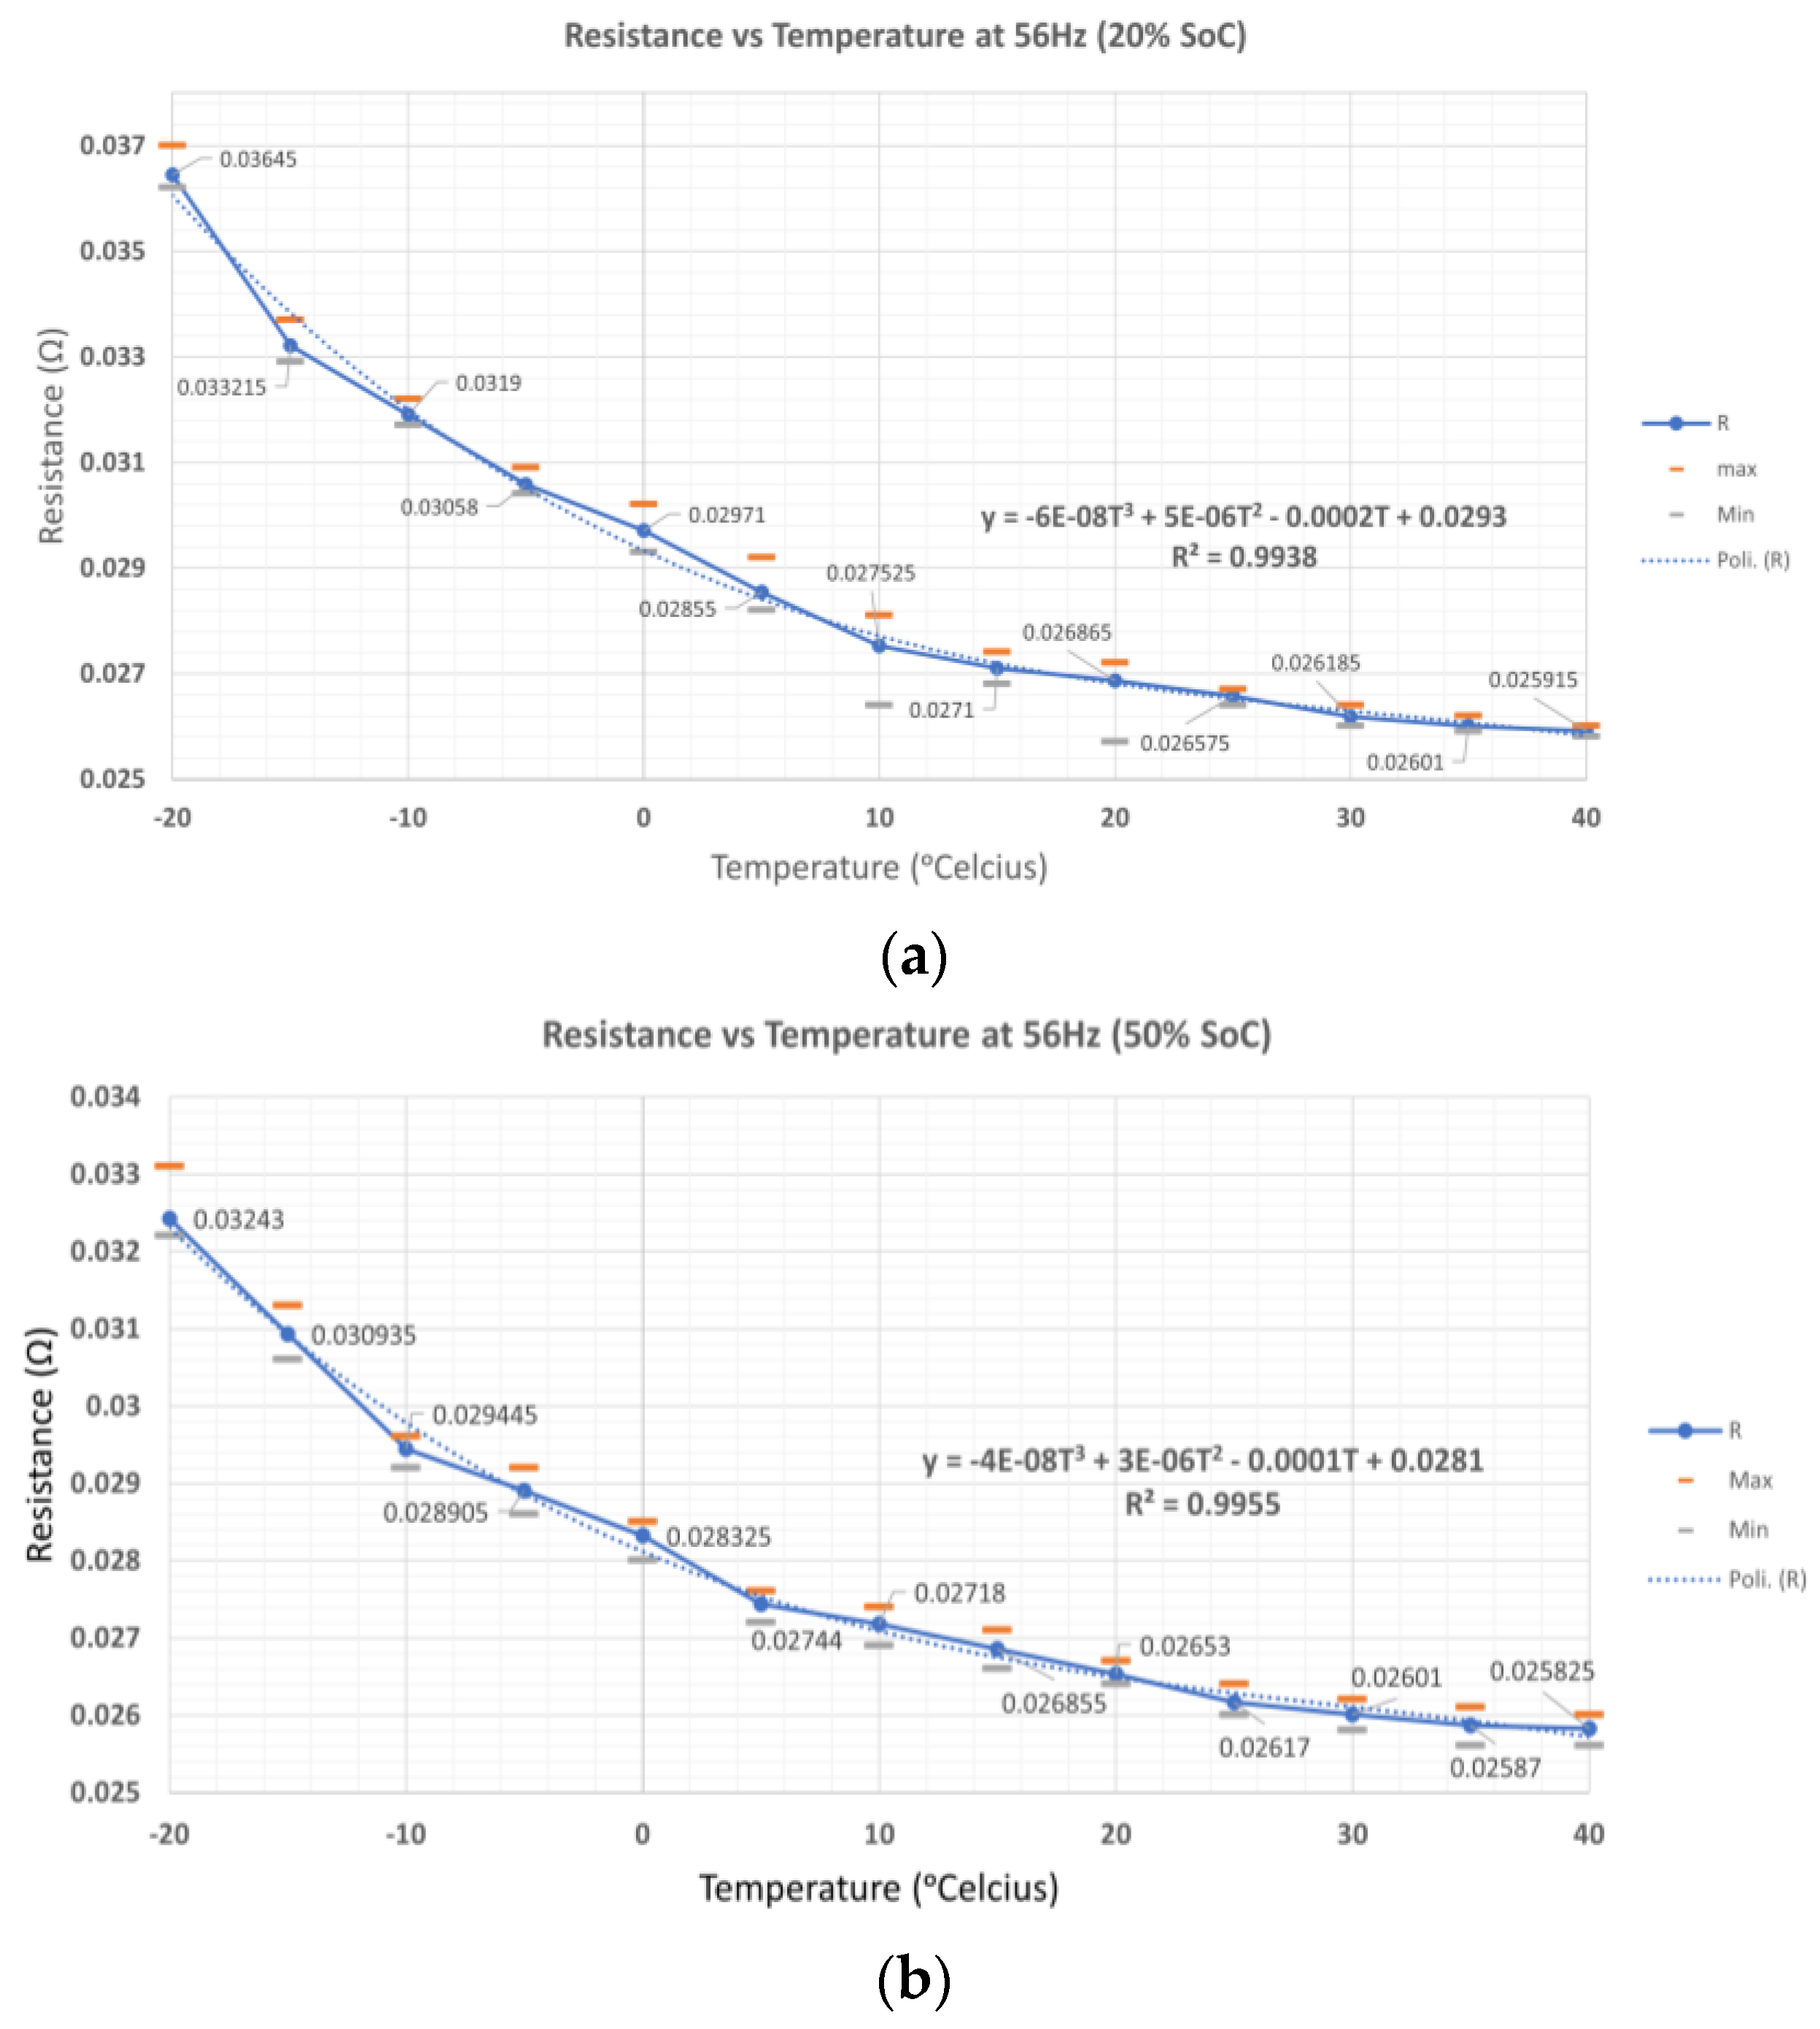
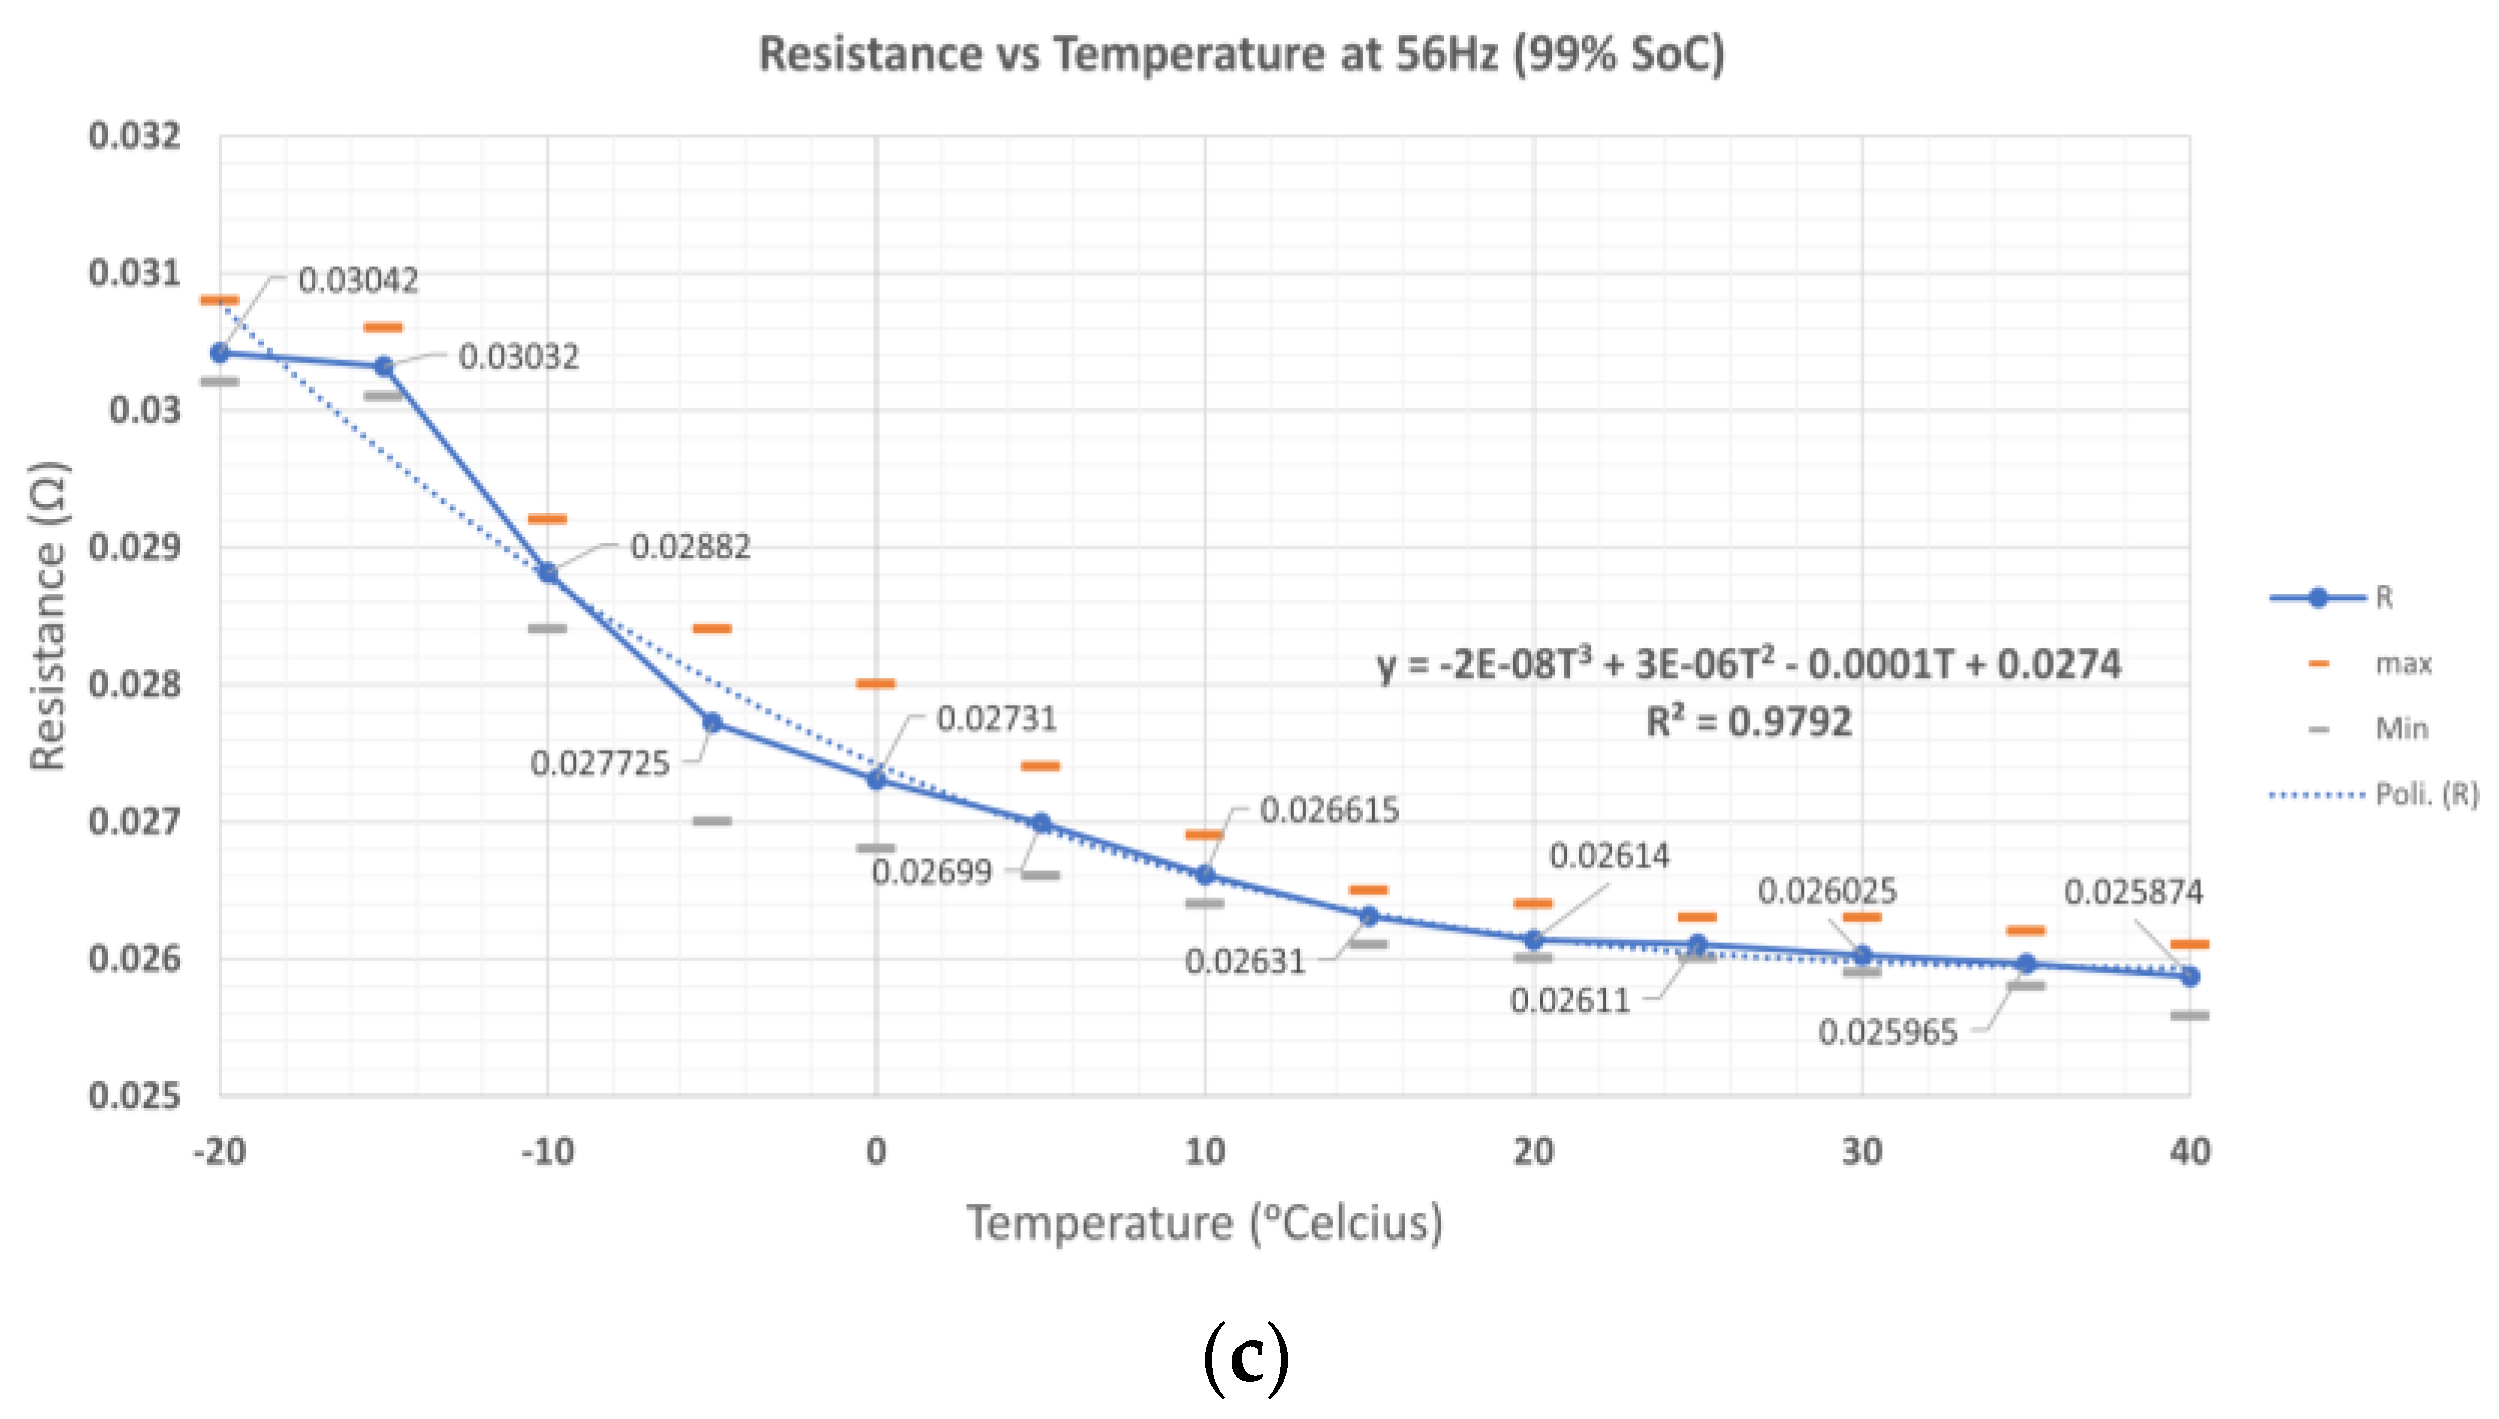
Figure 12 shows the mean values of B1, B2, and B3 and the curve fitting by polynomial fitting. The mean data show that Rohm and Rct are affected by temperature. The curve fitting with order three can fit the data with the coefficient of determination of 0.9928, 0.9955, and 0.9792 at 20%, 50%, and 99% SoC levels, as shown in Table 2. At different SoC levels, resistance is significantly different at low temperatures. At a low SoC level, resistance is higher than at a high SoC level. At high temperatures, the resistance shows a small difference between 20%, 50%, and 99% SoC levels. This condition occurs at a low-frequency point (56 Hz in this case). At low temperatures, the impedance at a higher SoC level will be greater than the impedance at a lower SoC level. Since the coefficient of determination (order three polynomial) is higher at the 50% SoC level, the polynomial curve fitting at this SoC level can be used to measure the LIB internal temperature.
As seen in Table 3, the proposed method can measure the resistance in the LIBs. The 18650 battery is tested by an FRA to validate the resistance data obtained by this proposed method, as shown in Figure 12. This shows that the LC resonant tank can measure B1 and B3 with 17.87% and 17.73% errors compared to the FRA. While B2 has an 18.14% error. This is due to the parasitics in the testbed. The cable resistance and turn-on switch resistance can affect the resistance measurement.
The preheating mechanism is shown in Figure 13. Figure 13a shows the batteries before preheating begins. The thermal chamber temperature is set to −5 °C for 24 h to make sure the electrochemical inside the LIBs are the same as the thermal chamber temperature, as shown in Figure 13a. After 24 h, the preheating mode is activated, and the switches begin to operate with a 50% duty cycle. Figure 13b shows the results after the preheating mode is completed. The preheating duration is 34 min from −5 °C to 10 °C. During the preheating mechanism, there is energy consumption, which can be translated as a capacity loss in the LIBs. The rate of energy loss due to the preheating mode is 0.214%/°C to preheat the LIBs from −5 °C to 10 °C. The rate of energy loss is measured before the preheating condition and after the preheating condition is completed.
Table 4 describes the LC resonant tank method compared to the other methods [21,22,29]. It is shown that the proposed method has less data computation compared with other methods, such as the two-pulse load test, integrated EIS into BMS, and battery charger as an EIS measurement.

5. Conclusions

A compact integrated BIS based on an LC resonant tank, internal self-heating mechanism, and active SoC balancing has been proposed to achieve comprehensive BMS functions. The LC resonant tank creates perturbation in the battery, and the peak voltage and current oscillation will be tracked and measured in order to calculate the internal resistance. Based on the experimental data, resistance is significantly different at low temperatures. At high temperatures, the resistance shows a small difference between 20%, 50%, and 99% SoC levels. The polynomial curve fitting with order 3 shows that the coefficient of determination is 0.9928, 0.9955, and 0.9792 at the 20%, 50%, and 99% SoC levels. The polynomial curve fitting at the 50% SoC level can be used to measure the LIBs’ internal temperature due to the higher coefficient of determination at three-order polynomials. Simultaneously, the BMS can balance the SoC level by controlling the switches in the BMS topology. The total time needed to balance three LIBs is 400 s during charging and discharging. Finally, the BMS has the capability to preheat LIBs under sub-zero conditions. The rate of energy loss is 0.214%/°C to preheat the LIBs from −5 °C to 10 °C.

Author Contributions

Conceptualization, D.S.; methodology, D.S.; software, D.S.; validation, D.S. and A.B.; formal analysis, D.S.; investigation, D.S.; resources, D.S. and A.B.; data curation, D.S.; writing—original draft preparation, D.S.; writing—review and editing, D.S. and S.-Y.P.; visualization, D.S. and S.-Y.P.; supervision, S.-Y.P.; project administration, S.-Y.P.; funding acquisition, S.-Y.P. All authors have read and agreed to the published version of the manuscript.

Funding

This research was funded by the National Science Foundation of under Grant No. 1454578.

Informed Consent Statement

Not applicable.

Data Availability Statement

Not applicable.

Acknowledgments

This work was supported by the National Science Foundation under grant no. 1454578. However, any opinions, findings, conclusions, or recommendations expressed herein are those of the authors and do not necessarily reflect the views of the National Science Foundation.

Conflicts of Interest

The authors declare no conflict of interest. The funders had no role in the design of the study; in the collection, analyses, or interpretation of data; in the writing of the manuscript, or in the decision to publish the results.

References

  1. IRENA. Electricity Storage and Renewables: Costs and Markets to 2030; International Renewable Energy Agency (IRENA): Abu Dhabi, United Arab Emirates, 2017. [Google Scholar]
  2. Lawder, M.T.; Suthar, B.; Northrop, P.W.C.; De, S.; Hoff, C.M.; Leitermann, O.; Crow, M.L.; Santhanagopalan, S.; Subramanian, V.R. Battery Energy Storage System (BESS) and Battery Management System (BMS) for Grid-Scale Applications. Proc. IEEE 2014, 102, 1014–1030. [Google Scholar] [CrossRef]
  3. Simatupang, D.P.; Choi, J. Integrated Photovoltaic Inverters Based on Unified Power Quality Conditioner with Voltage Compensation for Submarine Distribution System. Energies 2018, 11, 2927. [Google Scholar] [CrossRef]
  4. Zhou, C.; Qian, K.; Allan, M.; Zhou, W. Modeling of the cost of EV battery wear due to V2G application in power systems. IEEE Trans. Energy Convers. 2011, 26, 1041–1050. [Google Scholar] [CrossRef]
  5. Sarlioglu, B.; Morris, C.T. More Electric Aircraft: Review, Challenges, and Opportunities for Commercial Transport Aircraft. IEEE Trans. Transp. Electrif. 2015, 1, 54–64. [Google Scholar] [CrossRef]
  6. Manzetti, S.; Mariasiu, F. Electric vehicle battery technologies: From present state to future systems. Renew. Sustain. Energy Rev. 2015, 51, 1004–1012. [Google Scholar] [CrossRef]
  7. Zhang, J.; Lee, J. A review on prognostics and health monitoring of li-ion battery. J. Power Sources 2011, 196, 6007–6014. [Google Scholar] [CrossRef]
  8. Ma, S.; Jiang, M.; Tao, P.; Song, C.; Wu, J.; Wang, J.; Deng, T.; Shang, W. Temperature effect and thermal impact in lithium-ion batteries: A review. Prog. Nat. Sci. Mater. Int. 2018, 28, 653–666. [Google Scholar] [CrossRef]
  9. Lin, X.; Perez, H.E.; Siegel, J.B.; Stefanopoulou, A.G. Online parameterization of lumped thermal dynamics in cylindrical lithium-ion batteries for core temperature estimation and health monitoring. IEEE Trans. Control Syst. 2013, 21, 1745–1755. [Google Scholar]
  10. Zhang, J.; Zhang, L.; Sun, F.; Wang, Z. An Overview on Thermal Safety Issues of Lithium-ion Batteries for Electric Vehicle Application. IEEE Access 2018, 6, 23848–23863. [Google Scholar] [CrossRef]
  11. Morello, R.; Di Rienzo, R.; Roncella, R.; Saletti, R.; Schwarz, R.; Lorentz, V.; Hoedemaekers, E.; Rosca, B.; Baronti, F. Advances in Li-Ion Battery Management for Electric Vehicles. In Proceedings of the IECON 2018-44th Annual Conference of the IEEE Industrial Electronics Society, Washington, DC, USA, 21–23 October 2018; IEEE: Piscataway, NJ, USA, 2018; pp. 4949–4955. [Google Scholar]
  12. Beelen, H.; Mundaragi Shivakumar, K.; Raijmakers, L.; Donkers, M.; Bergveld, H.J. Towards impedance–based temperature estimation for Li–ion battery packs. Int. J. Energy Res. 2020, 44, 2889–2908. [Google Scholar] [CrossRef]
  13. Ludwig, S.; Zilberman, I.; Horsche, M.F.; Wohlers, T.; Jossen, A. Pulse resistance based online temperature estimation for lithium-ion cells. J. Power Sources 2021, 490, 229523. [Google Scholar] [CrossRef]
  14. Fortier, A.; Tsao, M.; Williard, N.D.; Xing, Y.; Pecht, M.G. Preliminary Study on Integration of Fiber Optic Bragg Grating Sensors 484 in Li-Ion Batteries and In Situ Strain and Temperature Monitoring of Battery Cells. Energies 2017, 10, 838. [Google Scholar] [CrossRef]
  15. Thomas, K.E.; Newman, J. Thermal modeling of porous insertion electrodes. J. Electrochem. Soc. 2003, 150, A176–A192. [Google Scholar] [CrossRef]
  16. Sun, L.; Sun, W.; You, F. Core temperature modelling and monitoring of lithium-ion battery in the presence of sensor bias. Appl. Energy 2020, 271, 115243. [Google Scholar] [CrossRef]
  17. Abe, Y.; Hori, N.; Kumagai, S. Electrochemical Impedance Spectroscopy on the Performance Degradation of LiFePO4/Graphite Lithium-Ion Battery Due to Charge-Discharge Cycling under Different C-Rates. Energies 2019, 12, 4507. [Google Scholar] [CrossRef]
  18. Srinivasan, R.; Carkhuff, B.G.; Howeverler, M.H.; Baisden, A.C. Instantaneous measurement of the internal temperature in lithium-ion rechargeable cells. Electrochim. Acta 2011, 56, 6198–6204. [Google Scholar] [CrossRef]
  19. Jow, T.R.; Delp, S.A.; Allen, J.L.; Jones, J.-P.; Smart, M.C. Factors limiting Li+ charge transfer kinetics in Li-ion batteries. J. Electrochem. Soc. 2018, 165, A361–A367. [Google Scholar] [CrossRef]
  20. Wang, C.; Appleby, A.J.; Little, F.E. Low-temperature characterization of lithium-ion carbon anodes via micro perturbation measurement. J. Electrochem. Soc. 2002, 149, A754–A760. [Google Scholar] [CrossRef]
  21. Simatupang, D.; Park, S.-Y. Integration of Battery Impedance Spectroscopy with Reduced Number of Components into Battery Management Systems. IEEE Access 2022, 10, 114262–114271. [Google Scholar] [CrossRef]
  22. Islam, S.M.R.; Park, S.-Y. Versatile AC Current Control Technique for a Battery Using Power Converters. Batteries 2021, 7, 47. [Google Scholar] [CrossRef]
  23. Benshatti, A.; Islam, S.M.R.; Link, T.; Park, S.-Y. Internal Resistance Measurement of Lithium-ion Batteries using LC Resonant Tank. In Proceedings of the 2022 IEEE Applied Power Electronics Conference and Exposition (APEC), Houston, TX, USA, 20–24 March 2022; pp. 1085–1089. [Google Scholar]
  24. Zheng, H.; Zhang, H.; Fu, Y.; Abe, T.; Ogumi, Z. Temperature effects on the electrochemical behavior of spinel LiMn2O4 in quaternary ammonium-based ionic liquid electrolyte. J. Phys. Chem. 2005, 109, 13676–13684. [Google Scholar] [CrossRef] [PubMed]
  25. Kumar, A.S.; Satyavani, T.; Senthilkumar, M. Effect of temperature and charge stand on performance of lithium-ion polymer pouch cell. J. Energy Storage 2016, 6, 239–247. [Google Scholar] [CrossRef]
  26. Alipour, M.; Ziebert, C.; Conte, F.V.; Kizilel, R. A Review on Temperature-Dependent Electrochemical Properties, Aging, and Performance of Lithium-Ion Cells. Batteries 2020, 6, 35. [Google Scholar] [CrossRef]
  27. Zhang, H.; Lu, R.; Zhu, C.; Zhao, Y. On-line measurement of internal resistance of lithium-ion battery for EV and its application research. Int. J. U E Serv. Sci. Technol. 2014, 7, 301–310. [Google Scholar] [CrossRef]
  28. Farmann, A.; Waag, W.; Sauer, D.U. Application-specific electrical characterization of high-power batteries with lithium titanate anodes for electric vehicles. Energy 2016, 112, 294–306. [Google Scholar] [CrossRef]
  29. Coleman, M.; Hurley, W.G.; Lee, C.K. An improved battery characterization method using a two-pulse load test. IEEE Trans. Energy Convers. 2008, 23, 708–713. [Google Scholar] [CrossRef]
Figure 1. Embedded EIS into: (a) BMS [21]; (b) battery charger [22].
Batteries 09 00104 g001
Figure 2. Proposed configuration for an LC resonant tank for BMS.
Batteries 09 00104 g002
Figure 3. (a) Series LC resonant with battery; (b) current peak at resonant frequency.
Batteries 09 00104 g003
Figure 4. Series LC resonant tank frequency selection.
Batteries 09 00104 g004
Figure 5. Operating modes for the preheating mechanism and SoC balancing [16].
Batteries 09 00104 g005
Figure 6. Simulation result of preheating mechanism and SoC balancing for (a) charging; (b) discharging conditions.
Batteries 09 00104 g006
Figure 7. Series LC resonant into BMS (a) for preheating mechanism testbed; (b) for LC resonant tank testbed.
Batteries 09 00104 g007
Figure 8. SOC balancing mode for (a) charging; (b) discharging conditions.
Batteries 09 00104 g008
Figure 9. The waveform of the preheating mechanism for 1 kHz.
Batteries 09 00104 g009
Figure 10. The waveform of the LC resonant at 56 Hz.
Batteries 09 00104 g010
Figure 11. Batteries’ impedance data: (a) at 20%; (b) at 50%; (c) at 99% SoC level.
Batteries 09 00104 g011
Figure 12. Curve fitting polynomials and mean batteries’ impedance data: (a) at 20%; (b) at 50%; (c) at 99% SoC level.
Batteries 09 00104 g012aBatteries 09 00104 g012b
Figure 13. Thermal image inside the thermal chamber; (a) before the preheating at −5 °C; (b) after the preheating at 10 °C.
Batteries 09 00104 g013
Table 1. System Parameter for Simulation.
Part of CircuitDescriptionsValue
VbatRated Battery Voltage3.6 V
CbatBattery Capacity5.2 Ah
CrateCharge Rate8.6 A
DrateDischarge Rate7.8 A
RbatInternal Resistance in Battery0.025 Ω
Vbat, maxMaximum Voltage in Battery4.2 V
L1Inductor 100 µH
fswitchingSwitching Frequency1–5 kHz
R1Parasitic Resistance in Inductor8 mΩ
Imax,L1Maximum current in Inductor30 A
Table 2. Curve Fitting Polynomial.
SoC LevelPolynomial Equation with Order 3R2
20%−6 10−8 T3 + 5 10−6 T2 − 0.0002T + 0.02930.9938
50%−4 10−8 T3 + 3 10−6 T2 − 0.0001T + 0.02810.9955
99%−2 10−8 T3 + 3 10−6 T2 − 0.0001T + 0.02740.9792
Table 3. EIS Resistance Data for B1, B2, and B3 at 56 Hz (25 °C and 50% SoC).
BatteryR (Ω)FRA
(Ω)
Percentage Error
(%)
B10.026060.0221117.87%
B20.026140.0221518.14%
B30.026100.0221717.73%
Table 4. Comparison of this proposed method with other methods.
Descriptions[21][22][29]This Proposed Method
Battery ModelPanasonic 18650Valence 12-XPYuasa VRLAPanasonic 18650
Perturbation SourceSwitching SemiconductorChargerLoadLC resonant tank
Perturbation SignalTriangularSine seriesPulseUnder damped Oscillation
Processes for
computation
Window, FFT, Peak and Phase EstimationWindow, FFT, Peak and Phase EstimationVmax detection and least squares regressionVmax and Imax detection
Additional FunctionEqualizer and PreheatingNoneSoC and SoHEqualizer and Preheating
Disclaimer/Publisher’s Note: The statements, opinions and data contained in all publications are solely those of the individual author(s) and contributor(s) and not of MDPI and/or the editor(s). MDPI and/or the editor(s) disclaim responsibility for any injury to people or property resulting from any ideas, methods, instructions or products referred to in the content.

