1. Introduction
The battery field is highly competitive nowadays, with large interests in various applications [
1,
2,
3,
4,
5,
6,
7]. Lead–acid batteries (LABs) continue to control the battery market, with their effective compromises regarding power, lifetime, manufacturing costs, and recycling. They dominated the market share in 2019 by an estimated 32.29% of the total battery market [
8], with further predicted growth of 5.2% until 2030 [
9]. The reasons why LABs are still competitive are mainly due to some particular features, as they exhibit high recycling rates [
10], low manufacturing costs [
11], maintenance-free operations [
12], and safe working conditions at extreme temperatures [
13]. All these advantages mean they are the most preferred in the automobile industry [
14,
15] and in off-grid storage systems [
16].
Despite the persistent LAB improvements in terms of advanced materials and/or technological processes, there are some drawbacks that concern battery lifespan prediction as a major preoccupation in the field and have a direct impact on the total costs of the energy systems and the progress of LAB development. Therefore, a determination of the expected battery lifetime performance is highly needed. Several methods to predict battery lifetime can be found in the literature [
17,
18,
19]. Among these, we mention ampere-hour counting [
20], the voltage method [
21], artificial neural networks currently used to predict the state of health (SoH) in electric vehicles [
22,
23], the genetic algorithm applied to the charging and discharging equations in order to estimate the value of the time constant [
24], and computing the Weibull distribution [
25]. However, all these techniques have complicated algorithms and are difficult to implement. Another common approach is aging the battery until failure, in which the battery lifespan is depth of discharge (DoD) dependent [
26]. The aging mechanism at different DoDs can also be found in the literature. For example, Kazelle et al. [
27] investigated the influence of cell impedance parameters on battery aging at 100% DoD, while the group of Morari [
28] employed a DoD of 25% in a controlled aging mechanism. We found studies in which an optimized DoD is recommended by the battery manufacturers to be at 50% DoD [
29,
30].
Besides the above-described approaches, electrochemical impedance spectroscopy (EIS) is one of the most used qualitative techniques for the examination of the general states of a battery (state of charge (SoC) and state of health (SoH)) [
31,
32,
33,
34,
35]. It is a highly sensitive approach that is employed for the characterization of chemical systems (state of charge, fluctuations of internal resistance, interfacial processes, residual capacity, etc.) in a non-destructive manner. The battery yield is examined in the light of Nyquist diagrams, together with their fitted Randles equivalent circuit [
36,
37,
38], which measure the modifications that appear during the charging/discharging processes. EIS basically follows the electrons’ motion dependence in the metallic components, combined with the progress of ionic migrations, electrostatic charging of double layers, and charge transfer processes at the electrode surface.
Two particular 100% SoC stages were employed for this study: (1) immediately after fabrication and (2) after a controlled aging procedure to 50% DoD at a ROMBAT factory, following their industrial standards. The DoD [
38] emphasized here is the capacity that is discharged from a fully charged one divided by its nominal capacity, or in a simple way, a percentage of the battery that has been discharged relative to the overall capacity. In the particular case of LABs, there is a link between the DoD and the battery cycle life, namely, the number of charge/discharge cycles that a battery can sustain in its life, depending on how much of the battery’s capacity is usually used. We chose to cycle them in the 100% to 50% range, which is known as an interval that prolongs the LAB lifetime. It was demonstrated that going below 50% discharging shortens the battery lifetime [
39].
The key elements of our investigation focused on three fast techniques: (1) the fluctuations of the Q-Q
0 total charge exchanged in the first stage of the investigation, (2) the time-dependent decomposition of the constant phase element (CPE) decomposition in the Randles equivalent circuits, and (3) the resonance frequency single-parameter analysis. Concerning the last two approaches, we previously demonstrated [
40,
41,
42,
43] the viability of both methods, in which we successfully put together the controlled aging of LABs with the PEIS measurements. By collecting the data of six PEIS measurements recorded when batteries are fully charged and at 50% DoD, here, we employed the CPE element analysis in order to characterize the capacitance dispersion and their variations in the CPE carriage. We followed the trends of the CPE linear decay in the equivalent circuit in both SoC phases. Besides the prediction of the LAB lifespan, here, we also highlight the potential applications of these methods as direct indicators for the validation of technological innovations in the automotive industry. Resonance frequency analysis was first implemented in [
41], offering a fast performance prediction in lead–acid battery characterization in terms of the connection between the SoH and the electric response. It was also considered a predictable factor for positive grids with hexagonal and leaf designs in novel LAB prototypes [
43]. To further expand the applicability of the resonance frequency for battery aging prediction, this method was applied in this study to LABs aged at 50% DoD.
2. Materials and Methods
2.1. Lead–Acid Battery Types/Technologies
We used 9 industrially prototyped LABs in our investigation that were fabricated by the ROMBAT factory, which is the dominant manufacturer of automotive batteries in our country. ROMBAT’s data protection and manufacturing secrets prevent us from providing more details about the battery-manufacturing parameters or other additional data. Nevertheless,
Table 1 describes some general information about the type, capacity, and technology of each battery package.
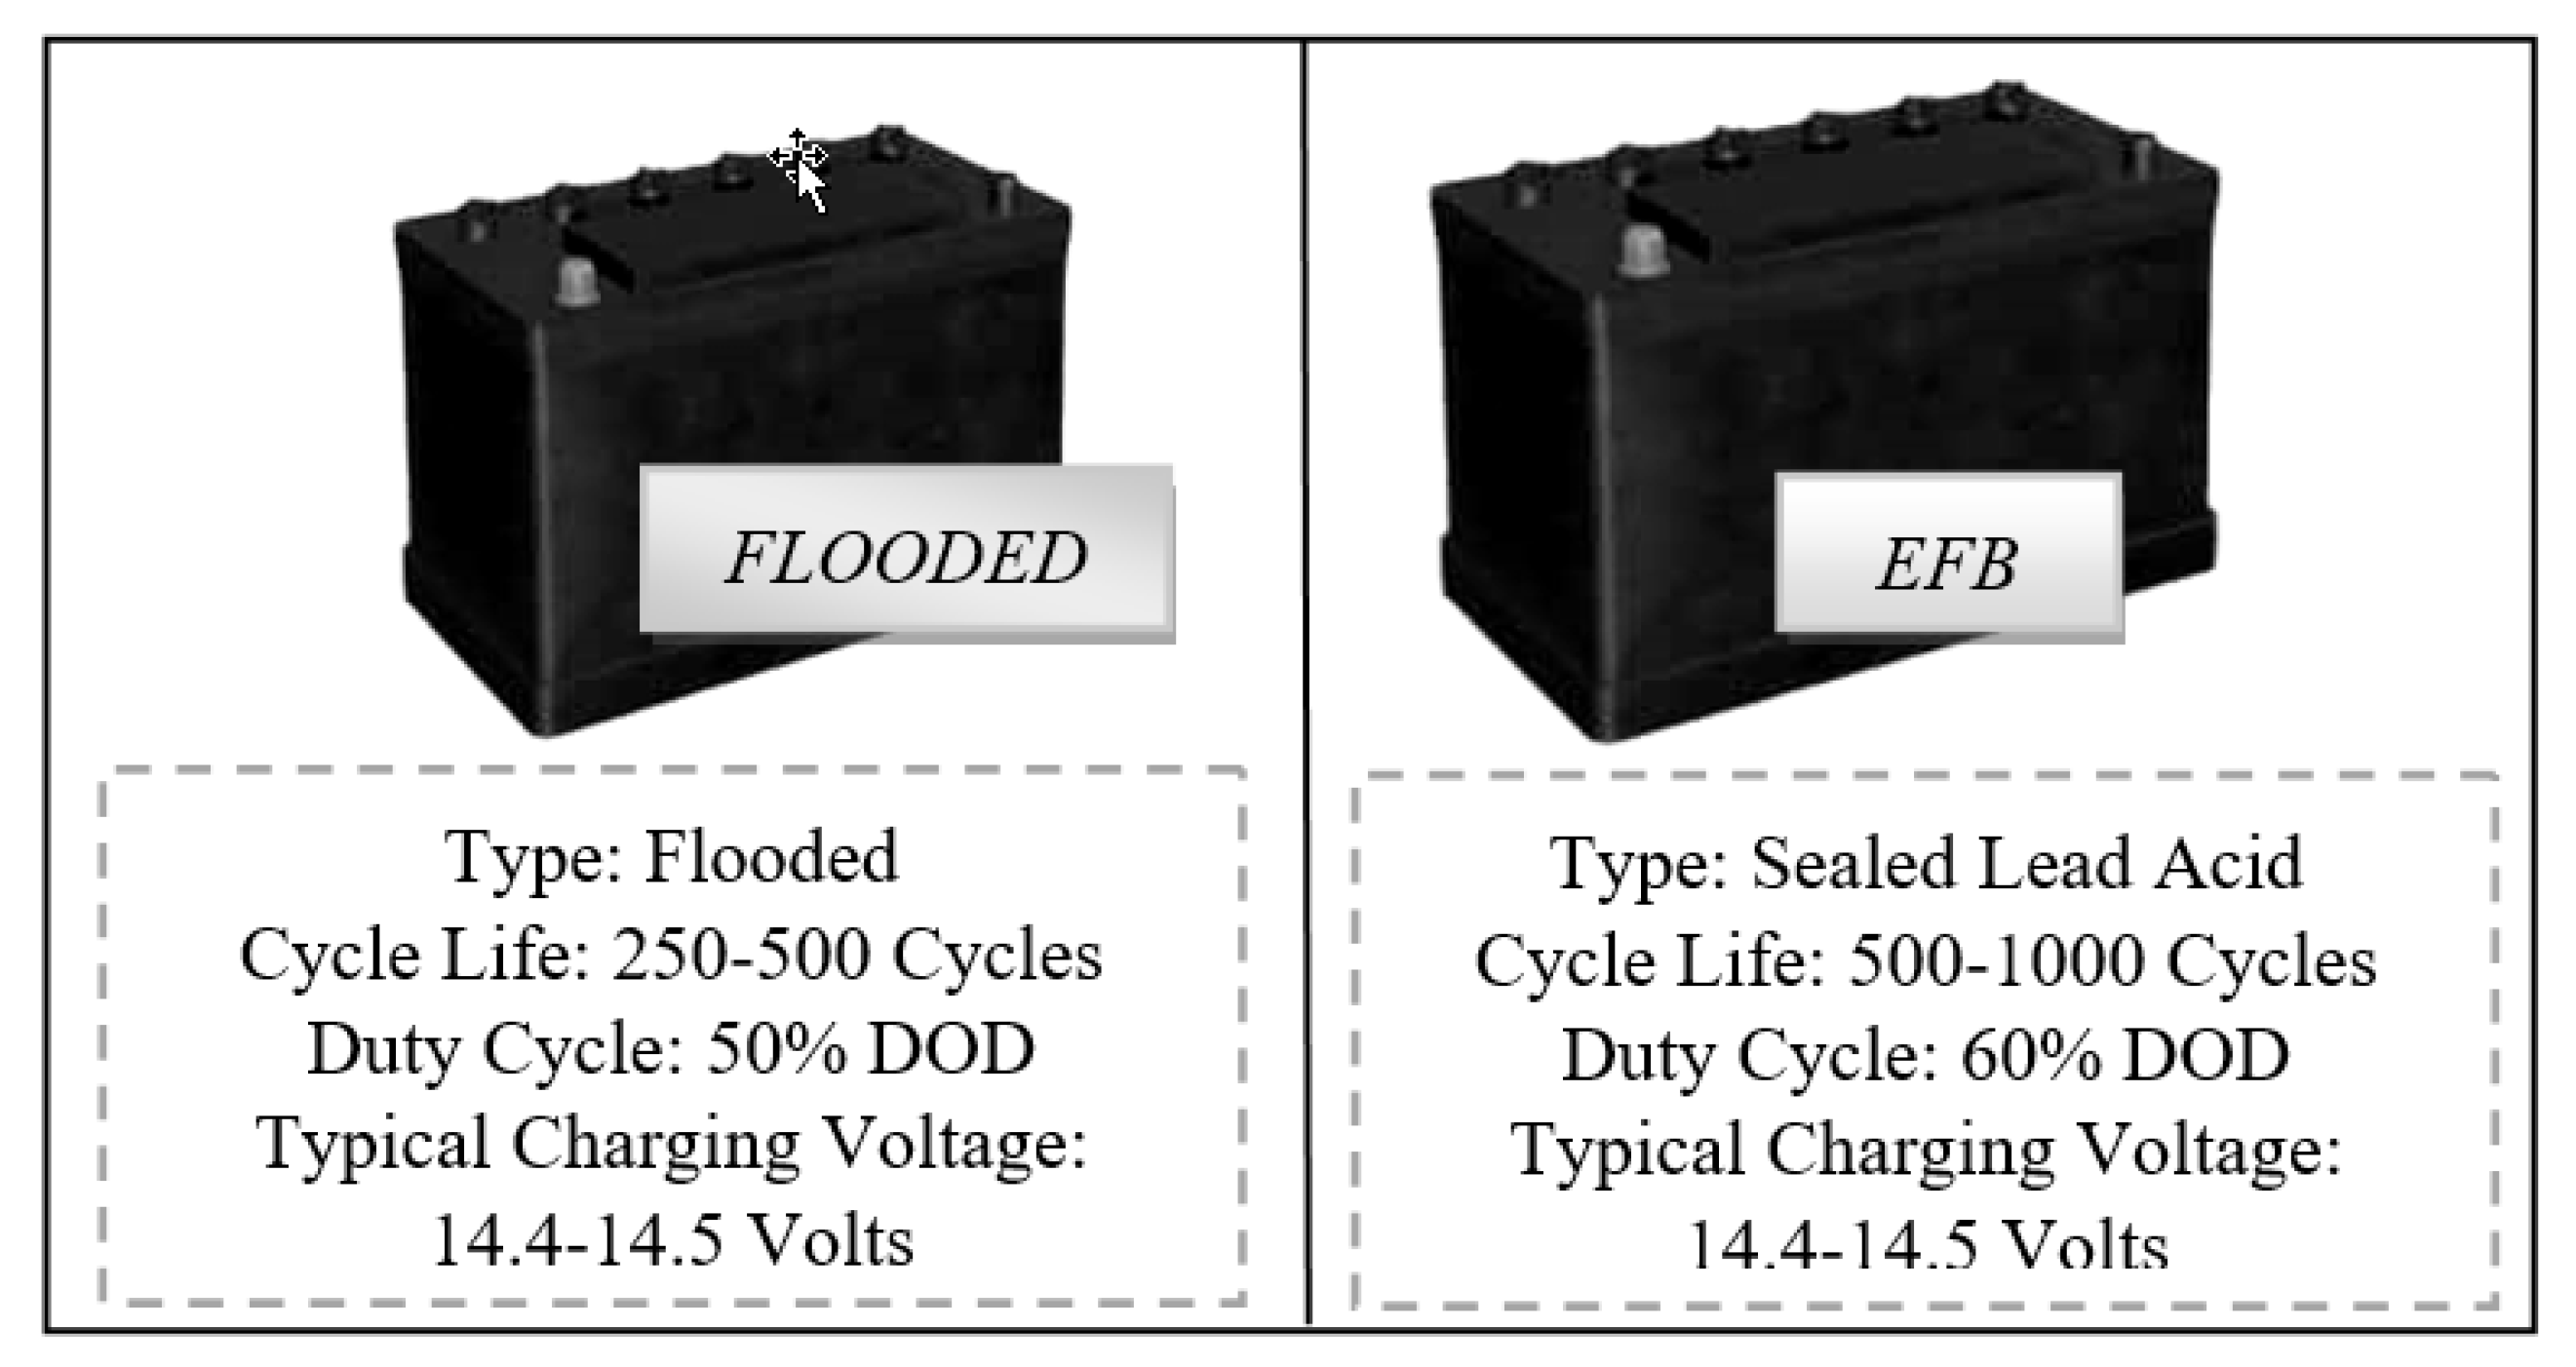
The first three types of lead–acid batteries (L2 FLO 52 Ah) were formed in a traditional flooded technological approach, in which the electrodes/plates were immersed in an electrolyte. The most familiar example of a flooded lead–acid cell is a 12 V automobile battery, but this has the disadvantage of some maintenance during its lifetime, meaning that additional distilled water must be added from time to time in order to bring the electrolyte up to the optimal level [
44].
The other 6 prototype batteries, three of type L2 EFB 60 Ah and three of L3 EFB 70 Ah, were formed through an enhanced version of standard wet-flooded technology, namely, EFB, in which additional carbon additives were added during the manufacturing processes. Enhanced flooded batteries (EFBs) are currently factory fitted to numerous entry-level start–stop vehicles, with improvements in dynamic charge current acceptance over the above FLO type. They also offer high-charge-acceptance envelope-type separators with increased cyclic durability over the FLO battery type. The aim of the automotive factory was to improve the charge acceptance and cyclic durability when operating in current start–stop automobiles that usually produce a reduced state of charge function mode. A recombinant lid technology combined with a high pack pressure was applied in order to possibly improve the battery lifespan. In the first type of technology, the electrolyte solution goes in between each cell plate, while for the second technology, thicker plates are used in comparison with a conventional starting battery. A schematic illustration of both types, along with some specific parameters, is shown in
Figure 1 below.
We should mention that the scope of this work was exclusively directed to the development of accurate methods for the prediction of the LAB lifetime performance and not on the battery manufacturing processes. We are fully aware that the finite battery performance comes from the irreversible changes that occur in the physical and/or chemical structure of its components, and a quantitative health assessment of the batteries requires data about the nature and the extent of these variations. We also know that the chemistry of the materials from which the LABs are fabricated plays a major role in their efficiency and/or capacity, but this was out of our scope here.
2.2. Experimental Set-Up
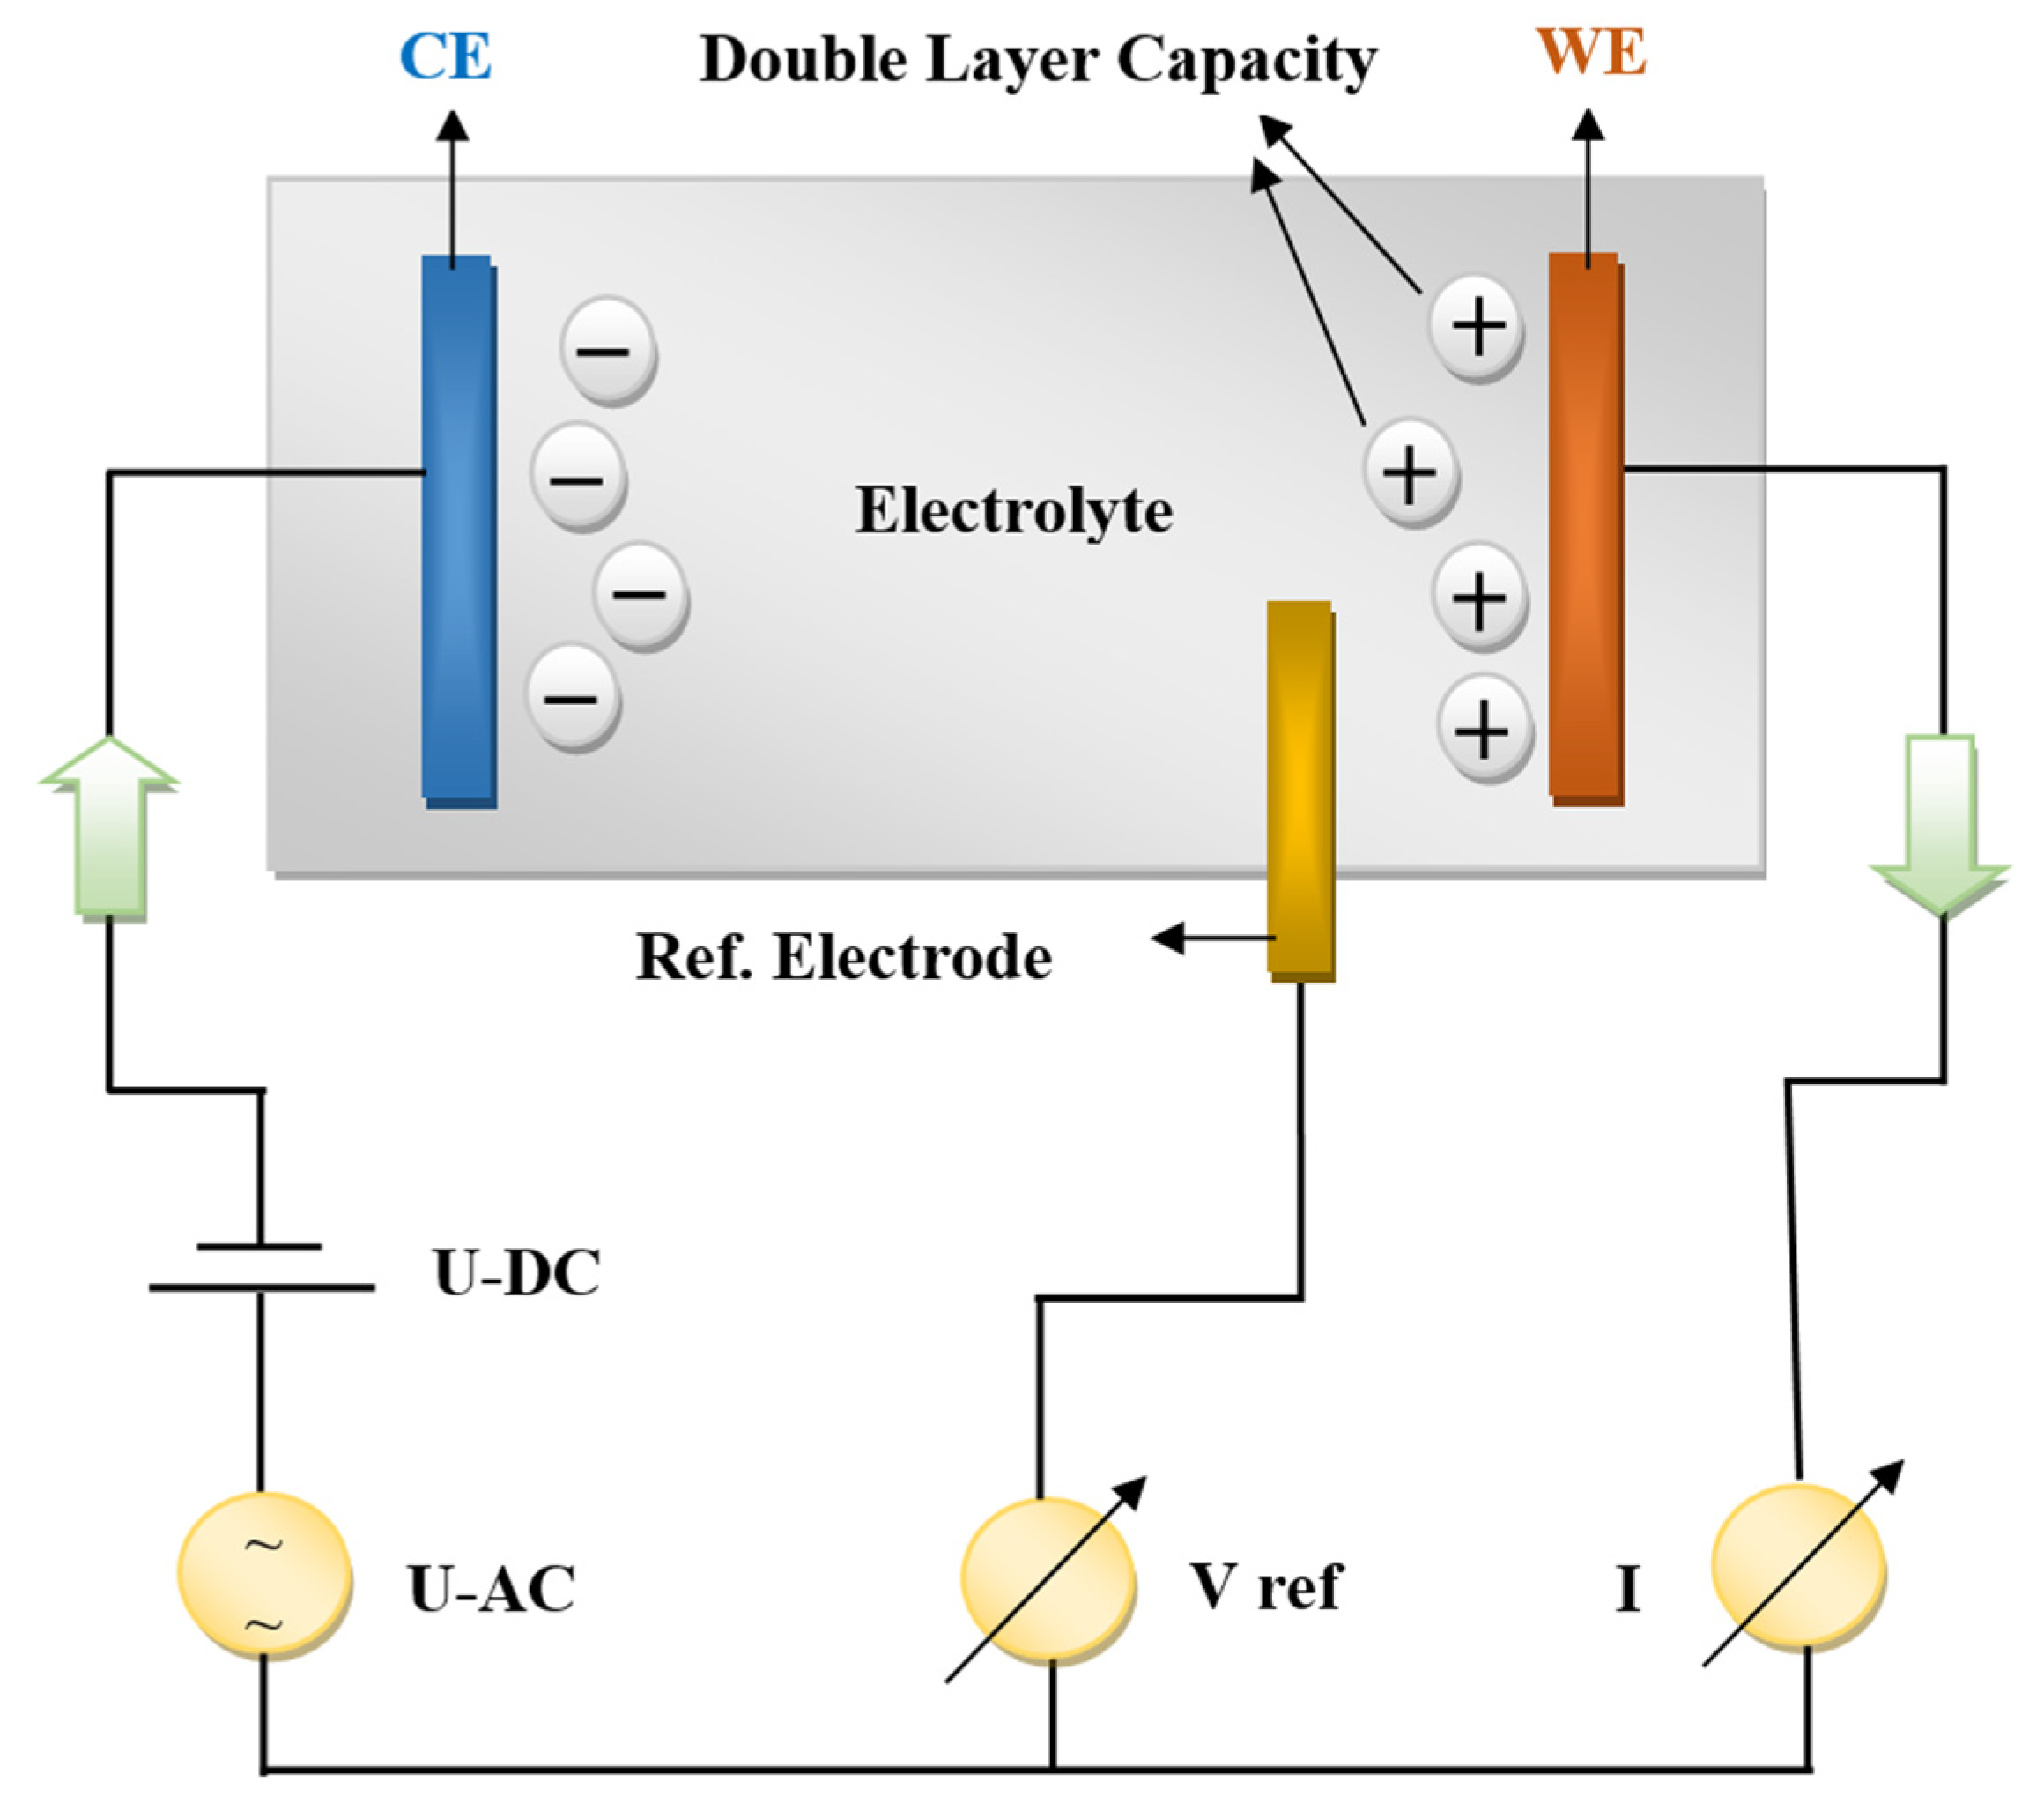
Multi-channel VSP equipment belonging to the Bio-Logic company (4 working channels in potentiostatic mode) connected to two amplifiers (boosters) of 5 A and 10 A was used for the PEIS (potentio electrochemical impedance spectroscopy) measurements, while the results were interpreted in the framework of the Ec-Lab software V11.46 program. Simultaneous measurements of current and working electrode potential were continuously acquired using two 16-bit analog-to-digital converters. A three-electrode connection with a reference electrode was employed, allowing us to simultaneously record/control the positive and negative parts of the battery. In this configuration, we added a third voltage reference electrode to the two parallel plate electrodes, namely, the CE (counter electrode) and WE (working electrode), to measure the voltage difference of the polarization double-layer capacity to the WE. A schematic configuration of their internal processes is shown in
Figure 2 below.
2.3. Battery Characterization Procedure
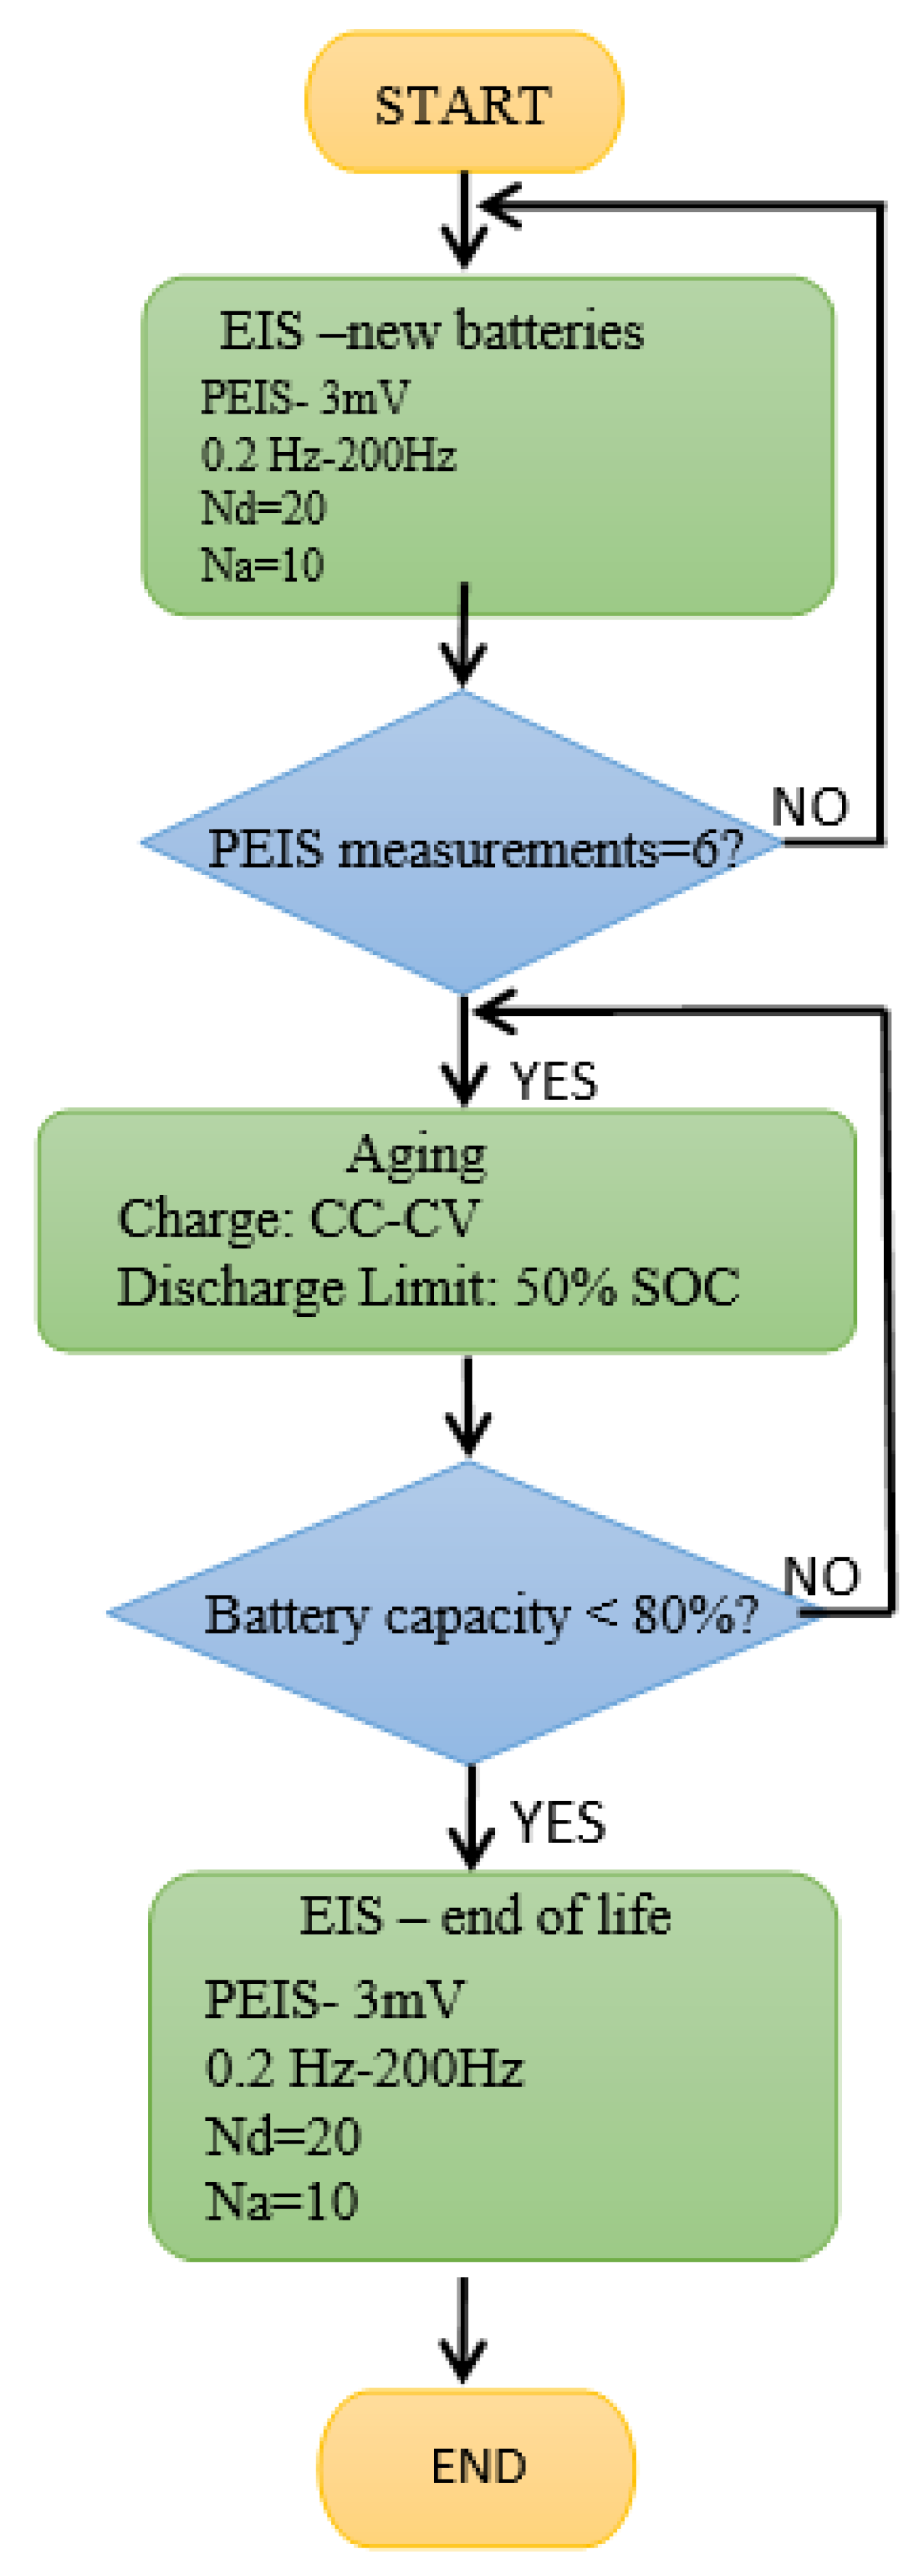
Six PEIS battery measurements were performed for each battery type/technology. The experiments were carried out in two stages: the first measurements were taken immediately after manufacture when the batteries were fully charged, while in the second case, the batteries were aged at ROMBAT (to 50% DoD industry standards) and then sent back to our laboratory for analysis. The PEIS test preparation at 100% SoC included a 24 h charge at 16 V with 17.5 A current limitations.
Figure 3 summarizes the working parameters in the PEIS analysis procedure. In the PEIS procedure, the voltage amplitude of the sinusoidal signal was set to 3 mV in the frequency range of 0.2–200 Hz. Perturbation signals below 10 mV should be used in order to maintain the linear conditions [
34,
44]. The frequency scan used Nd = 20 points per decade in logarithmic spacing and Na = 10 measures per frequency, as we aimed for a high accuracy of the frequency measurements.
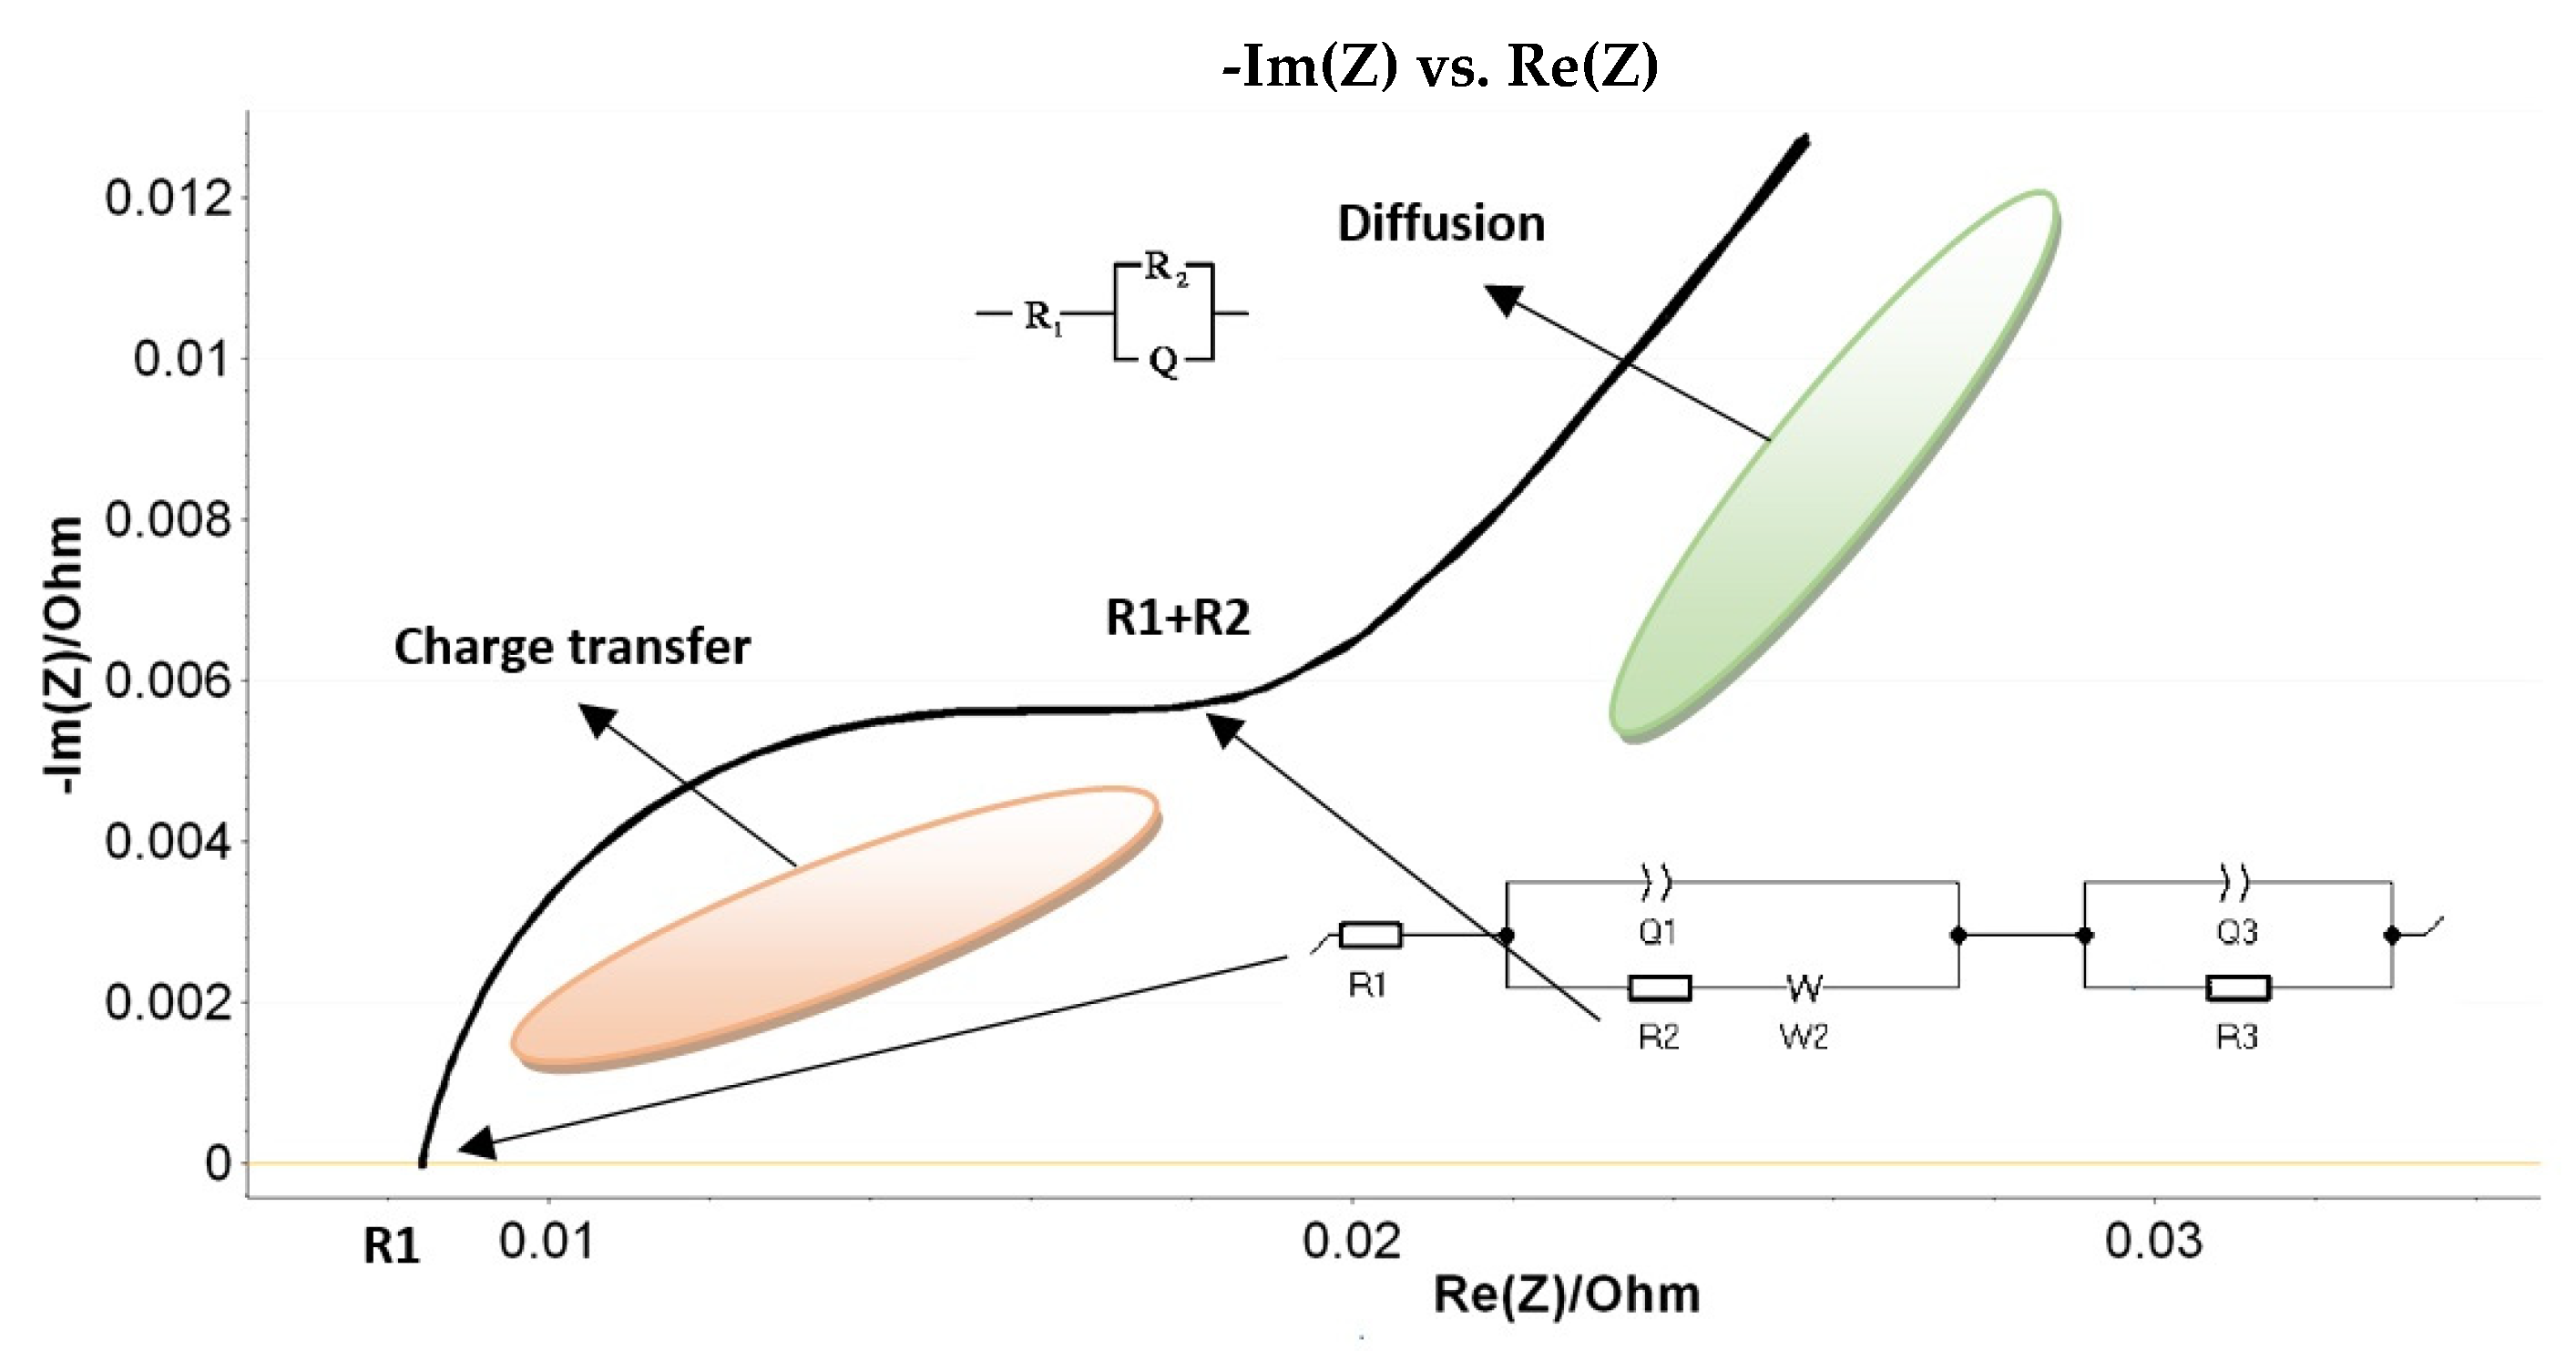
The results were interpreted in the light of Nyquist diagrams within the corresponding Randles equivalent circuit, as schematically shown in
Figure 4.
By looking at the Nyquist plot example in
Figure 4, we expected a semicircle with the center on the real X-axis, while we obtained an arc of a circle but within the center placed below the axis. As such, we associated this behavior with the capacitor imperfections, as expressed by the constant phase element (CPE). This element is able to describe the impedance data with non-ideal frequency-dependent properties by using the following equation:
Additionally, we monitored the error coefficient for each value of impedance calculated in Ec-Lab using:
where
Zmeas(
i) are the values of measured impedance and
Zsimul(
fi,
param) are the values of the measured impedance with the fitted parameters.
For all the fitted circuits employed in this investigation, we obtained the smallest errors with typical values for χ between 1 and 3 percent.
The main parameters of the Randles circuit used to fit the PEIS data in our experiments (see
Figure 4) are R
1—resistance of the electrolyte conductivity, R
2—resistance at the charge transfer, Q
1/a
1 and Q
3/a
3—constant phase elements (CPEs) that describe the double-layer capacity near the two electrodes, W
2—the Warburg element responsible for the diffusion processes induced at interfaces (by the production and/or consumption of elements), and R
3—leak resistance.
3. Results and Discussions
Table 1 summarizes the results of the maximum number of discharging cycles (in blue) and the minimum number of discharging cycles (in red) for each battery type.
As can be seen, for the first type/technology of B1-B3/L2 FLO 52 Ah, the best performance achievement was obtained by the B2 battery prototype, with the largest cycle life when aged at 50% DoD. In contrast, the B3 accumulator had the shortest cycle life, with 46 discharging cycles. A middle performance was obtained by the B1 type, with 50 discharging cycles. In the case of the second battery type of B4-B6/L2 EFB 60 Ah, the best performance was clearly shown by the B6 prototype, with the highest number of discharging cycles with 228, while the B4 and B5 types had much lower battery performances. However, the B5 accumulator demonstrated a longer cycle life than B4, with 67 discharging cycles compared with 56 discharging cycles. In the last package of B7-B9/L3 EFB 70 Ah, the B9 accumulator showed an even better performance than B6, with the highest number of discharging cycles at 256. The other two types of B7 and B8 accumulators displayed much lower performances, with just 23 discharging cycles. As can be observed, the B2, and in particular, the B6 and B9 battery types/technologies, showed a significant increase in terms of lifetime performance in comparison with other batteries in each group. This means that depending on the type and technology used for battery fabrication, these prototypes should be taken into account for further developments as new product innovations for the automotive industry.
However, a qualitative evaluation of the LABs is needed for the determination of parameters that influence the homogeneity between electrodes the most, and ultimately to find an accurate fitting approach that is able to predict the lead–acid cell aging process and/or their degradation speed.
3.1. Q-Q0 Total Charge Analysis
The level of charge after each PEIS measurement was recorded using a VSL potentiostat in terms of Q-Q0. This represents the total charge exchanged since the beginning of the experiment and can be seen as the ratio between the energy stored (sum of energies in capacitors and/or lossless inductors) to the energy dissipated per cycle (sum of energies dissipated/per cycle in resistors), or as a product of the electric current flowing throughout the battery (in or out) and the time duration.
We focused on this analysis immediately after fabrication and not after the aging procedure since the battery tendency (to build up or to build up and to deplete) determined before aging gives an indication of the behavior of the cell under cycling conditions. We intended to find a rapid analysis method that is capable of predicting the lead–acid battery lifetime performance from the beginning if possible (immediately after fabrication), thus reducing the maximum number of parameters to be investigated.
Starting from the fact that the magnitude of the net charge on the plate will grow with time, we have
in which τ represents the time constant of the circuit
For the Q determination, which represents the amount of charge transferred over time, the following equation is employed:
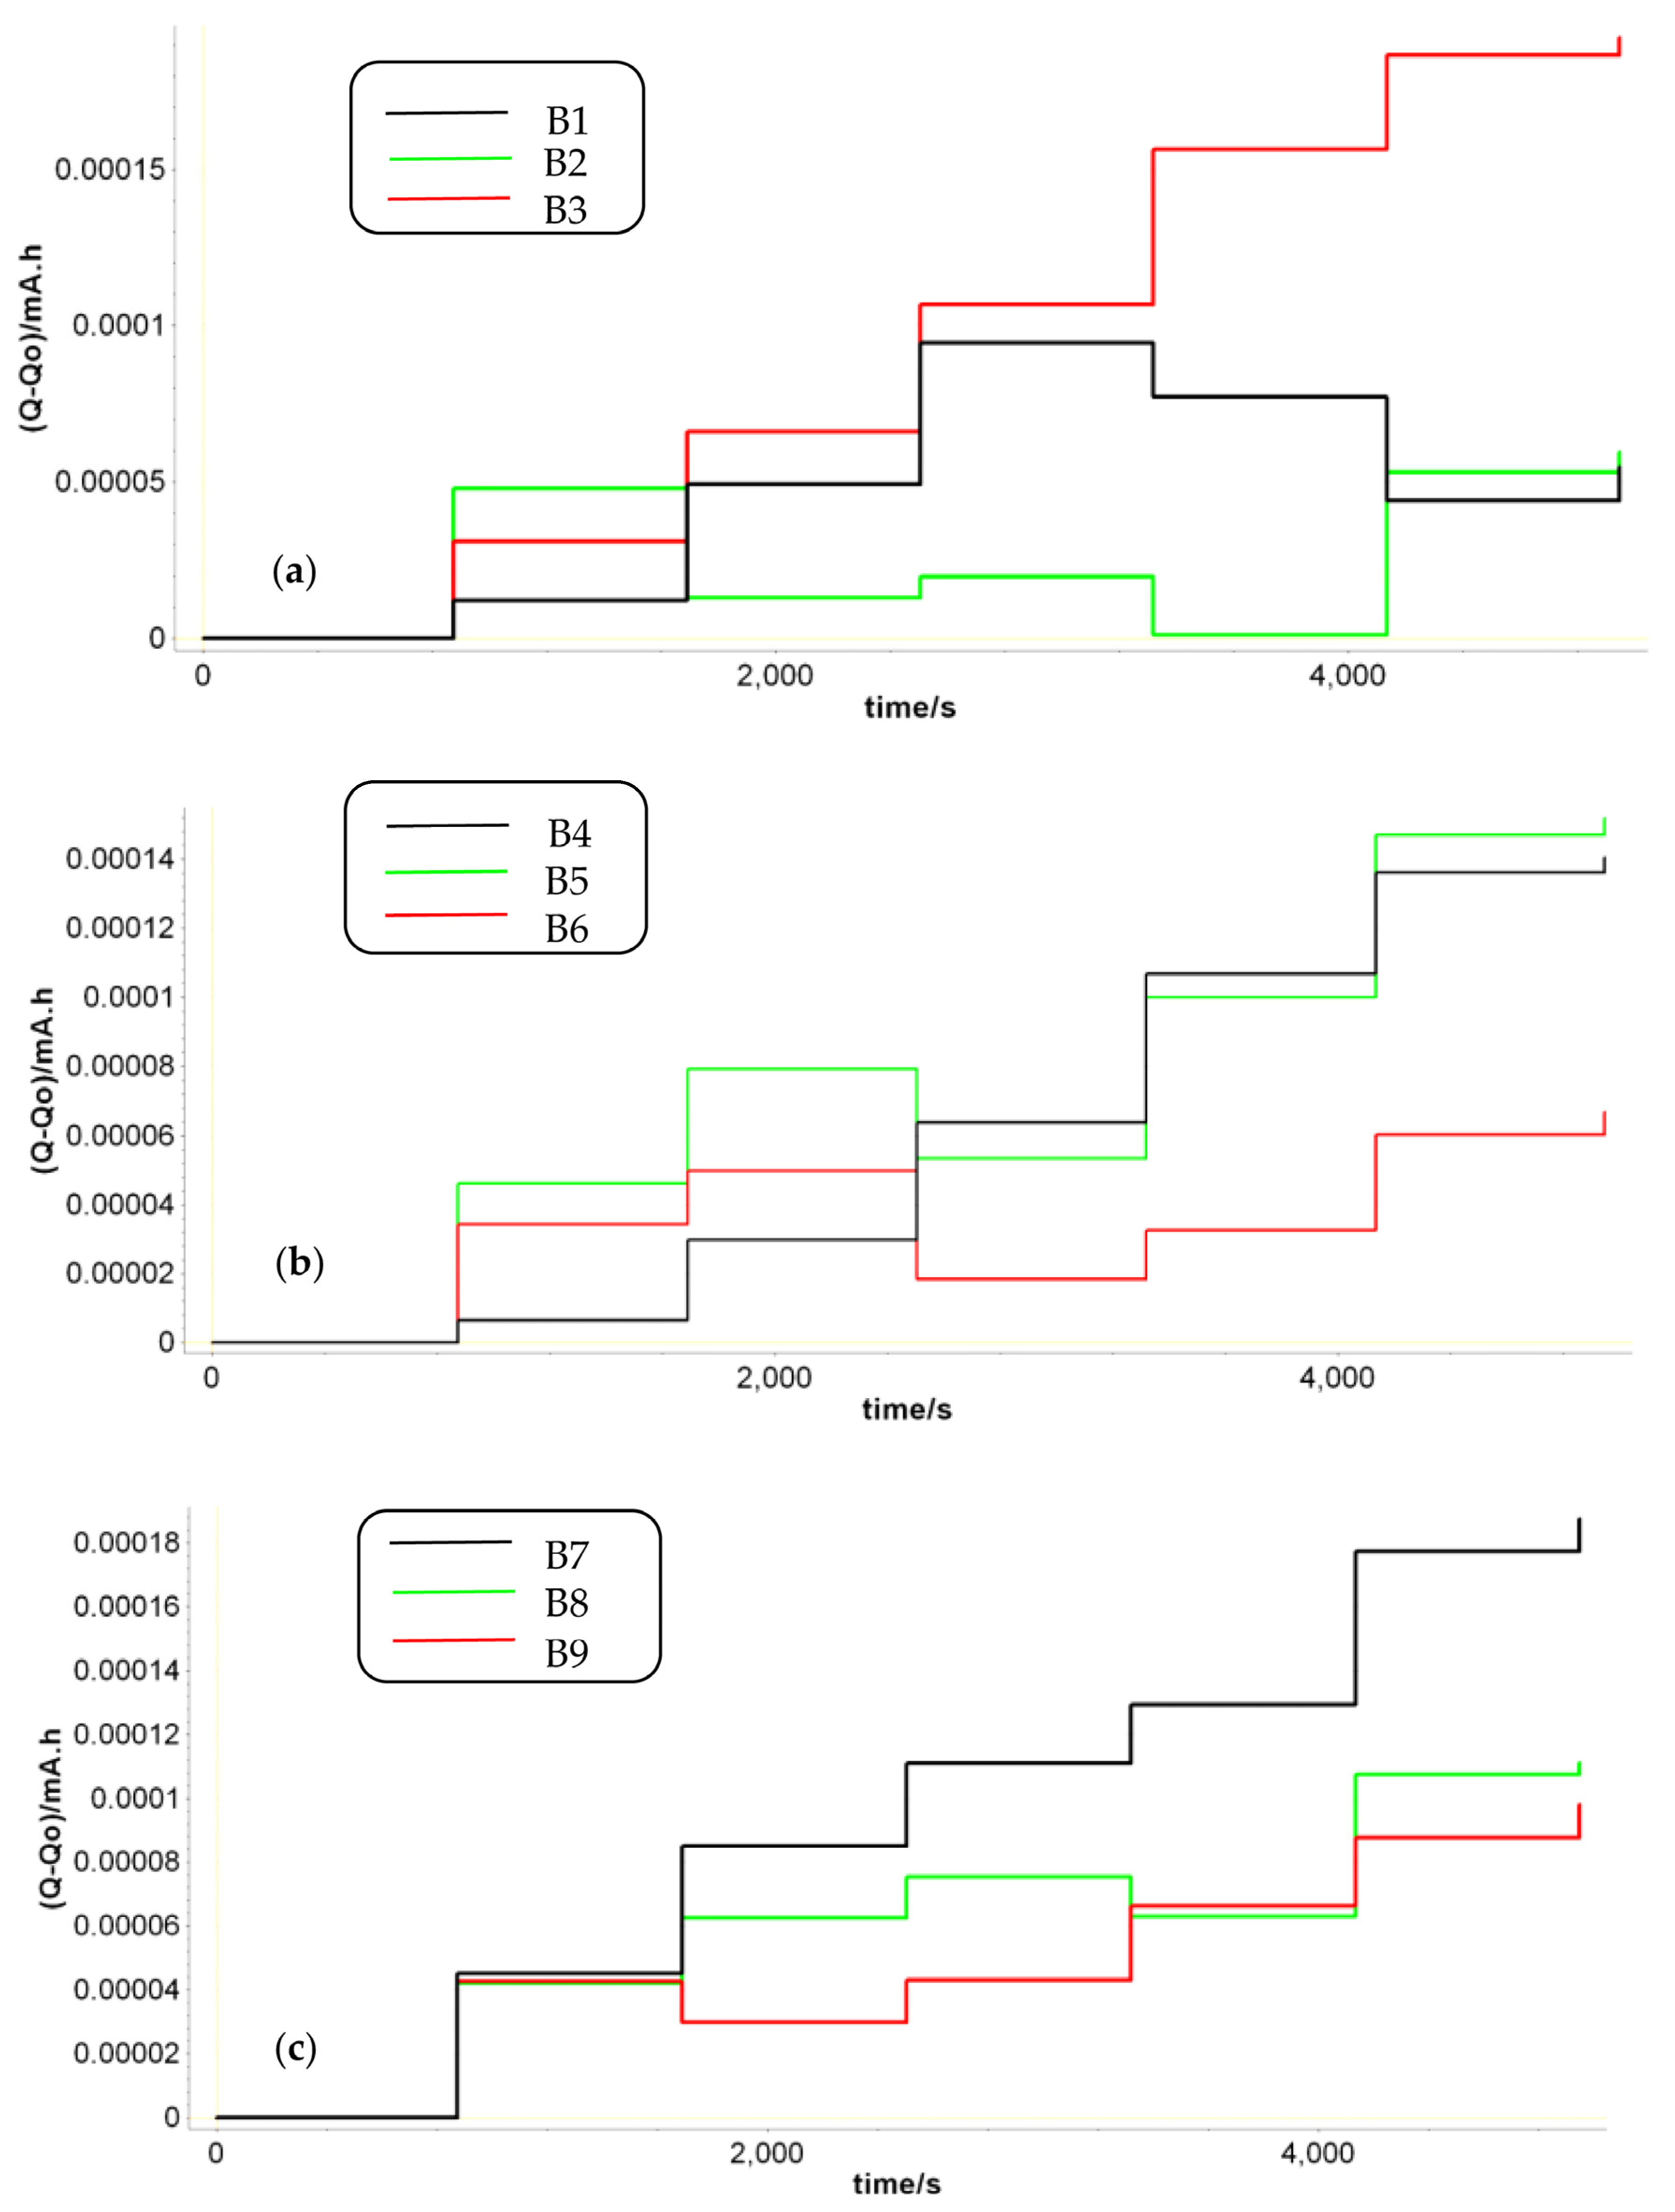
During the PEIS, a small sinusoidal signal is applied around a DC potential in the frequency range of 0.2–200 Hz. The amplitude of this voltage signal was set to 3 mV. If we look at
Figure 5, some of the batteries had a growing trend for the charge, which means that during the PEIS, the charge tended to accumulate in the battery. Due to the low impedance of LAB batteries, this can lead to a battery overcharge that accelerates the degradation of the battery.
As the battery was fully charged, any amount of charge that was added became an overcharge. At high SoC levels, under EIS measurements, the battery is predisposed to overcharge [
45]. In this case, the charge buildup was a small amount, as the system was set to function under steady-state conditions. The overcharge process expands with cycling, causing water loss that increases the oxygen recombination, and thus, the accumulation of lead sulfate on the negative plate. Positive grid corrosion can further increase the water loss [
46].
Another feature in
Figure 5 is that the LABs with a longer cycle life had a reduced charge growth during the PEIS cycles. Under the same PEIS conditions, batteries B2, B6, and B9 also experienced a charge decrease that ultimately balanced the total charge in the batteries and increased their lifetime performance. This is in agreement with the results described in
Table 1 in terms of the maximum number of discharging cycles (in blue) vs. the capacity fluctuations. By analyzing how much capacity was lost over time during the discharging cycling in all prototypes, we can easily observe that the lower fluctuations in capacity came from batteries B2, B6, and B9, which were the best-performing ones.
Besides that, it is known that secondary batteries change their structure when discharged or charged, even at low currents [
47,
48]. Under the PEIS technique, at 100% SoC, where a small perturbation signal is applied around a DC potential, the amount of charge that builds up during the positive period is different from the charge removed in the negative phase. The tendency of charge in a fully charged state is to build up. As the number of PEIS cycles increases, the amount of charge that builds up increases. It was found that batteries in which the charge was allowed to build up and to deplete had a superior behavior in terms of their lifetime/number of cycles.
3.2. Q1 Element Data Analysis as SoH Indicator
Particular attention has been paid to the constant phase element (CPE) fluctuations, as this parameter was found to be essential for a good-quality fit over an extended range of batteries [
40,
41,
42,
43]. Thus, we investigated the dependence of the values for components of the equivalent Randle circuit shown in
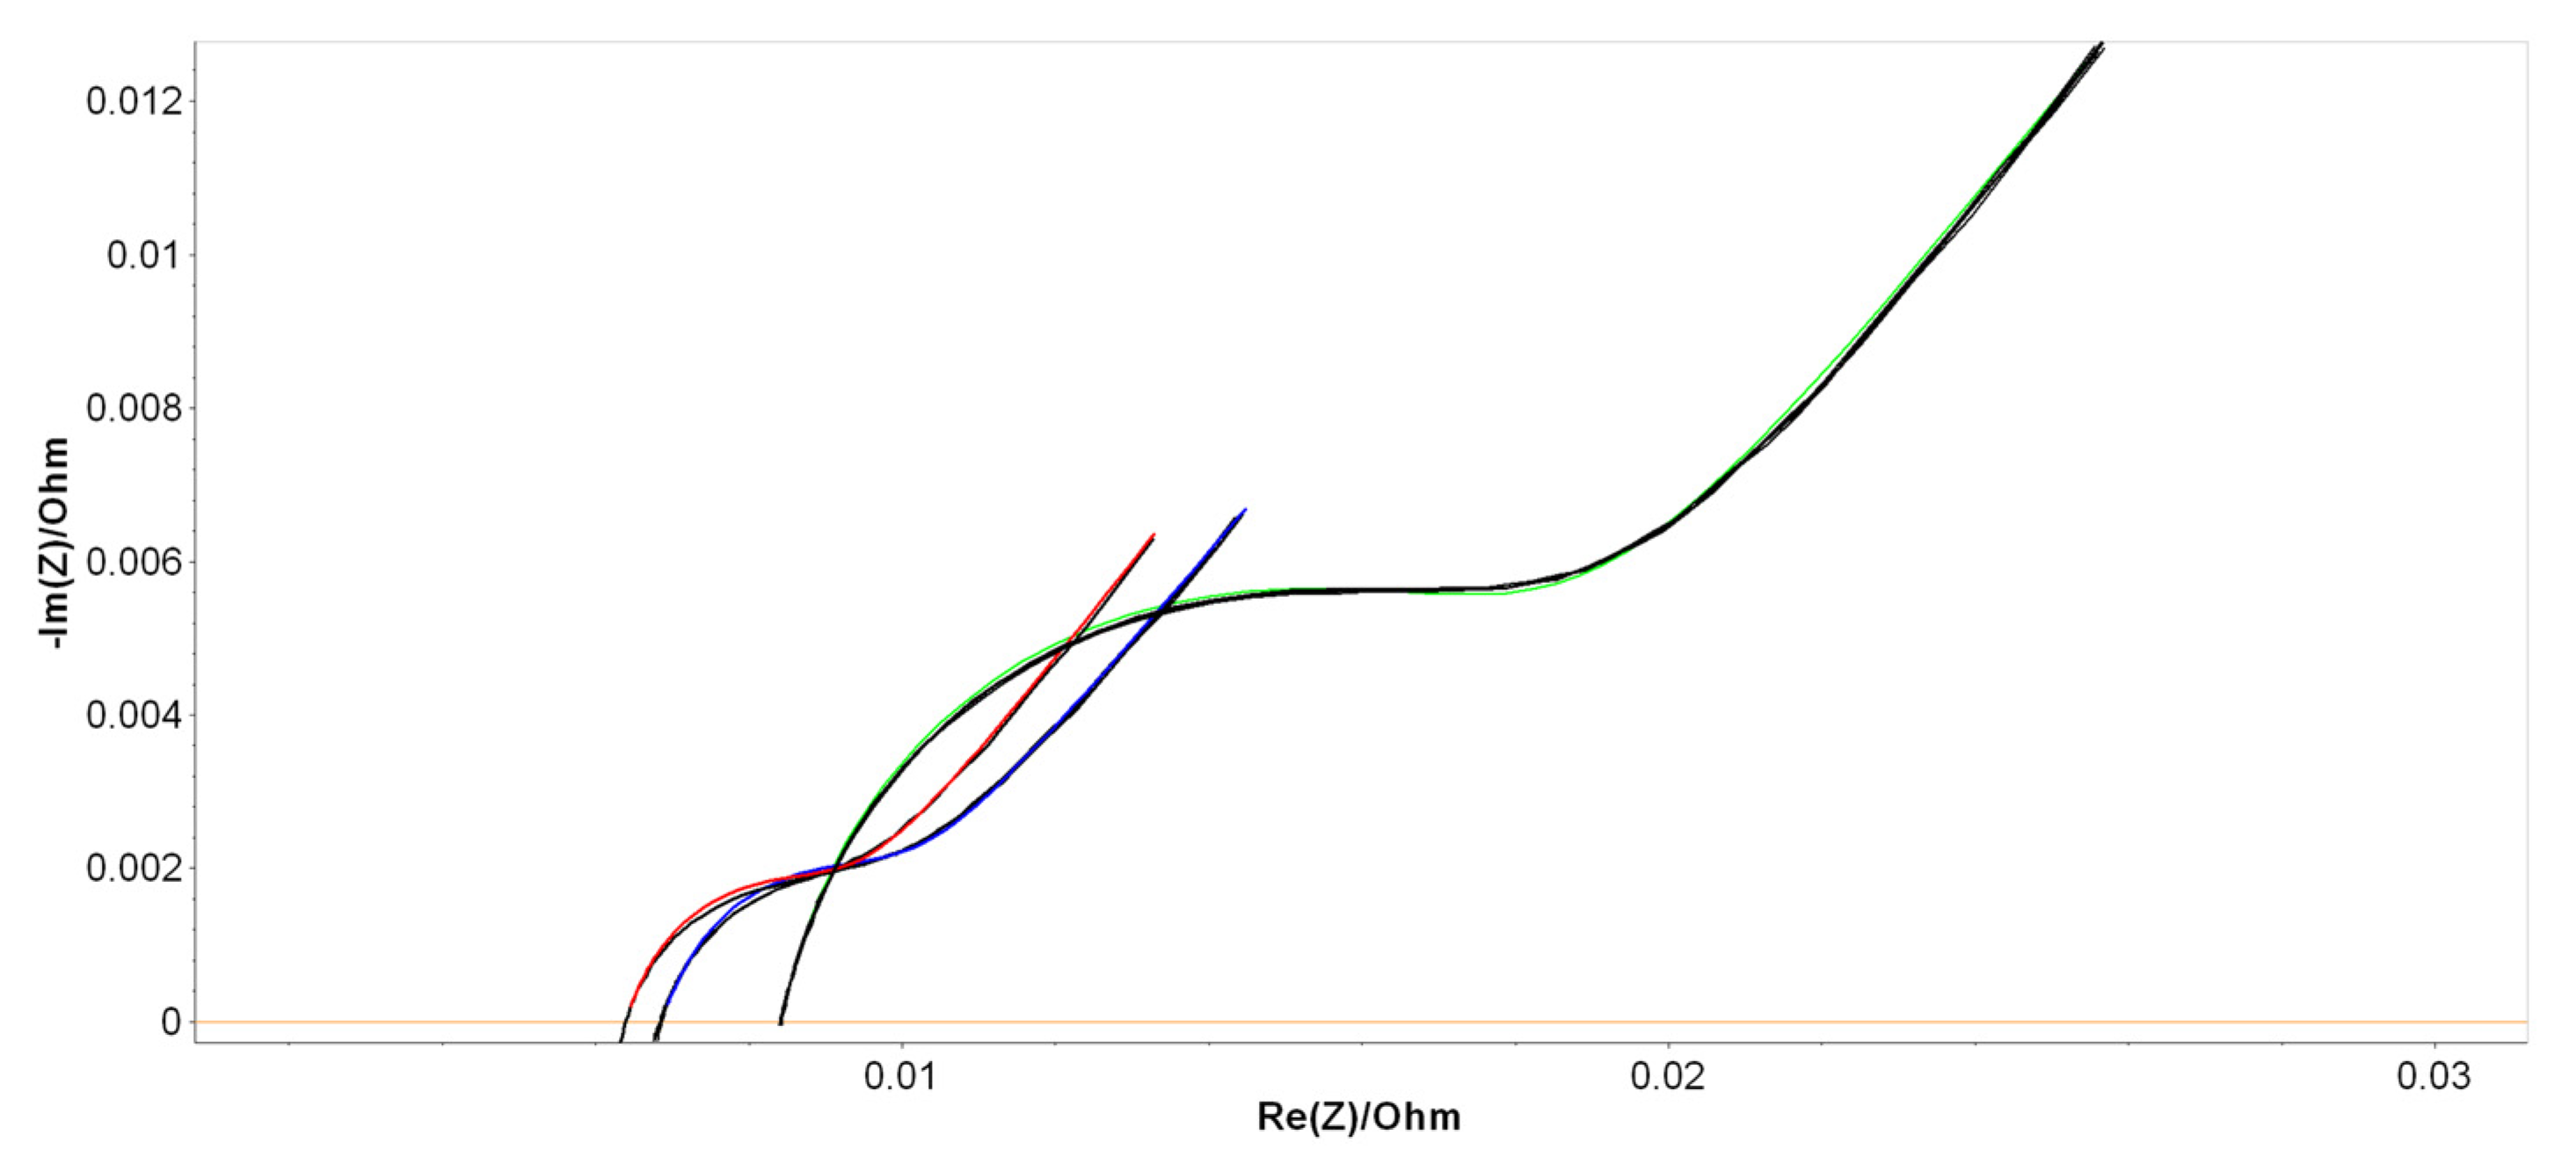
Figure 4. The results of the PEIS analysis are shown in
Figure 6, in which the Nyquist diagrams within their fitting curves were measured immediately after fabrication for the B2, B6, and B9 LAB prototypes. Similar diagrams were found for the 50% DoD partially discharged batteries aged at ROMBAT.
Table 2 includes the averaged values of all the measured Randles equivalent electrical circuit parameters, with the aim of investigating which parameter fluctuated the most in order to offer a predictable trend of the battery’s lifetime performance.
As a second objective, we tried to see whether our methodological approaches that were applied previously in various LAB characterizations [
41,
42,
43] were confirmed, even if the manner of measurement was different: the battery cycling was industrially controlled and just two measurements were made. As we already saw in our previous works, a linear decay of Q occurred in their second-half period. However, this is a different situation now, where we performed PEIS measurements only on two particular phases (at the beginning and end of life), not on the entire spectrum of the charging/discharging cycling.
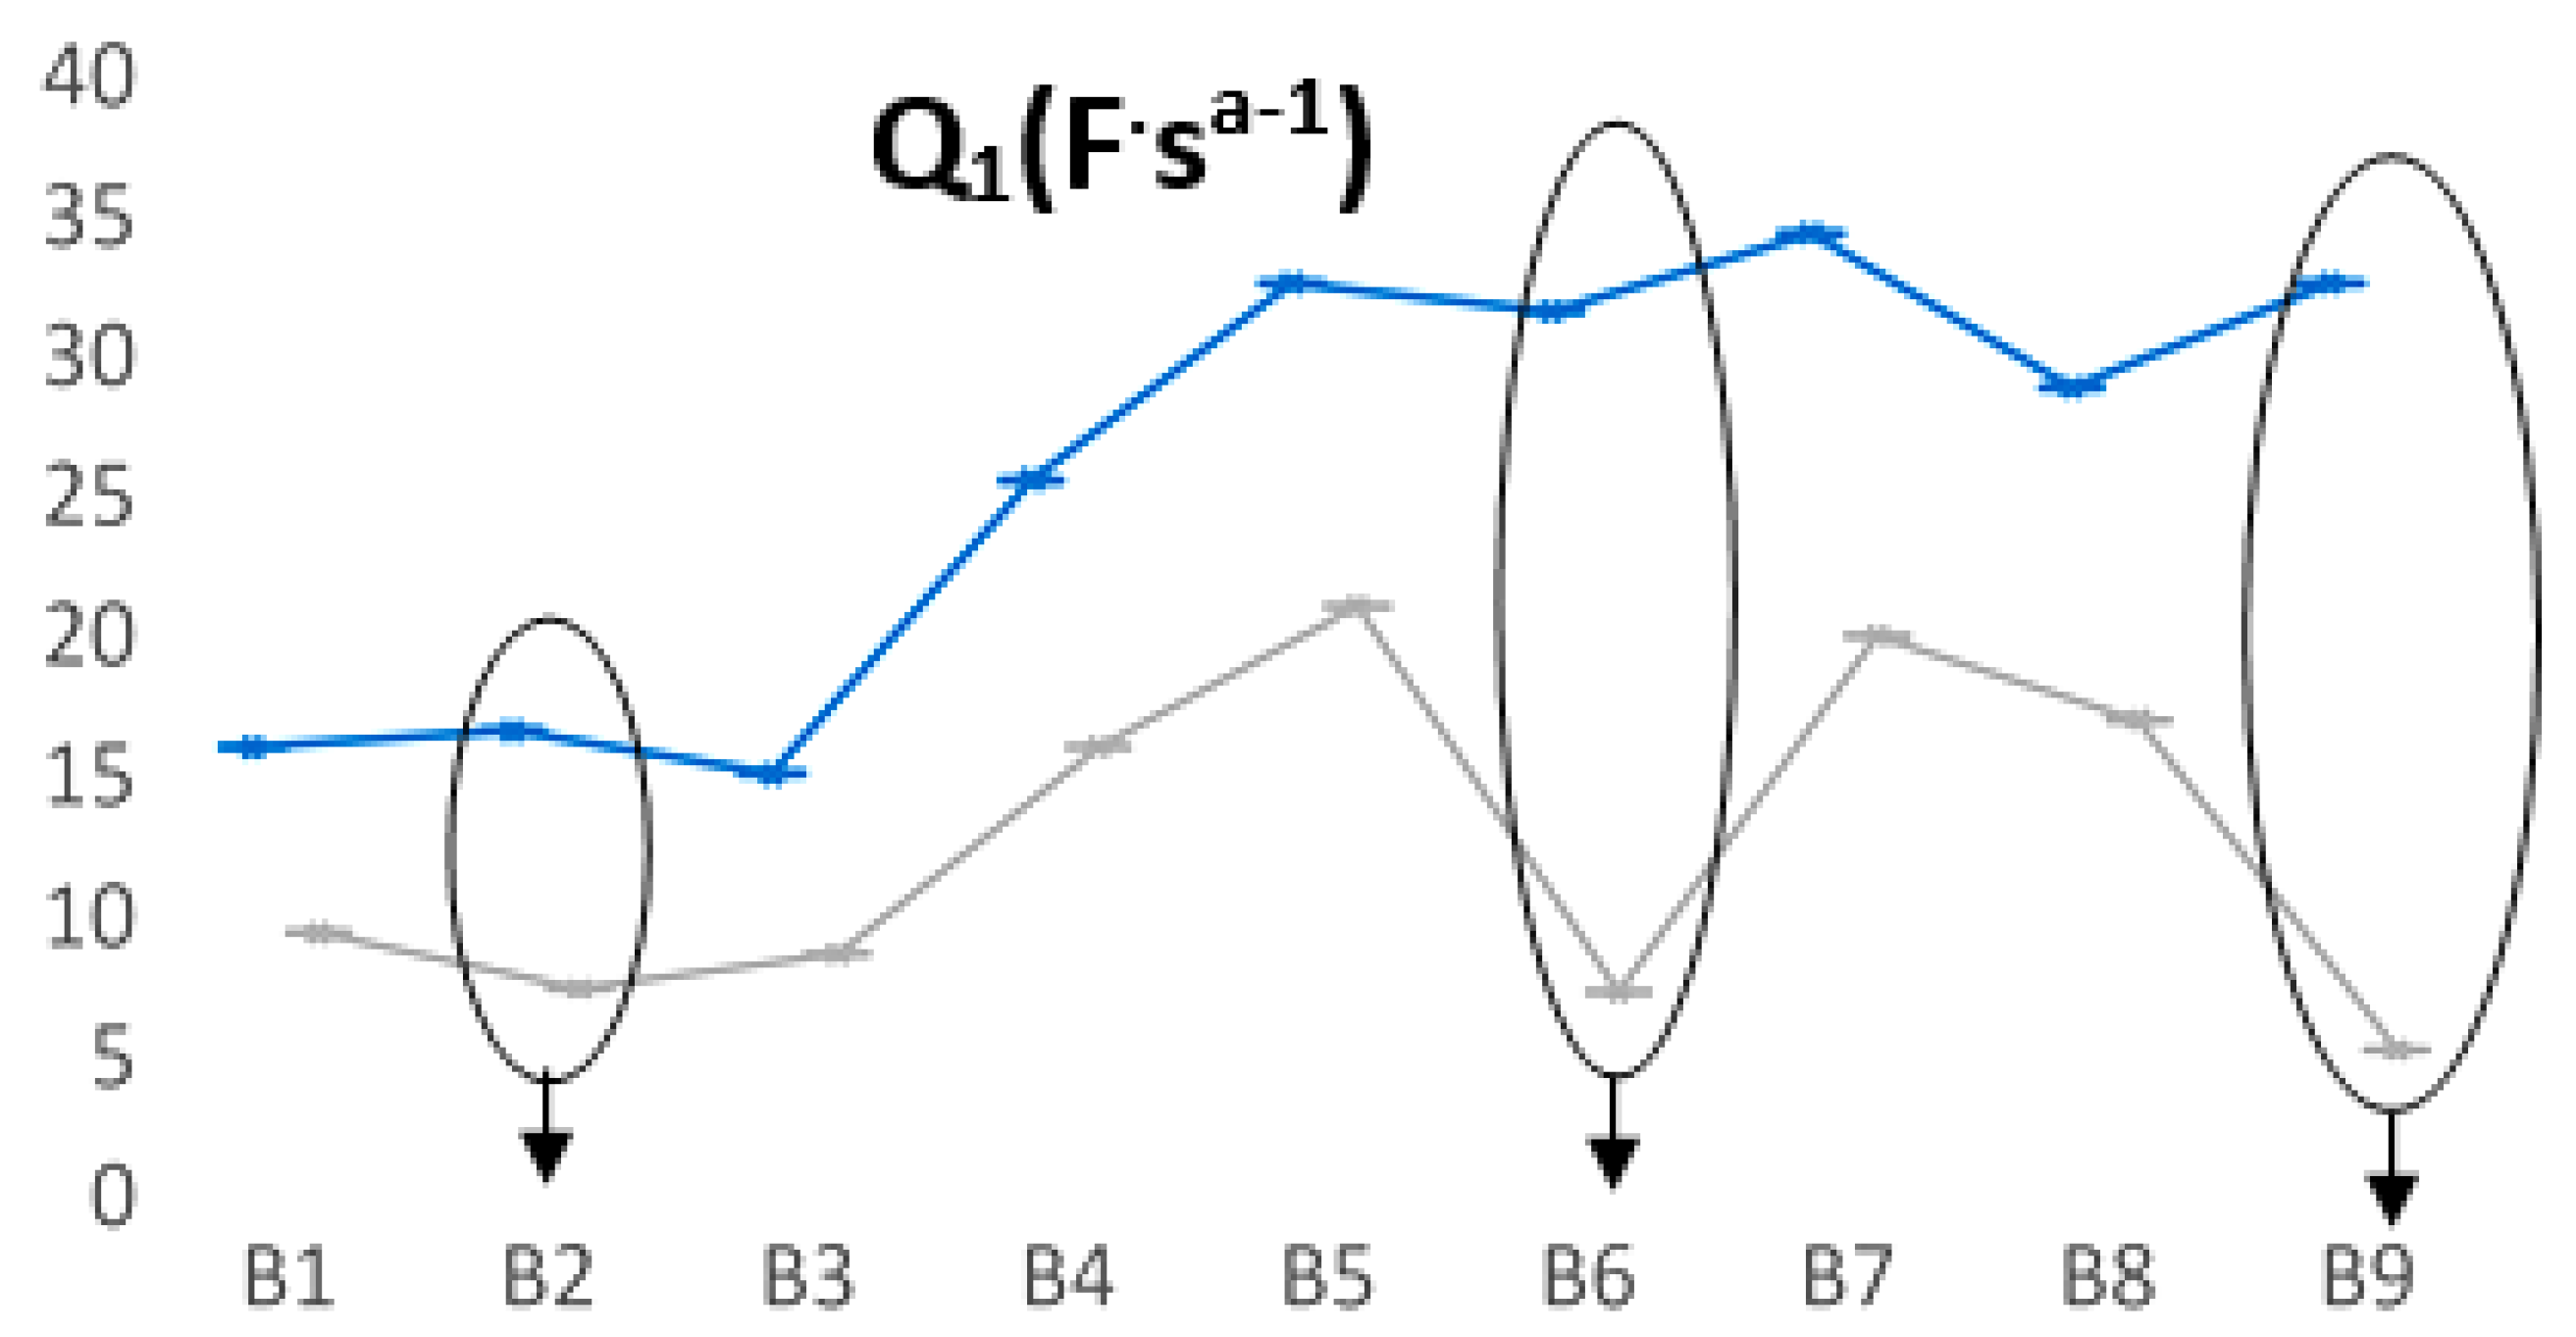
Figure 7 summarizes the most relevant fluctuations of the Q
1 parameter. For batteries that have a longer life, a smaller value of the Q
1 parameter is observed when batteries are discharged, thus significantly increasing the length difference between the two states (we encircled B2, B6, and B9). Even for the B2 prototype, the trend was confirmed, in which the discharging cycles were quite appropriate for all three L2 FLO 52 Ah types/technologies, while for the B6-L2 EFB 60 Ah and B9-L3 EFB 70 Ah batteries, this range was obviously much longer. This means that at each point of measurement, we could forecast the battery lifespan, taking into account the two limits of Q
1 values for each type/technology.
Going further, we saw another fluctuation that appeared in the case of the Q
3 parameter, which also highlights some predictable aging trends in the opposite direction to Q
1.
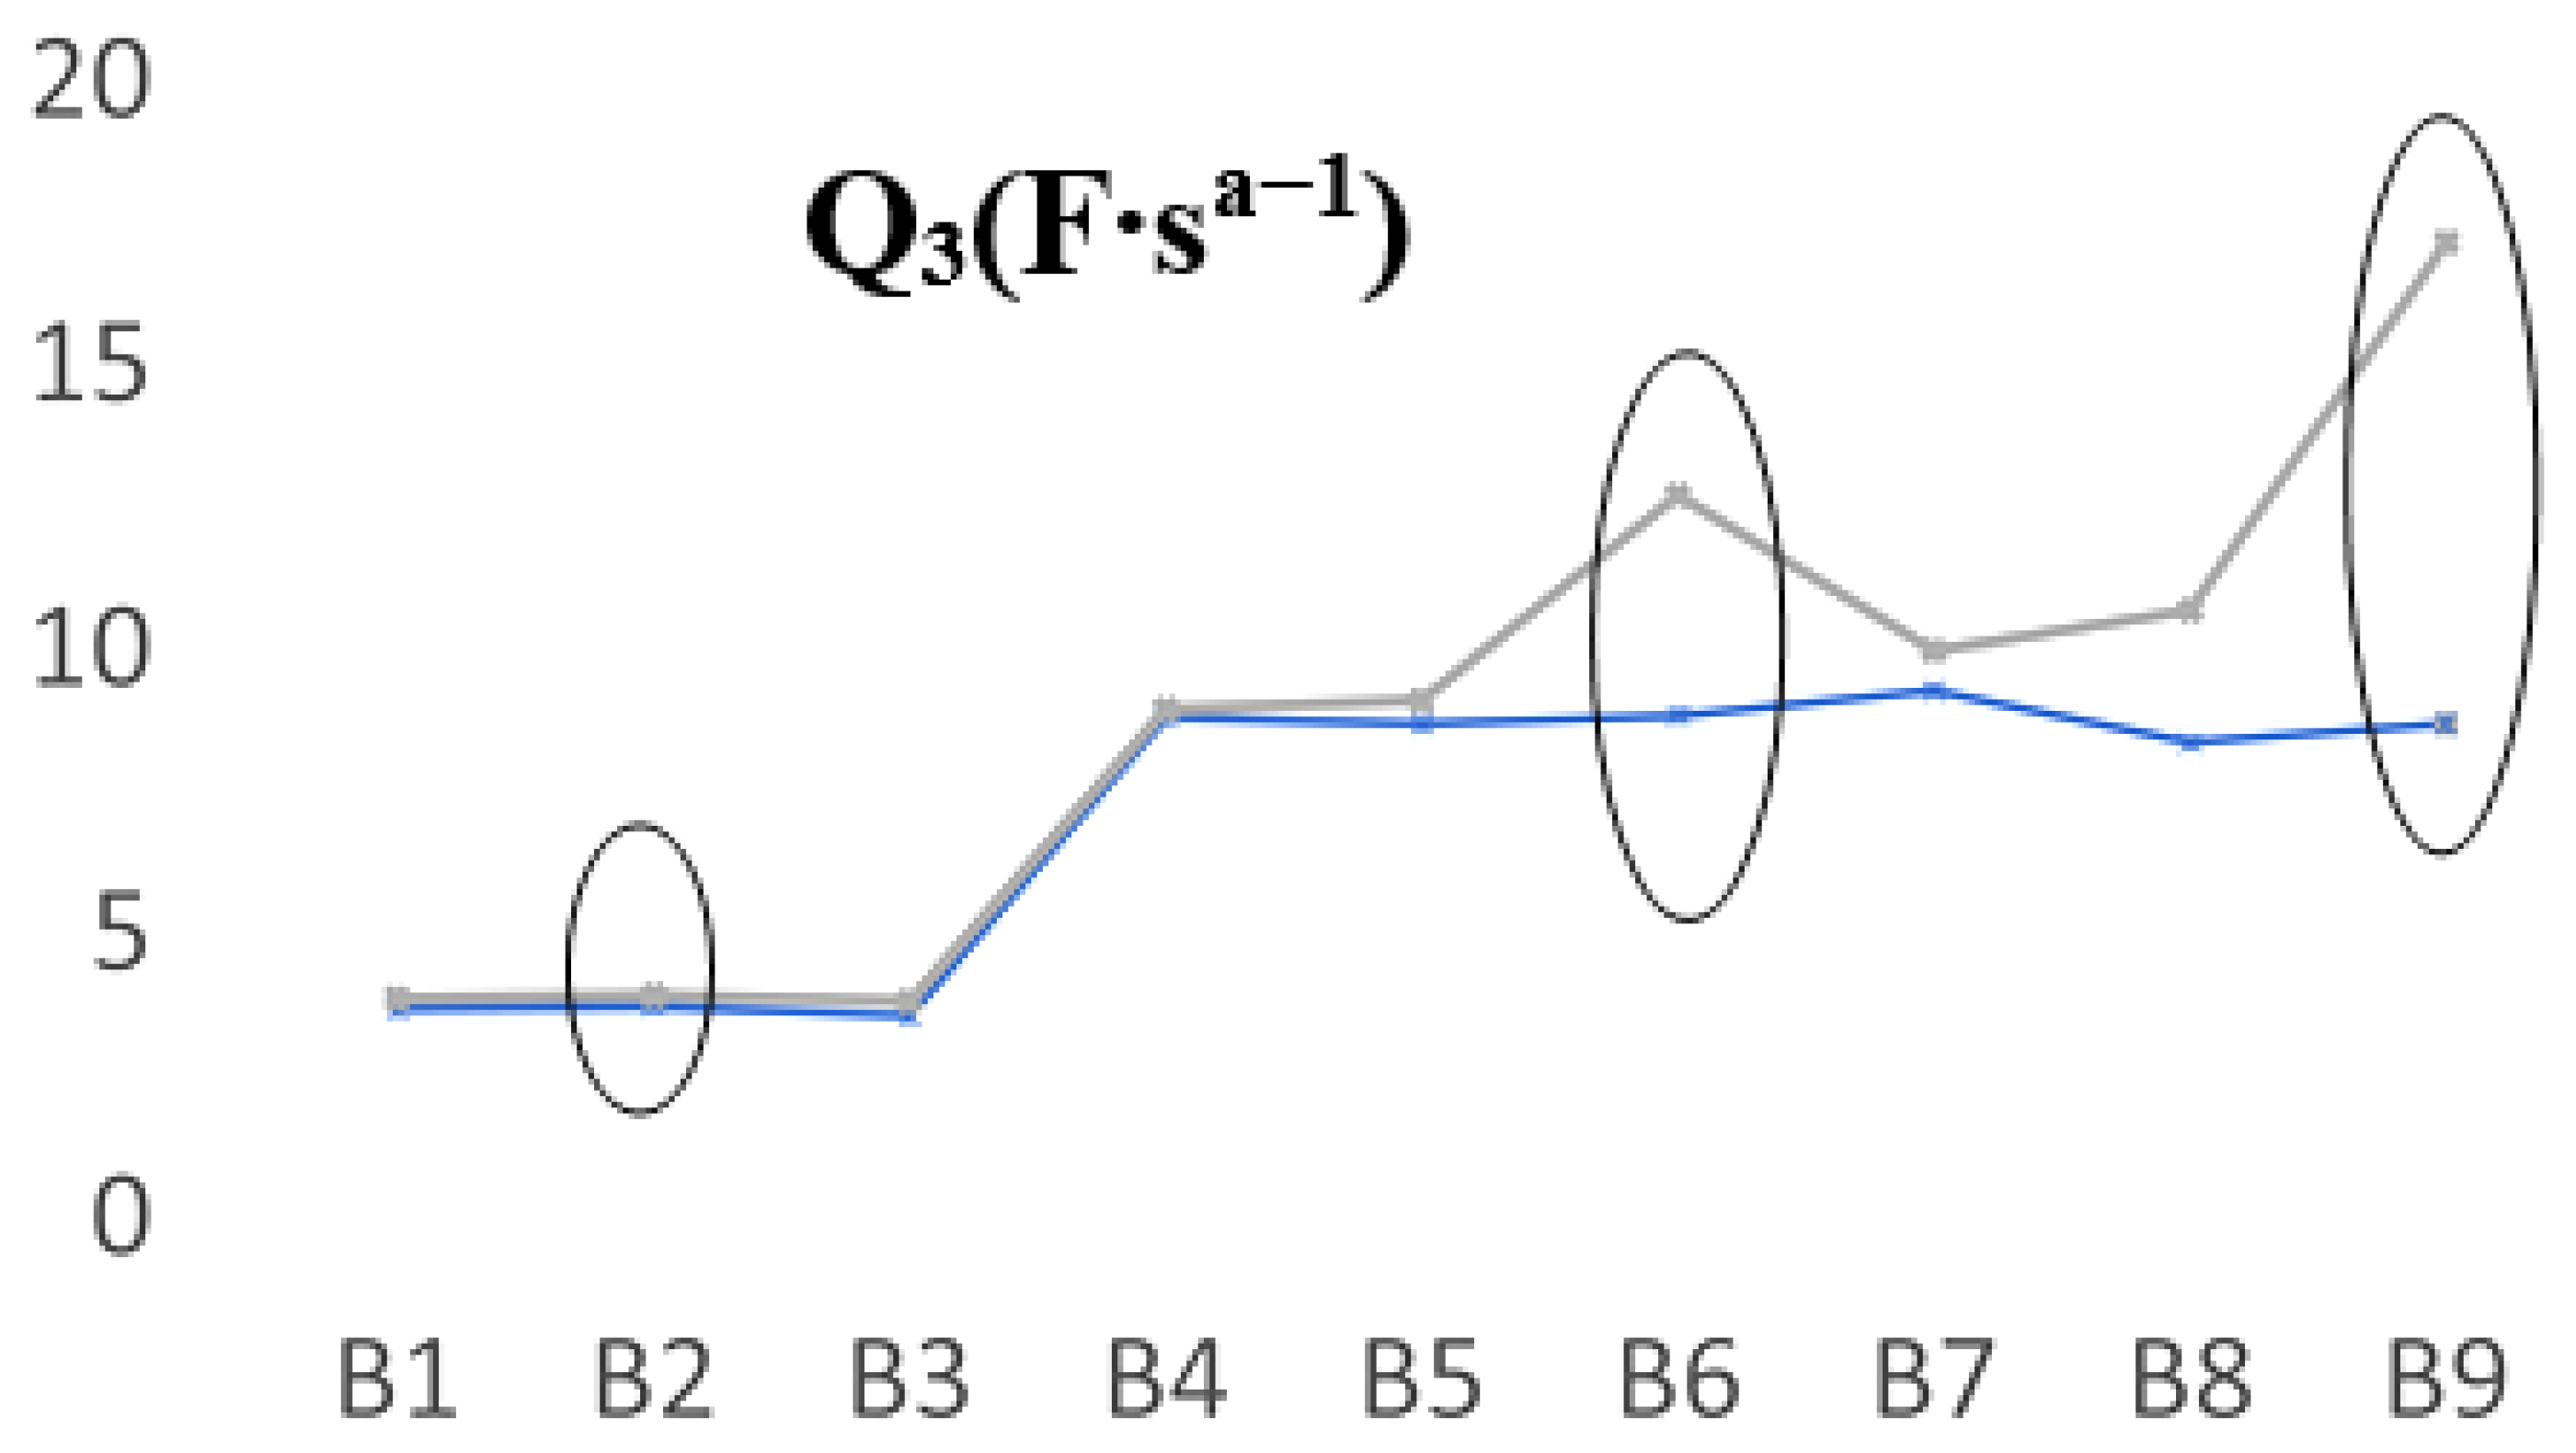
Figure 8 shows the measured values of the Q
3 parameter when the batteries were new and aged. In this case, for the FLO 52 Ah batteries, the B2 behavior was very similar in all cases, thus we can assume that a possible explanation of the values obtained for Q
3 was due to the decrease in the amount of electrolyte. However, their discharging cycling showed close values. For the B6 and B9 prototypes, in the discharging cycles, a significant shift appeared, in particular for the last battery, which was the best-performing type, as we can see from
Table 1. It seems that there was a direct correlation between the Q elements (Q
1 and/or Q
3) and the phenomena that occurred near the electrodes, in which clear fluctuations of the capacity (linked to the double layer) appeared due to some possible distinct planarity imperfections, rugosity, or undesirable chemical processes that take place when a battery is constantly charged and drained.
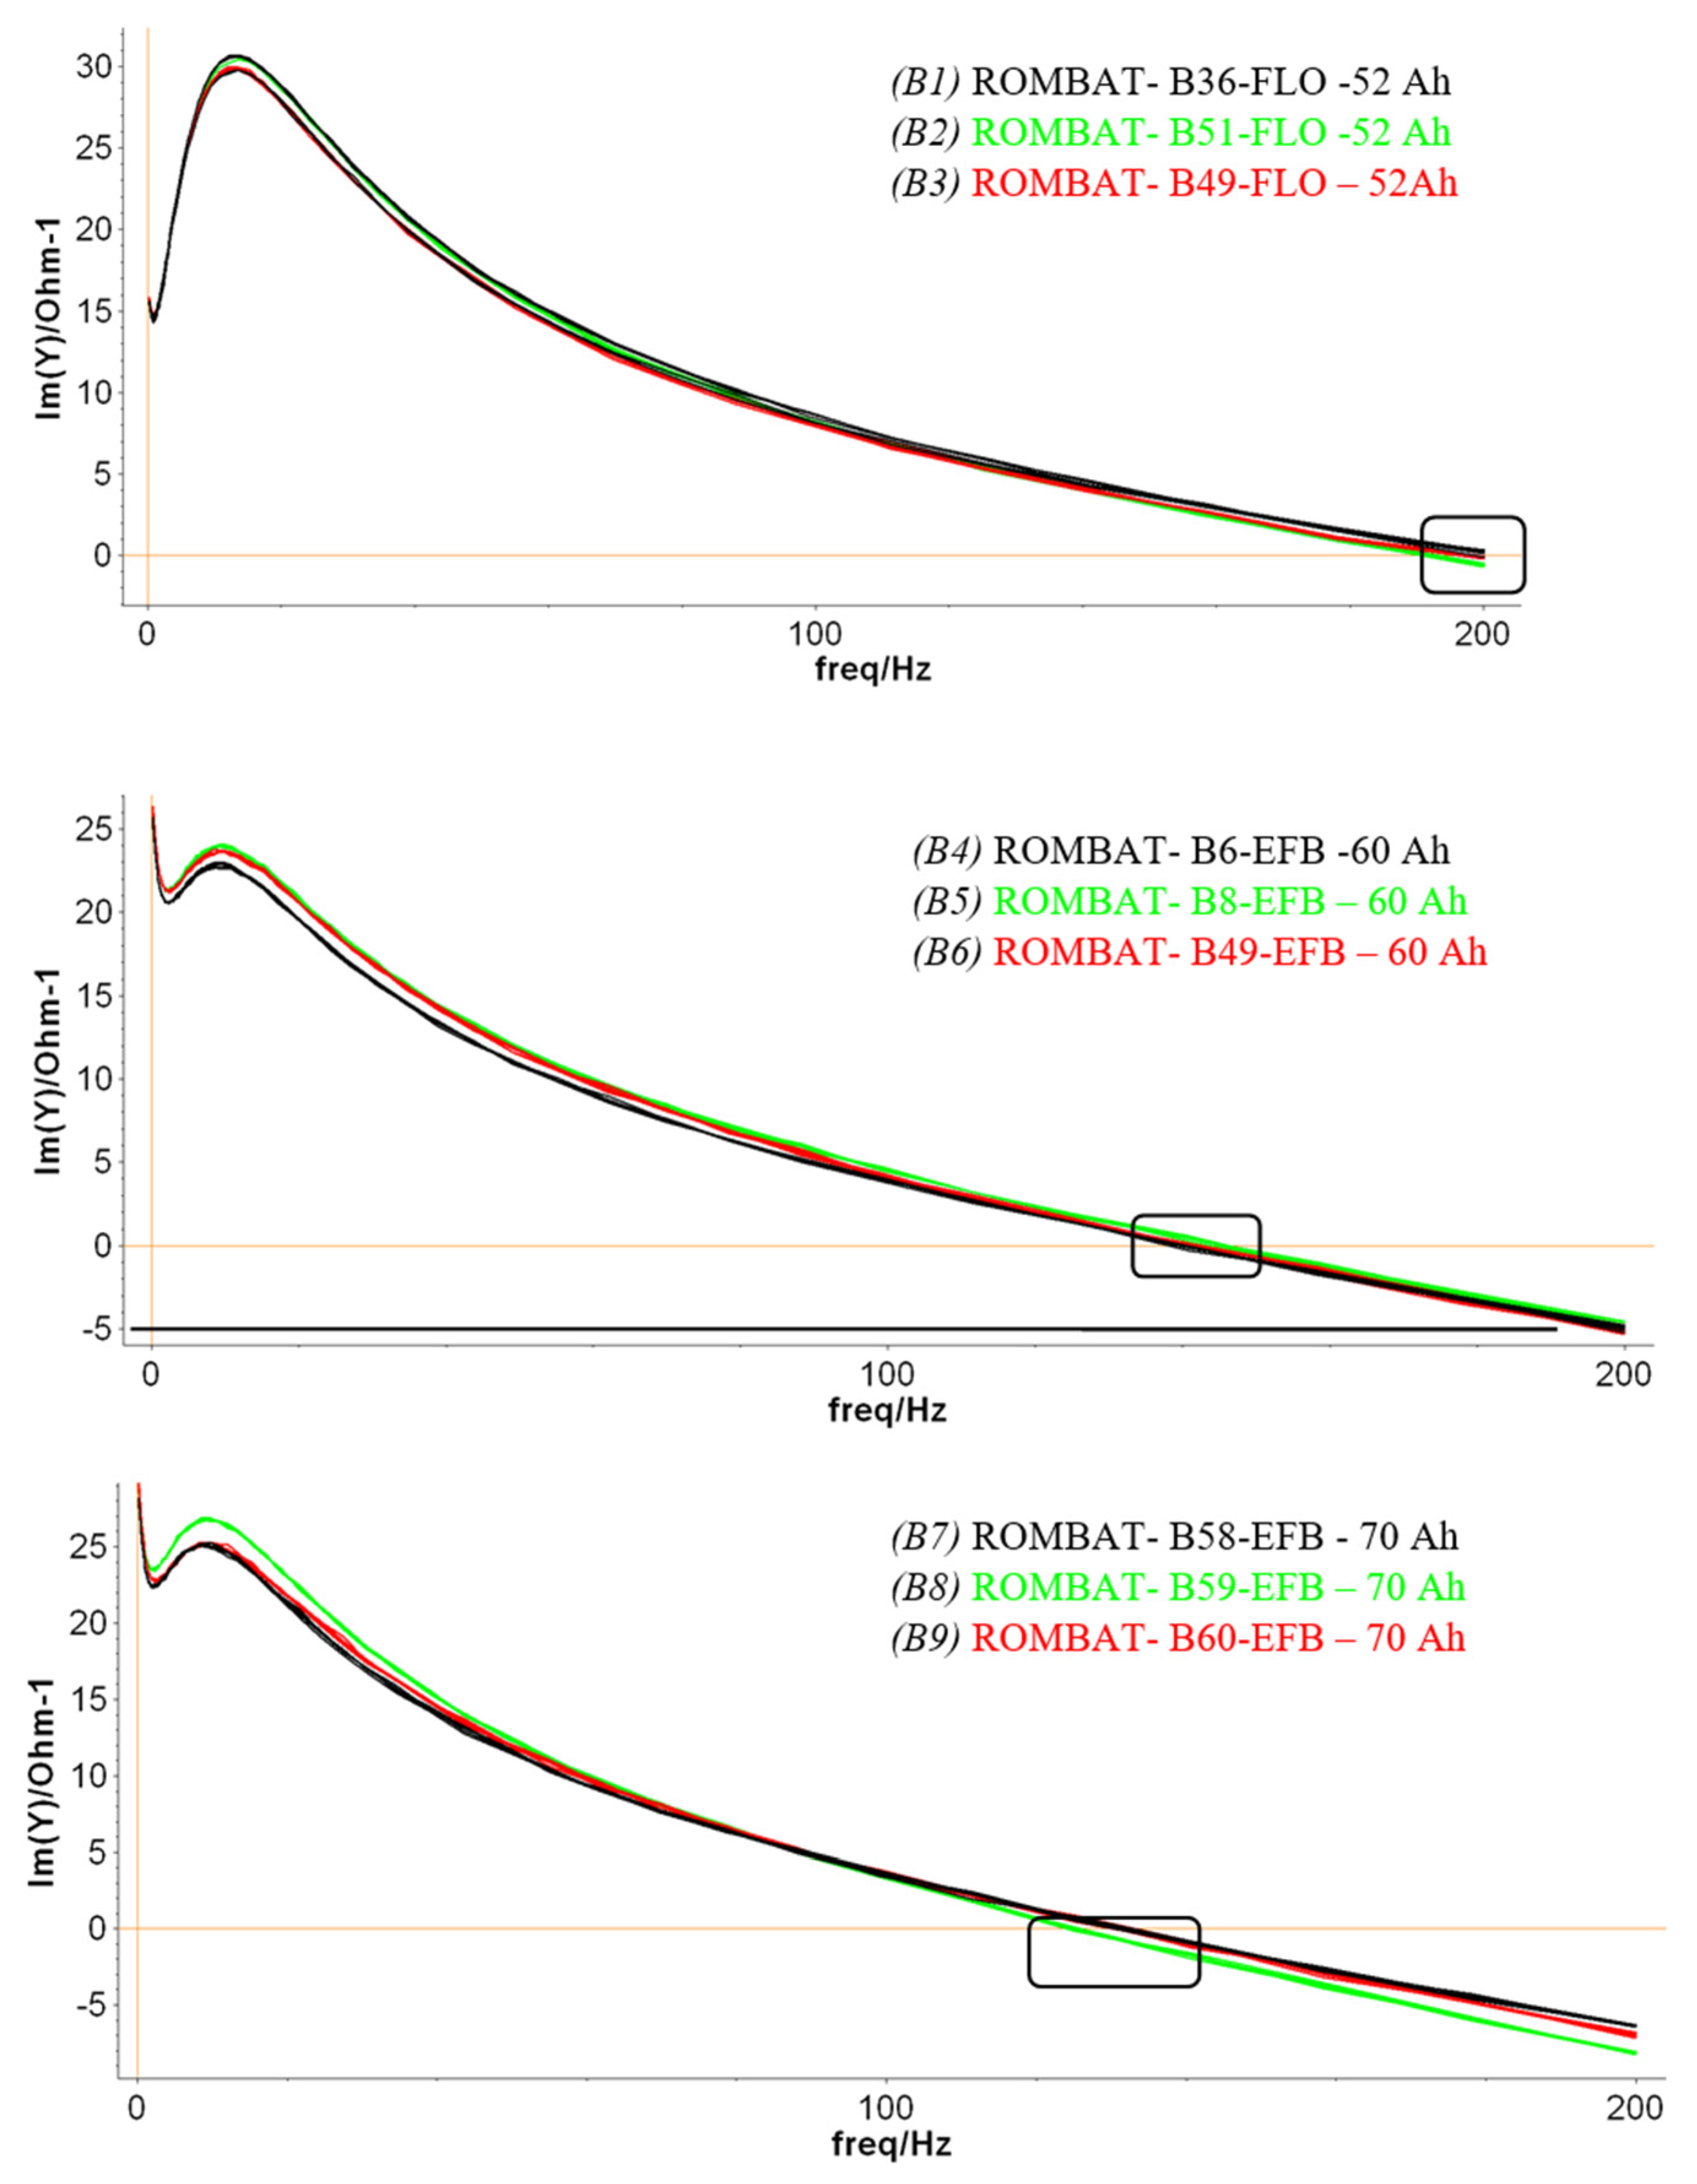
3.3. Resonance Frequency Analysis
Following the impedance plots vs. frequency diagrams, when fully charged, we measured the batteries’ SoHs by monitoring one particular parameter, namely, the resonant frequency of the circuit, without any fitting of equivalent circuits or parameter interpretations. This approach was successfully used by us in previous works [
40,
42], resulting in reliable results for predicting LAB lifetime performance. The aim was to offer a qualitative frame of how electronic measurements can produce chemical data.
The results presented in
Figure 9 correspond with the first phase of the experiment, while in the second stage, a similar approach was made after the batteries were aged at the ROMBAT factory to 50% DoD. We regularly discharged the batteries at a lower percentage amount than to drain the battery to its maximum DoD in order to obtain more charging/discharging cycles and, consequently, to prolong the battery lifetime.
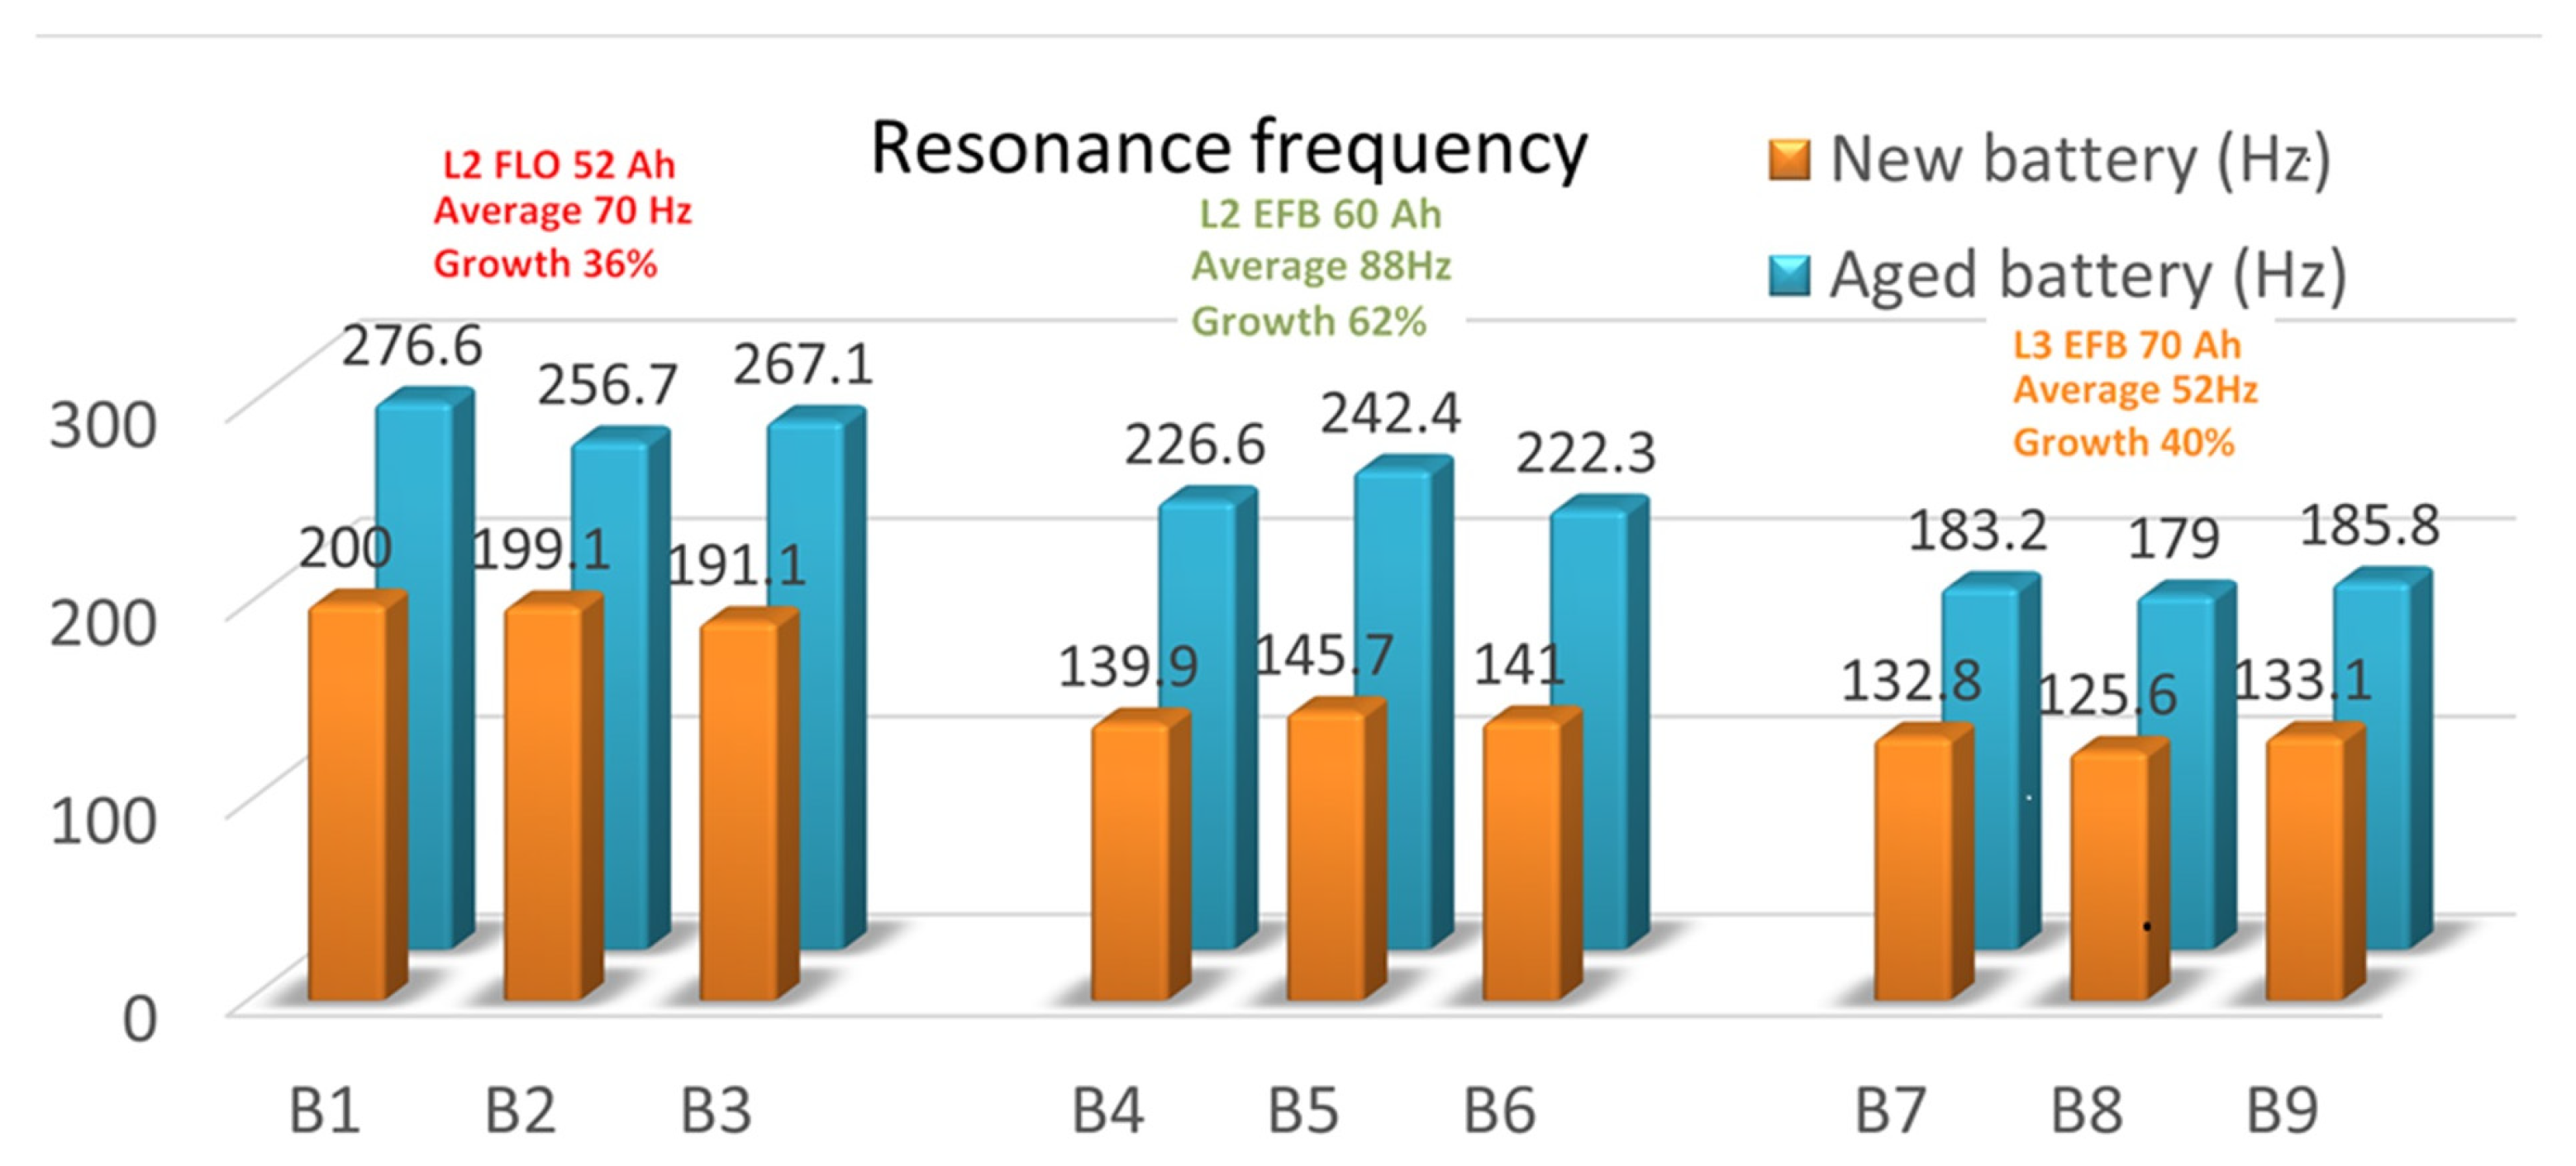
Table 3 summarizes the resonance frequencies obtained on the three sets of the new and aged batteries. An average of the resonance frequency values was applied for each battery type/technology. Moreover, the maximum number of discharging cycles (in blue) and the minimum number of discharging cycles (in red) are shown for each battery type in order to correlate them as prediction factors for the LAB lifetime.
For better visualization,
Figure 10 illustrates the resonance frequency increase in both the charged and end-of-life batteries, together with their averaged frequencies and growth percentages. As can be seen, an upward trend in the frequency values was obtained in all the cases. Depending on the way the batteries were manufactured (type and/or technology), an increase in the resonance frequency appeared in all cases, from new to used batteries. The average increase in resonance frequency was different in all cases: 70 Hz for the L2 FLO 52 Ah B1-B3 type, 88 Hz for the L2 EFB 60 Ah B3-B6 type, and 52 Hz for the L3 EFB 70 Ah B6-B9 type. Thus, we can assume that the 50% DoD cycling ended when the resonance frequency increased with 36% for the first battery package, 62% for the second package, and 40% for the last battery type/technology.
For example, if we consider the first battery type of L2 FLO 52 Ah, we can see that for the B2 prototype, an increase of 57.6 Hz between the two phases highlighted the longest cycle life. If this difference increased, as in the cases of B1 and B3, the aging of the battery was faster. For the L2 EFB 60 Ah type, we observed that an 81.3 Hz difference between the measurements highlighted an impressive number of 228 charging/discharging cycles until the battery was out of service. Again, when the difference increased, as for B4 and B5, the cycle life of the batteries decreased, in this case dramatically, with ~4 times less than the B6 accumulator. The last package of L3 EFB 70 Ah showed that for B9, the optimal difference of 52.7 Hz displayed the best performance of the B9 battery prototype, with 254 charging/discharging cycles. The B7 and B8 battery types displayed a much shorter cycle life, with just 23 charging/discharging cycles, even if the difference in absolute value between the new and used tested batteries was quite small. However, because this analysis was undertaken in just two specific SoC stages, namely, at the beginning and the end of the LAB life, it is quite hard to offer a qualitative trend prediction of a particular battery prototype.
4. Conclusions
Here, we combined the controlled aging of nine LAB prototypes with EIS measurements in order to highlight the connection between their SoH vs. electric response. Since we focused on finding a linear and reliable evaluation of lead–acid accumulators, we decided to use the EIS analysis of Q-Q0 total charge fluctuations after fabrication; the decay values of CPE in two phases, namely, at the beginning and the end of life; and the resonance frequency modifications.
Concerning the first approach, the level of charge after each PEIS measurement was measured in terms of the Q-Q0 total charge exchanged. By analyzing the amount of capacity that was lost in time during the discharging cycling in all prototypes, we observed that the lower fluctuations in capacity came from batteries B2, B6, and B9, which were the best-performing ones.
In the second approach, we focused on the CPE element analysis as a fundamental quality fit parameter of EIS data. The prevalence of capacitance was studied in the light of the non-ideally polarized electrodes, thus assessing the modifications that appear on the CPE usage. Immediately after fabrication, at 100% SoC, the fit applied to Randles equivalent parameters could not provide a viable trend that was able to predict the LABs lifespan for any of the battery’s type/technology. At the end of life, a clear modification of the CPE parameter allowed for a qualitative analysis that was able to provide the decay of the battery SoH. All the other values of the measured equivalent circuit parameters remained constant, with two exceptions, namely, Q1 and Q3. The asymmetric behavior of these elements was probably caused by the sulfating effects that were quite strong in the lead–acid plates during the charging/discharging cycles. Our data suggest that this behavior can be directly associated with the manufacturing quality and/or technology of the batteries. Producers can establish the quality of the LABs from the slopes of Q1 and Q3 at the end of life, thus allowing for analyzing the validity of technological innovations, which may lead to an increase in the battery’s lifetime. This typical behavior of Q1 and Q3 occurred in the second part of the battery lifetime and is associated with a qualitative factor in battery fabrication. The length distances between the Q values were very similar for the three B2, B6, and B9 batteries, suggesting that this was a characteristic of the battery performance. Using discharge cycling, we know that these prototypes performed the best, depending on their type/technology, and thus, the producers can assess LAB quality from the slopes of Q at the end of life.
By analyzing the single resonance frequency parameter in the two phases, we saw that when the DoD cycling ended, the resonance frequency increased by 36% for the first battery package, 62% for the second package, and 40% for the last battery type/technology. Moreover, for the LABs at 100% SoC, the degradation of the battery led to more important variations in resonance frequency, while for the LABs aged at 50% DoD, smaller fluctuations occurred. This suggests that the concentration of lead sulfate in LAB prototypes, as well as their physical parameters, were significant in establishing the resonance frequency since the effect of charging/discharging cycling was to decrease/increase its content. This data allowed us to predict when LABs aged with 50% DoD arrived at the end of life as a function of their type and/or manufacturing procedure. Based on these perspectives, we can perform an early prediction of a battery lifespan at each moment of discharging, and as a consequence, which type/technology produces the best performance.


