Article

Effects of Different Charging Currents and Temperatures on the Voltage Plateau Behavior of Li-Ion Batteries

1
School of Rail Transportation, Soochow University, Suzhou 215131, China
2
School of Mechanical Engineering, Nantong University, Nantong 226019, China
3
School of Zhang Jian, Nantong University, Nantong 226019, China
*
Authors to whom correspondence should be addressed.
Batteries 2023, 9(1), 42; https://doi.org/10.3390/batteries9010042
Submission received: 17 November 2022 / Revised: 25 December 2022 / Accepted: 4 January 2023 / Published: 5 January 2023
(This article belongs to the Special Issue Lithium Batteries: Theory, Design, and Applications)

Abstract

:
Lithium-ion power batteries, which are the foundation of electric cars and are expected to play a significant role in a variety of operating environments and application situations, have major development prospects. In order to obtain the optimal operation range of ternary Li-ion batteries under various current rates and test temperatures, the characteristics of the voltage plateau period (VPP) of batteries in different states are examined by piecewise fitting based on charging and discharging cycle experiments. The findings demonstrate that while charging at current rates of 0.10C, 0.25C, 0.50C, 0.75C, and 1.00C under temperatures of 40 °C, 25 °C, and 10 °C, the battery’s termination voltage changes seamlessly from 3.5–3.75 V, 3.55–3.8 V, 3.6–3.85 V, 3.7–4 V, and 3.85–4.05 V, the growth in surface temperature does not surpass its maximum level, and the charge capacity exceeds 50%. Batteries operate more effectively. When the test temperature is −20 °C, the voltage rebound stage that occurs in the initial period of charging at 0.50C, 0.75C, and 1.00C accounts for the highest charge capacity, close to 70%. The study’s findings can be used as a guide when designing a lithium-ion power battery’s model and control method for an electric vehicle’s energy storage system.

1. Introduction

Due to their environmental protection and security features, electric vehicles have emerged as one of the primary modes of transportation for the development of smart cities in a low-carbon society [1,2,3]. The energy storage rate, service life (number of cycles), and relatively cheap cost are crucial factors for electric car energy storage systems. According to one theory [4], the storage system’s capital cost should be comparable to or lower than $250/kWh with a life span of 3900 cycles in order to be competitive. Compared to batteries such as lead–acid and nickel–hydrogen batteries, Li-ion batteries provide benefits such as a high voltage plateau, compact size, low weight, no pollution, recyclability, and high durability [5]. Currently, the lithium battery is starting to rule the sector of relatively brief power storage.
LiFePO4 batteries and nickel-cobalt-manganese (NCM) ternary Li-ion batteries are two types of lithium batteries that are most frequently used in electric vehicles. Table 1 compares the performances of LiFePO4 batteries and NCM ternary Li-ion batteries. Ternary Li-ion batteries, which are more suitable for cold climates and may also meet the needs of people traveling long distances, are more energy dense and operate better at low temperatures than lithium iron phosphate batteries [6,7,8,9]. The energy density of lithium batteries increases with the nickel content because ternary lithium batteries, which use LiNixCoyMn1−x−yO2 as the cathode material, derive their energy mostly from the nickel material’s redox [10,11,12]. A high-nickel ternary Li-ion battery is prone to producing cubic halite facies, which reduce its ability to facilitate lithium ion de-embedding after several cycles and are unstable at high temperatures [13]. The high-nickel ternary Li-ion battery is still one of the future trends, as there is a significant need for high energy density in both the nation and the market.
During this time, a significant variety of research procedures have essentially reached maturity for the research of lithium iron phosphate batteries, serving as a kind of reference for investigations on NCM ternary Li-ion batteries with different current rates and a broad range of temperatures. Huang [14] found that an optimal temperature interval exists for the batteries at a specific cycle multiplier by studying the cycle curves of lithium iron phosphate batteries at different temperatures (5–55 °C). The dV/dQQ curve was also applied to decompose the decay sources, and it was found that the loss of active lithium accounts for more than 80% of the total loss after the total capacity decay reaches 20%, providing a theoretical basis for the segmentation design and improvement of long-cycle-life lithium iron phosphate batteries. Chen et al. [15] investigated the impact of temperature on LiFePO4 batteries’ median voltage. At low temperature, the median voltage and capacity rapidly declined, and at high temperature, the median voltage and capacity rapidly increased, but their change rate was lower than that at low temperature. The best working temperature is between 20 and 50 °C. Ye et al. [16] proposed that the optimal operating temperature range for lithium batteries is 20–40 °C. When the temperature is higher than 40 °C, the heat production and heat production rate of lithium batteries will increase rapidly, and the thermal performance under both steady-state and transient conditions will be significantly reduced. It can be found that the research on the segmental performance of lithium iron phosphate batteries has made some progress. According to the investigation of An [17] on the effects of the degradation of the capacity and reduced life span of Li-ion batteries, electrode thickness and permeability have a substantial influence on heat production and capacity variations. Despite the fact that battery aging will not impair safety when being charged at a high rate, according to Fleischhammer [18], the overaged lithium coating might hasten heat buildup and increase safety issues in a high-temperature setting. Shi et al. [19] investigated the link between the threshold charging voltage and cell capacity at low temperatures, pulsed energy output, and the cyclic stability of Li-ion batteries at high temperatures. It was found that the threshold charging voltage of 3.0 V led to high cell capacity at low temperatures, while batteries with a threshold charging voltage of 3.8 V had strong high-temperature cyclic durability. Wang [20] carried out high-rate (1C, 2C, 3C) charge–discharge experiments at 25 °C, 10 °C, 0 °C, −10 °C, and −20 °C. The experimental results showed that the charge–discharge time and capacity of the ternary lithium battery decreased with the decrease in the ambient temperature, and the internal temperature and internal strain increased with the decrease in the ambient temperature. When the ambient temperature dropped by about 10 °C, the charge–discharge time also decreased by about 10%. At 25 °C, 10 °C, and 0 °C, the battery presented a flat and long voltage plateau. However, when the temperature was −10 °C and −20 °C, the voltage rebounded at the initial stage of charging and discharging. It is challenging to satisfy the demands of EVs in seeking the ideal operating phase of a Li-ion battery under various conditions of operation because there are very few methodical trials to study charging character traits of ternary Li-ion batteries throughout segments than there are for lithium iron phosphate batteries [21,22,23].
The plateau characteristics of different lithium-ion batteries with the same polymer electrolyte may differ as a result of a number of variables, including differing element response potentials, various ratios of element concentrations during the electric reactions, and various manufacturing methods. Bloom et al. [24] employed the differential voltage approach to analyze the charging/discharging processes of a lithium battery with the decaying process of the battery capacity and obtained negative embedded lithium platforms of batteries using various electrolyte proportions based on the peak of the dQ/dV curve. Jia [25] studied the inflection point between the reaction stages of Li-ion batteries and discovered that the curvature point locations of continuous charge curves for an identical environment and the identical multiplicity were practically identical. Jia then suggested a method for estimating battery capacity that was predicated on the continuous charge curve. When charging and discharging batteries of the same specification at a rate of 0.1C, Zhang et al. [26] constructed a LiFePO4/C electrode material using various techniques and observed that the voltage plateau time and difference between the samples were different due to variations in the fabrication process.
A lithium battery should be summarized using multiple-angle tests to determine its regular properties, and then generic physical models should be built using parameter identification [27]. A square high-nickel ternary Li-ion battery is the subject of this study, and experiments with charge and discharge cycles at various current rates were conducted to track changes in lithium battery’s temperature, voltage, and capacity. These experiments were done to determine the lithium battery’s availability and safety at various test temperatures in step utilization. In order to model and build a control strategy for Li-ion batteries in the energy storage section of EVs, it is important to understand the characteristics of the VPP while the ternary lithium battery is in various operating states.

2. Materials and Methods

2.1. Object

Li-ion batteries are composed of a positive collector, a positive porous electrode, a microporous polymer diaphragm, a gel polymer electrolyte, a negative porous electrode, and a negative collector laminate. The collector is a metal foil, and the microporous polymer diaphragm achieves electrical isolation for the purpose of isolating electrons. As shown in Figure 1, when charging, lithium ions are firstly disengaged from the positive electrode, and with the flow of the electrolyte, they pass through the diaphragm and are finally embedded in the negative electrode. During the whole process, the positive electrode is in a lithium-poor state due to the continuous shedding of lithium ions, while the negative electrode is in a lithium-rich state due to the continuous embedding of lithium ions, so there will be a difference in the concentration of lithium ions inside the whole battery. At the same time, in order to maintain the balance of the entire circuit, the electrons in the positive electrode flow to the negative electrode through the external circuit. During discharge, the movement of lithium ions and electrons is reversed. The ternary Li-ion battery (manufactured by Contemporary Amperex Technology Co., Ltd., Ningde, China) is the research object chosen for this paper. Table 2 displays the important technical data.

2.2. Method

Lithium-ion batteries must be subjected to experimental testing in both small- and large-power output scenarios in order to determine the battery’s performance under various conditions, which will serve as the experimental foundation for the creation of a battery energy supply strategy [29,30].
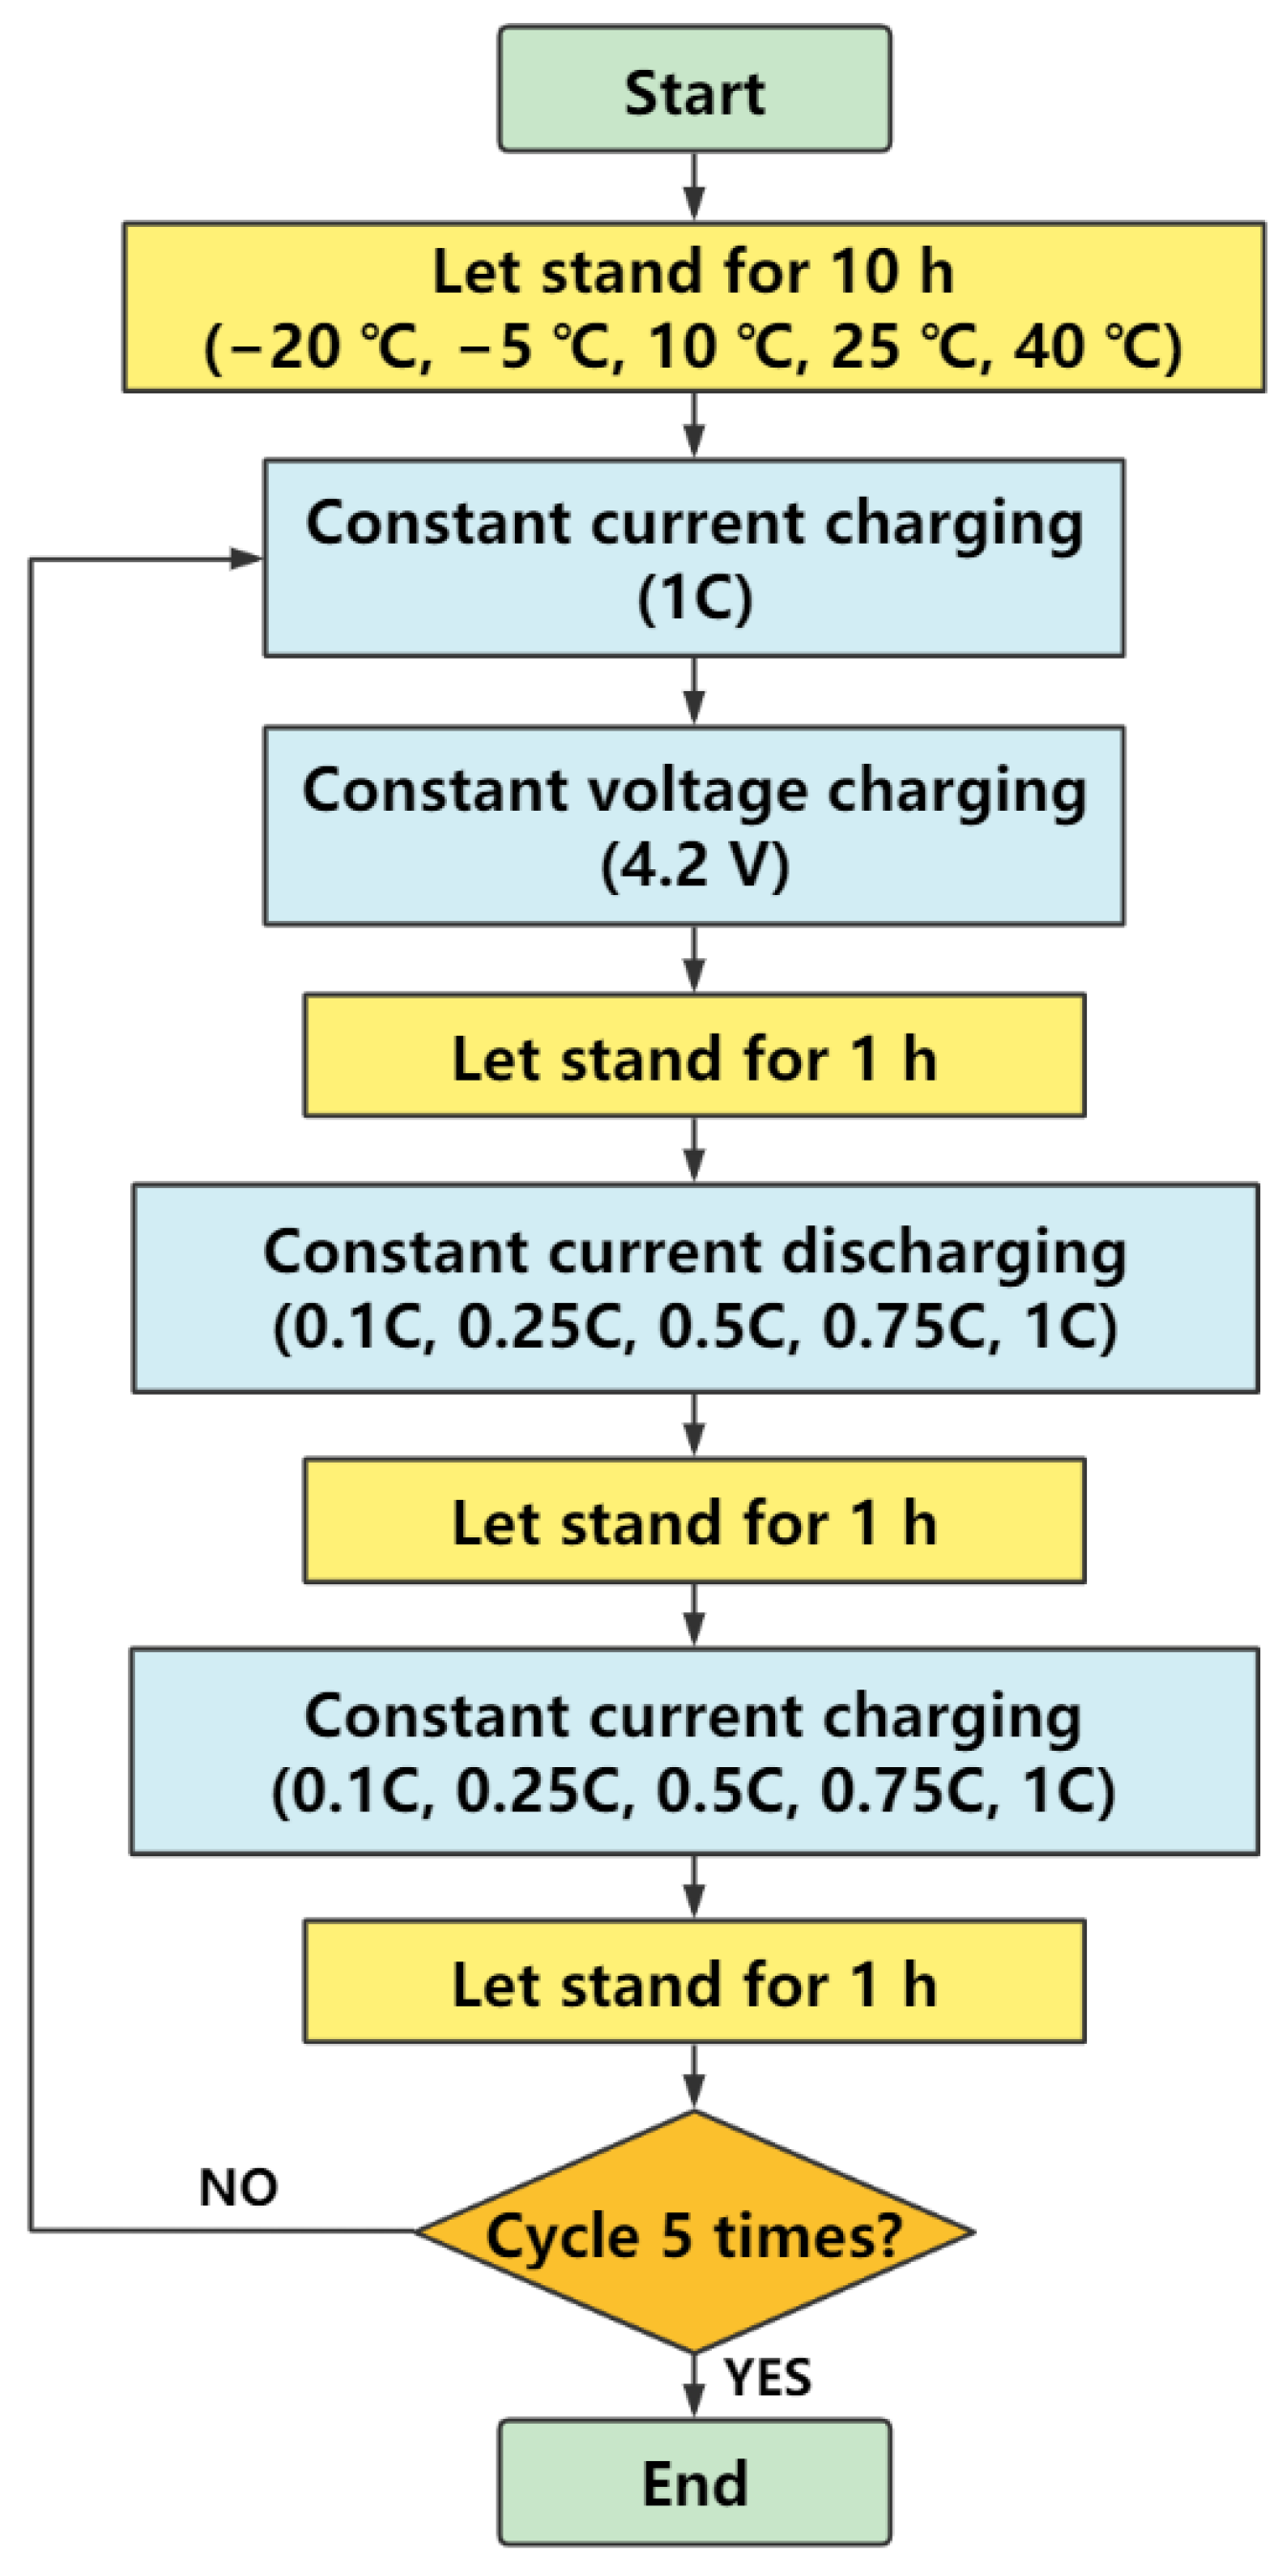
Figure 2 depicts the exact experimental procedure. The lithium battery should first be exposed to test temperatures of 40 °C, 25 °C, 10 °C, −5 °C, and −20 °C for 10 h before being charged with a constant current of 1C to the charging cut-off voltage (4.2 V) and then switching to constant-voltage charging. When the current rate is less than 0.05C, charging should be stopped. After resting for 1 h, charging and discharging experiments are performed. The protocol is to discharge the battery to the discharge termination voltage (2.75 V) at various rates of 1.00C, 0.75C, 0.50C, 0.25C, and 0.10C and then charge to the charge termination voltage at the same multiplier current [31].

2.3. Platform

The experimental platform comprises a CT5002A battery test system (LANHE, Wuhan, China), a programmable constant temperature and humidity chamber (Sanwood, Dongguan, China), a related detecting unit, a mainframe, and control software. Figure 3 displays the equipment used for the tests.

3. Results

Aiming at the availability and safety of square ternary lithium batteries under various test temperatures and current rates, charge–discharge cycle experiments were carried out to study the variation of the voltage, temperature, and capacity of lithium batteries, which can lay a foundation for further exploration of the characteristics of the voltage plateau period under different operating states.
Since the battery management system manages the charging and discharging of Li-ion batteries and their equilibrium in the process of field service, it was presumed in this study that there was no mutual distinction among each Li-ion battery, and the equilibrium throughout the charge and discharge procedure was neglected [32].

3.1. Variations in the Test Temperature’s Impact on the Battery Charge Voltage

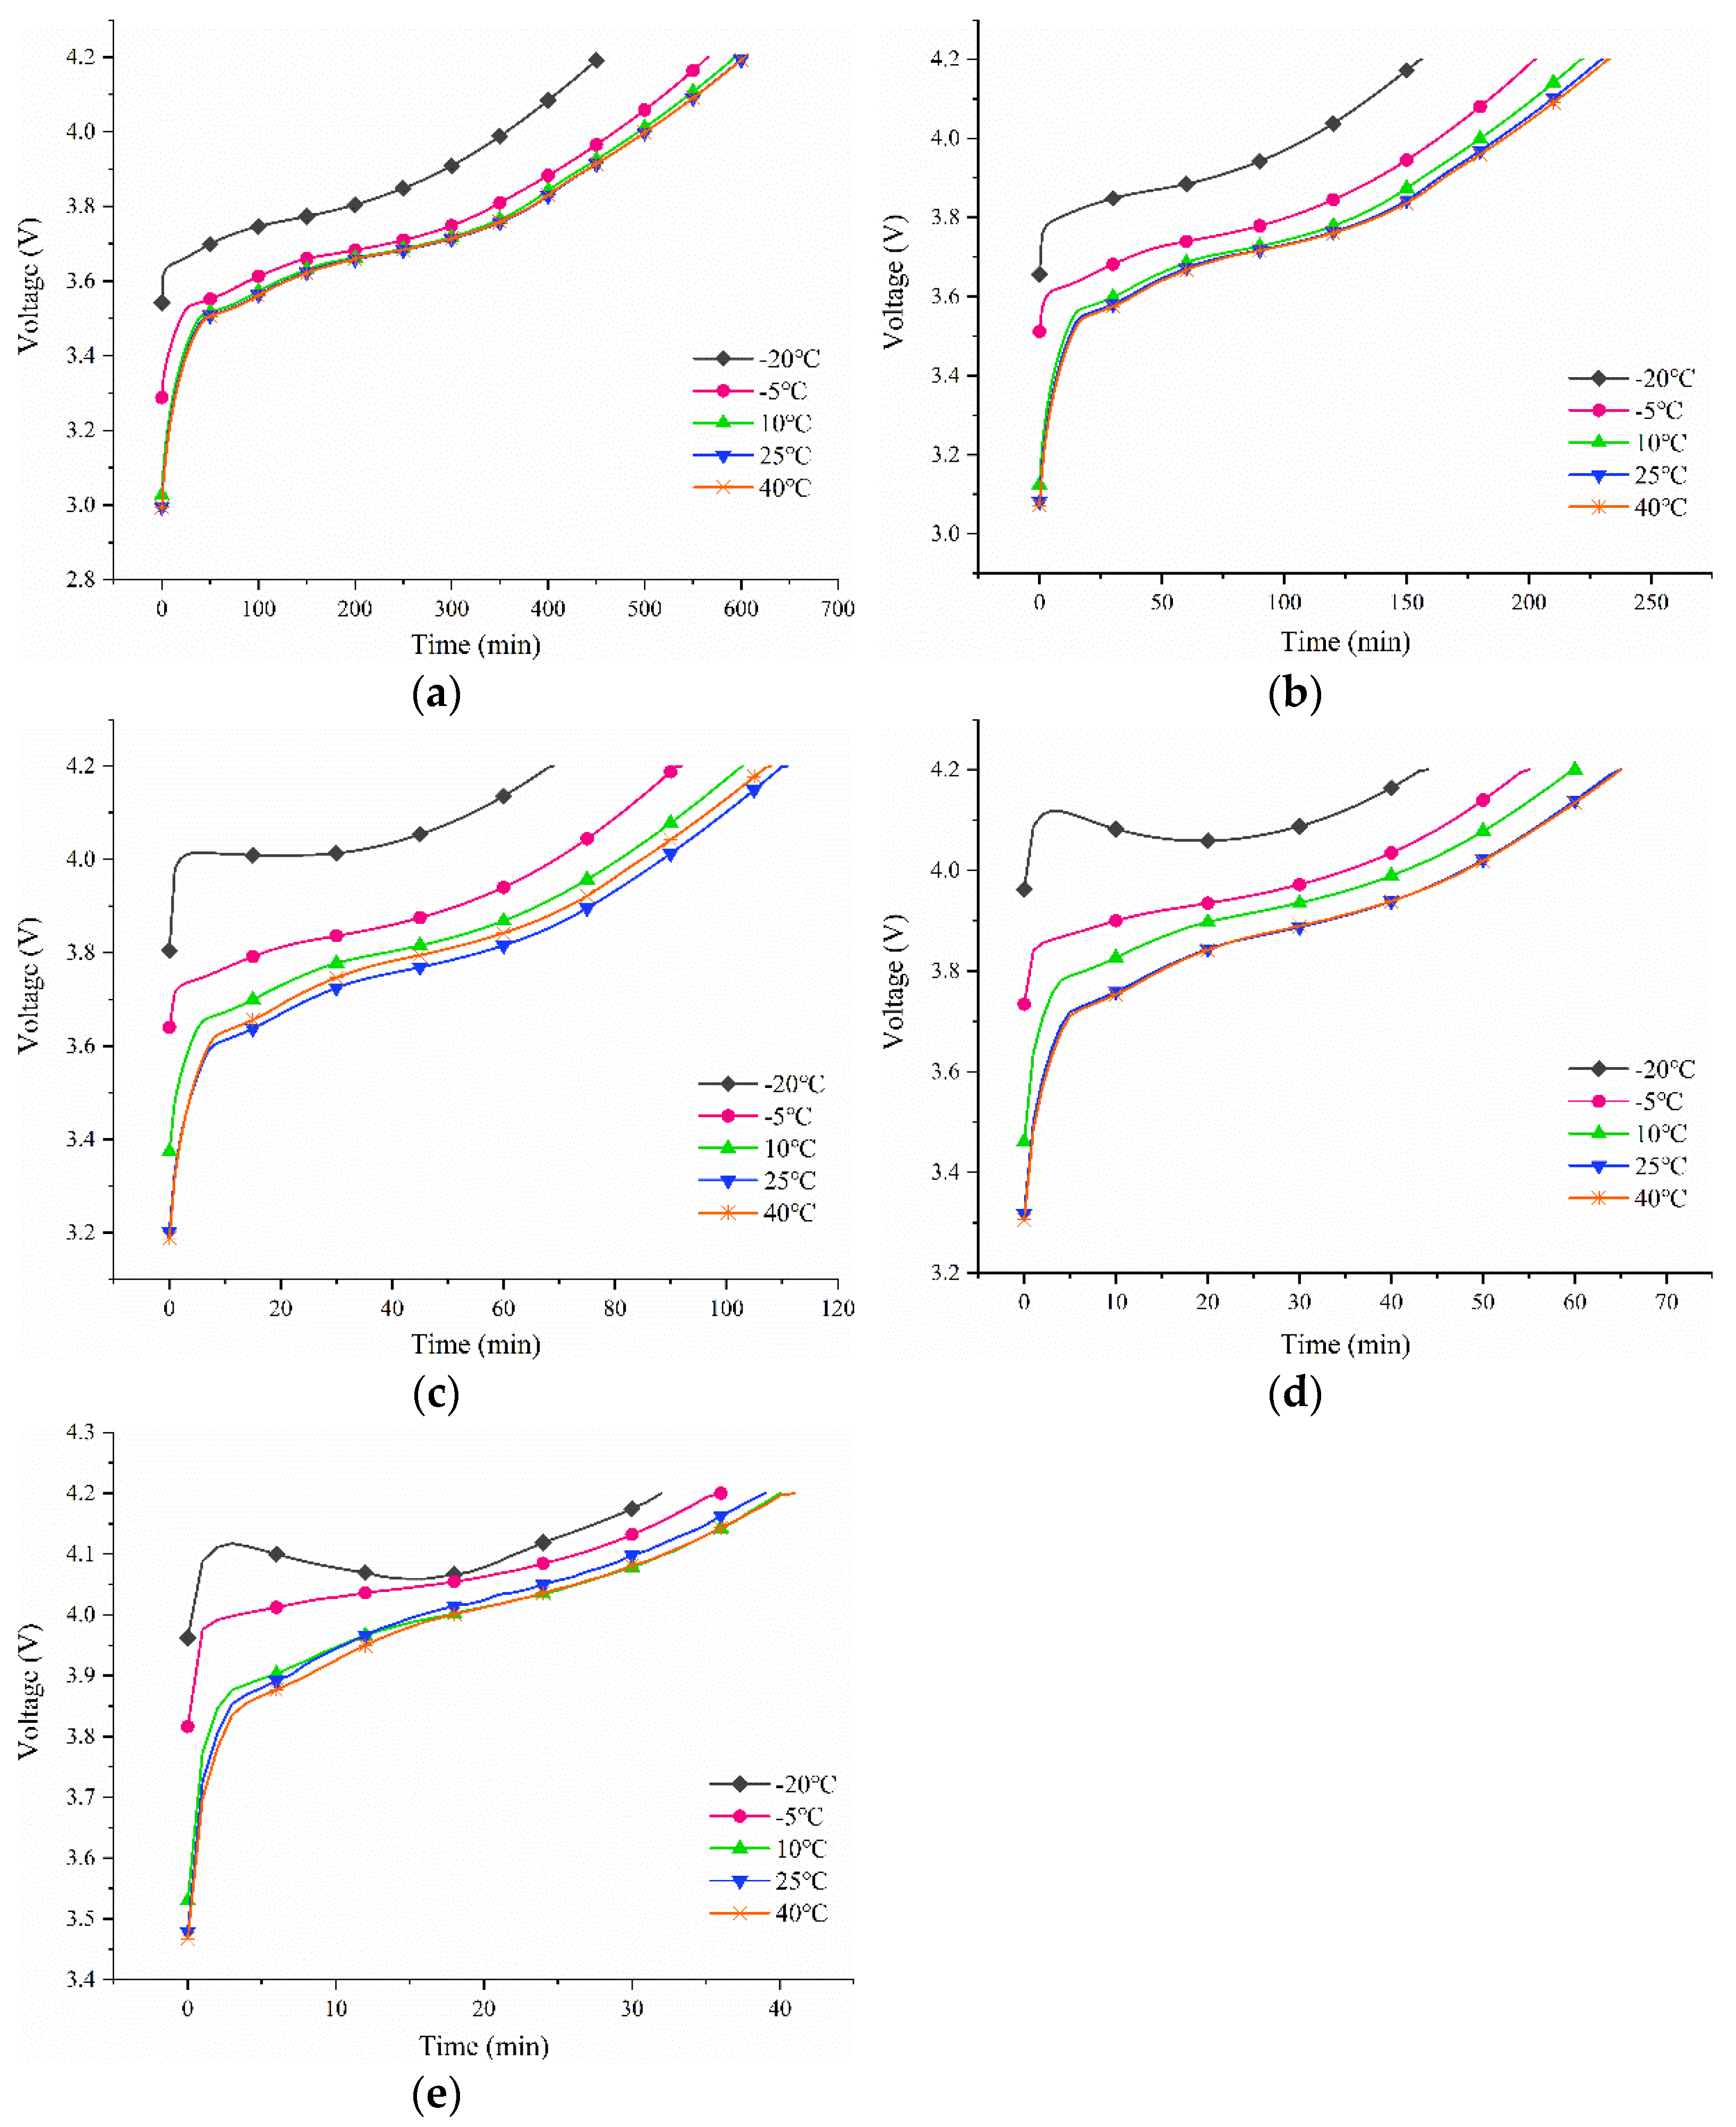
Figure 4 depicts the trend of the battery voltage change over time when charging at the same current rate at various test temperatures of 40 °C, 25 °C, 10 °C, −5 °C, and −20 °C. Except for −20 °C, the change pattern of the Li-ion battery voltage at the other temperatures indicated that the voltage rises rapidly for a period of time before the battery starts charging, and then the battery voltage changes more slowly as the charging time progresses, and the voltage level substantially increases once the charging is finished. When the test temperature is −20 °C, it can be seen that the terminal voltage of the lithium battery has a rebound phenomenon at the early stage of charging, and the greater the current, the greater the rebound amplitude. The 0.50C, 0.75C, and 1.00C charging stages rebounded by 0.0059 V, 0.045 V, and 0.0595 V, respectively.
At the same time, the charging initial terminal voltage exhibits a spike at the 2.75 V plateau because of the presence of activation polarization and ohmic voltage loss. As the test temperature rises and the charging speed slows, the initial terminal voltage decreases. The preliminary voltage increases by 8.89% at 40 °C and 0.10C while it increases by 44.08% at −20 °C and 1.00C; when it reaches the maximum of 3.9622 V, it is already more than 1 V above the minimum.
Additionally, when the ambient temperature fluctuates between 40 °C and 25 °C with the same current, the voltage curve virtually overlaps. When the test temperature drops to −5 °C, the trend moves noticeably, and when it approaches −20 °C, the trend shifts even more. The charging times of 0.10C to 1.00C are almost 600 min, 230 min, 105 min, 65 min, and 40 min, respectively, at test temperature of 10 °C and above; for test temperature of −20 °C, the charging periods are 454 min, 156 min, 69 min, 44 min, and 32 min. The battery’s charging speed is quickened and the charging time decreases when the ambient temperature drops and the charge rate rises.

3.2. Various Test Temperatures’ Effects on the Rise in Temperature

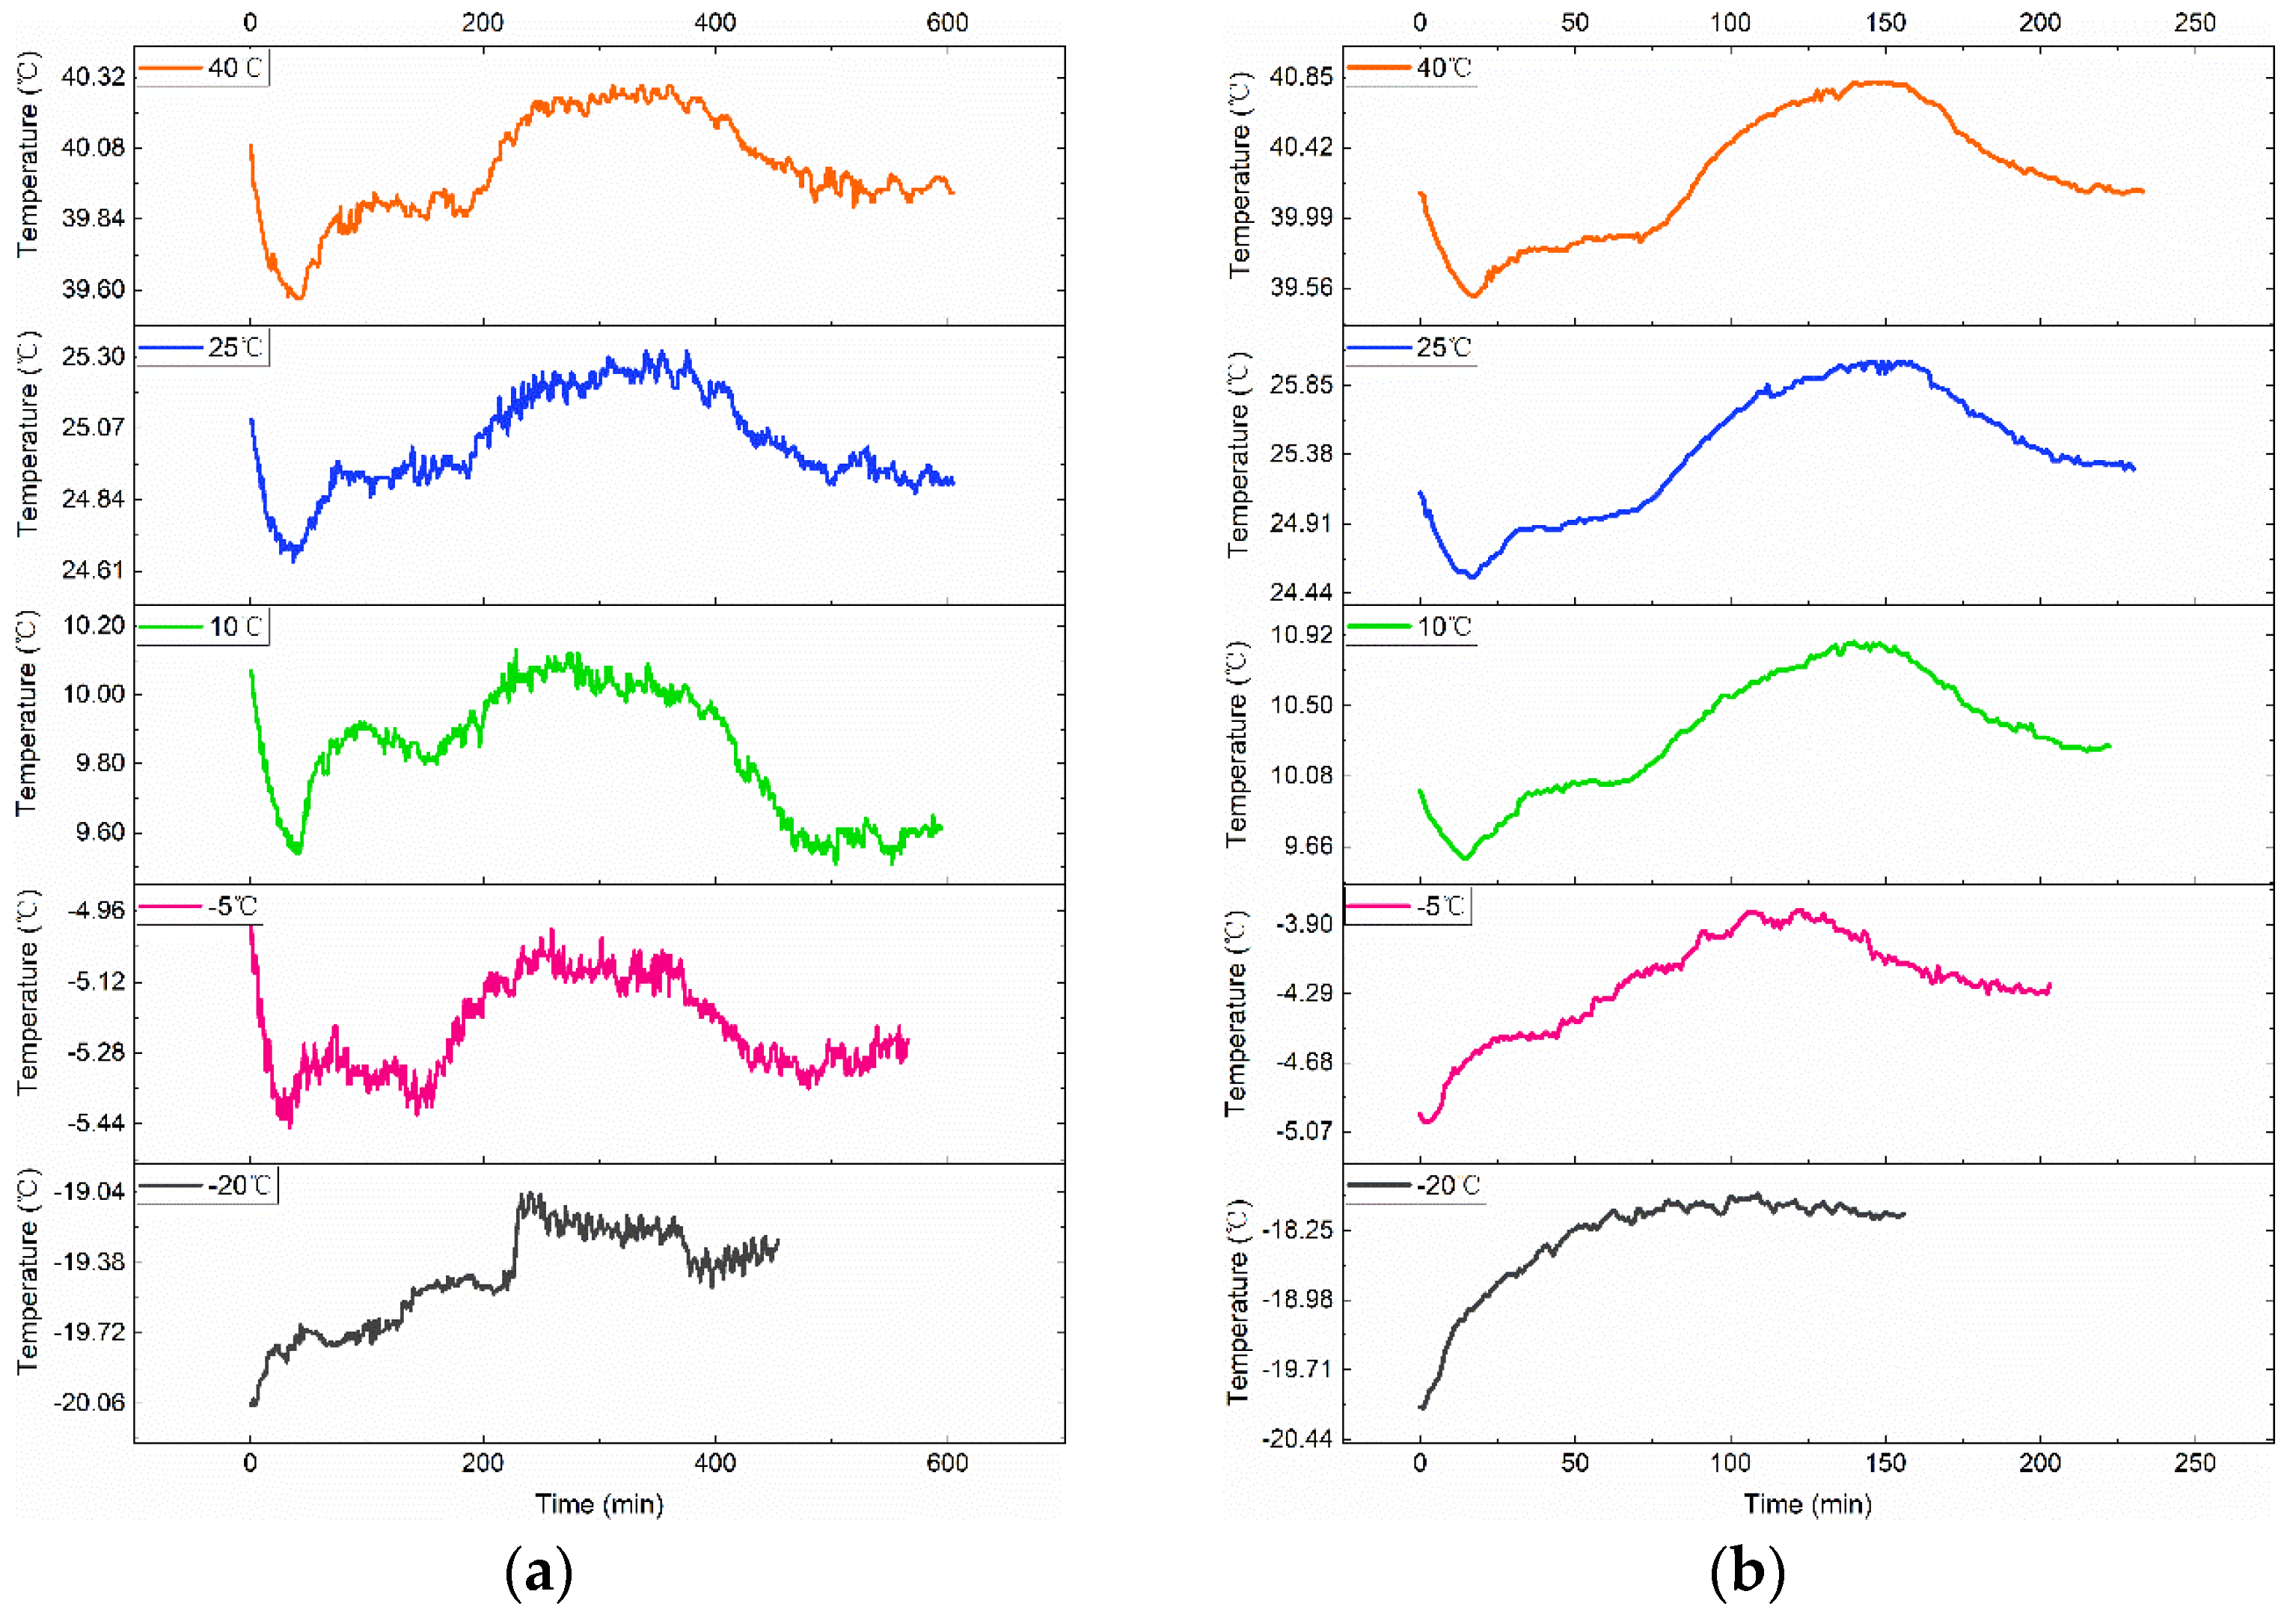
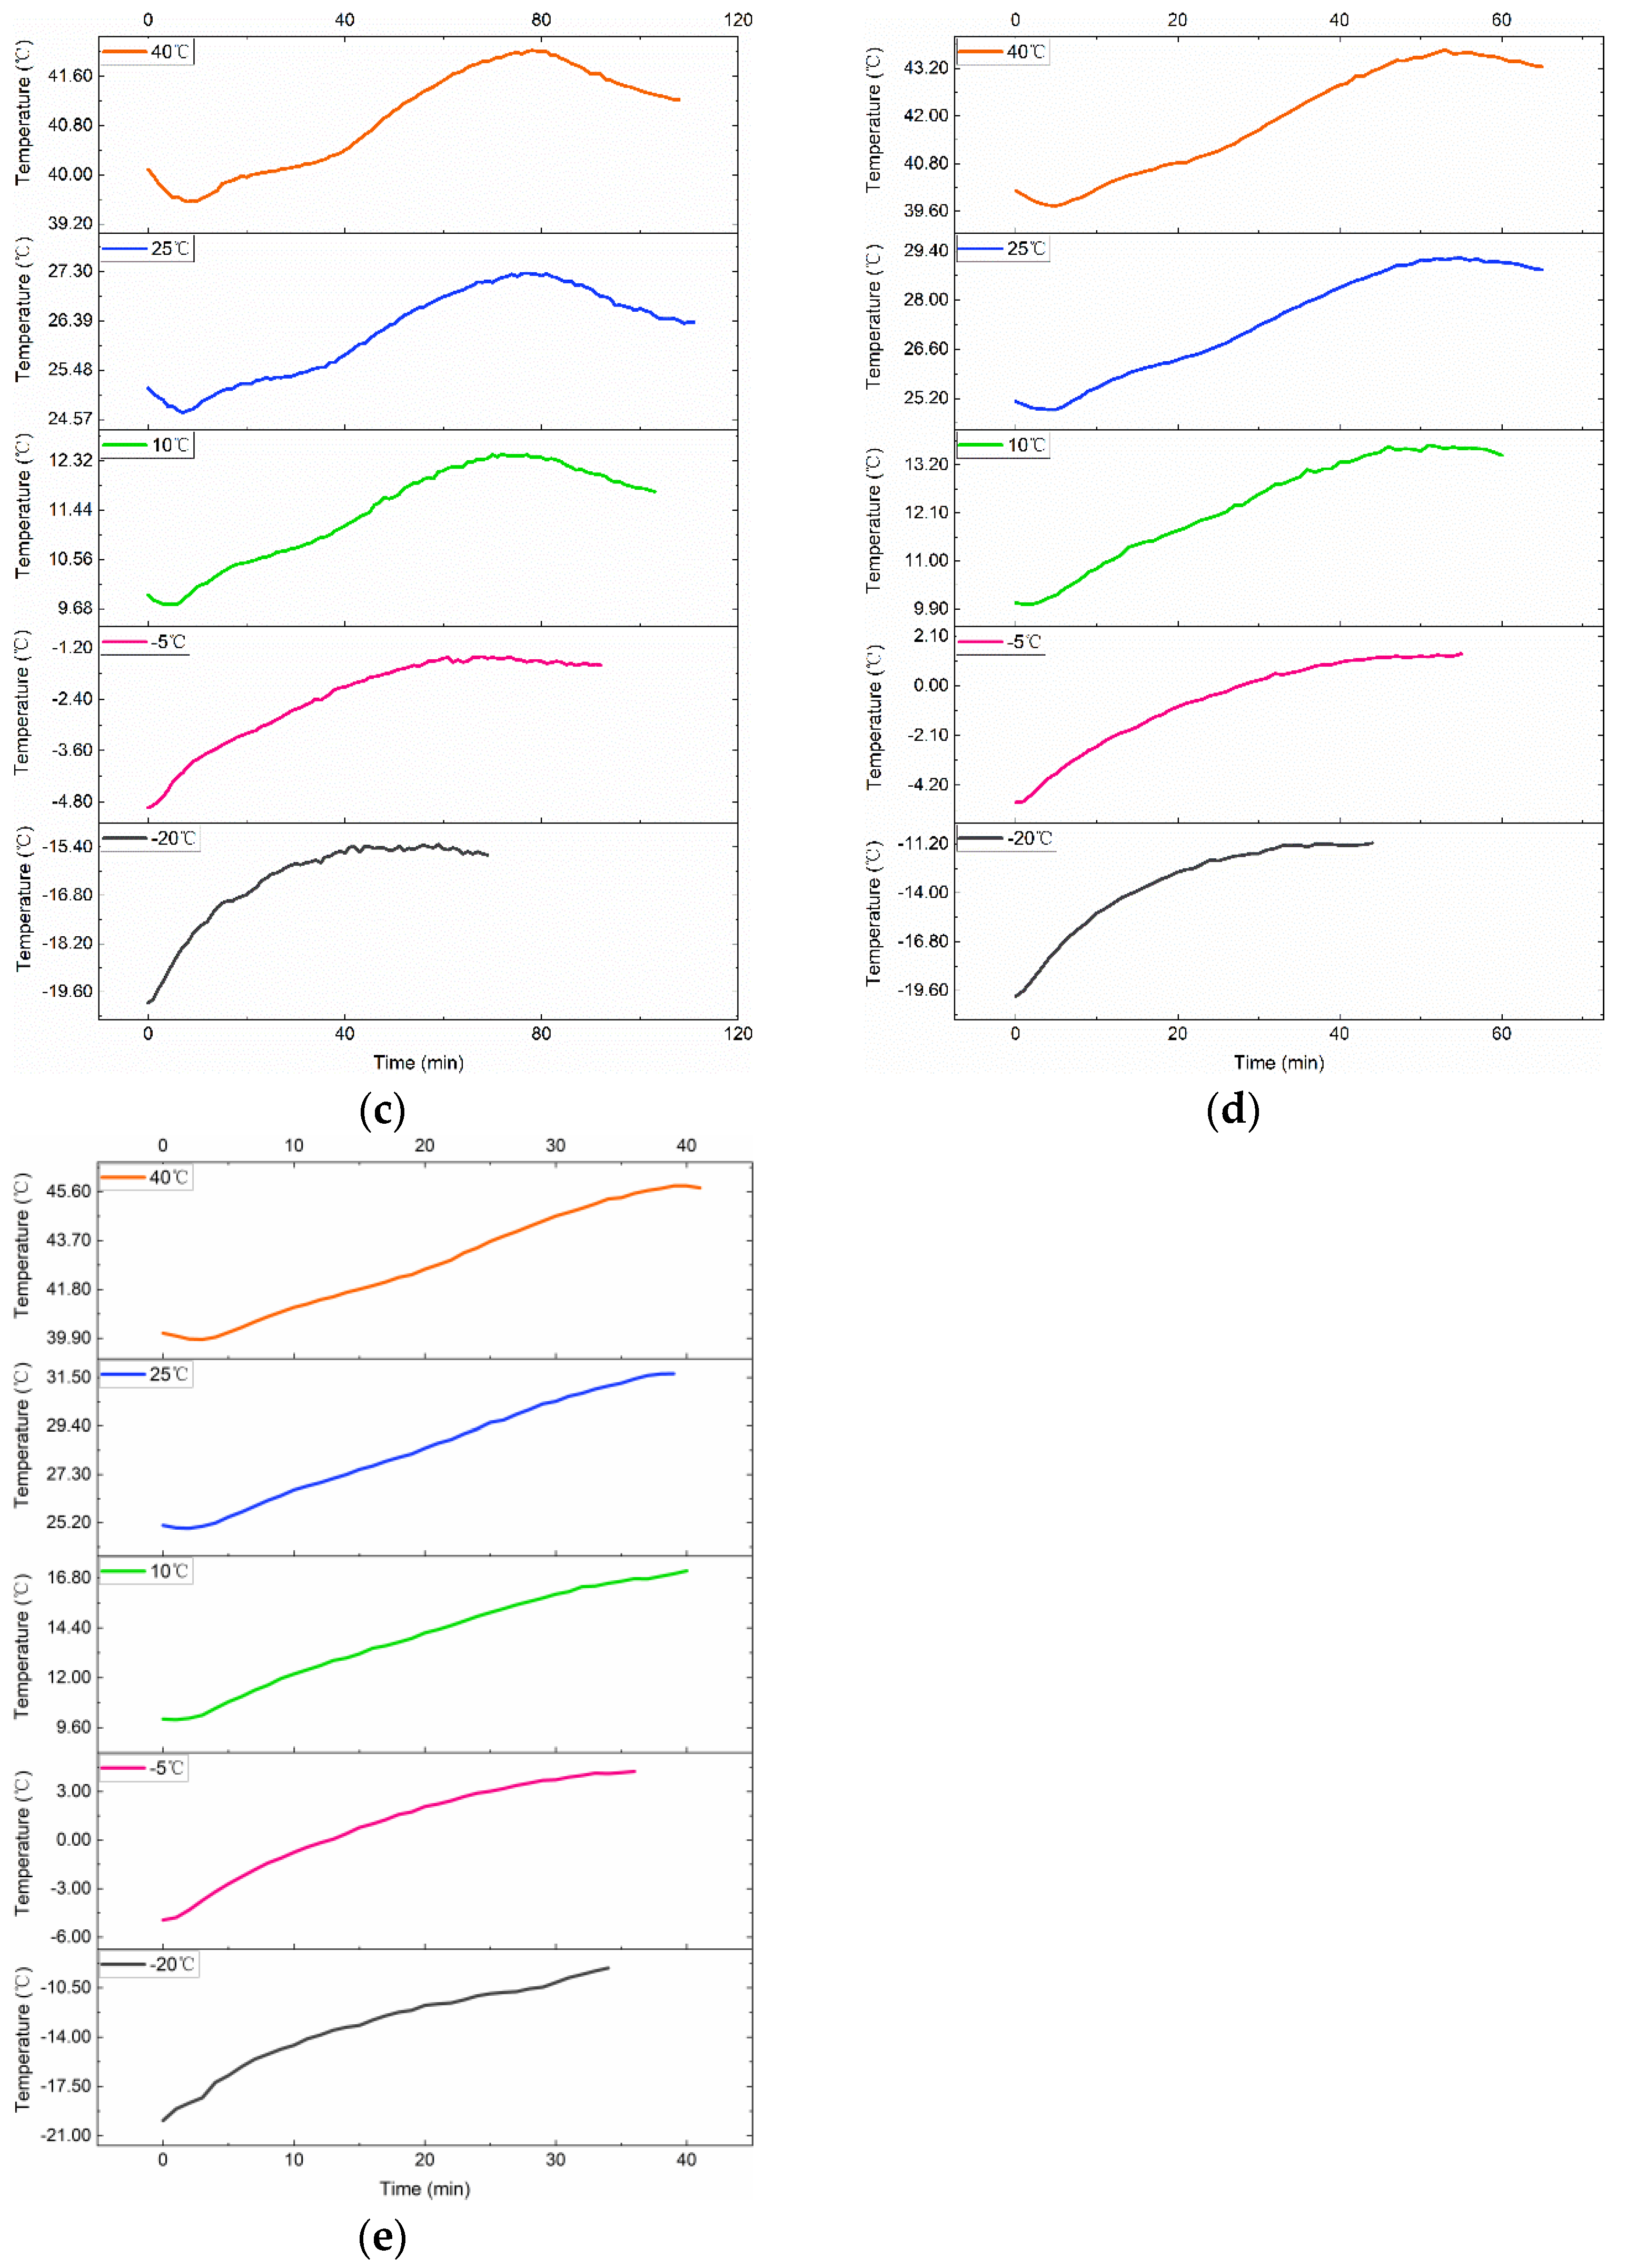
As seen in Figure 5, while charging at the same current rate at various test temperatures of 40 °C, 25 °C, 10 °C, −5 °C, and −20 °C, the trend of the battery surface temperature varies over time. At the beginning and end of charging due to the existence of the polarization phenomenon, the surface temperature of the Li-ion battery has a faster decline; the higher the charging current, the greater the decline. While in the VPP, the temperature will have a certain increase. The general trend of the battery surface temperature change curve appears to drop, then rise, and then decrease. When the test temperature is as low as −5 °C and −20 °C, or when the charging current increases to 0.75C and 1.00C, the decrease in the surface temperature of the battery at the beginning and end of charging is not obvious.

3.3. Effects of Various Test Temperatures and Charge Currents on the Capacity

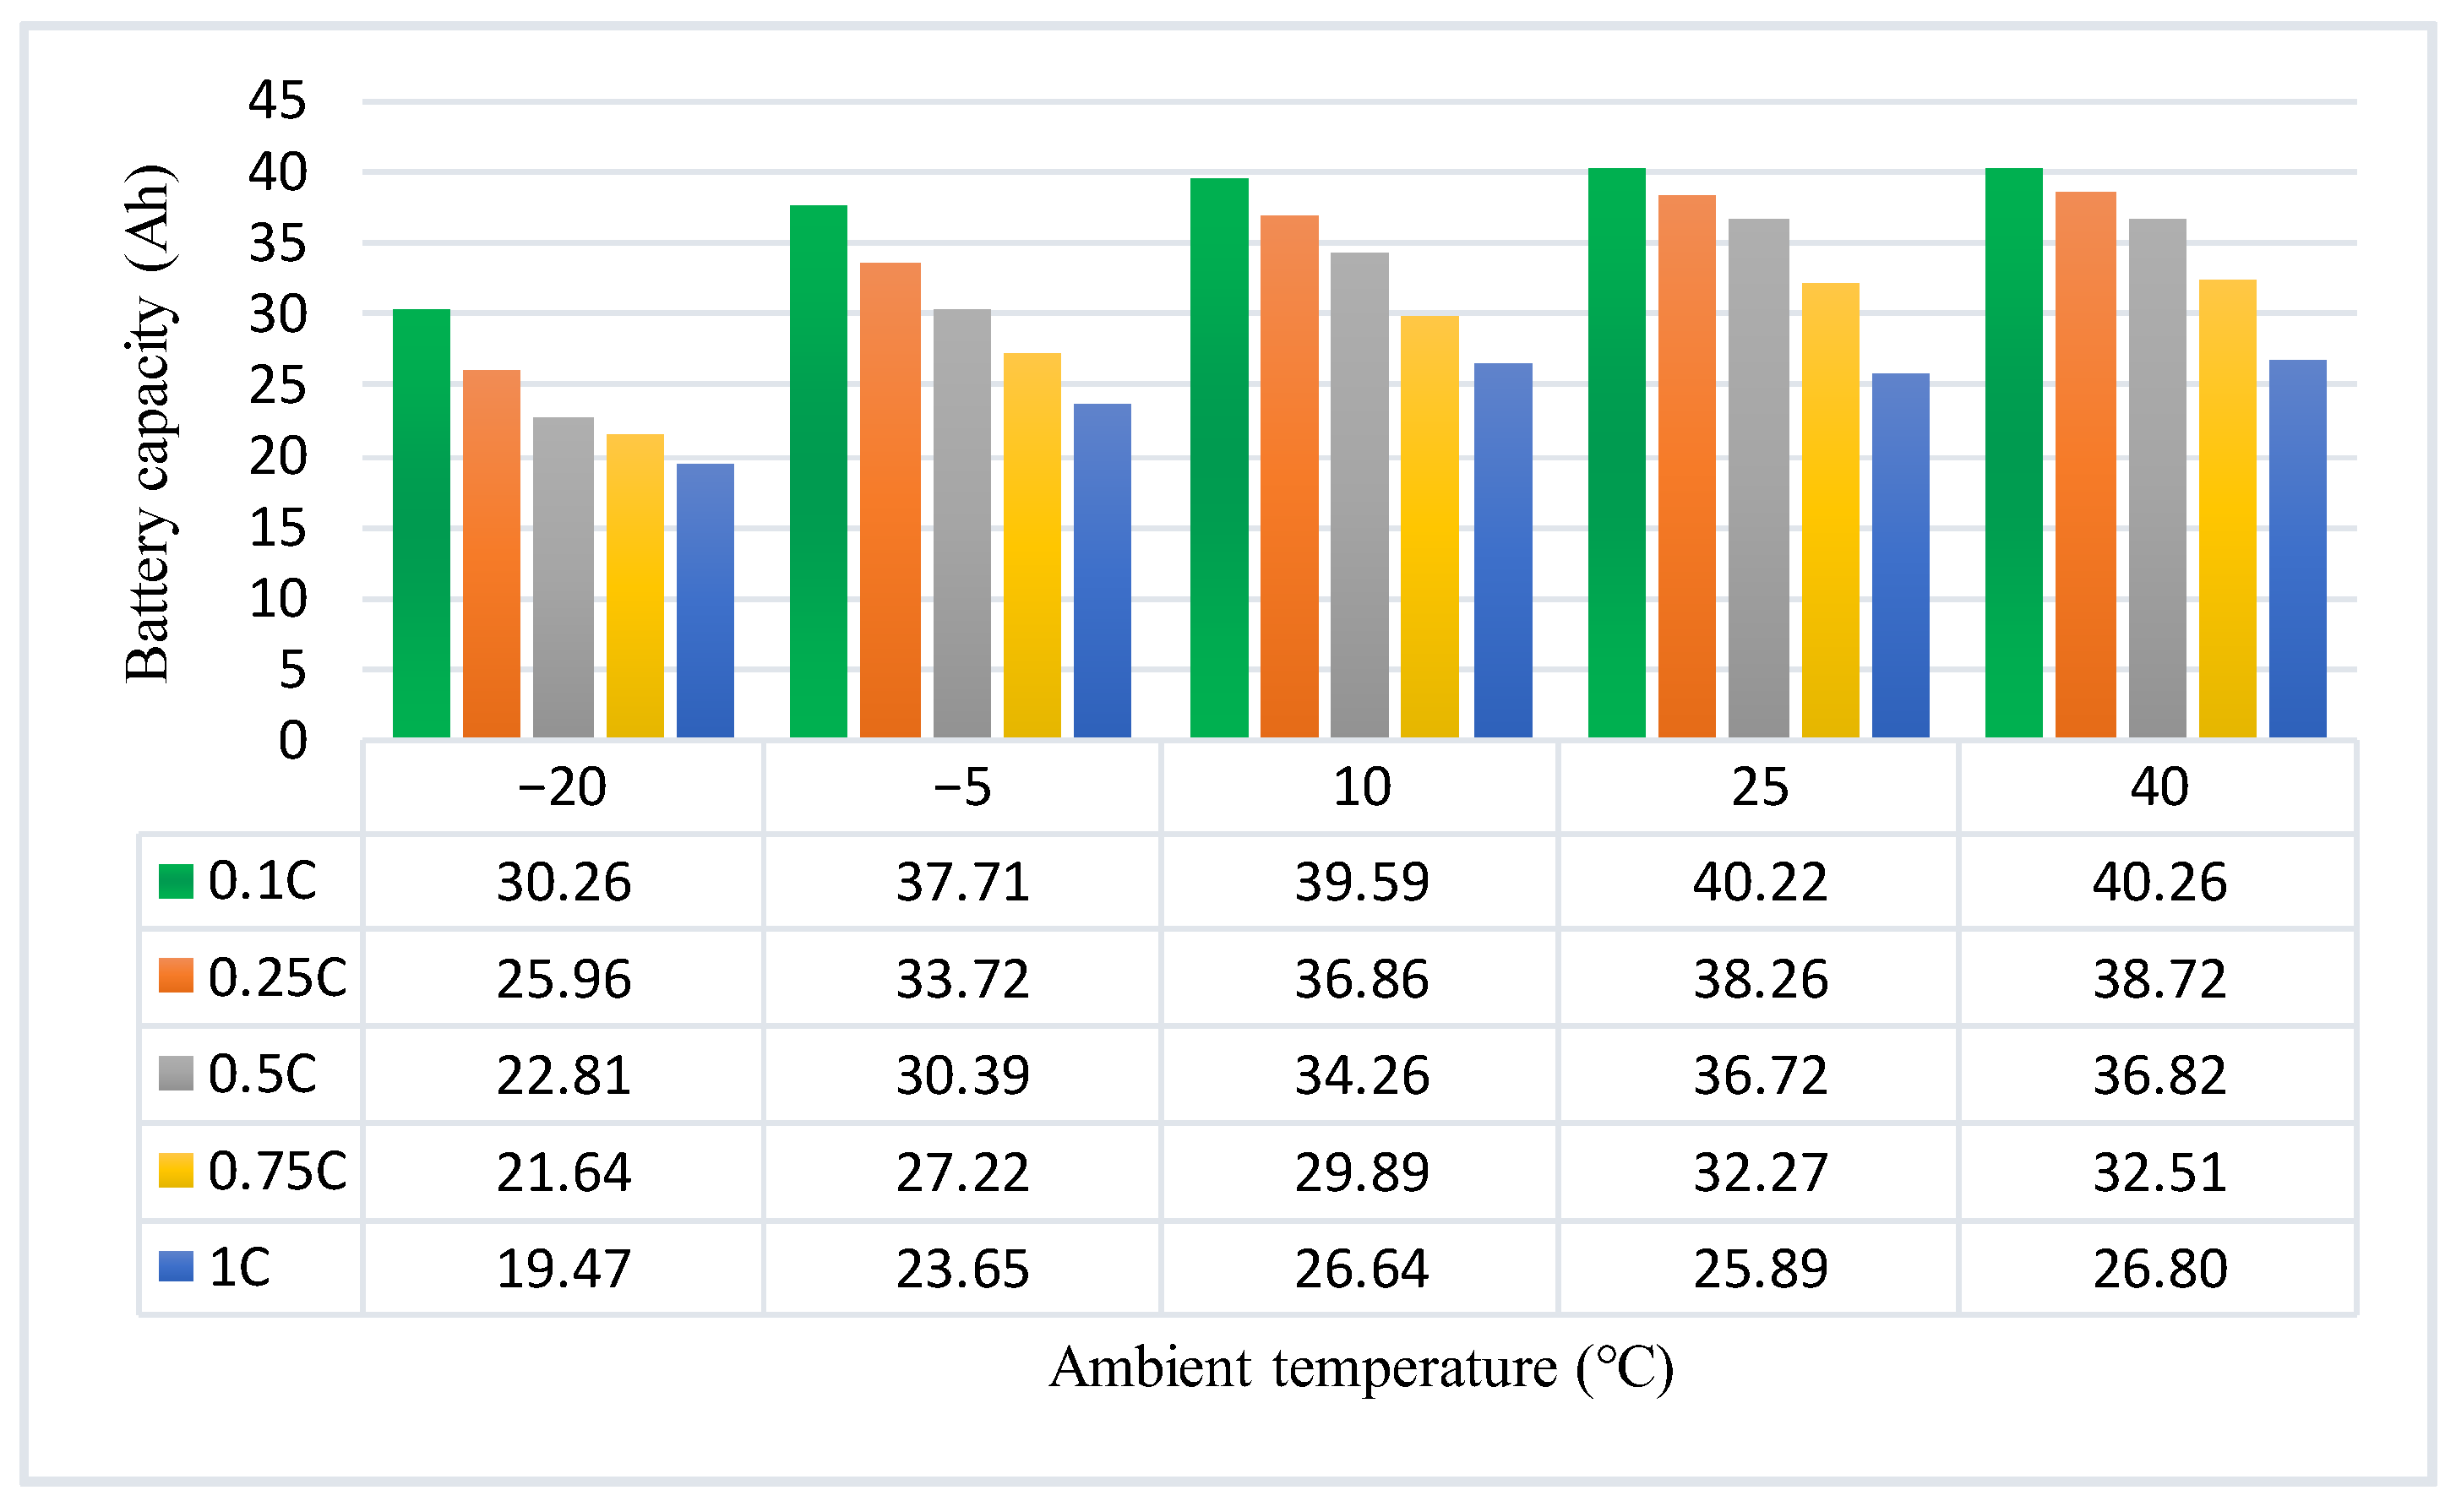
A comparison of the charging capacity under different experimental conditions is shown in Figure 6. It is clear that a greater ambient temperature will result in a slower charging rate and a larger charging capacity. At the identical test temperature and various currents, the maximum capacity differences between the groups are 10.79 Ah, 14.06 Ah, 12.95 Ah, 14.33 Ah, and 13.46 Ah. The greatest variance is approximately 36% of the rated capacity, which shows that the current rate has a greater impact on the charging capacity. As the charging rate increases, the faster the active material reacts, the faster the battery voltage increases, and the energy loss generated increases. Therefore, the actual charging capacity of the Li-ion battery with high current charging is lower than the charging capacity when charging with low current.
The charging capacity at the rate of 0.1C can practically accomplish the rated capacity of 40 Ah at test temperatures of 40 °C, 25 °C, and 10 °C; however, when the test temperature drops to −20 °C, the charging capacity at the rate of 1C is only 19.47 Ah, which is already less than 50% of the nominal capacity. Numerous factors contribute to the large drop in the lithium-ion battery capacity at low temperatures, and the electrolyte’s physical and chemical properties as well as its composition significantly affect the battery’s performance at low temperatures. Low temperature causes a lithium-ion battery’s electrolyte to become more viscous, which lowers the ion conduction rate. This mismatch among the exterior circuit and the internal electron relocation rate causes the battery to become severely polarized. On the other hand, in low temperature environments, the diffusion coefficient of the active material diminishes, the charge transfer impedance increases noticeably, and the battery charging capacity decreases dramatically [33].

4. Discussion

4.1. Brief Introduction of VPP and Its Division Method

The polarization resistance is brought about through the polarization phenomenon of Li-ion batteries, and the ohmic resistance affects the change in the voltage platform when charging. Activation polarization and concentration polarization are two categories of the polarization phenomena. When an external load is connected, the effective battery output voltage can be expressed as [34]:
U = U 0 η c t a + η c a η c t c + η c c i R i  
where U 0 represents the open-circuit potential of the battery, η c t a , η c t c represent the activated polarization overpotential of the anode and cathode, η c a , η c c represent the concentrated polarization overpotential of the anode and cathode, i represents the operating current of the battery when there is a load, and R i represents the internal resistance of the battery.
A change in voltage jump is the physical manifestation of activation polarization, which is caused when the speed of an electrochemical reaction occurring on the electroactive particle surface is somewhat less rapid than the speed of an electron movement. This leads to a shift in the actual potential on the electroactive particle surface by the equilibrium value, which results in activation polarization. The electrode electrochemical reaction’s activation energy is the primary determinant of this polarization phenomenon. As the name suggests, the concentration difference is what leads to the phenomenon known as concentration polarization. Li-ion batteries experience a concentration difference polarization during the charging process because the diffusion coefficient of Li+ within electrostatic particles is considerably lower than that of an electrolyte and much lower than the rate of the electrochemical reaction on its surface. This will make the anode and cathode potentials’ departure from the equilibrium value even worse, which will cause the terminal voltage to move more quickly when charging initially begins. Equation (2) defines the concentration polarization overpotential η c according to the Nernst equation [34], and as the diffusion process continues, η c decreases significantly because of the change in the CB/CE concentration ratio, leading to a flattening of the change of the voltage plateau, which is closer to the ideal voltage curve. The energy loss due to polarization is also lower in this phase.
η c = R T n F ln C B C E  
where R represents the gas constant, T represents the thermodynamic temperature, n represents the number of electrons in the stoichiometric reaction equation, F represents the Faraday constant, C B represents the body concentration of electroactive particles, and C E represents the electrode surface concentration.
From the experimental results, there is a relatively flat changing process between the start and final phase of the voltage waveform. In contrast to LiFePO4, the ternary lithium battery’s reaction plateau is smaller, and the overall trajectory is not quite as smooth as that of the LiFePO4 battery. This occurs because lithium takes a long time to embed in lithium iron phosphate batteries, converting FePO4 to LiFePO4, and Ni, Co, and Mn elements present in ternary Li-ion batteries tend to form several reaction plateaus with separate potentials [35]. As a consequence, the response tendency of the voltage plateau steadily increases.
When a voltage plateau appears, a curve turning point is present. The concavity and convexity of the bight are used to assess the complete charging bight. The spinodal into the plateau response period is shown as a convex curve, i.e., the spinodal where the second-order conductance is less than 0 and the third-order conductance is extremely large, and the spinodal into the next reaction stage at the end of the plateau is shown as a concave curve, i.e., the spinodal where the second-order conductance is greater than 0 and the third-order conductance is extremely large. Accordingly, the location of the spinodal is established and the charging curve is then separated into three stages as a result: the initial period, the VPP, and the end period. The VPP is fitted in segments to produce the fitting diagram and the fitting equation for further analysis [36].

4.2. Effect of Various Test Temperatures on the VPP

4.2.1. 0.10C Charge

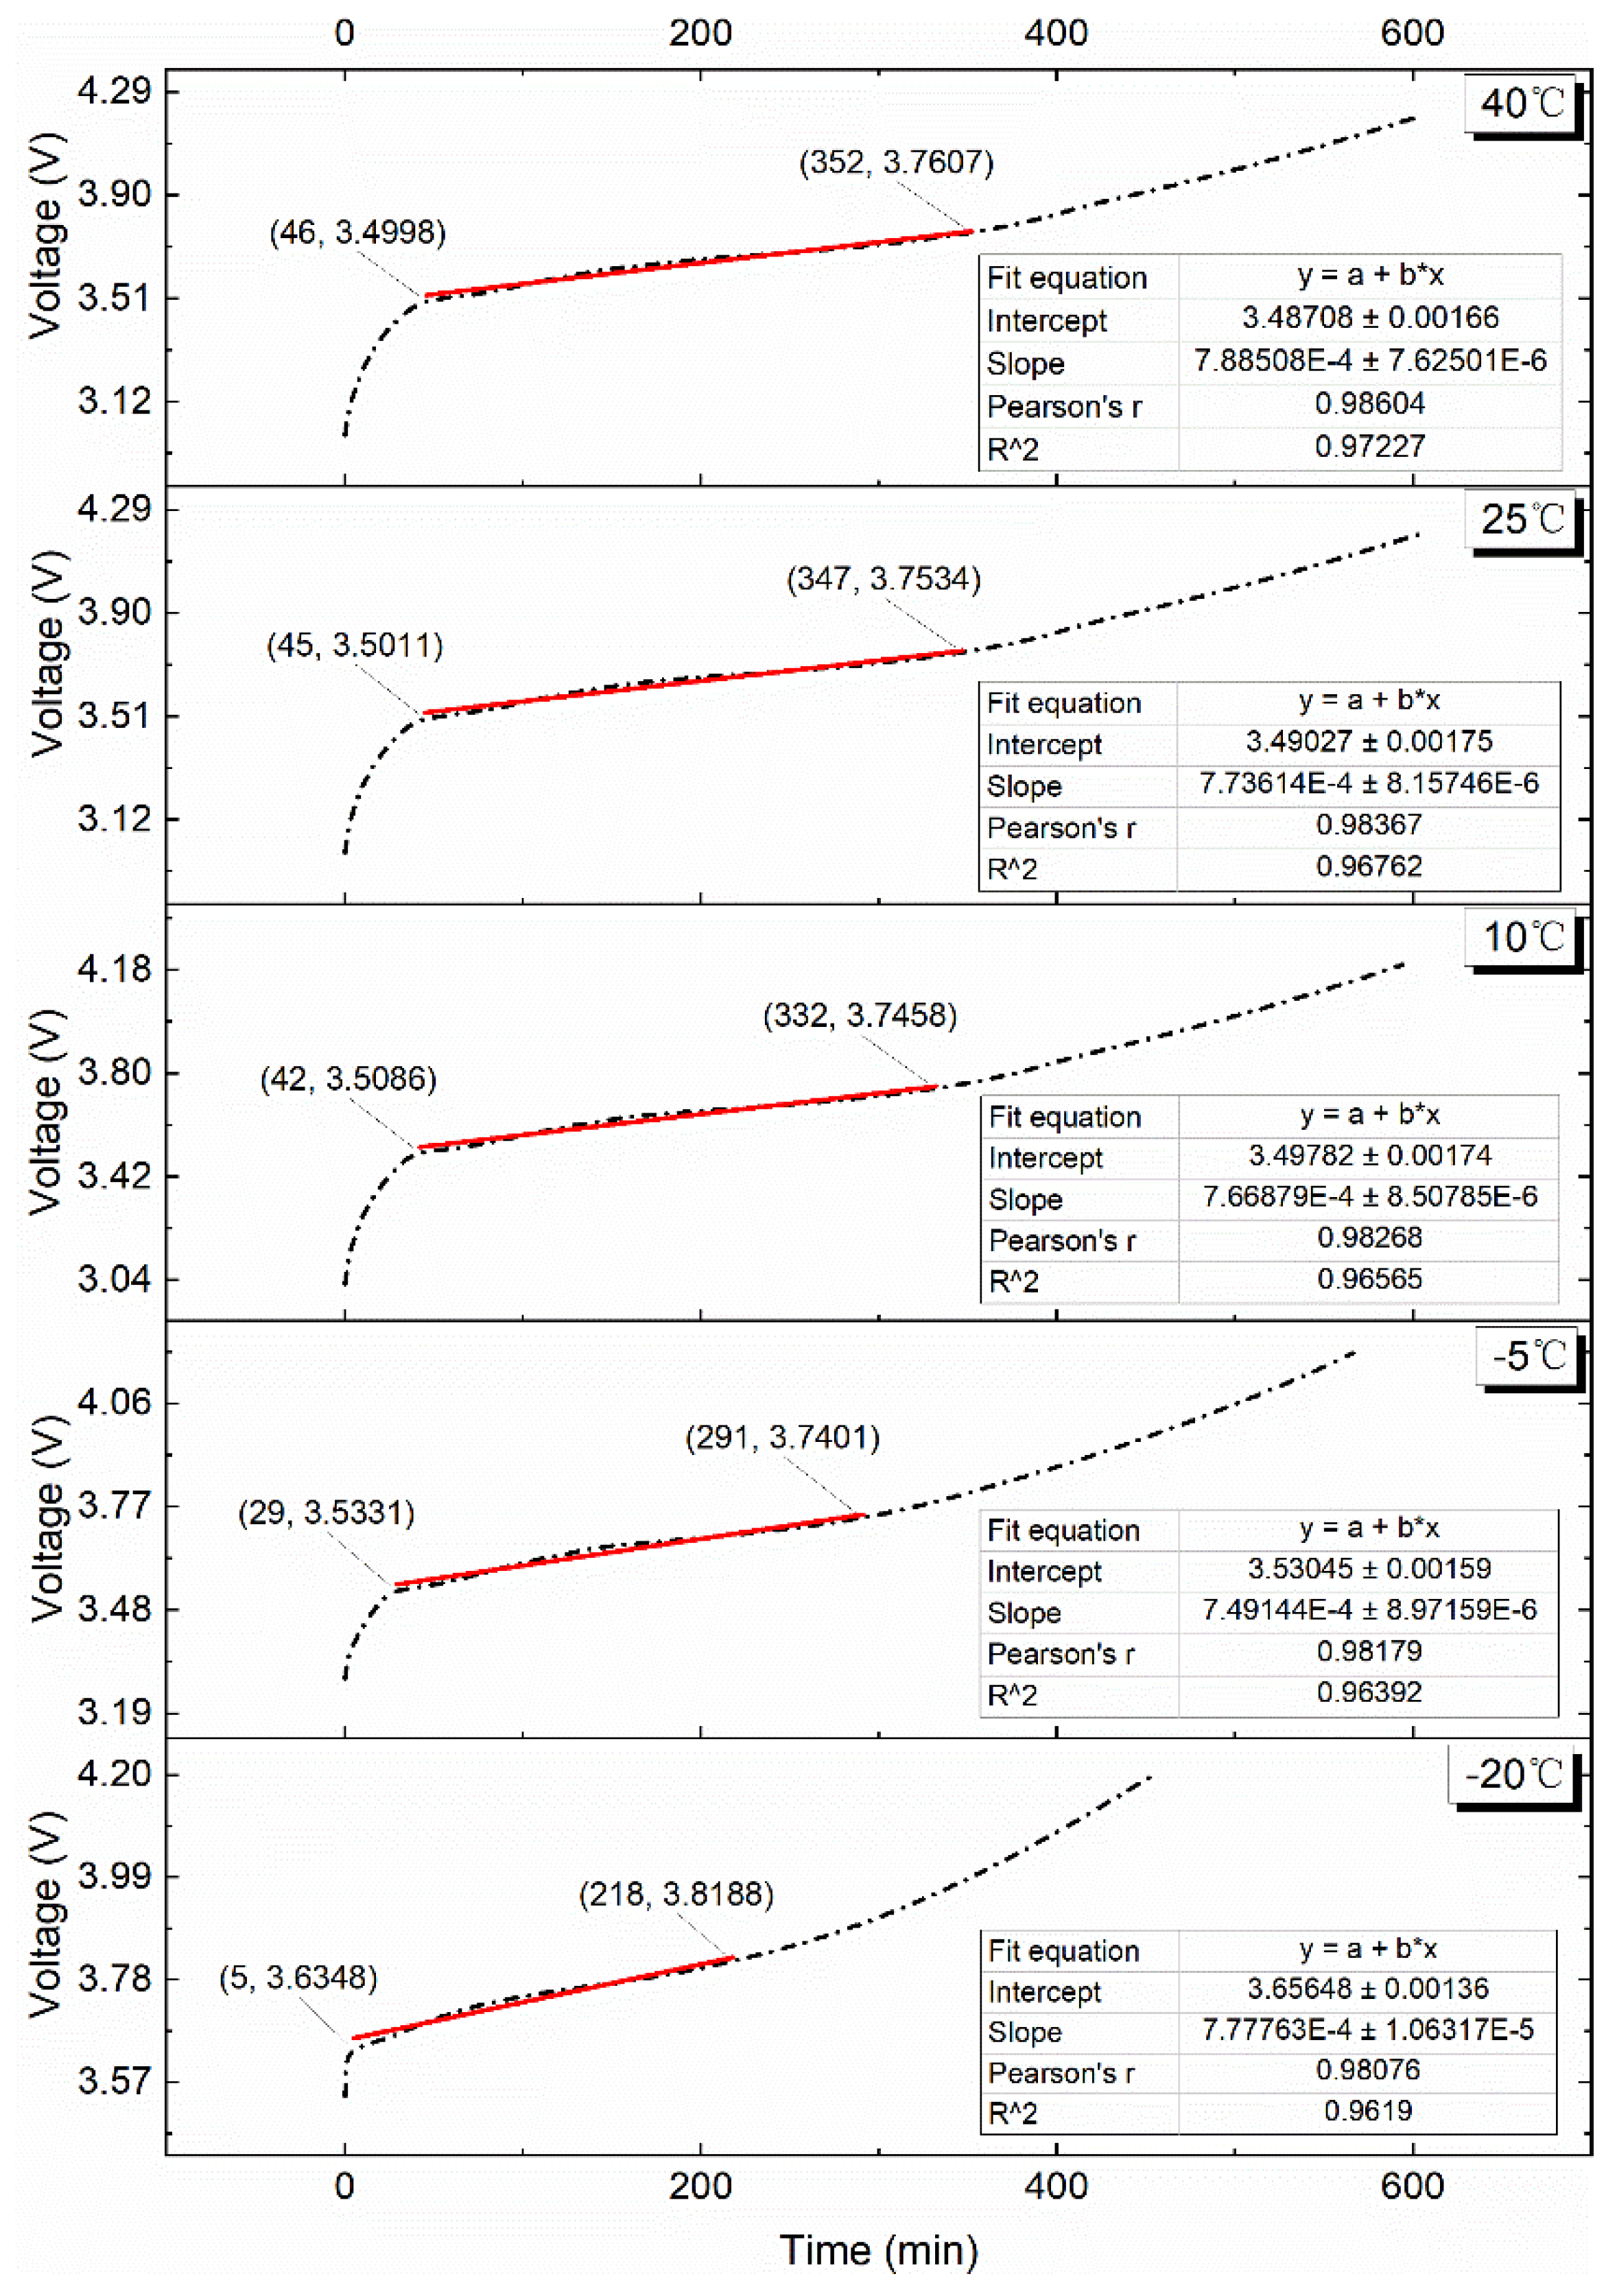
The fitted curve and fitted equation for the VPP at the 0.10C charge rate are depicted in Figure 7. It is clear that a linear regression equation can be used to fit the voltage plateau duration for each temperature environment, and the coefficient of determination, R2, is higher than 0.96. The slope of the equation is 7.7 × 10⁻⁴, and the x   values are 306, 302, 290, 262, and 213 at the respective test temperatures of 40 °C, 25 °C, 10 °C, −5 °C, and −20 °C. The time of the VPP decreases sequentially, and the low temperature effect in the charging phase is more obvious than that in the discharging phase [37].
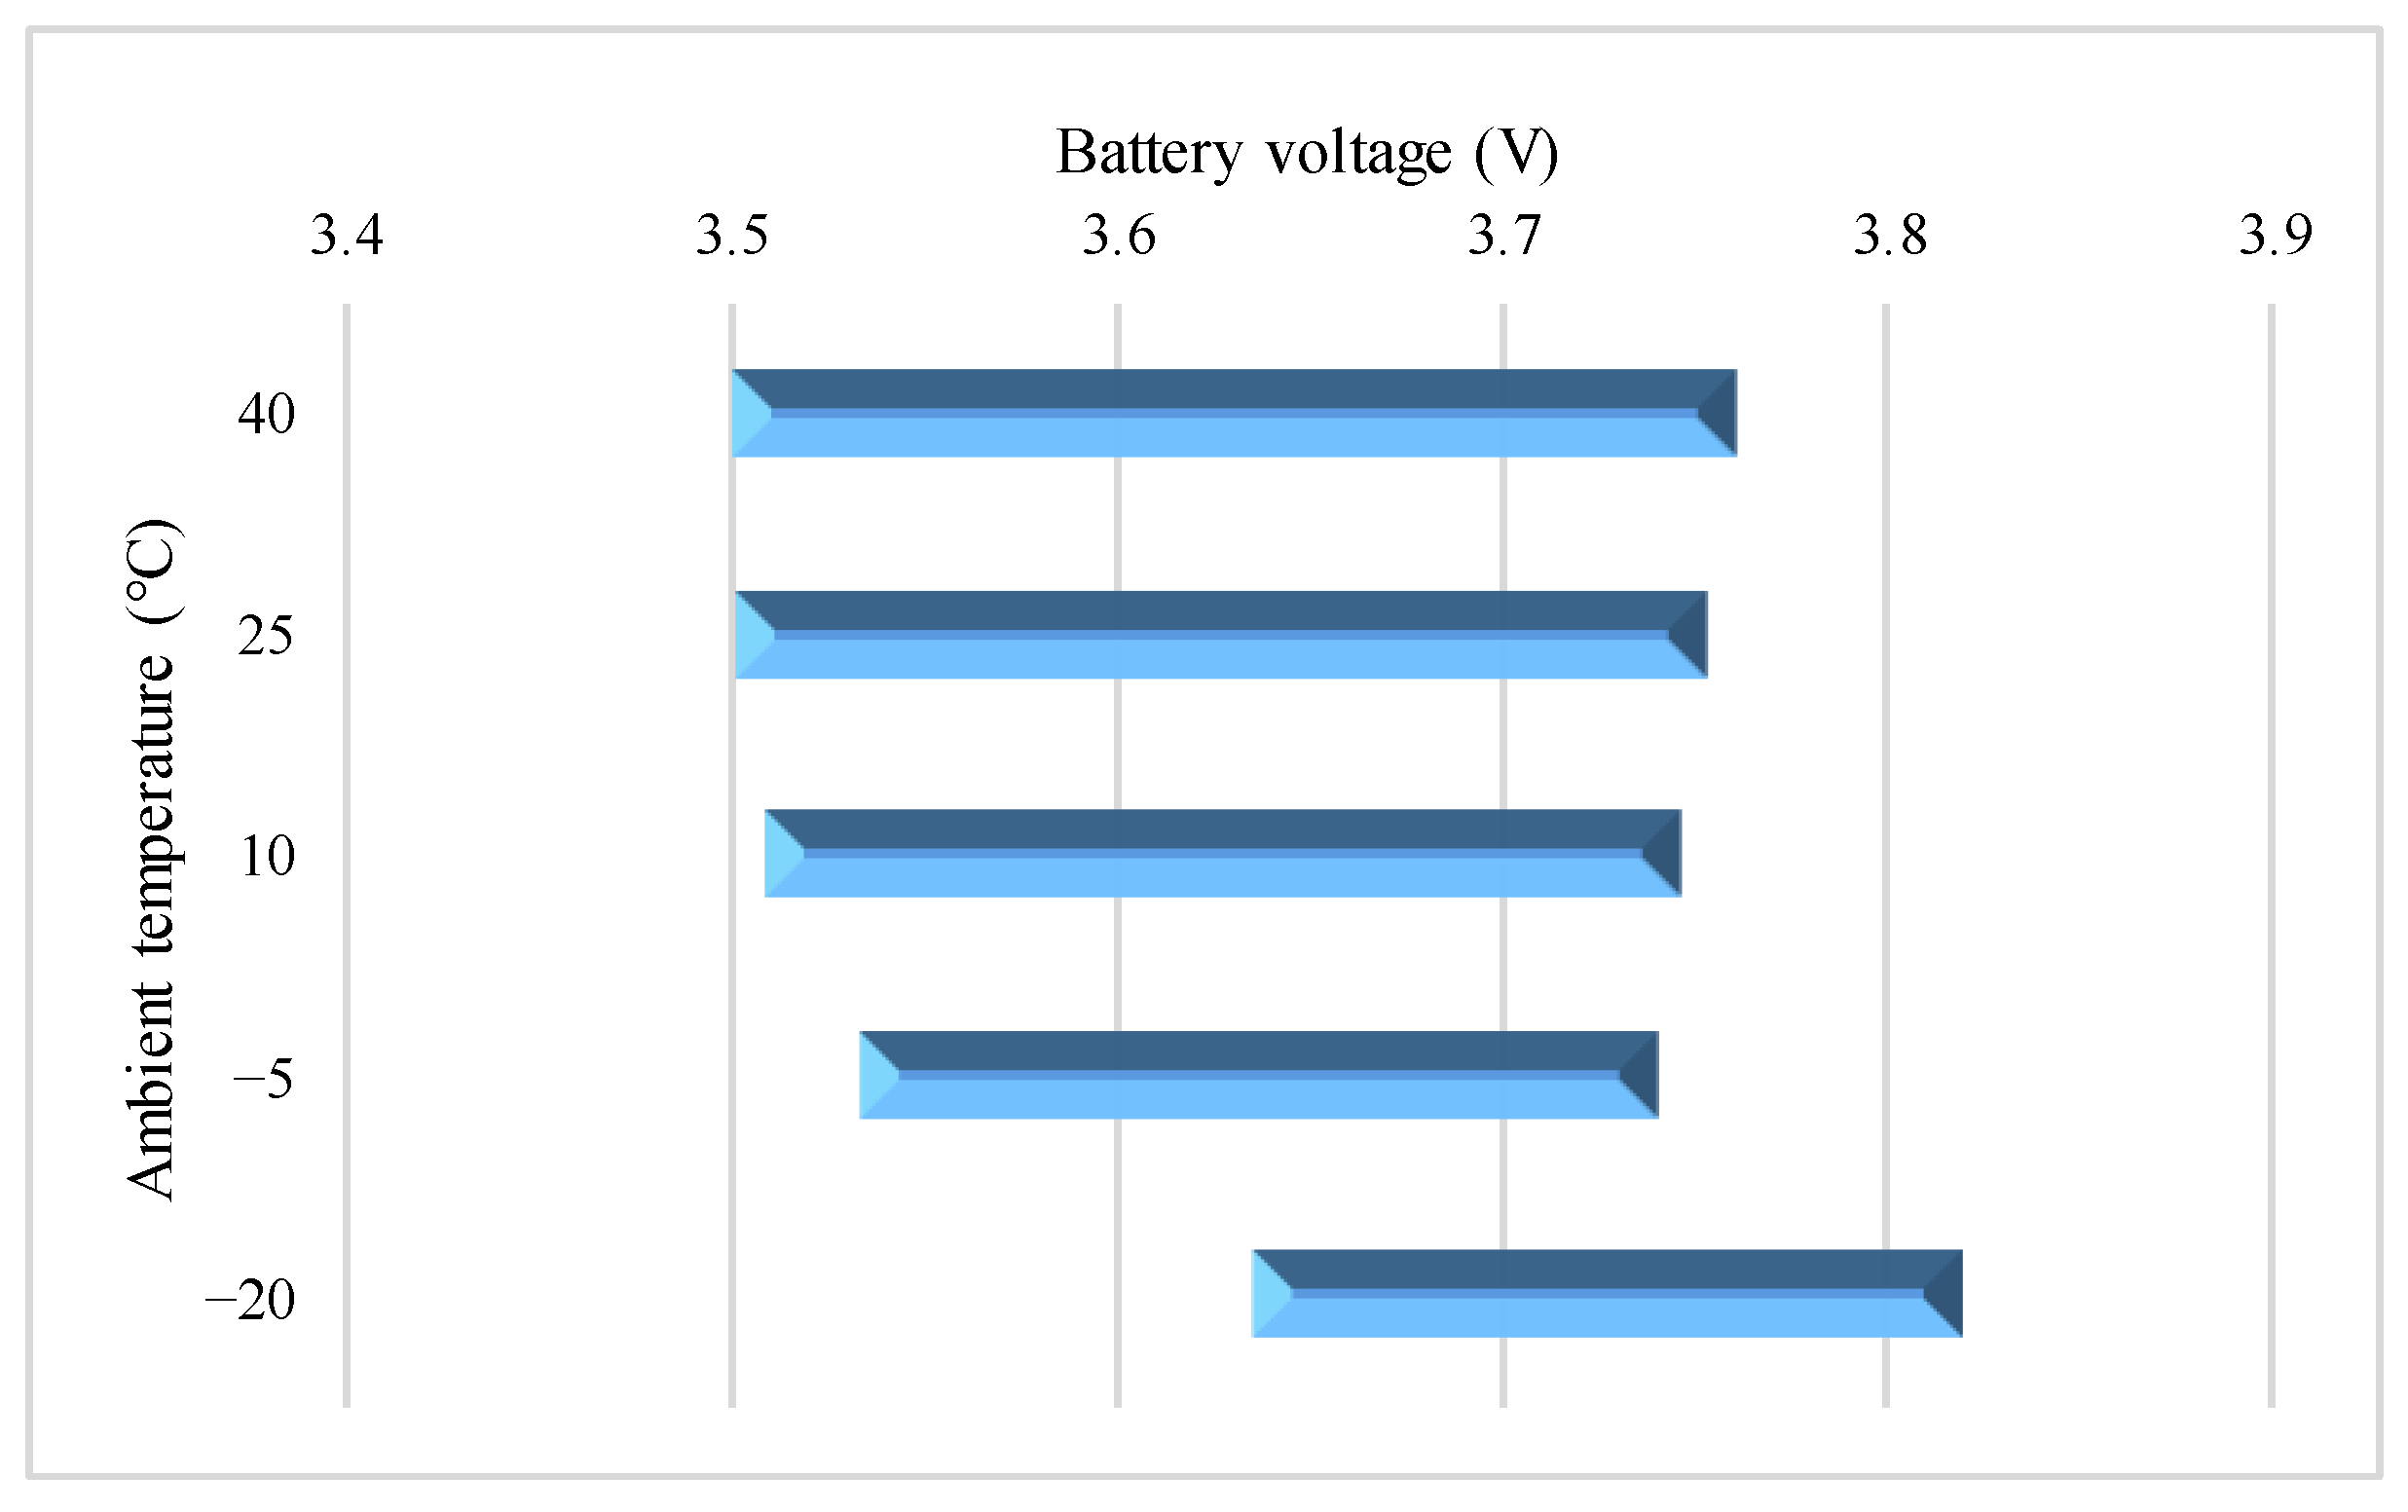
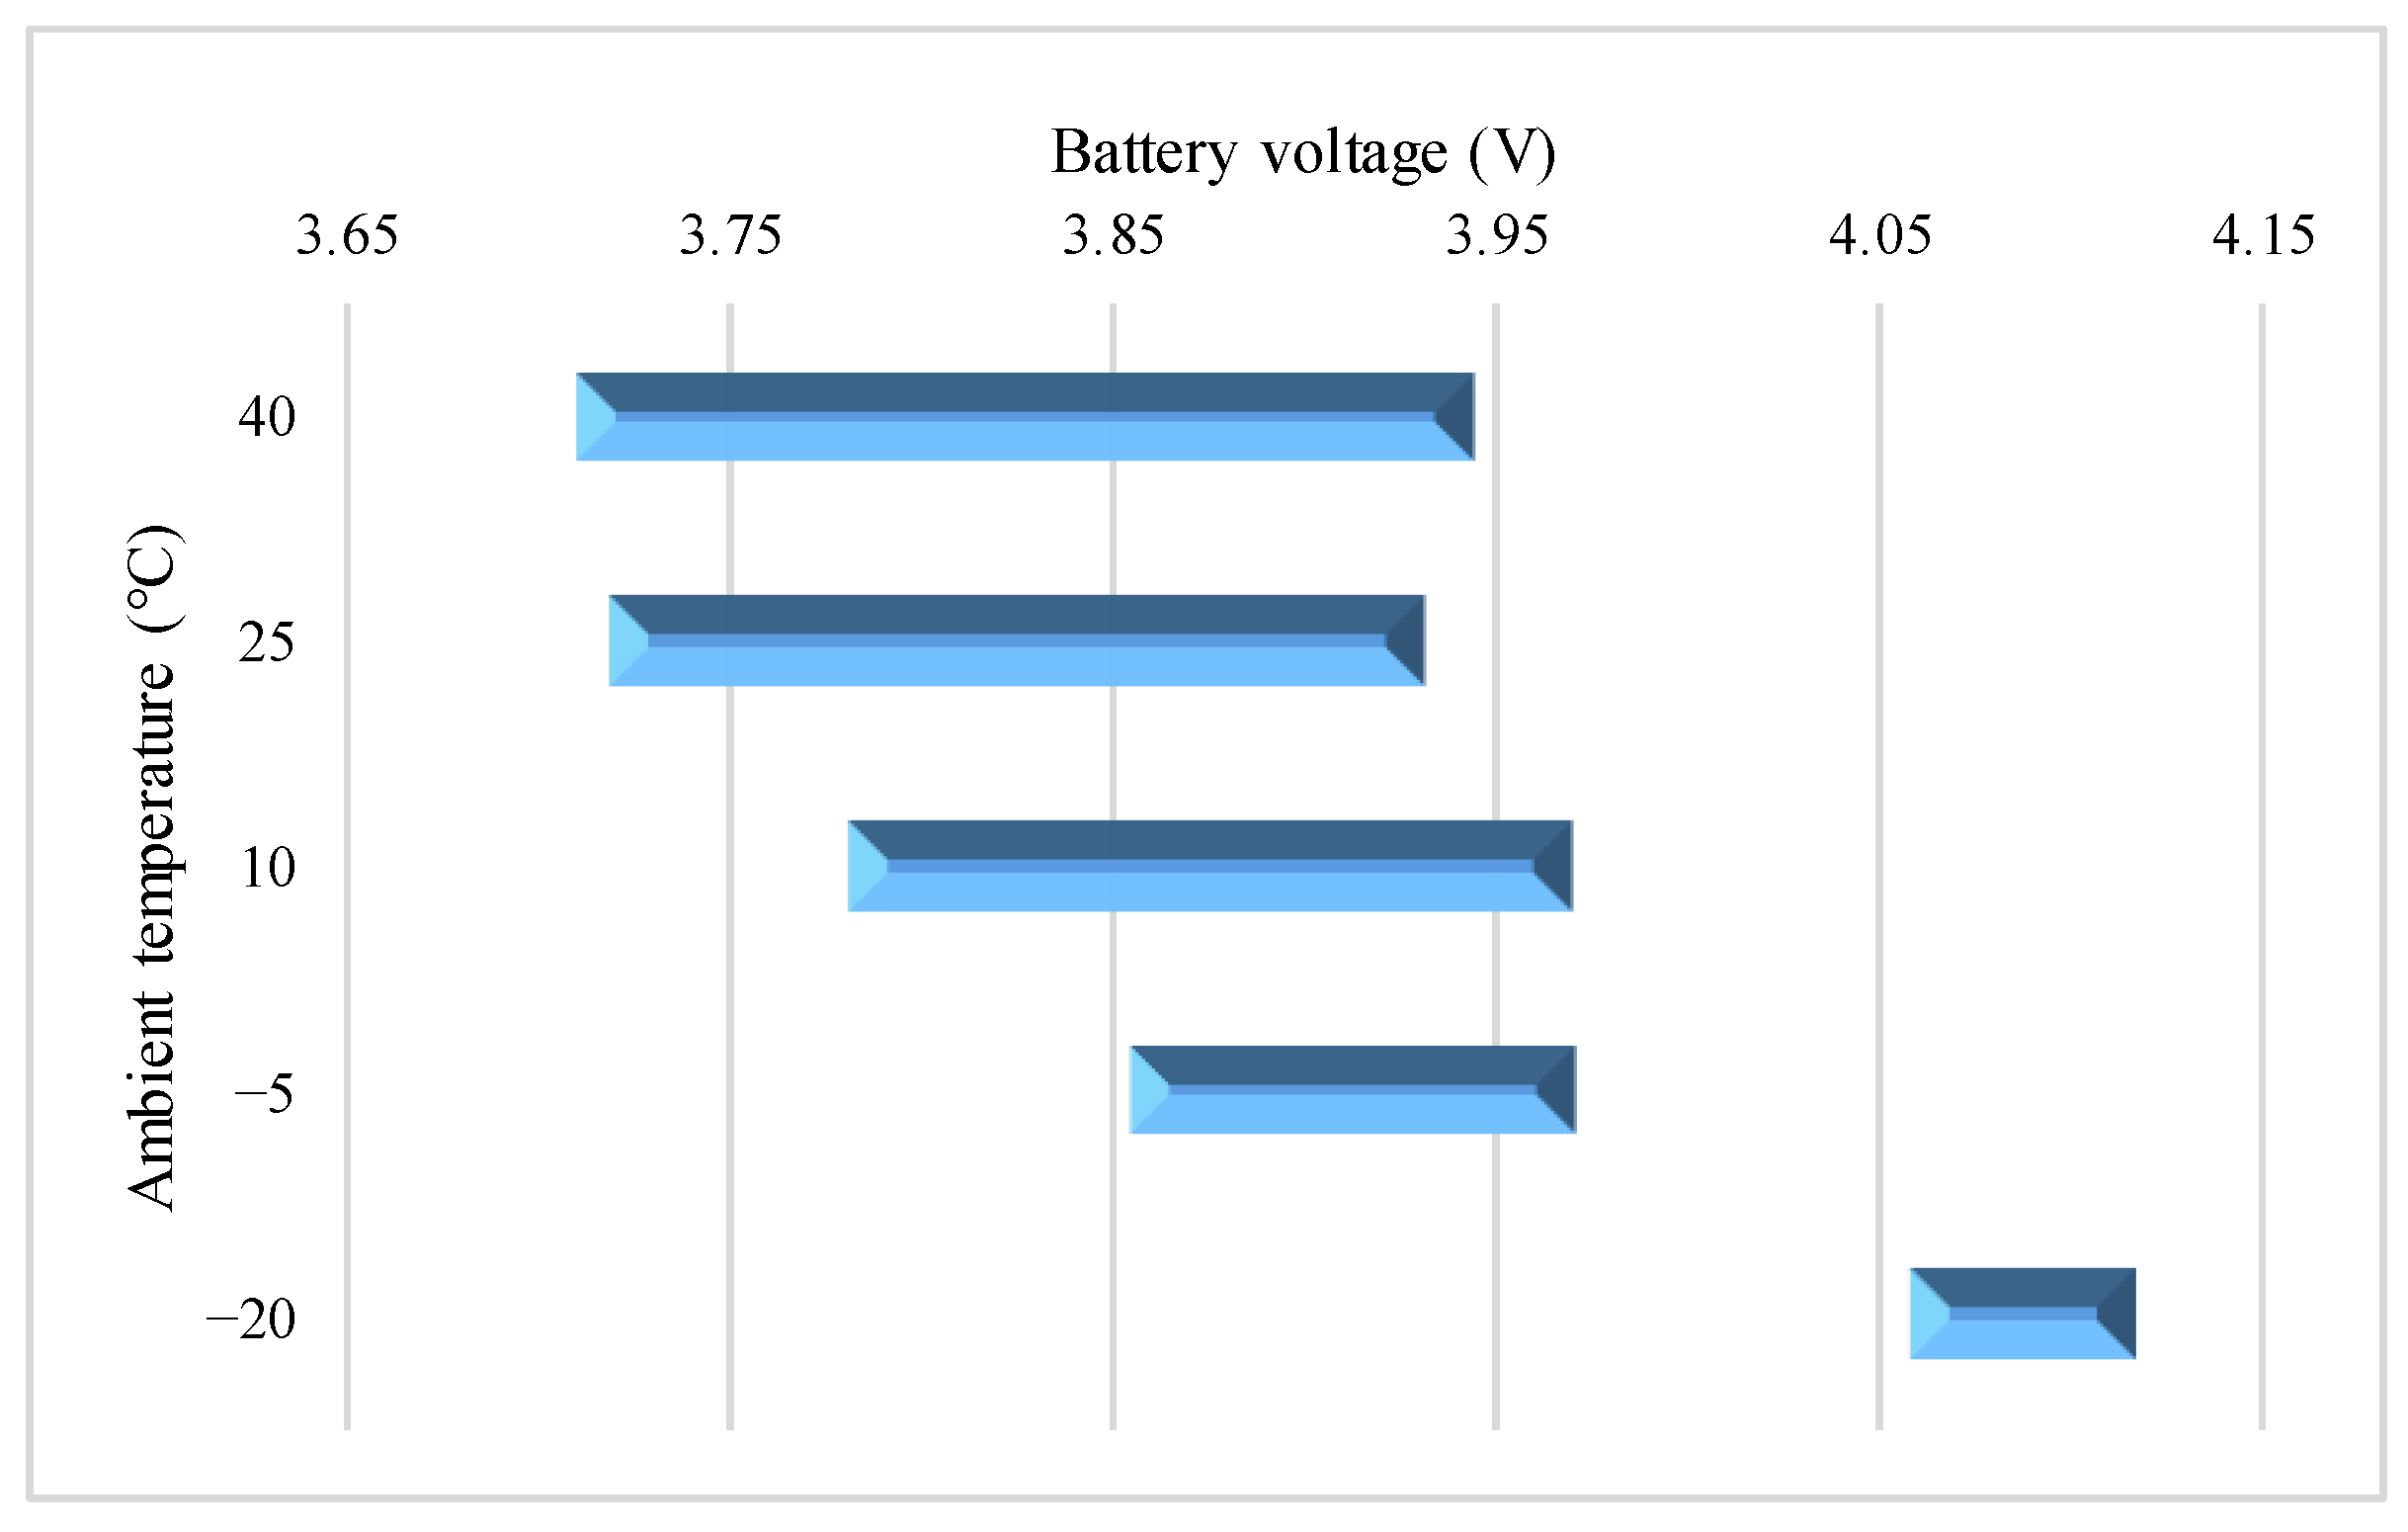
Figure 8 depicts a graph of the voltage variation interval at 0.10C charging during the VPP. In light of this, it is investigated how the battery’s surface temperature and charging capability change when the voltage increases from 3.5 V to 3.75 V at test temperatures of 40 °C, 25 °C, and 10 °C and from 3.53 V to 3.74 V at −5 °C.
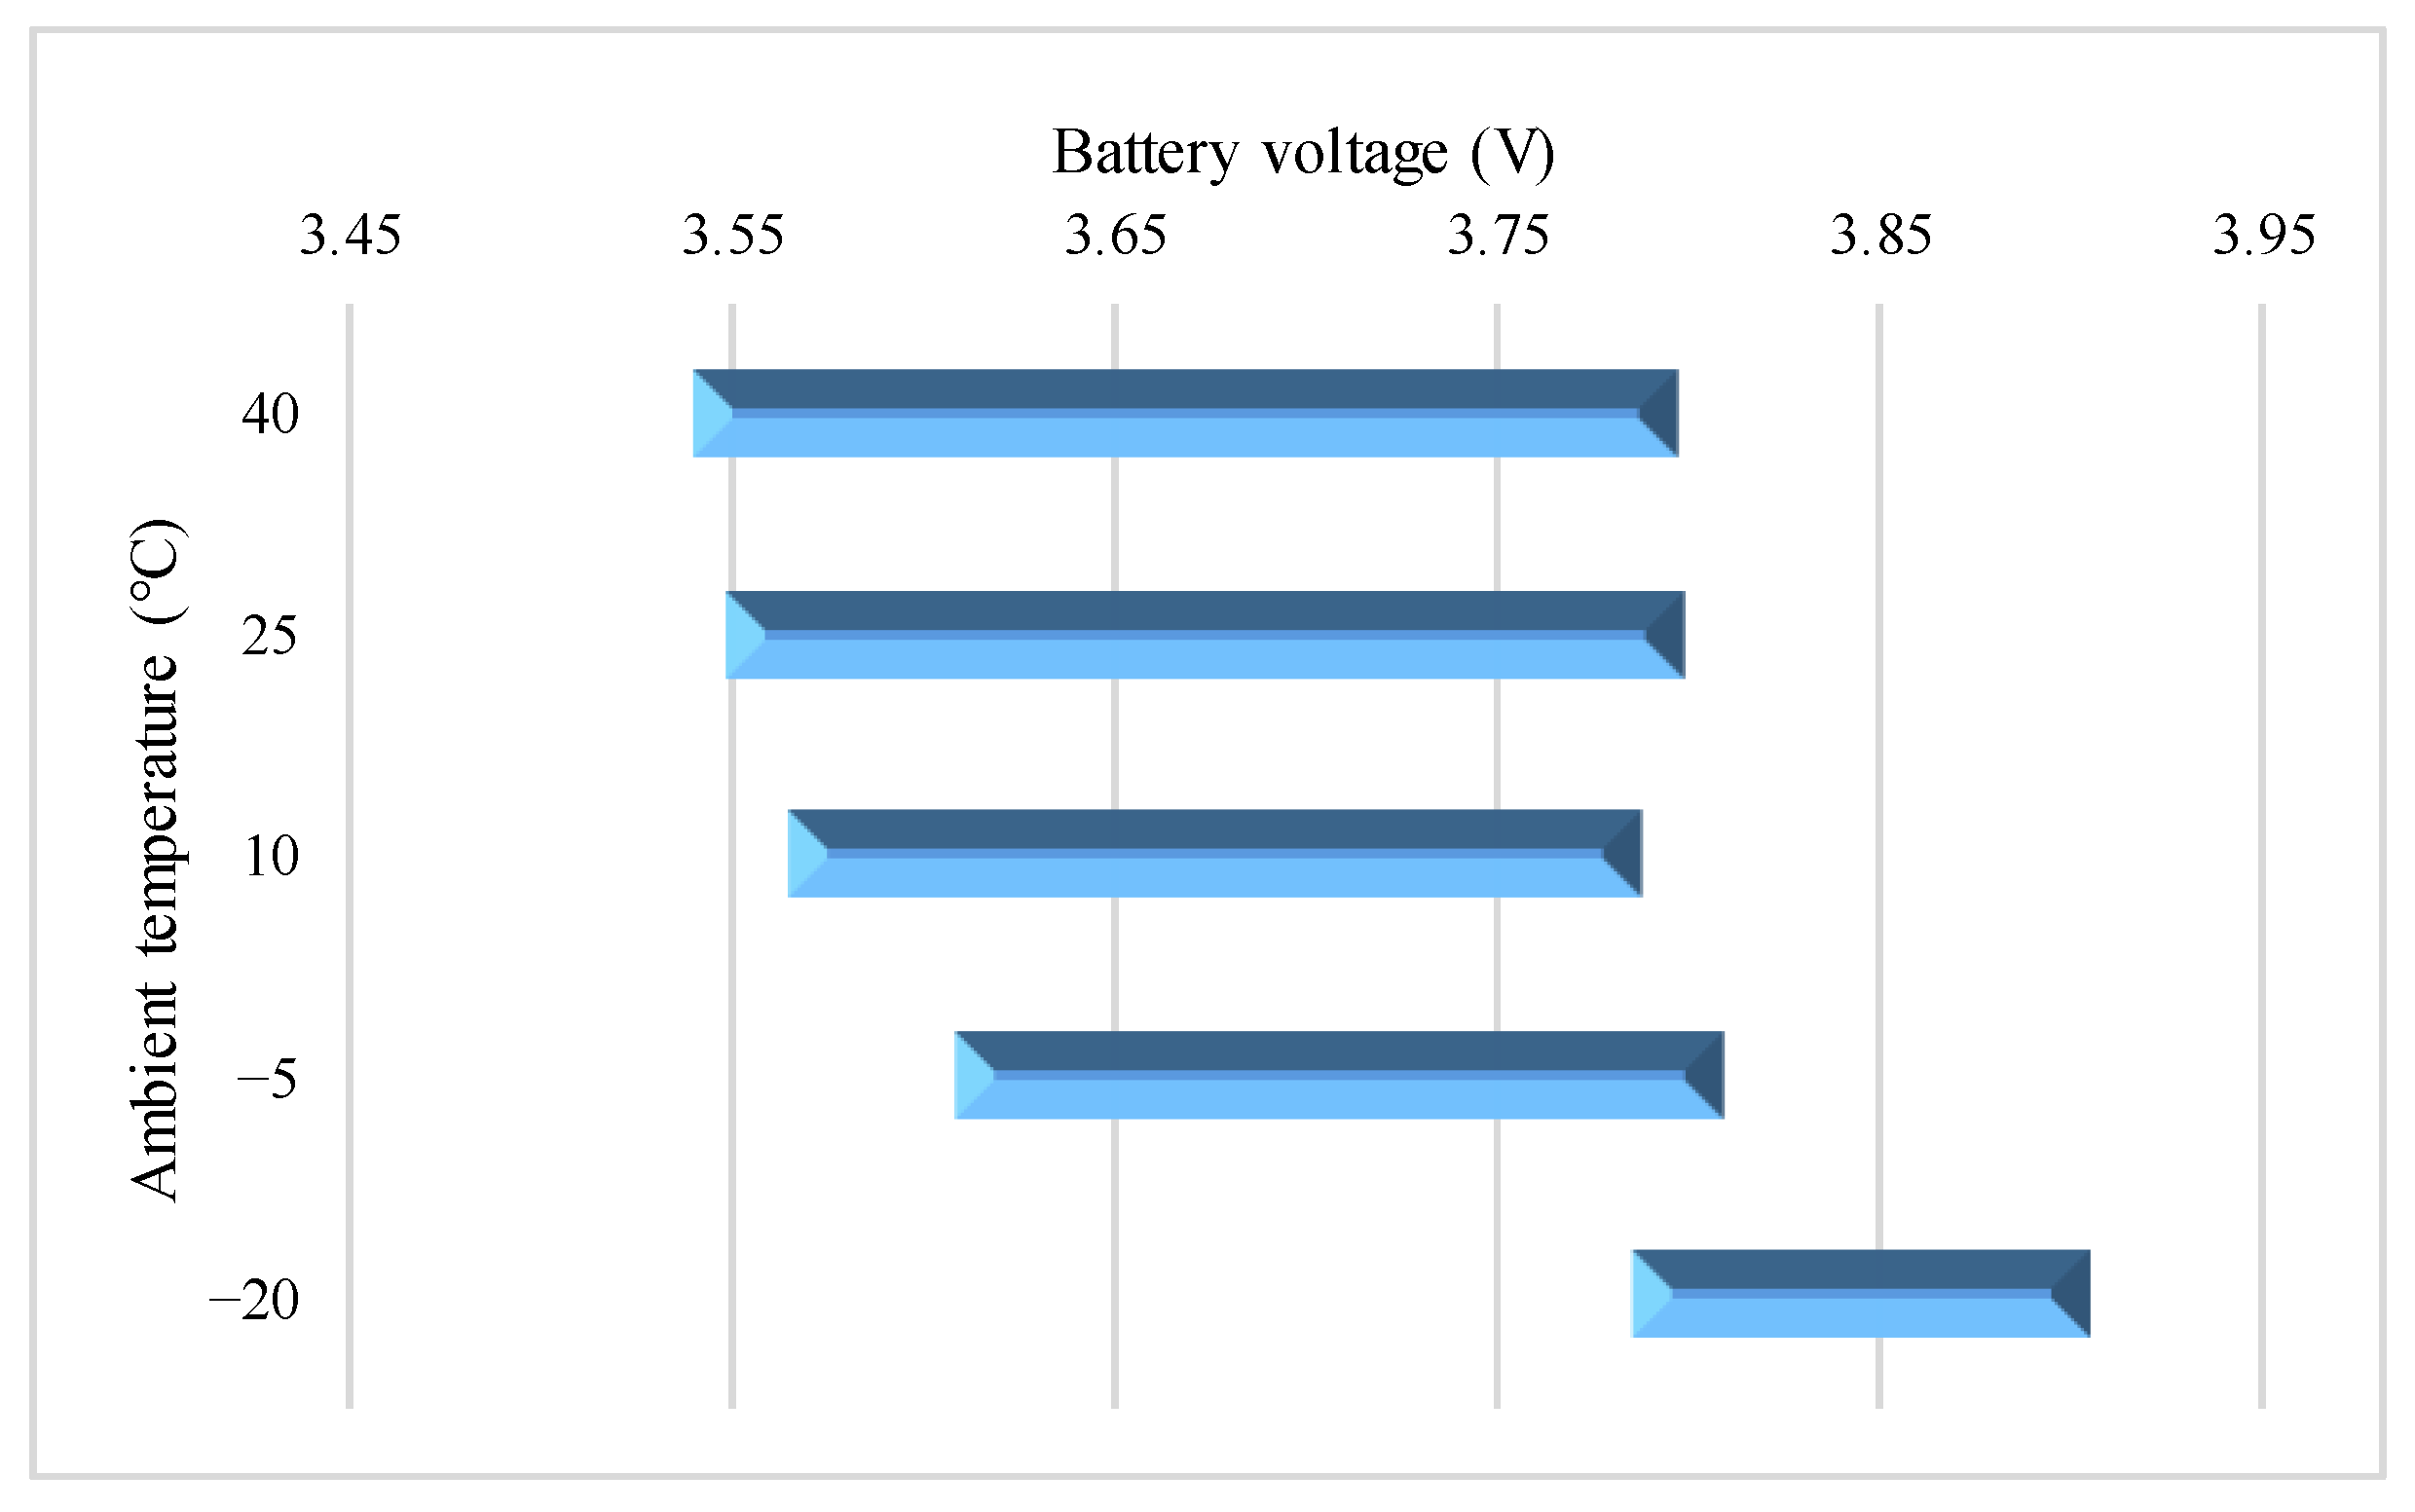
The results indicated that the temperature varies gradually and prevents the peak value. The charging capabilities are 20.2 Ah, 20.27 Ah, 20.07 Ah, and 18.87 Ah, supplying 50.17%, 50.40%, 50.69%, and 50.04%, respectively, of the total charging capacity, all of which are higher than 50%, indicating that the battery has excellent performance during the VPP, which offers a reference for the staged control strategy of the charging process and provides a basis for the design of the charging protocol for the on-board energy recovery process. In addition, the charging capacity during the time when the voltage rises from 3.63 V to 3.82 V at a test temperature of −20 °C is found to be only 46.93%, which is lower than 51.97% at the end period (3.82 V to the charging cutoff voltage), demonstrating that the VPP at low temperatures is brief and the behavior is not exceptional.

4.2.2. 0.25C Charge

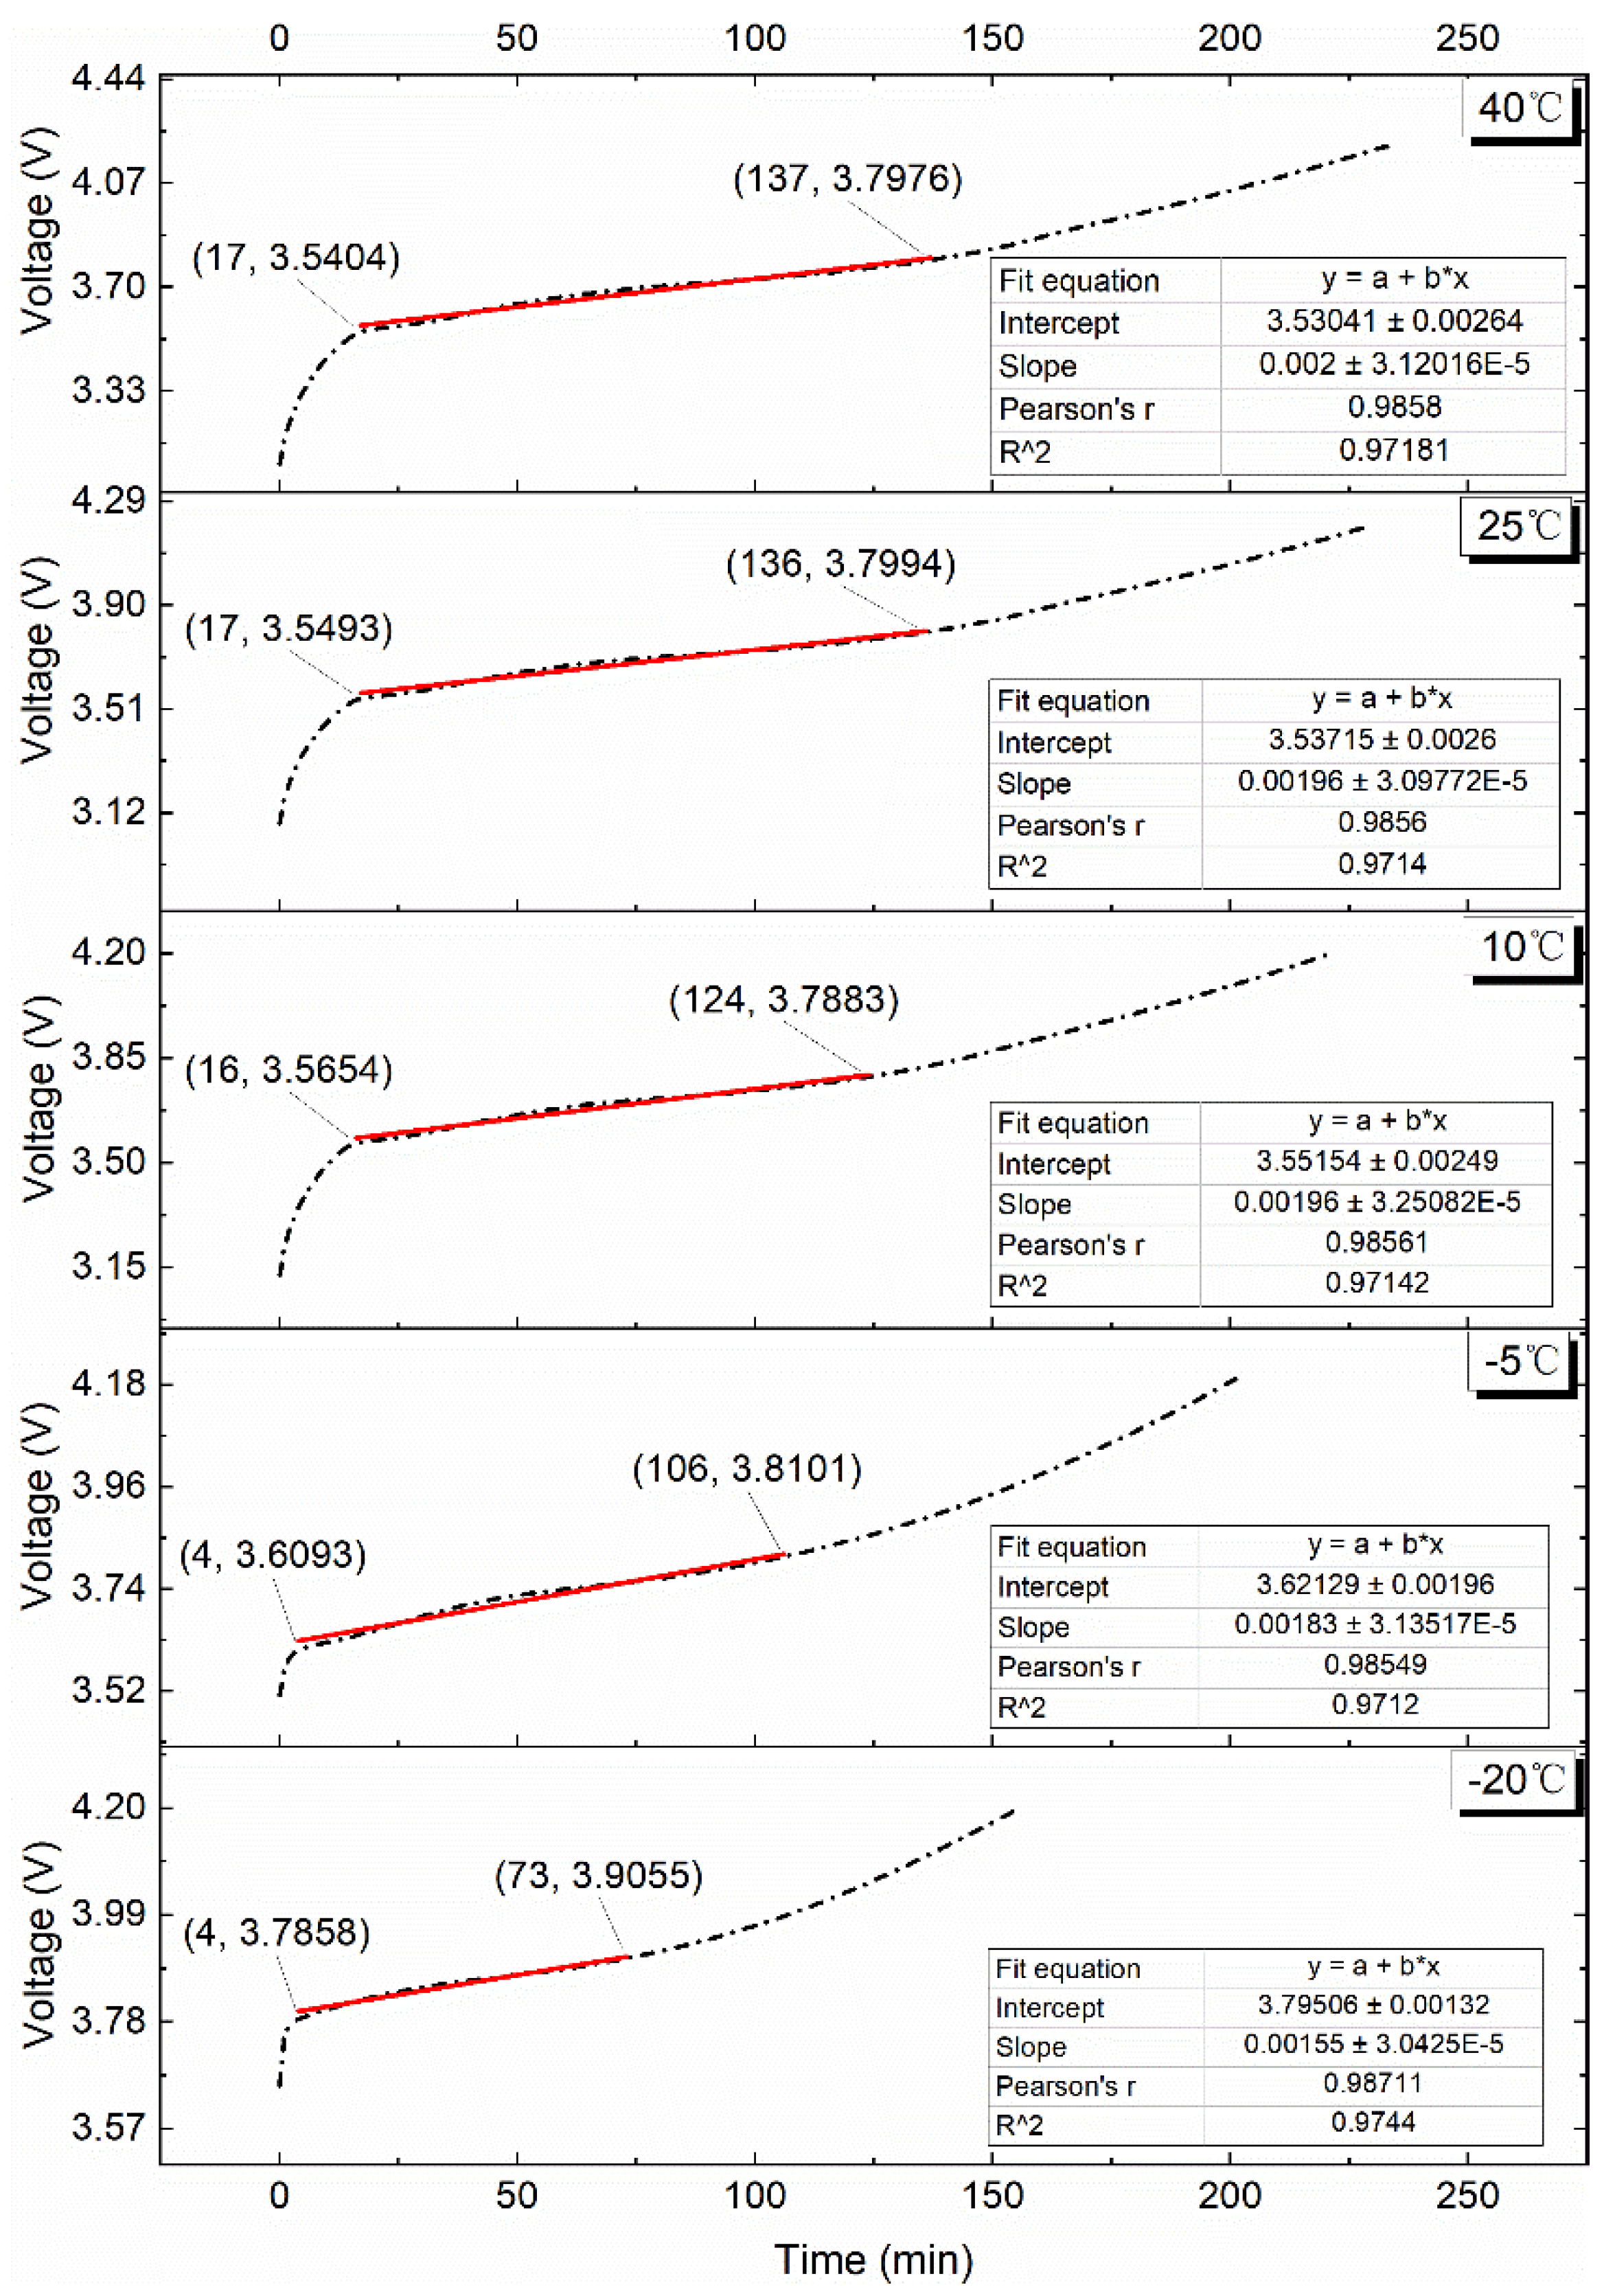
The fitted curve and fitted equation for the VPP at a charge rate of 0.25C are shown in Figure 9. It is clear that a linear regression equation can be used to fit the voltage plateau duration for each temperature environment, and the coefficient of determination, R2, is higher than 0.97. The slope of the equation is 2 × 10⁻³, and x is approximately 120 at the test temperature of 10 °C, 25 °C, and 40 °C. At ambient temperatures of −5 °C and −20 °C, the slopes of equations are 1.83 × 10⁻³ and 1.55 × 10⁻³, and the x values are 102 and 69, respectively. Consistent with the overall charging curve trend, the voltage plateau time is shorter at a low temperature.
Figure 10 displays a graph of the voltage variation interval during the VPP at 0.25C charging. In light of this, it is investigated how the battery’s surface temperature and charging capability change while the voltage increases from 3.55 V to 3.8 V at test temperatures of 40 °C, 25 °C, and 10 °C and from 3.61 V to 3.81 V under the condition of −5 °C. The charging capabilities are 19.83 Ah, 20.01 Ah, 19.17 Ah, and 17 Ah, supplying 51.21%, 52.30%, 52.01%, and 50.42%, respectively, of the entire charging capacity, each of which is higher than 50%. It is discovered that the temperature varies gradually and avoids the maximum point, indicating that the battery has excellent performance during the VPP, which offers a reference for the staged control strategy of the charging process and provides a basis for the design of the charging protocol for the on-board energy recovery process. In addition, the charging capacity during the time while the voltage rises from 3.79 V to 3.91 V at a test temperature of −20 °C is found to be only 44.30%, which is lower than 53.13% at the end period (3.91 V to the charging cutoff voltage), demonstrating that the VPP at low temperatures is brief and the behavior is not exceptional.

4.2.3. 0.50C Charge

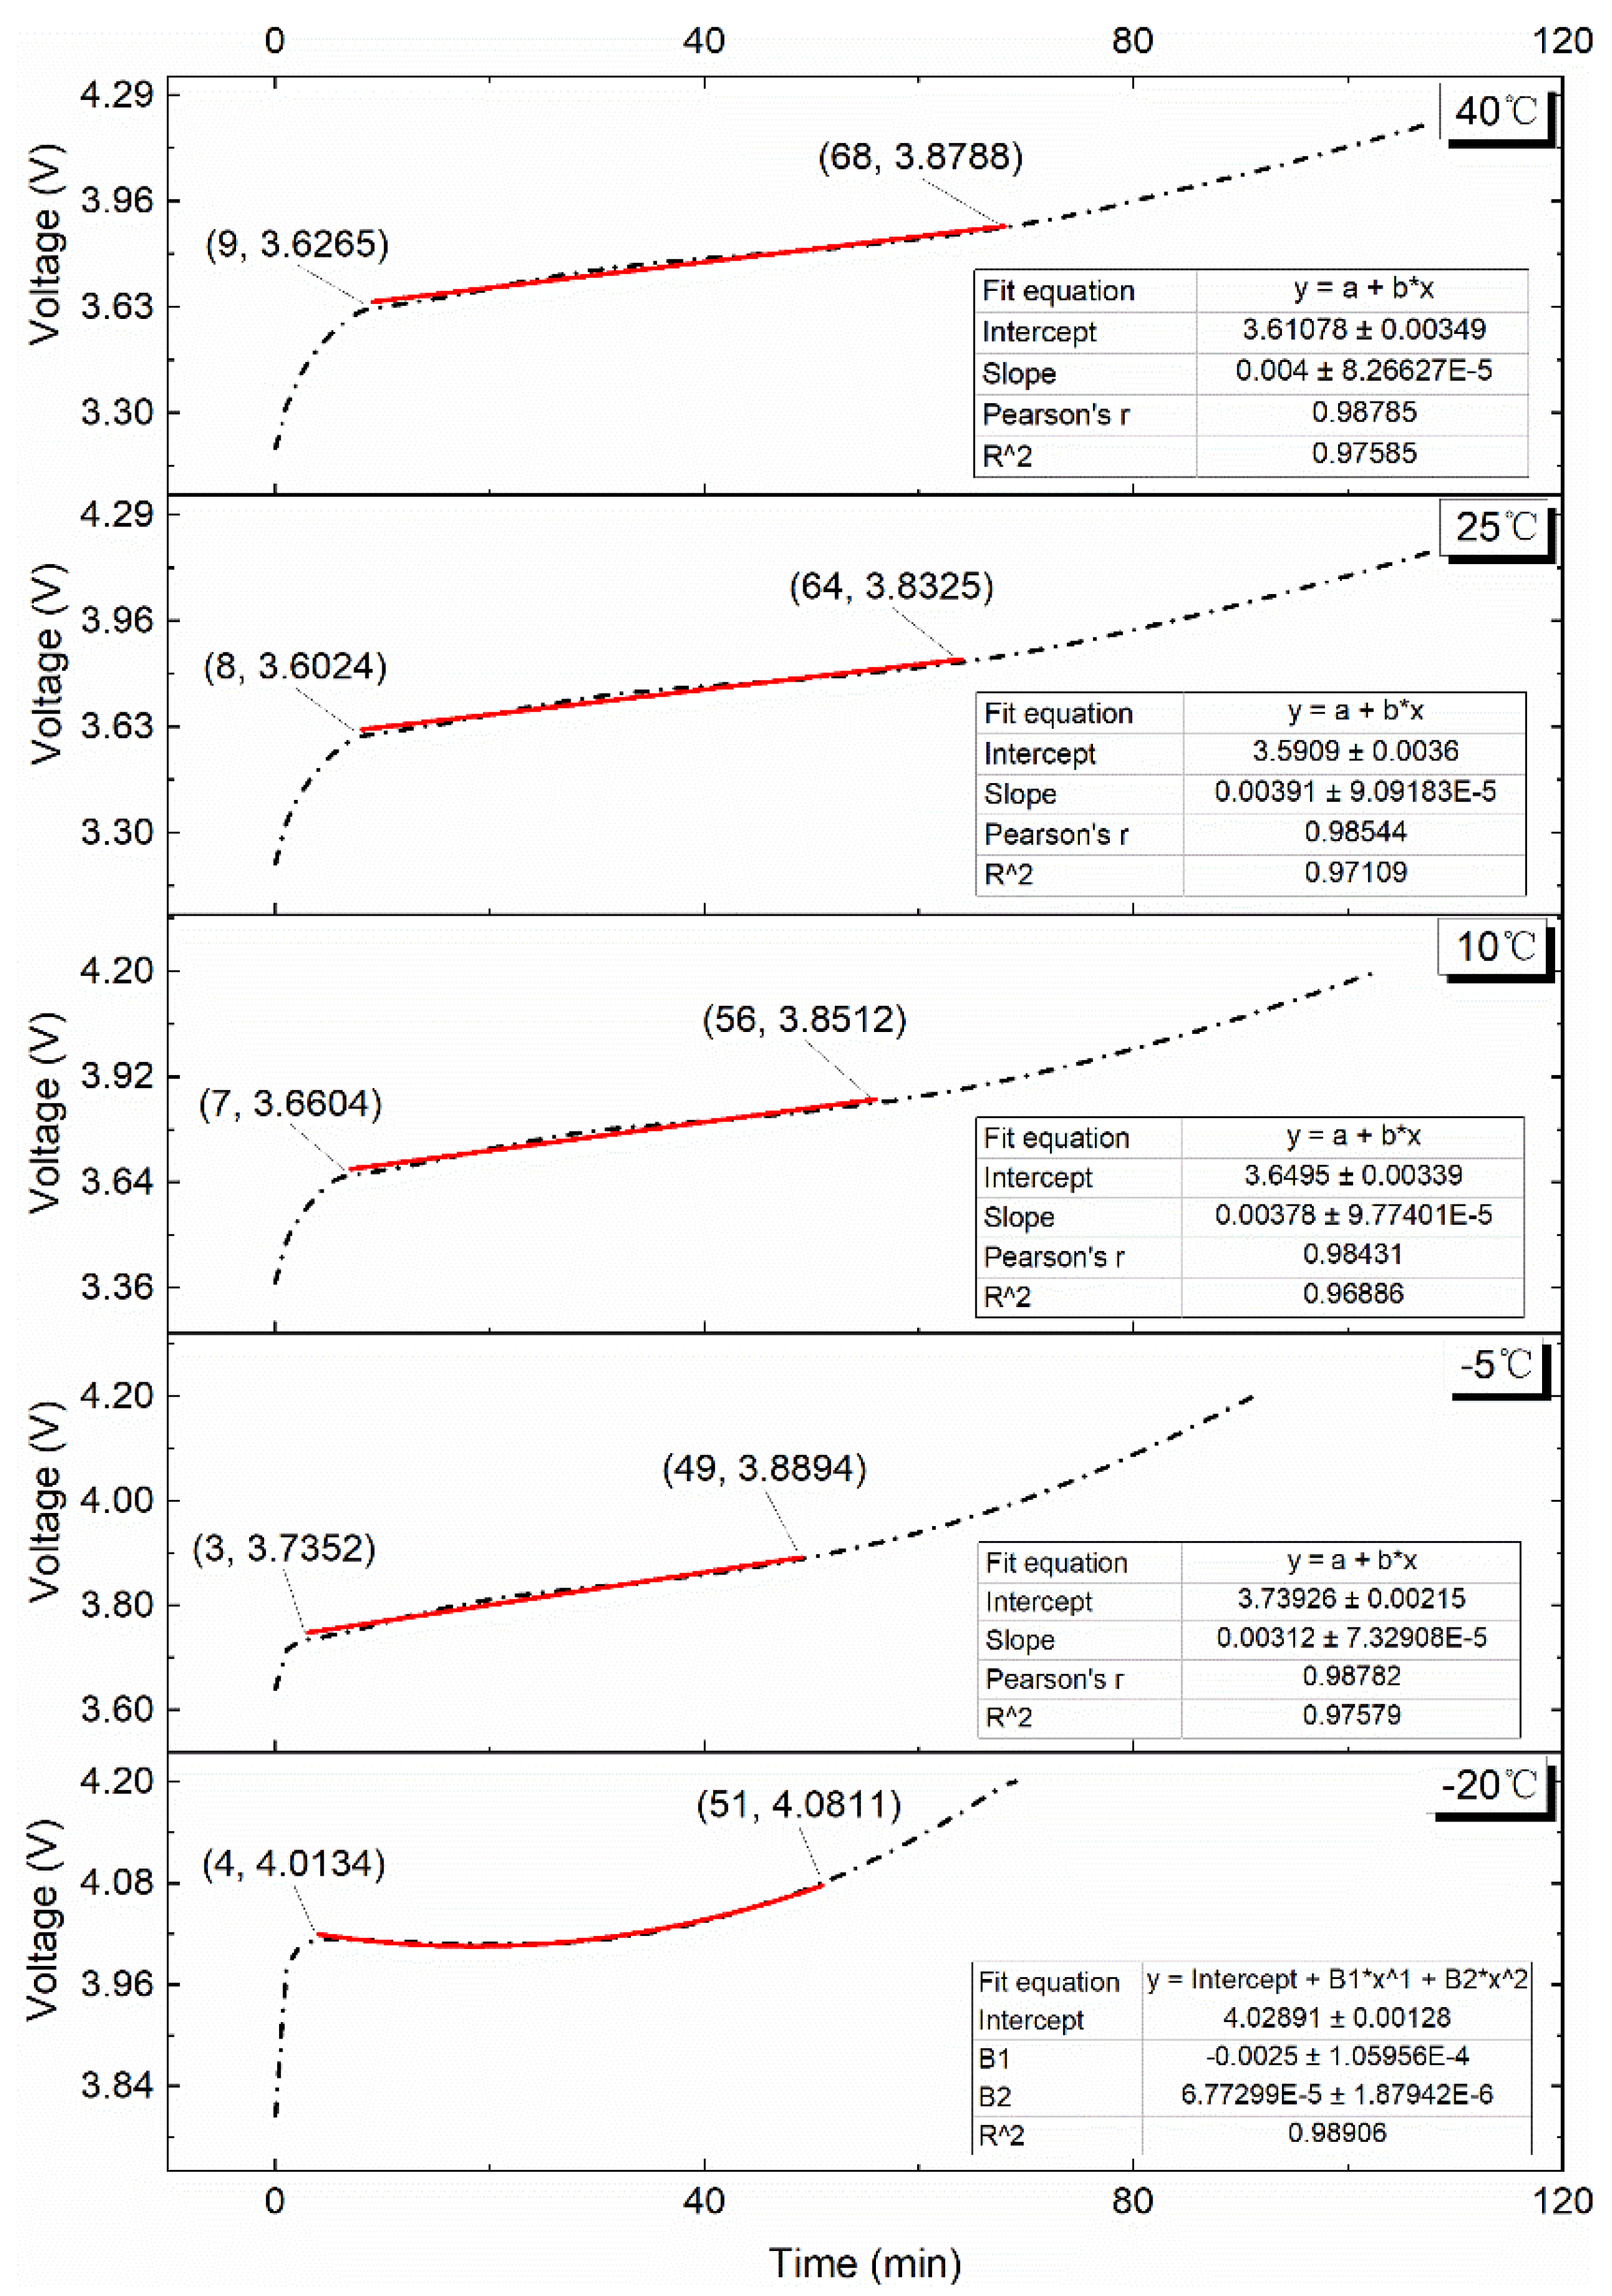
Figure 11 depicts the fitted curve and fitted equation for the VPP at the 0.50C charge rate. As can be observed, linear regression equations with R2 values higher than 0.96 may be used to match the voltage plateau durations for ambient temperatures of 40 °C, 25 °C, 10 °C, and −5 °C. The slopes of the equations are 4 × 10⁻³, 3.91 × 10⁻³, 3.78 × 10⁻³, and 3.12 × 10⁻³, and the x values are 59, 56, 49, and 46, respectively. As the ambient temperature decreases, the variation amplitude of the VPP decreases and the duration shortens.
At the test temperature of −20 °C, the terminal voltage of lithium batteries bounces back to 0.0059 V at the beginning of charging, and the reason for this is that the lithium battery has a high initial internal resistance at low temperature, and the battery will generate a lot of heat when working under this condition, which leads to the temperature of the battery itself rising. For the lithium battery in a low-temperature environment, this heat helps to improve the rate of the internal electrochemical reaction and will reduce the internal resistance of the battery. This also indicates that the heat generation of the lithium battery itself at low temperature is beneficial to enhance the electrochemical behavior of the battery to some extent. The polynomial equation fitted to the voltage rebound phase is shown in the following equation.
y   = 6.77 × 10 5 x 2 2.5 × 10 3 x   + 4.03  
Figure 12 displays a graph of the voltage variation interval during the VPP at 0.50C charging. In light of this, it is investigated how the battery’s surface temperature and charging capacity vary while the voltage increases from 3.6 V to 3.85 V at test temperatures of 40 °C, 25 °C, and 10 °C and from 3.74 V to 3.89 V at −5 °C.
The charging capabilities are 19.01 Ah, 20.34 Ah, 17.34 Ah, and 15.34 Ah, representing 51.63%, 55.39%, 50.61%, and 50.48% of the total charging capacity, all of which are higher than 50%. It is discovered that the temperature varies gradually and avoids the maximum point, indicating that the battery has excellent performance during the VPP, which offers a reference for the staged control strategy of the charging process and provides a basis for the design of the charging protocol for the on-board energy recovery process. At the test temperature of −20 °C, charging capacity in this voltage rebound stage reaches 15.67 Ah, accounting for 68.69% of the total charging capacity.

4.2.4. 0.75C Charge

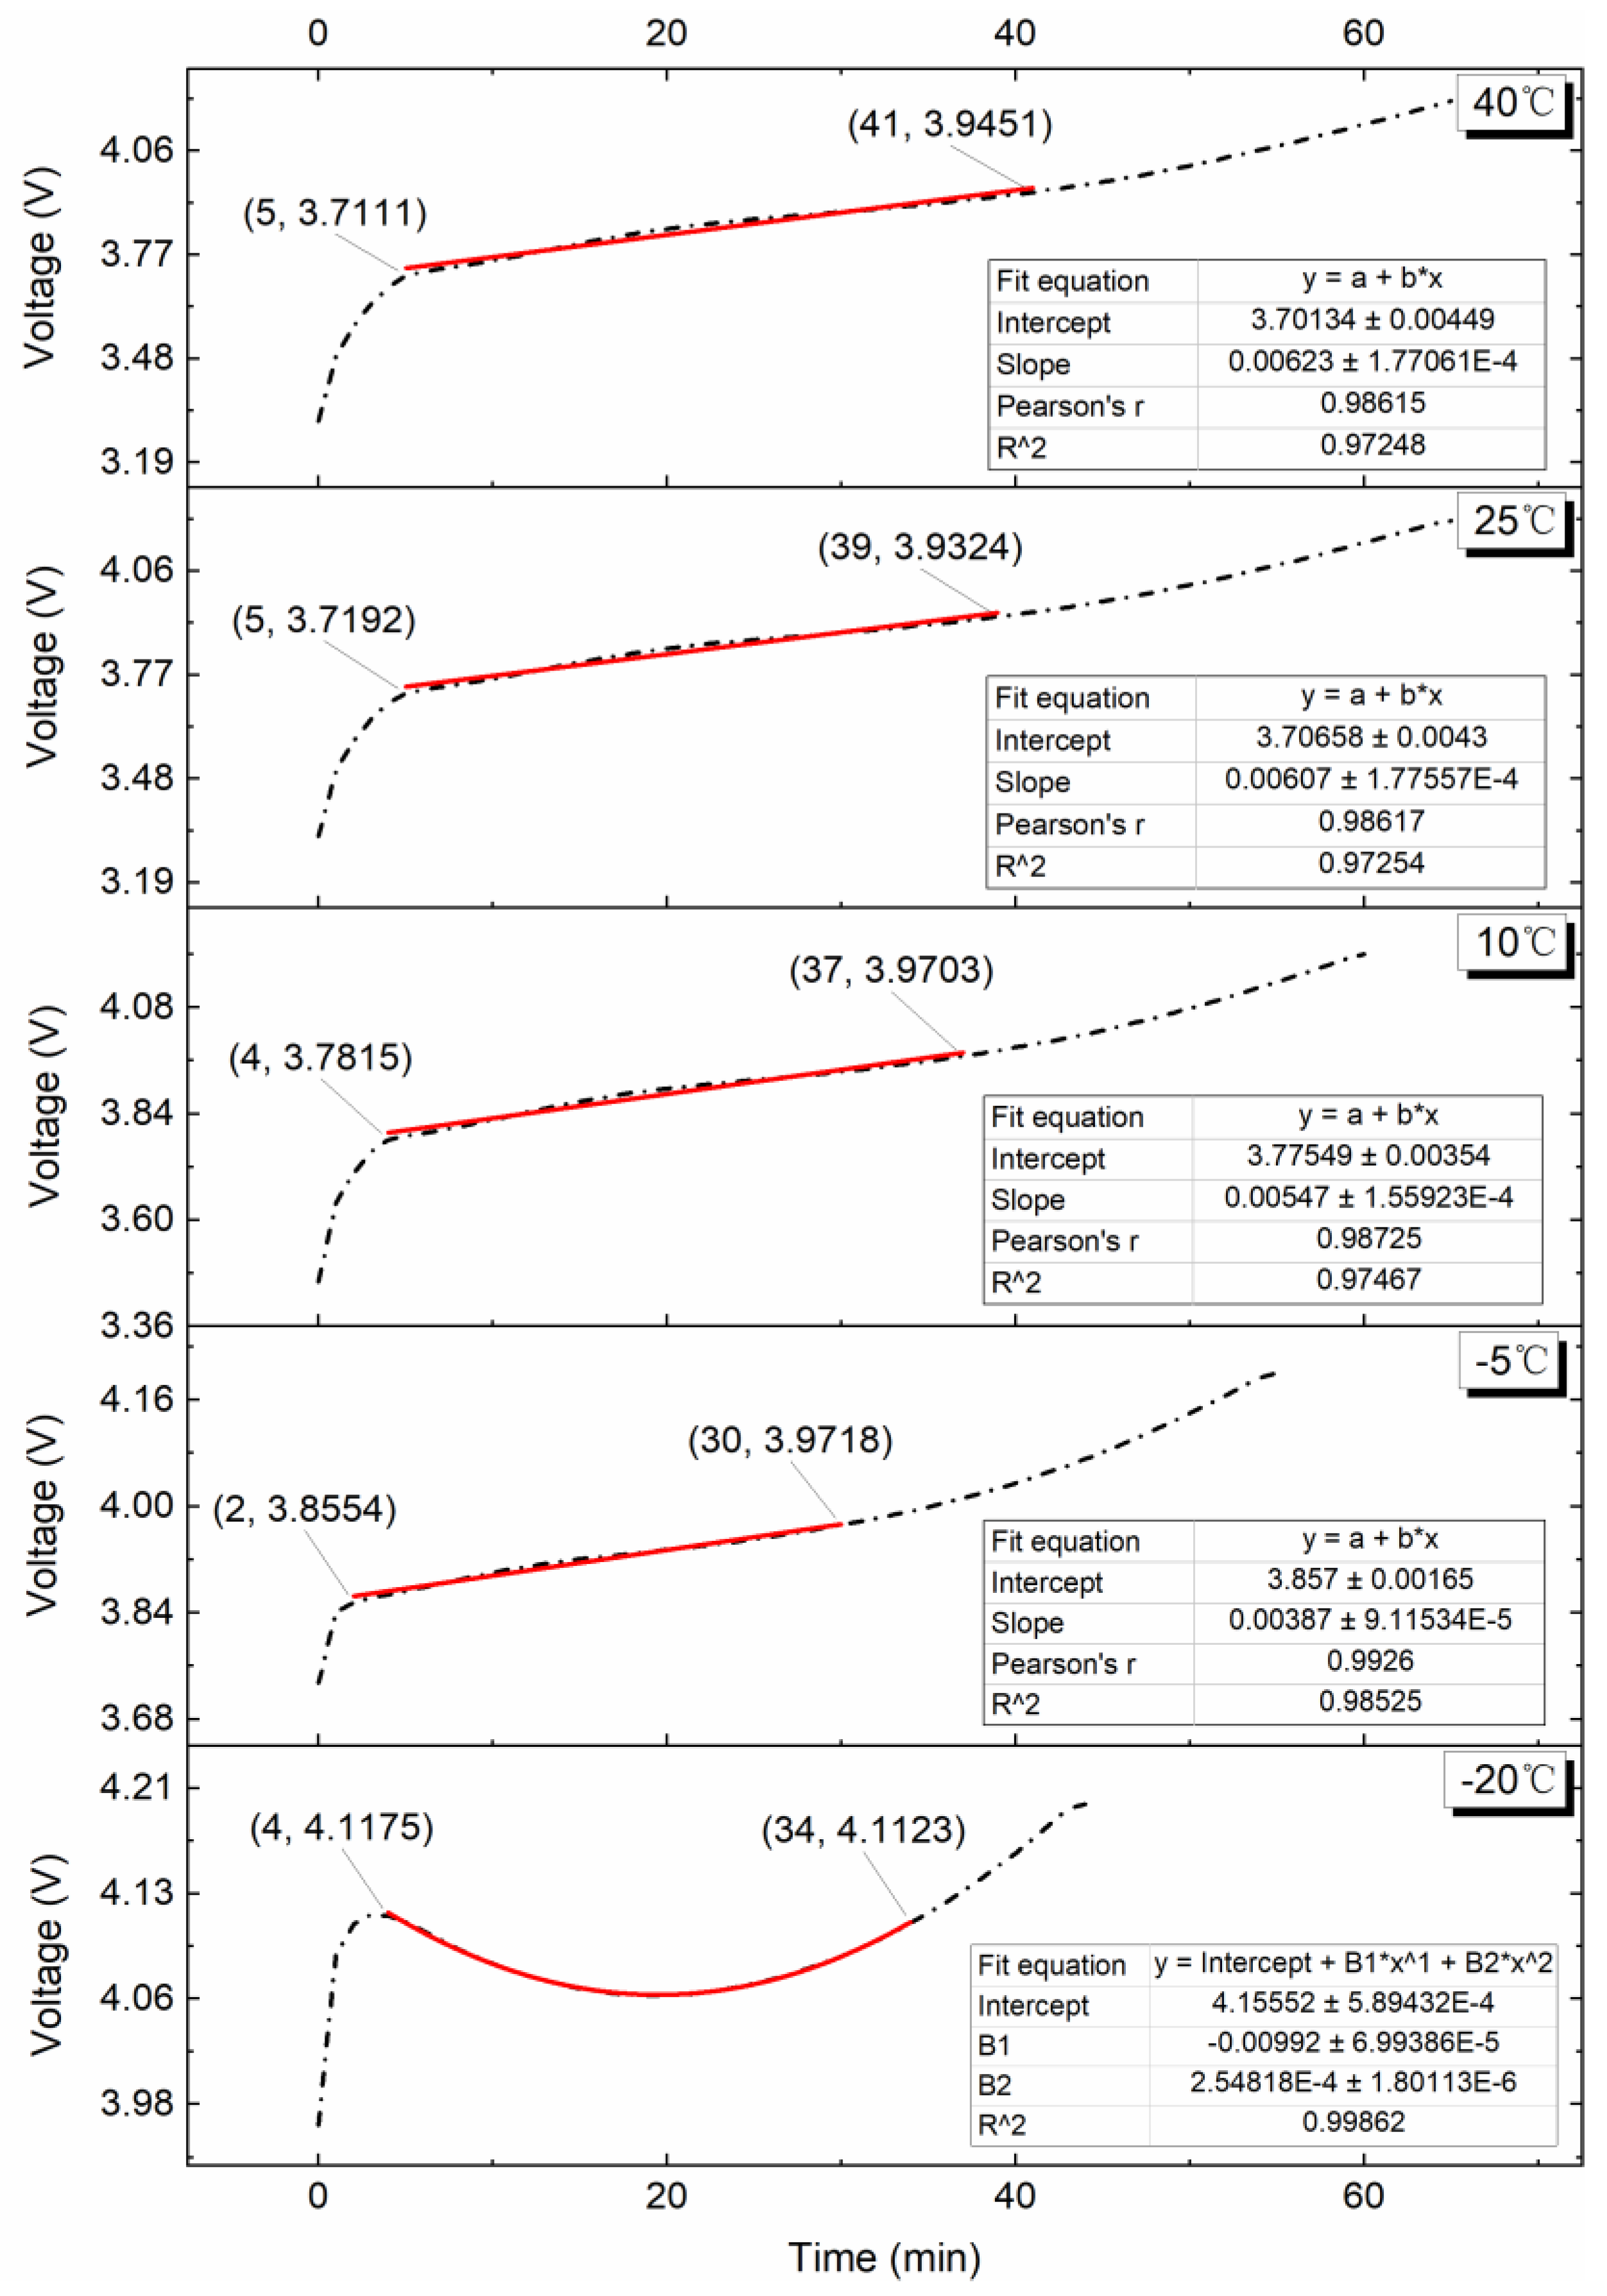
Figure 13 depicts the fitted curve and fitted equation for the VPP at 0.75C charge rate. As can be observed, linear regression models with R2 values higher than 0.97 may be used to match the voltage plateau durations for ambient temperatures of 40 °C, 25 °C, 10 °C, and −5 °C. The slopes of the equations are 6.23 × 10⁻³, 6.07 × 10⁻³, 5.47 × 10⁻³, and 3.87 × 10⁻³, and the x values are 36, 34, 33, and 28, respectively. As the ambient temperature decreases, the variation amplitude of the VPP decreases and the duration shortens. When the test temperature is −20 °C, the terminal voltage of the lithium batteries rebounds by 0.045 V in the initial period of charging. The fitted polynomial equation of the voltage rebound stage is shown in the following equation.
y   = 2.55 × 10 4 x 2 9.92 × 10 3 x   + 4.16  
Figure 14 displays a graph of the voltage variation interval during the VPP at 0.75C charging. In light of this, it is investigated how the battery’s surface temperature and charging capacity vary while the voltage increases from 3.7 V to 4 V at test temperatures of 40 °C, 25 °C, and 10 °C and from 3.86 V to 3.97 V under the condition of −5 °C. The charging capabilities are 22 Ah, 21.5 Ah, 20 Ah, and 14 Ah, which represent 67.67%, 66.63%, 66.91%, and 51.43%, respectively, of the total charging capacity and are all higher than 50%. It is discovered that the temperature varies gradually and avoids the maximum point, indicating that the battery has excellent performance during the VPP, which offers a reference for the staged control strategy of the charging process and provides a basis for the design of the charging protocol for the on-board energy recovery process. At the test temperature of −20 °C, the charging capacity in this voltage rebound stage reaches 15.01 Ah, accounting for 69.32% of the total charging capacity.

4.2.5. 1.00C Charge

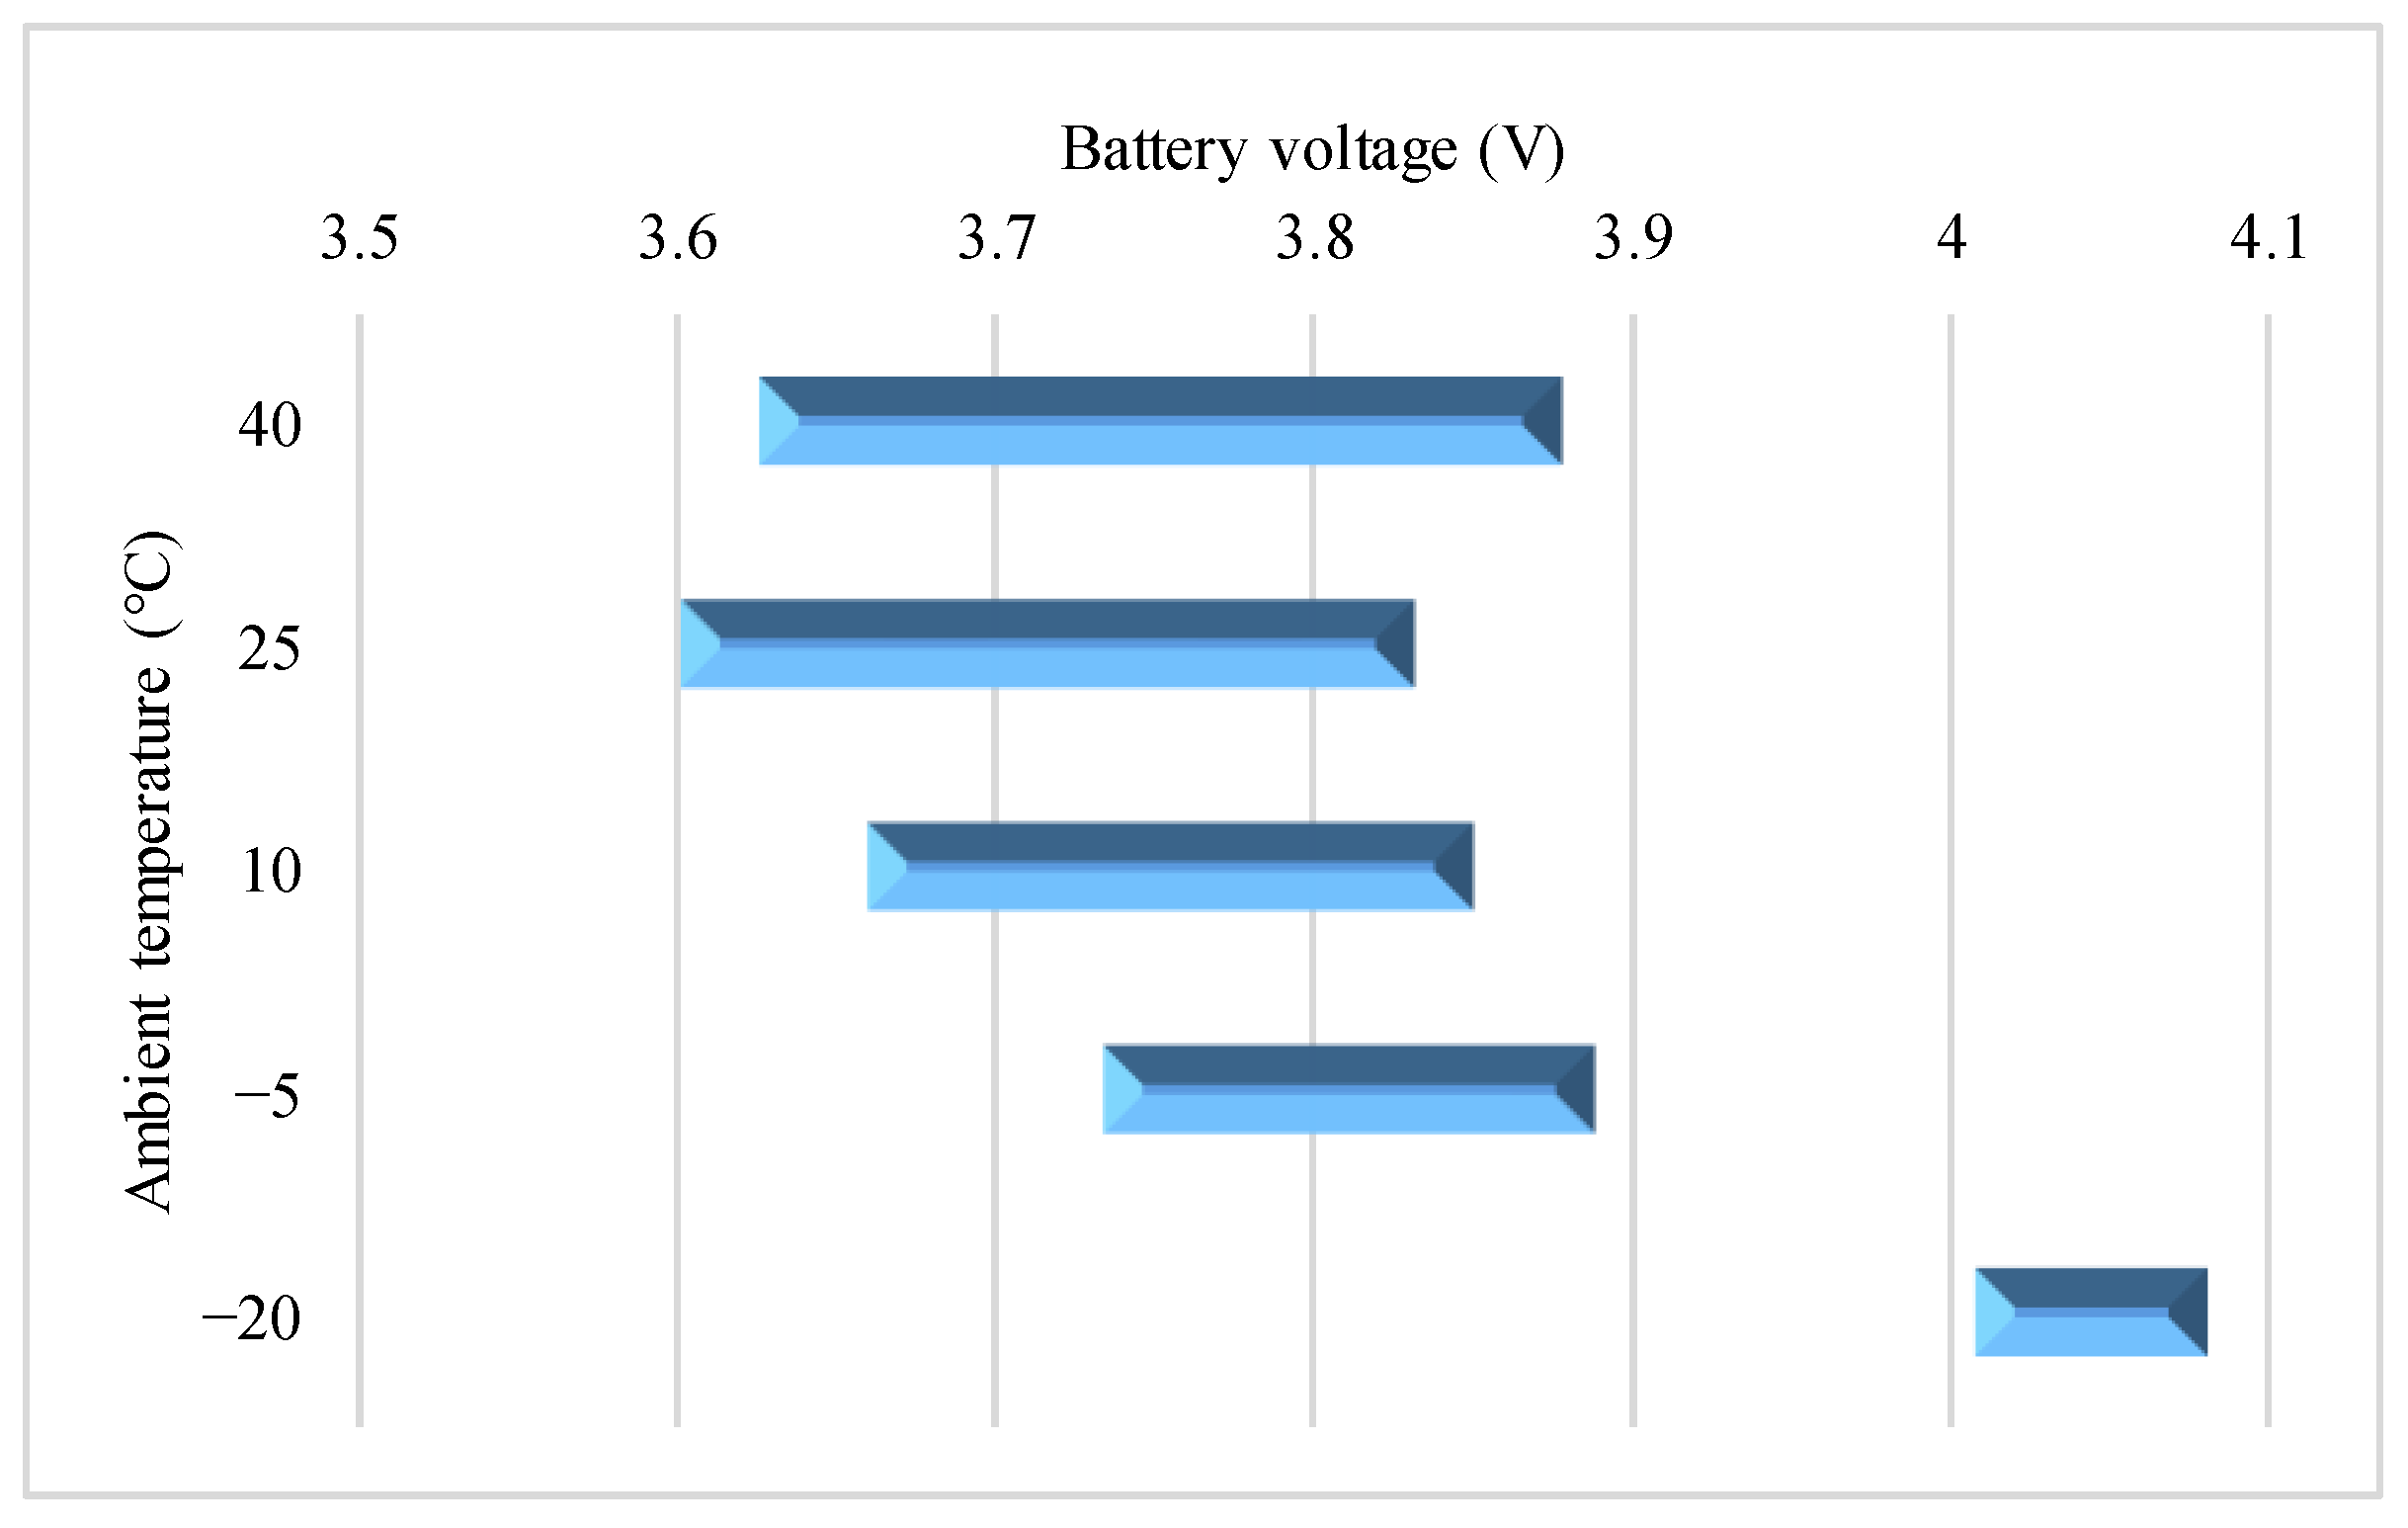
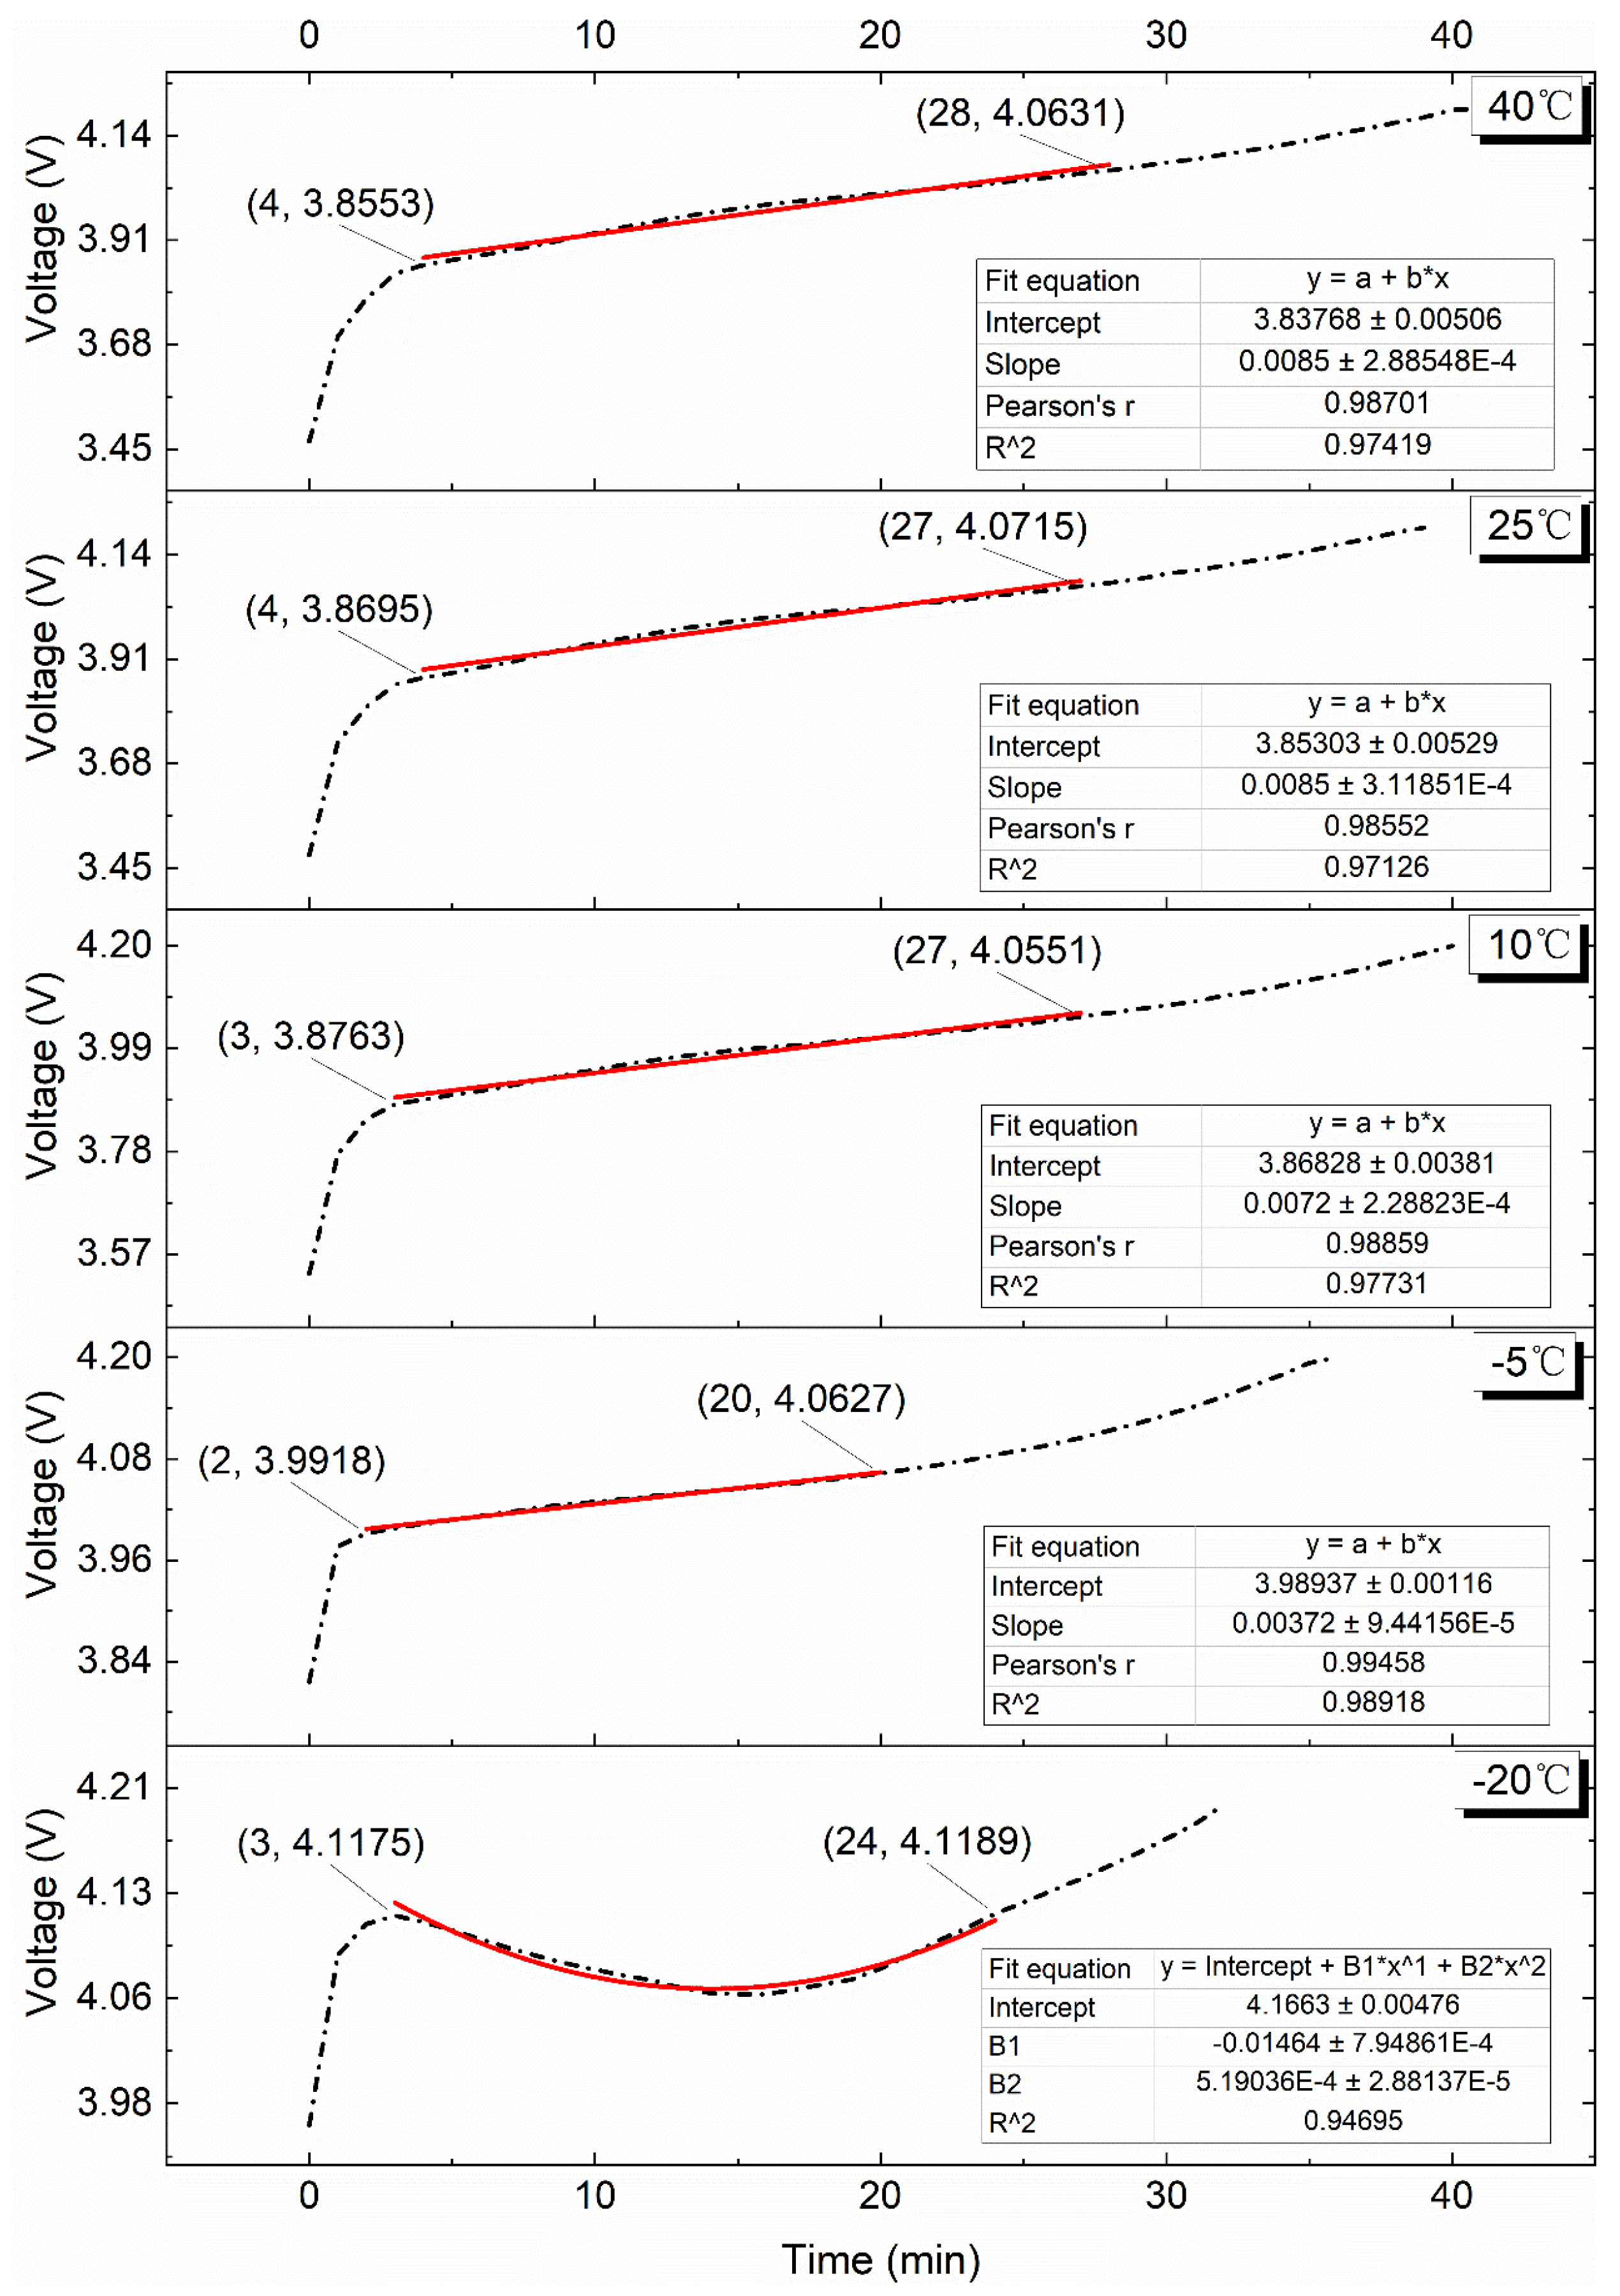
Figure 15 depicts the fitted curve and fitted equation for the VPP at a 1.00C charge rate. As can be observed, linear regression models with R2 values higher than 0.97 may be used to match the voltage plateau durations for test temperatures of 40 °C, 25 °C, 10 °C, and −5 °C. The slopes of the linear equations are 8.5 × 10⁻³, 8.5 × 10⁻³, 7.2 × 10⁻³, and 3.72 × 10⁻³, and the x values are 24, 23, 24, and 18, respectively. As the ambient temperature decreases, the VPP basically maintains the law that the variation amplitude decreases and the duration shortens. When the test temperature is −20 °C, the terminal voltage of the lithium batteries rebounds by 0.0595 V at the initial period of charging. The fitted polynomial equation of the voltage rebound stage is shown in the following equation.
y   = 5.19 × 10 4 x 2 1.46 × 10 2 x   + 4.17  
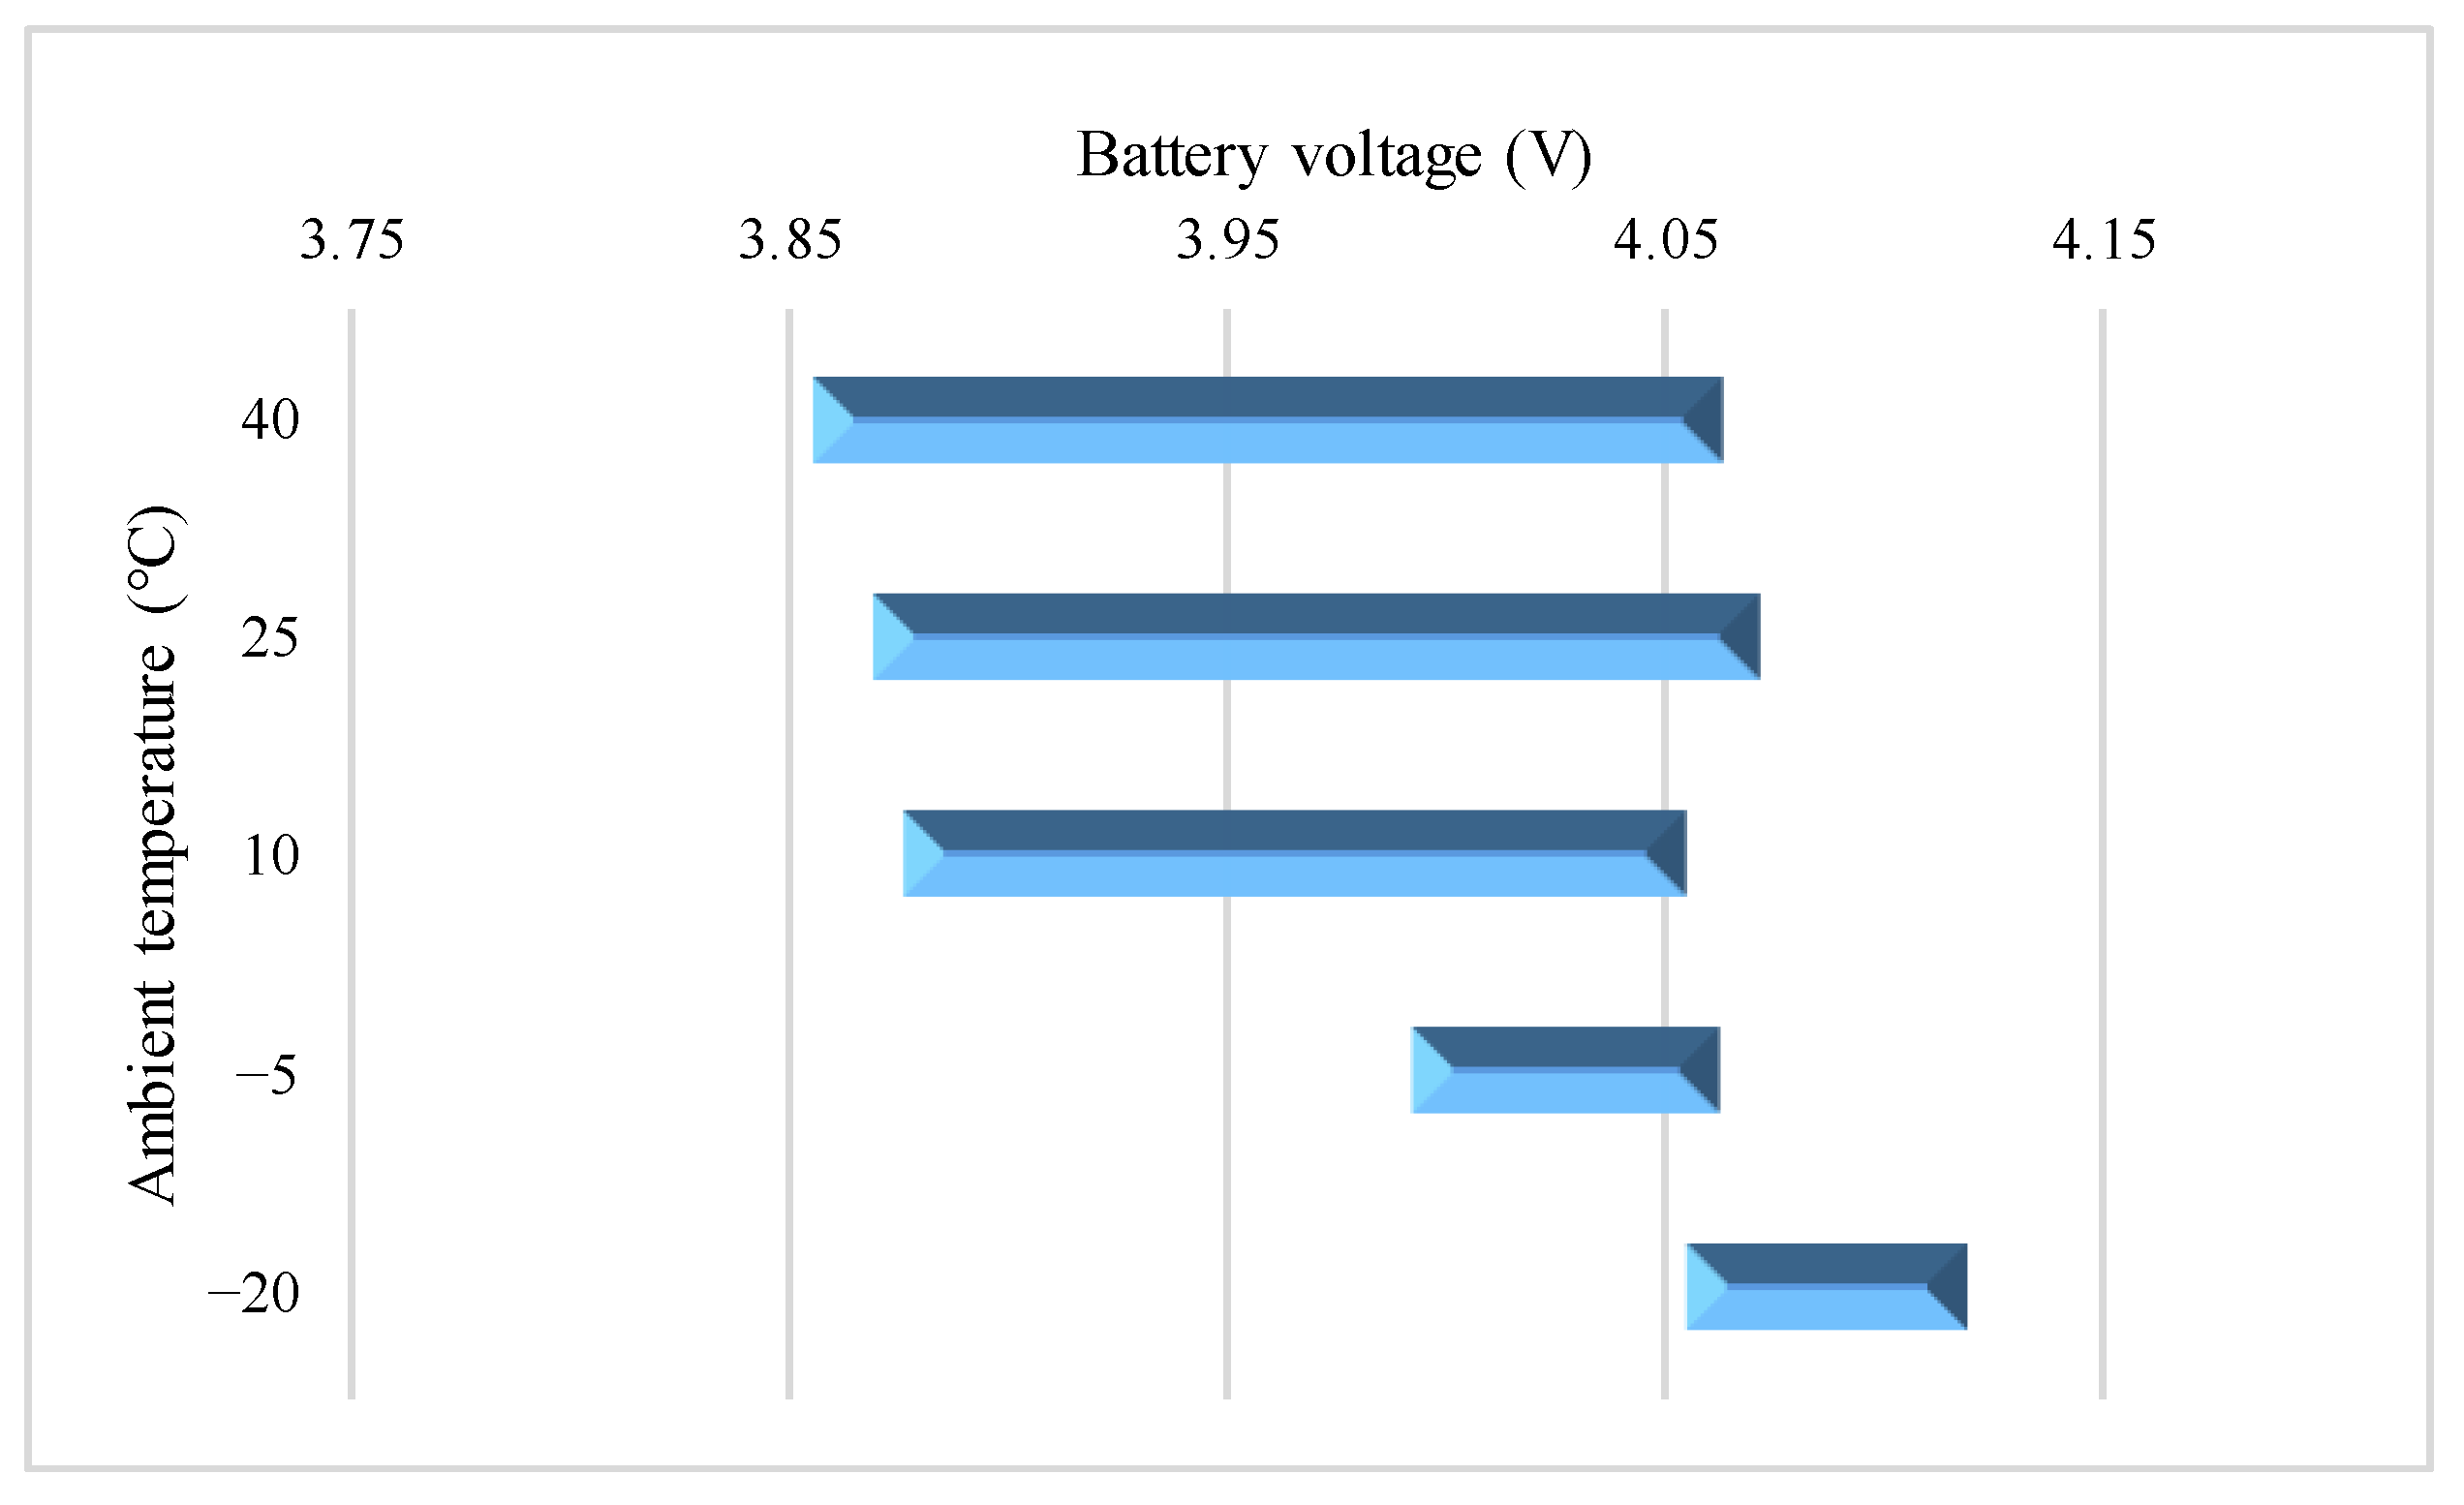
Figure 16 displays a graph of the voltage variation interval during the VPP at 1.00C charging. In light of this, it is investigated how the battery’s surface temperature and charging capability change while the voltage increases from 3.85 V to 4.05 V at test temperatures of 40 °C, 25 °C, and 10 °C and from 3.99 V to 4.06 V under the condition of −5 °C. The charging capabilities are 15.33 Ah, 14.67 Ah, 15 Ah, and 12 Ah, accounting for 57.20%, 56.66%, 56.31%, and 50.74%, respectively, of the total charging capacity, all of which are higher than 50%. It is discovered that the temperature varies gradually and avoids the maximum point, indicating that the battery has excellent performance during the VPP, which offers a reference for the staged control strategy of the charging process and provides a basis for the design of the charging protocol for the on-board energy recovery process. When the test temperature is −20 °C, the charging capacity in this voltage rebound stage reaches 13 Ah, accounting for 66.77% of the total charging capacity.

4.3. Study on Surface Temperature Range during the VPP

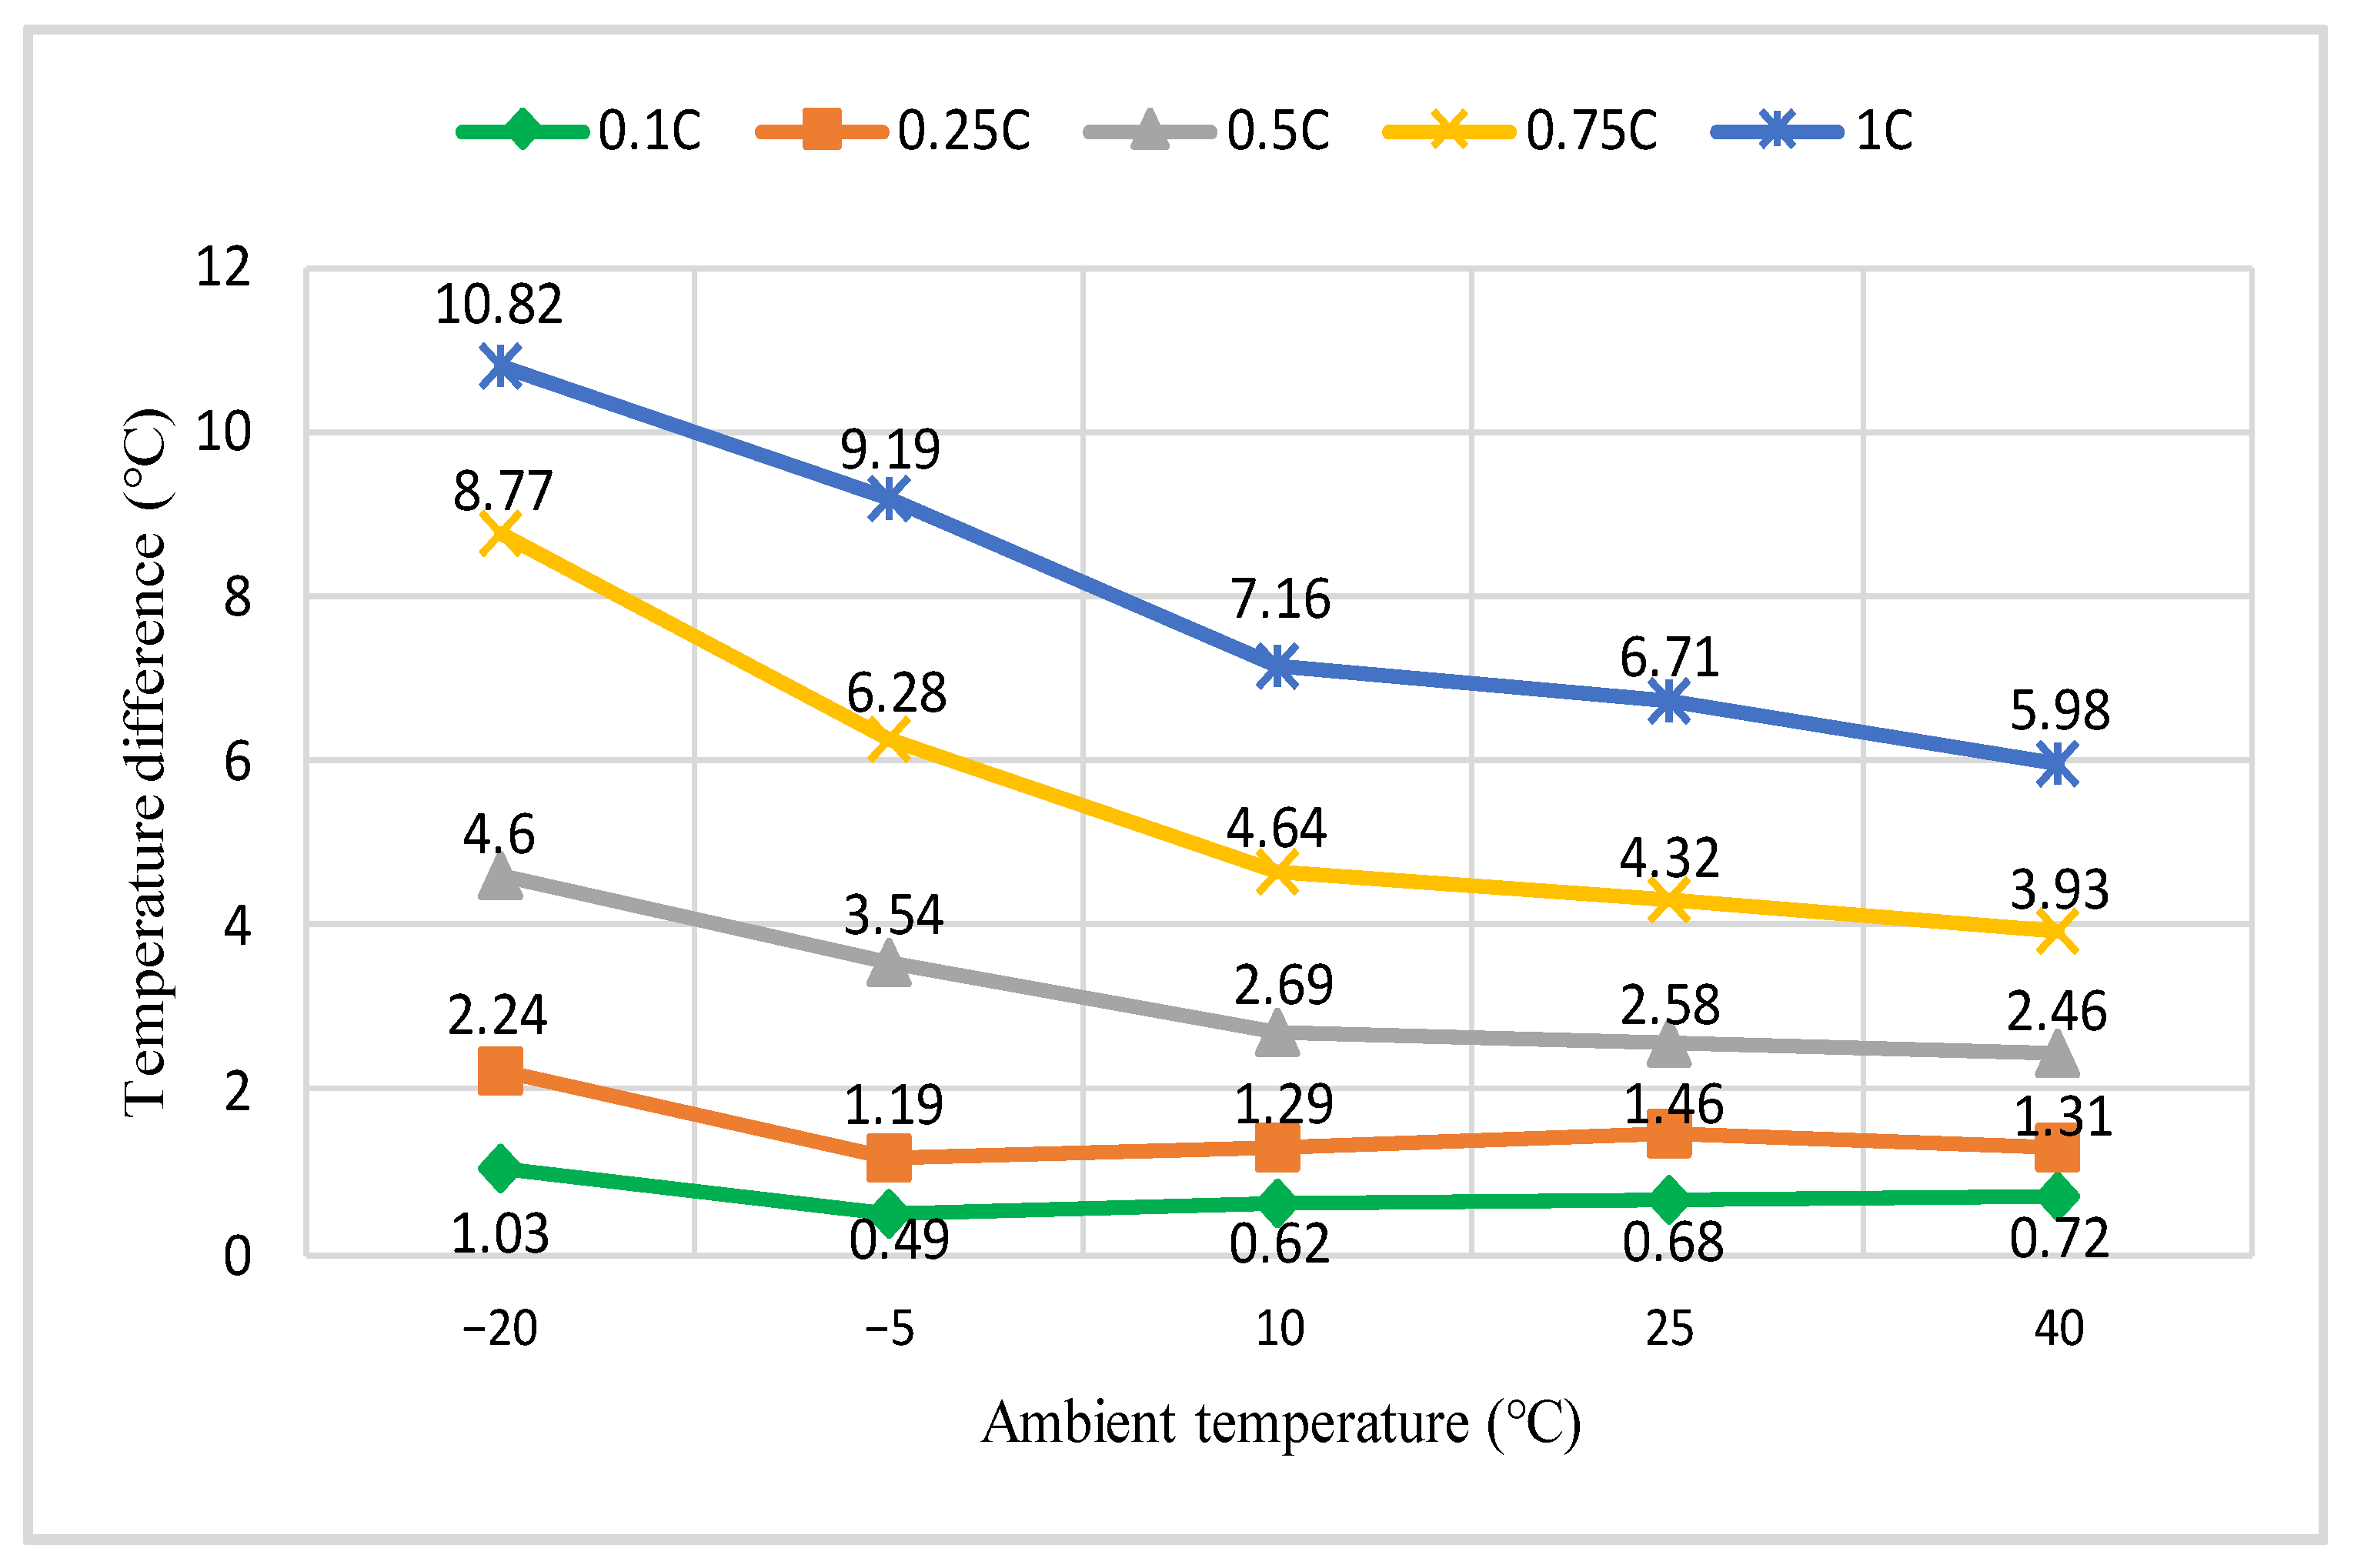
Figure 17 depicts the highest temperature difference of the battery surface during the charging process and demonstrates that in general, the higher the charging rate, the lower the ambient temperature, and thus the larger the temperature difference. The temperature difference of the battery surface is merely 0.49 °C under the condition of −5 °C and 0.1C; at −20 °C and 1C, the temperature differential is 10.82 °C, which is 22 times the minimal level. Since the diffusion and migration of lithium ions slow down at low temperatures and the electrolyte viscosity increases, the temperature rise of a lithium-ion battery is larger at low temperatures than at high temperatures. This is because the battery’s internal resistance rises as a result. Li-ion batteries produce heat at a rate that is proportional to their internal resistance while they are operating; therefore, an increase in internal resistance at low temperatures causes the battery to produce more heat and rise in temperature more quickly [38].
It is discovered that the temperature rising of the battery surface under each testing setting during the VPP is negligible and does not approach the maximum value. The temperature rise of the stage under the condition of −20 °C and 1C accounts for 45% of the peak variation in temperature, showing that the change in temperature during the VPP is reasonably constant and does not readily result in abnormal occurrences such as spontaneous combustion.

4.4. Charge Energy Comparison during the VPP

The stage charge energy of the VPP under various experimental settings is compared and analyzed in Table 3, and the accuracy of the fitting is assessed by computing the sample standard deviation of the actual outcome E t and the fitted outcome E f . Equations (6) and (7), respectively, are used to calculate E t and E f .
Δ E t = E t 2 E t 1  
Δ E f = t 1 t 2 U I d t  
The charge energy parameters at the beginning and end of the VPP from the testbed are represented in the formula by E t 1 and E t 2 , respectively.
It can be seen that the fitting accuracies are all higher than 99%. The fitting results have very little error, and the fitted equations indicate high confidence. The energy values at 25 °C and 40 °C at either current rate are almost the same. The stage charging energy of the VPP essentially declines with the reduction of test temperatures and the rise of the current rates. As the charging rate increases, the effect of low temperature on energy loss becomes more significant. The charging energy at −5 °C drops by 14.31% compared to that at a test temperature of 40 °C at the 0.1C rate and by 23.86% compared to that at a test temperature of 40 °C at the 1C rate.

5. Conclusions

Lithium-ion power batteries, which are the foundation of electric cars and are expected to play a significant role in a variety of operating environments and application situations, have significant development potential. This paper aims to investigate the charging cycle of a ternary Li-ion battery at various rates and test temperatures, examining the voltage plateau period for these operating states to be used as a guide when designing the battery’s modelling and control. Following an investigation of the features of the VPP under various operating settings for lithium batteries, the following results are drawn:
(1) The duration, capacity, and energy of the VPP decrease as the ambient temperature decreases and the current rate rises, which is congruent with the general pattern of the charging curve. The VPP essentially coincides at 25 °C and 40 °C based on an arbitrary current. When the indicators change visibly at a test temperature of −20 °C, the voltage plateau increases by 0.15 V to 0.4 V in comparison to other ambient temperatures. In order to minimize energy loss, batteries should not operate for an extended amount of time at extremely low temperatures as this has an adverse effect on their performance during the VPP.
(2) The voltage increases from 3.5–3.75 V, 3.55–3.8 V, 3.6–3.85 V, 3.7–4 V, and 3.85–4.05 V when charging through the current of 0.10C to 1.00C, respectively, at test temperatures of 10 °C, 25 °C, and 40 °C. At a temperature of −5 °C, the voltage increases from 3.53–3.74 V, 3.61–3.81 V, 3.74–3.89 V, 3.86–3.97 V, 3.99–4.06 V. The terminal voltage fluctuates gradually during these times, the rise in surface temperature does not reach its maximum, and the charging capacity exceeds 50%. While creating the working prototype and formulating the control approach, it can be seen that the battery operating margin is better at this point, which serves as a foundation for determining the optimal battery operating section.
(3) The charging capacity at the stage between the plateau cut-off voltage and the charging cut-off voltage when charging at 0.1C and 0.25C accounts for the highest percentage at −20 °C, while the capacity during the VPP just accounts for about 45%, demonstrating that the VPP’s performance at low temperature is not particularly impressive. The highest percentage of charging capacity, close to 70%, occurs in the initial period of the voltage rebound stage when charging at 0.50C, 0.75C and 1.00C.
In order to build a more precise physical model of the battery through parameter identification and provide comprehensive guidance for phased control strategies of electric vehicles such as small current activation and energy recovery processes, future research should include segmented fit analysis and multi-angle evaluation for three periods of voltage fluctuations of charging process simultaneously. Additionally, more research should be done in the future to examine how well Li-ion batteries perform in environments with extreme temperature ranges.

Author Contributions

Conceptualization and methodology, X.W.; software and validation, Y.Z. (Yujie Zhang) and S.L.; formal analysis, X.W. and Y.Z. (Yu Zhu); investigation, X.W. and F.Z.; resources, H.N. and Y.Z. (Yu Zhu); data curation, Y.Z. (Yujie Zhang); writing—original draft preparation, X.W. and Y.Z. (Yujie Zhang); writing—review and editing, Y.Z. (Yu Zhu) and Y.D.; visualization, X.W. and Y.Z. (Yujie Zhang); supervision, H.N. and Y.Y.; project administration, Y.D. and Y.Y.; funding acquisition, H.N. and Y.Y. All authors have read and agreed to the published version of the manuscript.

Funding

This research was funded by the National Natural Science Foundation of China, grant numbers 51905361 and 51876133; the Jiangsu Provincial Key Research and Development Program of China, grant number BE2021065; and A Project Funded by the Priority Academic Program Development of Jiangsu Higher Education Institutions (PAPD).

Institutional Review Board Statement

Not applicable.

Informed Consent Statement

Not applicable.

Data Availability Statement

Not applicable.

Acknowledgments

This research was funded by the National Natural Science Foundation of China, grant numbers 51905361 and 51876133, the Jiangsu Provincial Key Research and Development Program of China, grant number BE2021065, and A Project Funded by the Priority Academic Program Development of Jiangsu Higher Education Institutions (PAPD). The authors would like to thank the anonymous reviewers for their reviews and comments.

Conflicts of Interest

The authors declare no conflict of interest.

References

  1. Knez, M.; Zevnik, G.K.; Obrecht, M. A review of available chargers for electric vehicles: United States of America, European Union, and Asia. Renew. Sustain. Energy Rev. 2019, 109, 284–293. [Google Scholar] [CrossRef]
  2. Harper, G.; Sommerville, R.; Kendrick, E.; Driscoll, L.; Slater, P.; Stolkin, R.; Walton, A.; Christensen, P.; Heidrich, O.; Lambert, S.; et al. Recycling lithium-ion batteries from electric vehicles. Nature 2019, 575, 75–86. [Google Scholar] [CrossRef] [PubMed] [Green Version]
  3. Li, Z.H.; Khajepour, A.; Song, J.C. A comprehensive review of the key technologies for pure electric vehicles. Energy 2019, 182, 824–839. [Google Scholar] [CrossRef]
  4. Yang, Z.G.; Zhang, J.L.; Kintner-Meyer, M.C.W.; Lu, X.C.; Choi, D.; Lemmon, J.P.; Liu, J. Electrochemical energy storage for green grid. Chem. Rev. 2011, 111, 3577–3613. [Google Scholar] [CrossRef] [PubMed]
  5. Goodenough, J.B.; Kim, Y. Challenges for rechargeable Li batteries. Chem. Mater. 2010, 22, 587–603. [Google Scholar] [CrossRef]
  6. Liu, L.; Lin, C.J.; Fan, B.; Wang, F.; Lao, L.; Yang, P.X. A new method to determine the heating power of ternary cylindrical lithium ion batteries with highly repeatable thermal runaway test characteristics. J. Power Sources 2020, 472, 228503. [Google Scholar] [CrossRef]
  7. Iurilli, P.; Brivio, C.; Wood, V. On the use of electrochemical impedance spectroscopy to characterize and model the aging phenomena of lithium-ion batteries: A critical review. J. Power Sources 2021, 505, 229860. [Google Scholar] [CrossRef]
  8. Wang, X.X.; Liu, S.R.; Zhang, Y.J.; Lv, S.S.; Ni, H.J.; Deng, Y.L.; Yuan, Y.N. A review of the power battery thermal management system with different cooling, heating and coupling system. Energies 2022, 15, 1963. [Google Scholar] [CrossRef]
  9. Philippot, M.; Alvarez, G.; Ayerbe, E.; Van Mierlo, J.; Messagie, M. Eco-efficiency of a lithium-ion battery for electric vehicles: Influence of manufacturing country and commodity prices on GHG emissions and costs. Batteries 2019, 5, 23. [Google Scholar] [CrossRef] [Green Version]
  10. Ohzuku, T.; Brodd, R.J. An overview of positive-electrode materials for advanced lithium-ion batteries. J. Power Sources 2007, 174, 449–456. [Google Scholar] [CrossRef]
  11. Xiao, Z.L.; Liu, P.; Song, L.B.; Cao, Z.; Du, J.L.; Zhou, C.F.; Jiang, P. The correlation between structure and thermal properties of nickel-rich ternary cathode materials: A review. Ionics 2021, 27, 3207–3217. [Google Scholar] [CrossRef]
  12. Shao, Y.J.; Huang, B.; Liu, Q.B.; Liao, S.J. Preparation and modification of Ni-Co-Mn ternary cathode materials. Prog. Chem. 2018, 30, 410–419. [Google Scholar]
  13. Williard, N.; He, W.; Hendricks, C.; Pecht, M. Lessons learned from the 787 Dreamliner issue on lithium-ion battery reliability. Energies 2013, 6, 4682–4695. [Google Scholar] [CrossRef] [Green Version]
  14. Huang, H. Cycle life fading of LiFePO4 lithium-ion battery and its life prediction. Chin. J. Power Sources 2022, 46, 376–379. [Google Scholar]
  15. Chen, X.; Lv, S.S.; Pei, Y.; Chen, L.; Ni, H.J. Influence of temperature on the LiFePO4 power batteries’ discharge voltage values. New Chem. Mater. 2015, 43, 202–203. [Google Scholar]
  16. Ye, Y.; Saw, L.H.; Shi, Y.; Tay, A.A.O. Numerical analyses on optimizing a heat pipe thermal management system for lithium-ion batteries during fast charging. Appl. Therm. Eng. 2015, 86, 281–291. [Google Scholar] [CrossRef]
  17. An, Z.J.; Jia, L.; Ding, Y.; Dang, C.; Li, X.J. A review on lithium-ion power battery thermal management technologies and thermal safety. J. Therm. Sci. 2017, 26, 391–412. [Google Scholar] [CrossRef]
  18. Fleischhammer, M.; Waldmann, T.; Bisle, G.; Hogg, B.; Wohlfahrt-Mehrens, M. Interaction of cyclic ageing at high-rate and low temperatures and safety in lithium-ion batteries. J. Power Sources 2015, 274, 432–439. [Google Scholar] [CrossRef]
  19. Shi, X.; Wang, H.; Lv, H.; Zheng, L.; Chen, J.; Qi, L.; Wu, T.; Wang, C. The influence of cutoff charge-voltage on performance of lithium manganite/lithium titanate lithium-ion battery for power applications. Mater. Technol. 2016, 31, 642–645. [Google Scholar] [CrossRef]
  20. Wang, C.X. Study on Internal Thermal Strain Characteristics of Lithium Batteries at High C Rates under Low Temperature. Master’s Thesis, Civil Aviation Flight University of China, Guanghan, China, 2020. [Google Scholar]
  21. Liu, Z.W.; Liu, X.L.; Hao, H.; Zhao, F.Q.; Amer, A.A.; Babiker, H. Research on the critical issues for power battery reusing of new energy vehicles in China. Energies 2020, 13, 1932. [Google Scholar] [CrossRef] [Green Version]
  22. Gantenbein, S.; Schönleber, M.; Weiss, M.; Ivers-Tiffée, E. Capacity fade in lithium-ion batteries and cyclic aging over various state-of-charge ranges. Sustainability 2019, 11, 6697. [Google Scholar] [CrossRef] [Green Version]
  23. Situ, W.F.; Yang, X.Q.; Li, X.X.; Zhang, G.Q.; Rao, M.M.; Wei, C.; Huang, Z. Effect of high temperature environment on the performance of LiNi0.5Co0.2Mn0.3O2 battery. Int. J. Heat Mass Transf. 2017, 104, 743–748. [Google Scholar] [CrossRef]
  24. Bloom, I.; Walker, L.K.; Basco, J.K.; Abraham, D.P.; Christophersen, J.P.; Ho, C.D. Differential voltage analyses of high-power lithium-ion cells. 4. Cells containing NMC. J. Power Sources 2010, 195, 877–882. [Google Scholar] [CrossRef]
  25. Jia, X.L. The Study on Estimation Method about the Capacity of Power Lithium-Ion Battery. Master’s Thesis, Shenzhen Graduate School, Harbin Institute of Technology, Shenzhen, China, 2016. [Google Scholar]
  26. Zhang, Y.P.; Wu, L.L.; Zhao, J.B.; Yu, W.Y. A facile precursor-separated method to synthesize nano-crystalline LiFePO4/C cathode materials. J. Electroanal. Chem. 2014, 719, 1–6. [Google Scholar] [CrossRef]
  27. Li, C.L.; Cui, N.X.; Wang, C.Y.; Zhang, C.H. Simplified electrochemical lithium-ion battery model with variable solid-phase diffusion and parameter identification over wide temperature range. J. Power Sources 2021, 497, 229900. [Google Scholar] [CrossRef]
  28. Ma, S.; Jiang, M.D.; Tao, P.; Song, C.Y.; Wu, J.B.; Wang, J.; Deng, T.; Shang, W. Temperature effect and thermal impact in lithium-ion batteries: A review. Prog. Nat. Sci. Mater. Int. 2018, 28, 653–666. [Google Scholar] [CrossRef]
  29. Jiang, C.; Wang, S.L.; Wu, B.; Fernandez, C.; Xiong, X.; Coffie-Ken, J. A state-of-charge estimation method of the power lithium-ion battery in complex conditions based on adaptive square root extended Kalman filter. Energy 2021, 219, 119603. [Google Scholar] [CrossRef]
  30. Wang, S.L.; Stroe, D.; Fernandez, C.; Yu, C.M.; Zou, C.Y.; Li, X.X. A novel energy management strategy for the ternary lithium batteries based on the dynamic equivalent circuit modeling and differential Kalman filtering under time-varying conditions. J. Power Sources 2020, 450, 227652. [Google Scholar] [CrossRef]
  31. Liu, X. Test Bench Establishing and Nonlinear Modeling of Lithium-Ion Battery and Supercapacitor. Master’s Thesis, Wuhan University of Technology, Wuhan, China, 2019. [Google Scholar]
  32. Li, B.; Xia, D.G. Anionic redox in rechargeable lithium batteries. Adv. Mater. 2017, 29, 1701054. [Google Scholar] [CrossRef]
  33. Waldmann, T.; Hogg, B.I.; Wohlfahrt-Mehrens, M. Li plating as unwanted side reaction in commercial Li-ion cells—A review. J. Power Sources 2018, 384, 107–124. [Google Scholar] [CrossRef]
  34. Linden, D.; Reddy, T.B. Handbook of Batteries, 3rd ed.; McGraw-Hill: New York, NY, USA, 2007. [Google Scholar]
  35. Lux, S.F.; Schmuck, M.; Appetecchi, G.B.; Passerini, S.; Winter, M.; Balducci, A. Lithium insertion in graphite from ternary ionic liquid–lithium salt electrolytes: II. Evaluation of specific capacity and cycling efficiency and stability at room temperature. J. Power Sources 2009, 192, 606–611. [Google Scholar] [CrossRef]
  36. Gholami, J.; Barzoki, M.F. Electrochemical modeling and parameter sensitivity of lithium-ion battery at low temperature. J. Energy Storage 2021, 43, 103189. [Google Scholar] [CrossRef]
  37. Wang, X.X.; Zhang, Y.J.; Ni, H.J.; Lv, S.S.; Zhang, F.B.; Zhu, Y.; Yuan, Y.N.; Deng, Y.L. Influence of different ambient temperatures on the discharge performance of square ternary lithium-ion batteries. Energies 2022, 15, 5348. [Google Scholar] [CrossRef]
  38. Lei, Z.G.; Zhang, Y.W.; Lei, X.G. Temperature uniformity of a heated lithium-ion battery cell in cold climate. Appl. Therm. Eng. 2018, 129, 148–154. [Google Scholar] [CrossRef]
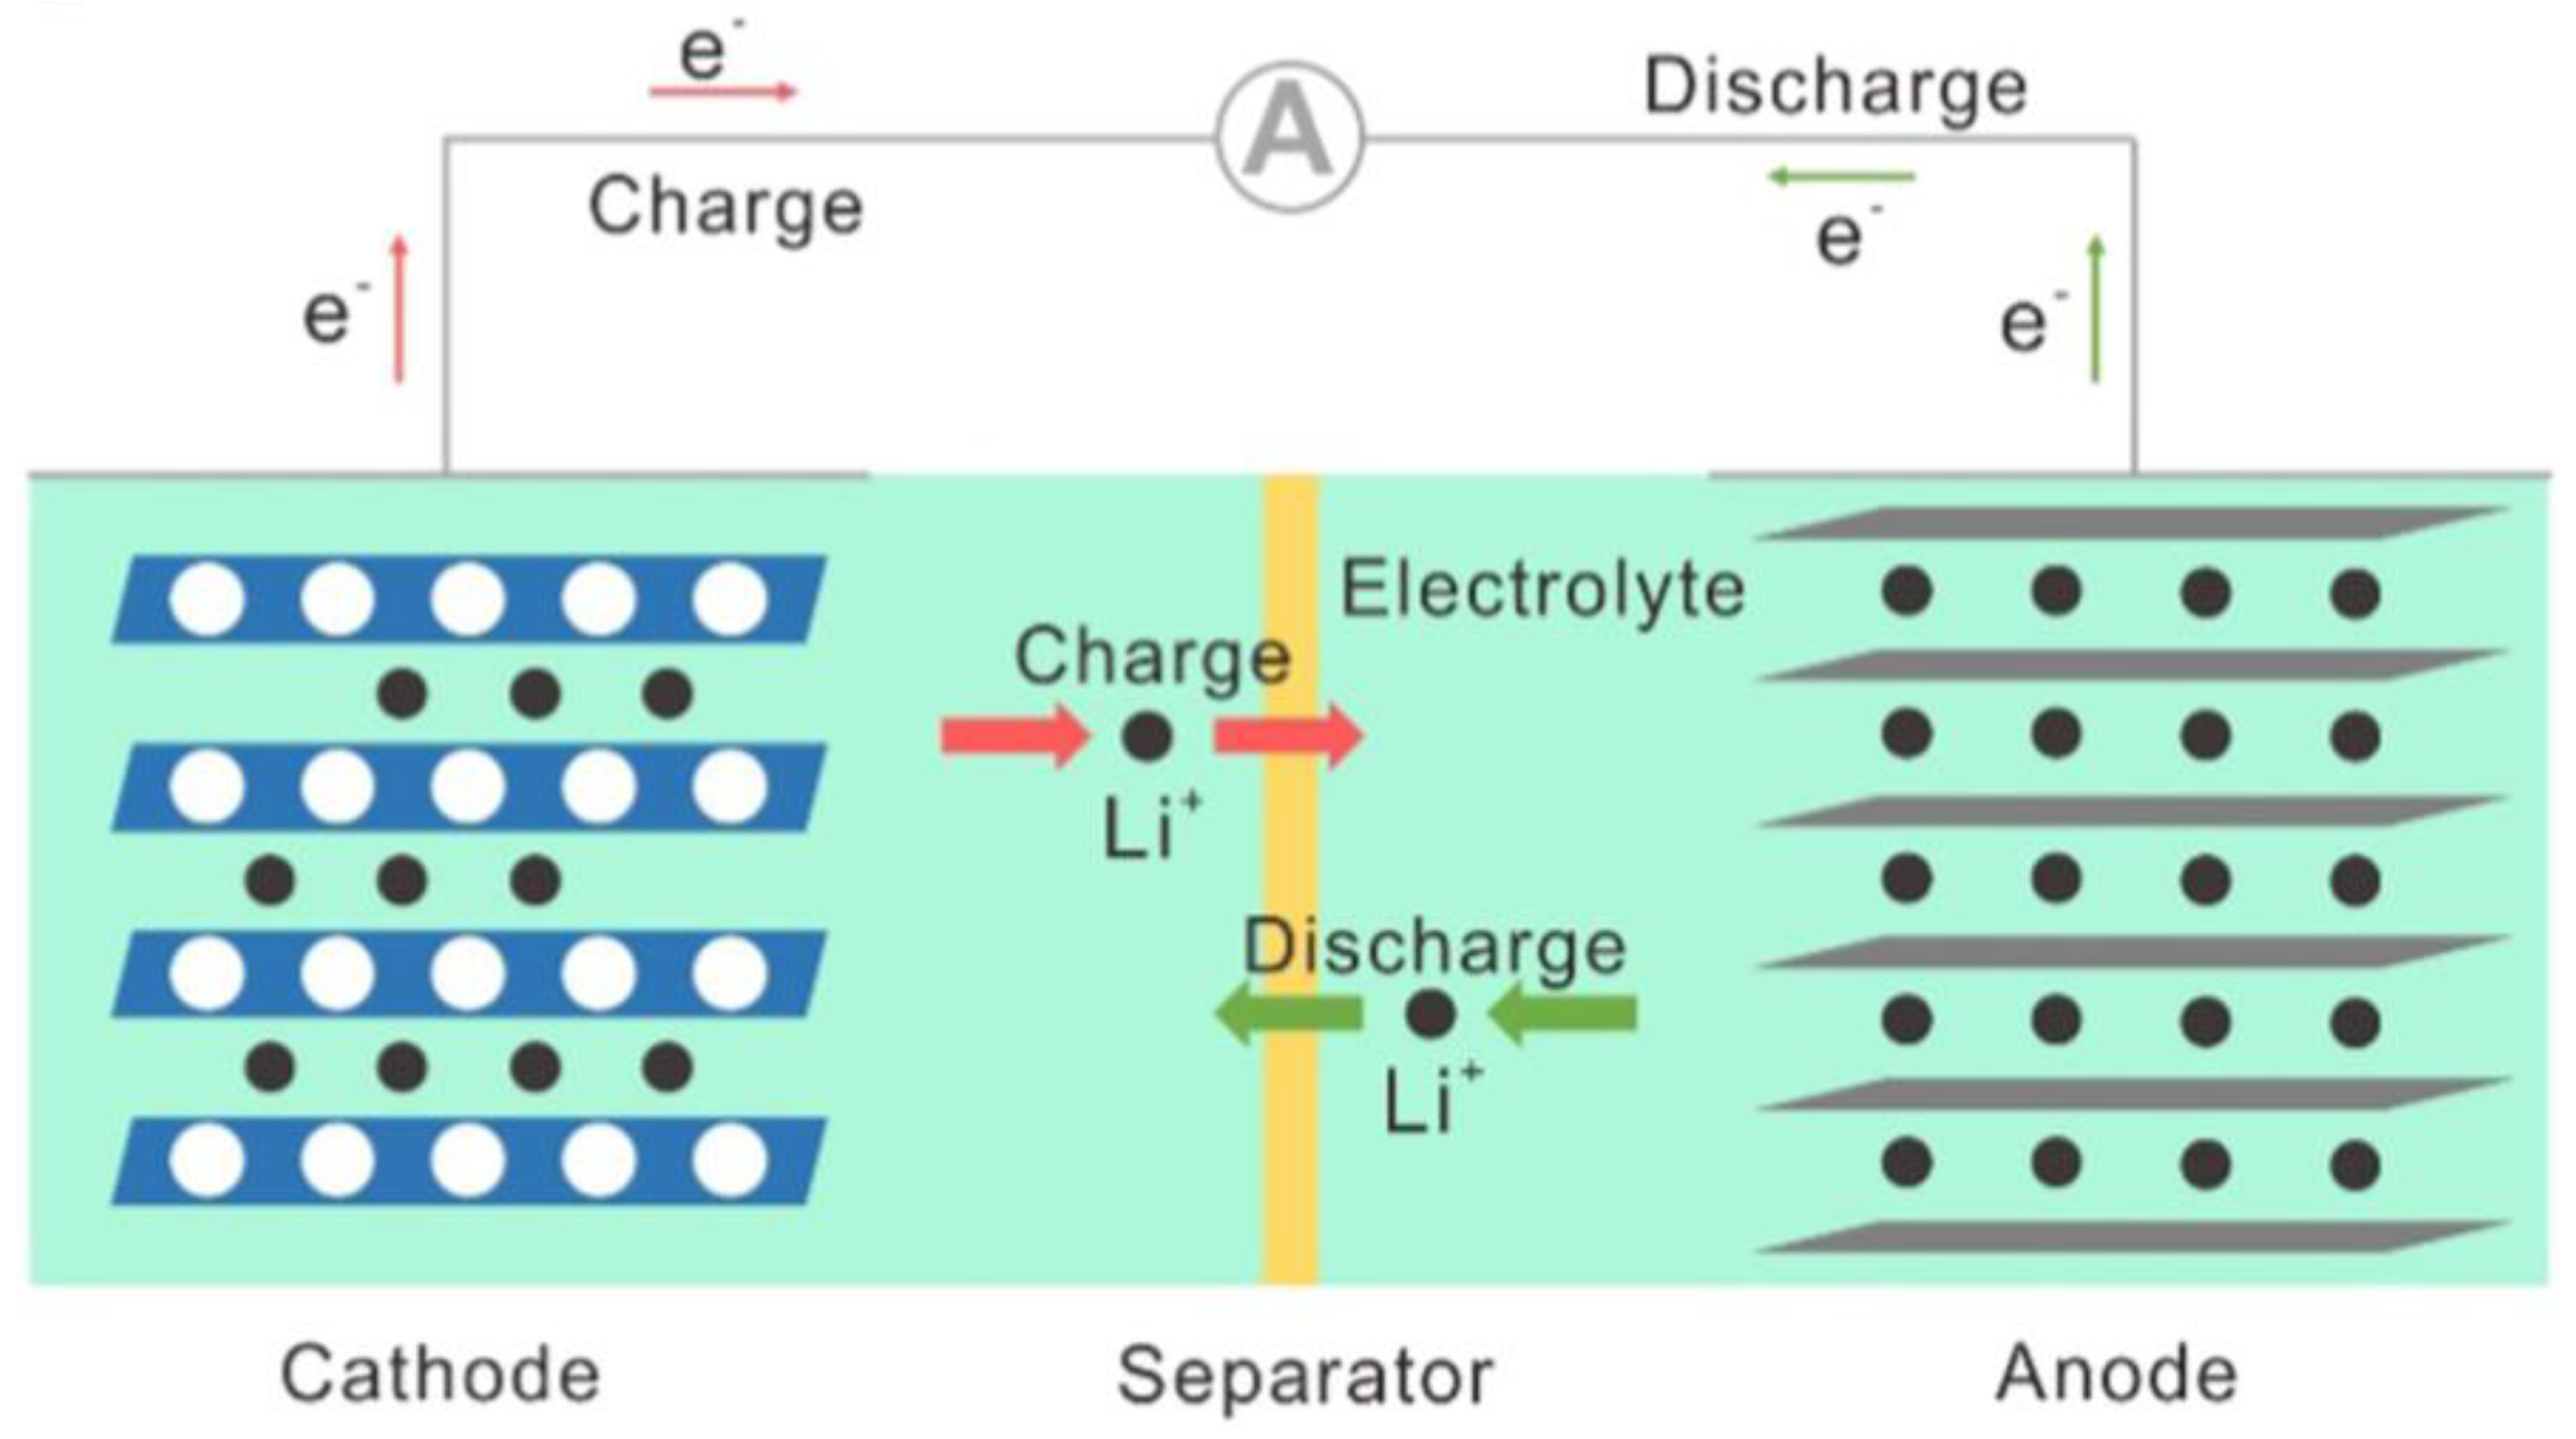
Figure 1. Lithium-ion battery working principle diagram [28].
Batteries 09 00042 g001
Figure 2. The test process.
Batteries 09 00042 g002
Figure 3. Experimental platform.
Batteries 09 00042 g003
Figure 4. Charge voltage change curve: (a) 0.10C charge rate; (b) 0.25C charge rate; (c) 0.50C charge rate; (d) 0.75C charge rate; (e) 1.00C charge rate.
Batteries 09 00042 g004
Figure 5. The battery surface’s temperature fluctuation pattern while charging: (a) 0.10C charge rate; (b) 0.25C charge rate; (c) 0.50C charge rate; (d) 0.75C charge rate; (e) 1.00C charge rate.
Batteries 09 00042 g005aBatteries 09 00042 g005b
Figure 6. Charge capacity comparison chart.
Batteries 09 00042 g006
Figure 7. Effect of various temperatures on the VPP at 0.10C charging.
Batteries 09 00042 g007
Figure 8. The voltage fluctuation intervals during the VPP with 0.10C charging.
Batteries 09 00042 g008
Figure 9. Effect of various temperatures on the VPP at 0.25C charging.
Batteries 09 00042 g009
Figure 10. The voltage fluctuation intervals during the VPP with 0.25C charging.
Batteries 09 00042 g010
Figure 11. Effect of various temperatures on the VPP at 0.50C charging.
Batteries 09 00042 g011
Figure 12. The voltage fluctuation intervals during the VPP with 0.50C charging.
Batteries 09 00042 g012
Figure 13. Effect of various temperatures on the VPP at 0.75C charging.
Batteries 09 00042 g013
Figure 14. The voltage fluctuation intervals during the VPP with 0.75C charging.
Batteries 09 00042 g014
Figure 15. Effect of various temperatures on the VPP at 1.00C charging.
Batteries 09 00042 g015
Figure 16. The voltage fluctuation intervals during the VPP with 1.00C charging.
Batteries 09 00042 g016
Figure 17. Analysis of the highest temperature variation of the battery’s surface.
Batteries 09 00042 g017
Table 1. Performance comparison of a LiFePO4 battery and an NCM ternary Li-ion battery.
TypeSpecific EnergyPlatform VoltageAdvantagesDisadvantages
LiFePO4 battery120–180 Wh kg−13.2 VHigh temperature resistance, low cost, impact resistancePoor consistency, poor low temperature performance
NCM ternary Li-ion battery200–300 Wh kg−13.7 VHigh specific energy, low temperature resistance, good discharge linearityPoor thermal stability
Table 2. Technical parameters of Li-ion batteries.
PerformanceUnitParameter
Nominal voltageV3.65
Working voltageV2.75–4.2
Rated capacityAh40
Standard internal resistance0.7
Specific energyWh kg−1206
Sizemm148 × 91 × 27
Weightkg0.7
Table 3. Charge energy comparison during the VPP.
Charge RateAmbient
Temperature
(°C)
E t   ( Wh ) E f   ( Wh ) σ (Wh)Fitting
Accuracy (%)
0.1C4074.3274.400.056699.8925
2573.2973.320.021299.9591
1070.4170.440.021299.9574
−563.6963.750.042499.9059
−2053.1553.200.035499.9060
0.25C4073.7373.680.035499.9321
2573.2073.180.014199.9727
1066.4166.370.028399.9397
−563.3463.250.063699.8577
−2044.3444.390.035499.8874
0.5C4070.9871.030.035499.9296
2569.6269.640.014199.9713
1061.6061.560.028399.9350
−558.5758.590.014199.9659
−2063.0563.060.007199.9841
0.75C4066.2166.180.021299.9547
2565.3265.340.014199.9694
1064.1664.220.042499.9066
−554.8854.910.021299.9454
−2061.1861.240.042499.9020
1C4063.6163.620.007199.9843
2561.0961.050.028399.9345
1063.6263.650.021299.9529
−548.4348.370.042499.8760
−2057.4457.210.162699.5980
Disclaimer/Publisher’s Note: The statements, opinions and data contained in all publications are solely those of the individual author(s) and contributor(s) and not of MDPI and/or the editor(s). MDPI and/or the editor(s) disclaim responsibility for any injury to people or property resulting from any ideas, methods, instructions or products referred to in the content.