Article

Parameter Identification Method for a Fractional-Order Model of Lithium-Ion Batteries Considering Electrolyte-Phase Diffusion

1
School of Automation, Beijing Institute of Technology, Beijing 100081, China
2
Tangshan Research Institute, Beijing Institute of Technology, Tangshan 063611, China
3
Department of Automation, Tsinghua University, Beijing 100084, China
4
State Key Laboratory of Automotive Safety and Energy, Tsinghua University, Beijing 100084, China
*
Author to whom correspondence should be addressed.
Batteries 2022, 8(8), 90; https://doi.org/10.3390/batteries8080090
Submission received: 5 July 2022 / Revised: 7 August 2022 / Accepted: 9 August 2022 / Published: 14 August 2022
(This article belongs to the Section Battery Modelling, Simulation, Management and Application)

Abstract

:
The physics-based fractional-order model (FOM) for lithium-ion batteries has shown good application prospects due to its mechanisms and simplicity. To adapt the model to higher-level applications, this paper proposes an improved FOM considering electrolyte-phase diffusion (FOMe) and then proposes a complete method for parameter identification based on three characteristic SOC intervals: the positive solid phase, negative solid phase, and electrolyte phase. The method mainly determines the above three characteristic intervals and identifies four thermodynamic parameters and five dynamic parameters. Furthermore, the paper describes a framework, which first verifies the model and parameter identification method separately based on pseudo two-dimensional model simulations, and secondly verifies FOMe and its parameters as a whole based on the experiments. The results, which are based on simulations and actual L i 0 . 8 C o 0 . 1 M n 0 . 1 O 2 lithium-ion batteries under multiple typical operating profiles and comparisons with other parameter identification methods, show that the proposed model and parameter identification method is highly accurate and efficient.

1. Introduction

The electrochemical lithium-ion battery (LiB) model has been widely utilized in LiB research, such as for parameter identification and aging mechanism research [1,2,3,4]. The electrochemical model has a more precise physical meaning than the equivalent circuit model (ECM) [5,6]. The parameters of the electrochemical model can reflect the inner electrochemical status of an LiB, which is more suitable for many applications, such as battery status monitoring. The commonly employed electrochemical models include the pseudo two-dimensional (P2D) model [7] and single-particle model [8]. However, these models require solving partial differential equation systems, which are computationally inefficient, have too many parameters and are not easily identifiable. There are many papers that propose reduced-order methods for these models. The main dynamics affecting the voltage in a cell are solid-phase diffusion (SPD) and electrolyte-phase diffusion (EPD). For SPD, the methods for simplification are polynomial approximation [9], Pade approximation [10], etc. In particular, the fractional-order Pade approximation employed in the fractional-order model (FOM) proposed by Guo [
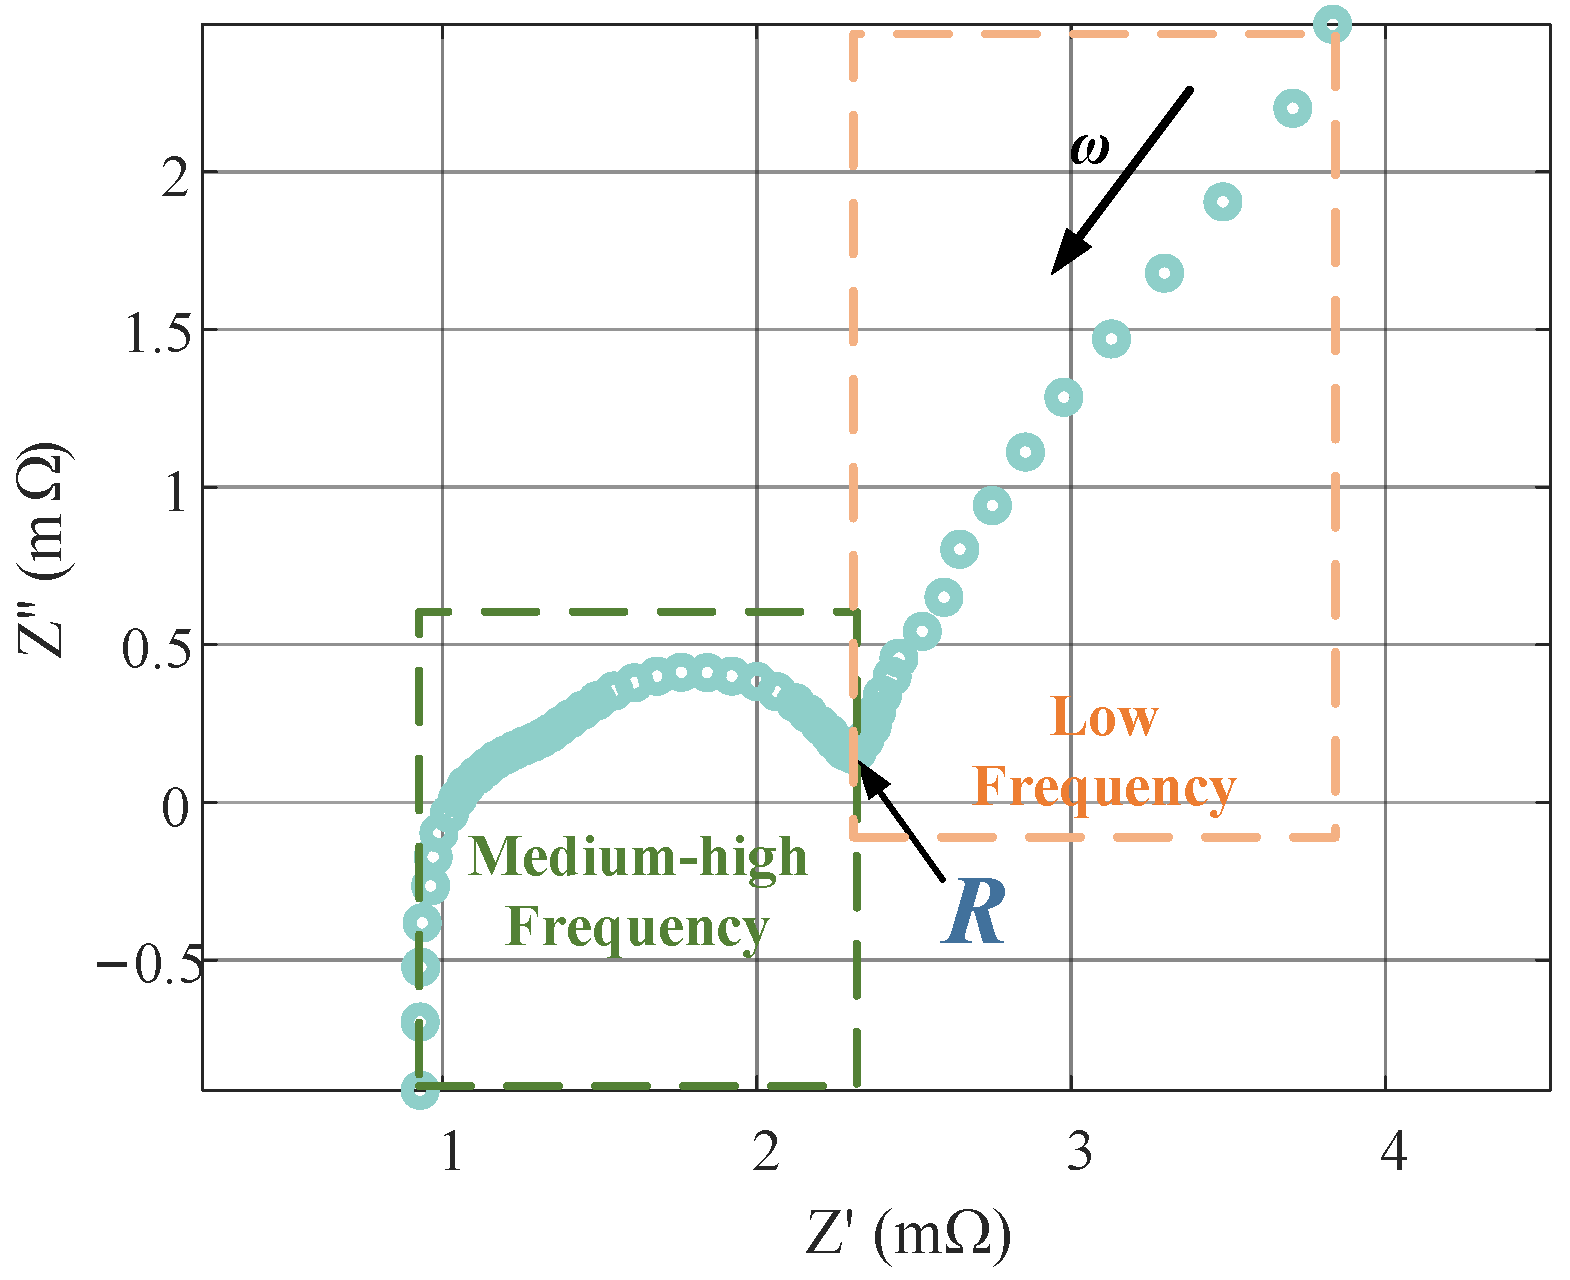
11] is more consistent with the fractional-order characteristics exhibited in the electrochemical impedance spectrum (EIS), resulting in higher accuracy and practicality. However, the FOM treats EPD as a medium-high frequency dynamic and models as a lumping model, which limits the accuracy of the model at a higher current rate. It has been noted that EPD tends to be a low-frequency dynamic for certain cells, and its frequency may be lower than that of SPD [12,13,14,15]. Refs. [16,17] revealed that the aging-induced increase in the diffusion impedance of LiB is mainly caused by the aging of EPD. Therefore, it is necessary to add EPD modeling to the FOM. Commonly utilized electrolyte-phase modeling methods include polynomial approximation [15], equilibrium point polynomial approximation [13], and Pade approximation [18]. The EPD model derived by the polynomial approximation method is a first-order inertial component with only two parameters, which is more accessible for application. We combine the FOM with the EPD of the polynomial approximation method to propose a fractional-order model FOMe considering EPD.
The electrochemical model requires an accompanying parameter identification method. Accurate parameter identification is the key to monitoring the battery’s aging and safety status and to enabling the model to better fit a real battery. Considering the usage scenario of batteries, the method based on the input–output data of the battery in the time domain shows a higher application value than the method that requires disassembly [19] or the method that uses the EIS [20]. However, parameter identification using only input–output data is also challenging due to the nonlinear characteristics of the cell, low sensitivity of the parameters, and unmodeled dynamics. Refs. [12,21] observed the difference in the dynamic frequency bands characterized by different parameters, which led to a parameter identification method that uses frequency segmentation. Therefore, thermodynamic parameters, low-frequency diffusion parameters, and mid-frequency parameters in electrochemical models can be separately identified under different excitations of different frequencies. In particular, the thermodynamic parameters can be identified with small rate constant current discharging [22], and the ohmic internal resistance can be measured using the HPPC profile [23]. However, this method does not adequately address the dynamics of similar frequencies, such as SPD and EPD. Some analytical methods for diffusion coefficient determination have been reported in the literature. For example, constant potential titration (GITT) is a classical method for solid-phase diffusion coefficient determination. However, analytical methods often suffer from a lack of accuracy due to the introduction of too many assumptions [24]. Most studies treat the identification of diffusion parameters as an optimization problem [20]:
arg min P ^ U exp U MDL 2 2 s . t . U MDL = f MDL I exp , P ^ , S O C 0
where I exp is the current profile sequence, U exp is the actual battery output voltage sequence under excitation, U MDL is the output voltage sequence of the battery model, and P ^ is the parameter to be identified. S O C 0 is the state of charge (SOC) at the initial moment of the experiment. When the rate of I exp is low and the duration is short, the range of the battery SOC changes throughout the experiment is small. Thus, S O C 0 can also be considered the operating point for parameter identification.
Equation (1) shows that three main factors affect the accuracy of parameter identification: excitation current I exp , operating point S O C 0 , and optimization method. Typical optimization algorithms include metaheuristic approaches, such as PSO [9,25], genetic algorithms [26,27], and neural network methods [28,29]. The difference in optimization methods usually only affects whether the optimization solution will fall into a local optimum and the speed of convergence [30]. I exp and S O C 0 mainly affect the accuracy of the parameter identification by influencing the sensitivity of the parameters and are the essential objects that need to be designed. The influence of I exp on the parameter sensitivity is mainly reflected in the frequency spectrum of the excitation current [31]. For example, a low-band abundant excitation should be used to identify low-frequency parameters. The influence of the operating point on the sensitivity of the parameter is mainly reflected in the slope of the positive and negative open-circuit potential (OCP): at some operating points, the slope of the positive OCP curve is more significant, while the slope of the negative OCP curve is slight. In such a case, the change in the battery terminal voltage is mainly caused by the positive solid-phase overpotential. These operating points can be regarded as the positive characteristic SOC interval. Similarly, the negative characteristic interval can also be defined. Refs. [30,32] use data on a single operating point (or narrow operating SOC segments) to identify all parameters, while certain parameters are not sensitive in these SOC intervals. Although some studies [13,33] concluded via sensitivity analysis that positive solid-phase parameters are more sensitive in higher SOC intervals and that negative solid-phase parameters are more sensitive in lower SOC intervals, no specific method for determining the SOC intervals of positive and negative characteristics was given. We aim to address this research gap. On the other hand, it is recommended in this paper that three operating points are used instead of only the positive and negative characteristic intervals to identify the three diffusion parameters, because three different diffusion dynamics (positive SPD, negative SPD, and EPD) are included in FOMe. In addition, some papers [34,35,36] use a very wide working region, an SOC interval of almost 0%–100%, for parameter identification, which leads to too many data and very low efficiency of parameter identification. The calculation required can be significantly reduced by reasonably selecting the SOC operating points for parameter identification.
FOMe and the parameter identification methods cannot be separately verified using only physical experiments because the true parameter values of an actual battery are unknown. For this reason, we propose a two-step validation method based on simulation and experiments. FOMe and the parameter identification methods are separately verified using a P2D model with high accuracy, and then FOMe and the parameter identification methods are simultaneously verified by experiments.
The contributions of the study are summarized as follows:
  • A fractional-order model considering EPD is proposed by combining the fractional-order model of SPD introduced by Guo with the polynomial approximation model of EPD.
  • A parameter identification method based on the SOC intervals of positive and negative solid- and electrolyte-phase characteristics is proposed.
  • A verification framework that combines simulation and experiments is proposed to verify the model’s accuracy and parameter identification methods.
This paper is organized as follows: Section 2 describes the establishment of FOMe, and Section 3 presents the parameter identification method of FOMe. Section 4 designs the parameter identification process with a commercial L i 0 . 8 C o 0 . 1 M n 0 . 1 O 2 (NCM) lithium-ion battery and then analyzes FOMe and its parameter identification process. Section 5 presents the conclusion.

2. Model Improvement

2.1. Electrode Reaction Averaging Assumption

FOMe can be considered a simplified form of P2D. The P2D model treats each electrode as numerous spherical particles with the same radius, as shown in Figure 1. The components in this model are distributed only along the radial direction r of the spherical particles and the cell thickness direction x. Five coupled partial differential equations or algebraic equations in the rigorous P2D model describe the solid- and electrolyte-phase concentration distribution, the solid- and electrolyte-phase potential distribution, and the charge transfer process. Their mathematical forms are detailed in Ref. [15].
The partial differential equations for the solid-phase concentration and electrolyte-phase concentration are coupled by the local volumetric transfer current density j f in P2D, rendering the simplification complex. An assumption needs to be introduced for separately modeling the solid-phase and electrolyte-phase processes of an LiB: j f is constant and equal to its average value in each electrode, which is also widely accepted in the SPM and some extended single-particle models [12]:
j f , p = I A δ p j f , n = I A δ n
The meaning of the parameters and variables of the P2D model is shown in Table A1.

2.2. Solid-Phase Diffusion

Selecting the positive electrode as an example, according to Fick’s law, the solid-phase diffusion process is expressed as follows:
c s , p ( r , t ) t D s , p r 2 r r 2 c s , p ( x , r , t ) r = 0 s . t . c s , p ( t , r ) t = 0 = c s , 0 D s , p c s , p ( r , t ) r r = 0 = 0 D s , p c s , p ( r , t ) r r = R s , p = j f , p ( x , t ) a s , p F
The terminal voltage of the cell depends on the ratio of the lithium-ion concentration on the particle surface c s , p surf to the maximum lithium-ion concentration, i.e., c s , p R s , p , t c s , p R s , p , t c s , p max c s , p max , which is noted as S O C p surf , indicating the positive surface state of charge.
According to Equations (2) and (3), the transfer function of S O C p surf versus current can be written as [10],
S O C p surf s I s = R s , p 2 3 A δ p ε s , p F D s , p c s , p max sinh s D s , p R s , p s D s , p R s , p cosh s D s , p R s , p sinh s D s , p R s , p
Selecting the coupling relationship of the parameters in Equation (4), note that
Q p = 1 3600 A δ p ε s , p F c s , p max τ p = R s , p 2 D s , p
where Q p is the capacity of a positive electrode, whose dimension is Ah, and τ p is the SPD time constant of the positive electrode, whose dimension is in seconds. S O C p surf can be divided into two parts: S O C p mean , the average SOC of the electrode, and S O C p diff , the difference in the SOC between the surface and the average due to the diffusion of lithium ions along the r axis. S O C p mean can be calculated using Coulomb counting,
S O C p mean t = S O C p 0 1 Q p 0 t I d t
where S O C p 0 is the initial SOC of the electrode. Equation (6) can be transformed into the complex domain,
S O C p mean s I s = 1 Q p s
Therefore, S O C p diff is expressed as follows:
S O C p diff s I s = S O C p surf s S O C p mean s I s = τ p 1200 Q p sinh τ p s τ p s cosh τ p s sinh τ p s 3 τ p s
H p s can be introduced to analyze the key dynamic of Equation (8),
H p s = sinh τ p s τ p s cosh τ p s sinh τ p s 3 τ p s
The obtained H p s contains transcendental functions that cannot be directly employed. Many simplification methods have been presented. However, the phase of H p s is close to −45 at high frequencies, which cannot be described by any integer-order polynomial. Therefore, the fractional-order Pade approximation method proposed by Guo [11] is adopted. A fractional-order transfer function H p , app s has been designed to approximate H p s based on the Bode plot,
H p , app s = 19 95 + 12 τ p s
Next, S O C p mean and S O C p diff can be calculated using Equations (7) and (10) and summed to obtain S O C p surf . The positive solid-phase equilibrium potential can be obtained by querying the OCP table, i.e., E p - S O C p surf table.

2.3. Electrolyte-Phase Diffusion

The electrolyte concentration c e in P2D is expressed as follows:
t ε e , i c e ( x , t ) = x D e eff x c e ( x , t ) + 1 t + j f ( x , t ) F
The initial condition is
c e ( x , t ) t = 0 = c e , 0
The boundary conditions are
c e ( x , t ) x = δ n = c e ( x , t ) x = δ n + , c e ( x , t ) x = δ n + δ sep = c e ( x , t ) x = δ n + δ sep + x c e ( x , t ) x = 0 = 0 , x c e ( x , t ) x = L = 0 D e , n eff x c e ( x , t ) x = δ n = D e , sep eff x c e ( x , t ) x = δ n + D e , sep eff x c e ( x , t ) x = δ n + δ sep = D e , p eff x c e ( x , t ) x = δ n + δ sep +
For simplification, the electrolyte concentration distribution profiles are approximated as polynomials within the negative electrode, separator, and positive electrode. c e is
c e x , t = a 1 + b 1 x + c 1 x 2 + c e , 0 , x 0 , δ n a 2 + b 2 x + c e , 0 , x δ n , L δ p a 3 + b 3 L x + c 3 L x 2 + c e , 0 , x L δ p , L
The electrolyte concentration overpotential is only influenced by the electrolyte concentration of the two electrode/current–collector interfaces, where x is 0 and L. There are eight undetermined time-variant coefficients in Equation (14). By substituting Equation (14) into the six boundary conditions given in Equation (13), the eight coefficients can be reduced to two coefficients. Next, by substituting the result into Equation (11), the electrolyte concentration where x is 0 and L can be derived as
c ˙ e 0 , t c ˙ e L , t = A 1 A 1 γ A 1 γ A 1 c e 0 , t c e , 0 c e L , t c e , 0 + B 1 γ B 1 I t
where
A 1 = D e ε e , sep 1.5 δ n ε e , n 1 1 ε e , sep 1.5 2 ε e , n 1.5 δ n + 1 ε e , sep 1.5 2 ε e , p 1.5 δ p L B 1 = 1 t + A F δ n ε e , n γ = δ n ε e , n δ p ε e , p
Next, according to the P2D model, the electrolyte concentration overpotential between the positive current collector and the negative current collector, denoted as Δ ϕ e , is [12],
Δ ϕ e t = 1 t + 1 + β 2 R g T F ln c e L , t c e 0 , t
Further simplification, the first-order Taylor expansion can be applied to Equation (17),
Δ ϕ e t 1 t + 1 + β 2 R g T F c e , 0 c e L , t c e 0 , t
Substituting Equation (15) into Equation (18), a simplified electrolyte-phase concentration overpotential model can be derived as
Δ ϕ e s I s = K e T e s + 1
where
T e = δ p 2 ε e , p 1.5 + δ n 2 ε e , n 1.5 + δ sep ε e , sep 1.5 D e 1 δ p ε e , p + 1 δ n ε e , n K e = 2 R g T F 2 1 A D e c e , 0 1 t + 2 1 + β δ p 2 ε e , p 1.5 + δ n 2 ε e , n 1.5 + δ sep ε e , sep 1.5
The simplified electrolyte-phase model is a first-order inertial element with only two parameters, where T e denotes the EPD time constant and K e represents the electrolyte-phase gain. T e is only fixed by geometric parameters and the electrolyte-phase diffusion coefficient D e . The dimension of T e is in seconds, which is the same as τ p and τ n . K e is related to several parameters, and its dimension is Ohm.

2.4. Overall Block Diagram of FOMe

In addition to SPD and EPD, the dynamics in a cell include ohmic polarization, double-layer capacitance, SEI film diffusion, and charge transfer [11]. SPD and EPD often appear as low-frequency dynamics [12,15], while medium-high frequency dynamics are expressed as a semiellipse in the EIS [37]. It is challenging to separately model and identify each dynamic, so in this paper, only the identification of the low-frequency battery dynamics is investigated. The medium-high frequency dynamics can be approximated as an equivalent resistance R, as shown in Figure 2.
The overall FOMe can be obtained by combining the FOM, electrolyte-phase model, and equivalent resistance, as shown in Figure 3. The output voltage of FOMe is the sum of the equilibrium potential of the solid phase, electrolyte-phase overpotential, and medium-high frequency polarization potential,
U = E p E n + ρ Δ ϕ e + I R
where ρ is a correction factor with an approximate value of 0.7 at a low current rate [38]. Han pointed out that the position error of the particle can be compensated for by introducing this correction factor, leading to a more precise approximation to the P2D model [38].

3. Parameter Identification Method of FOMe

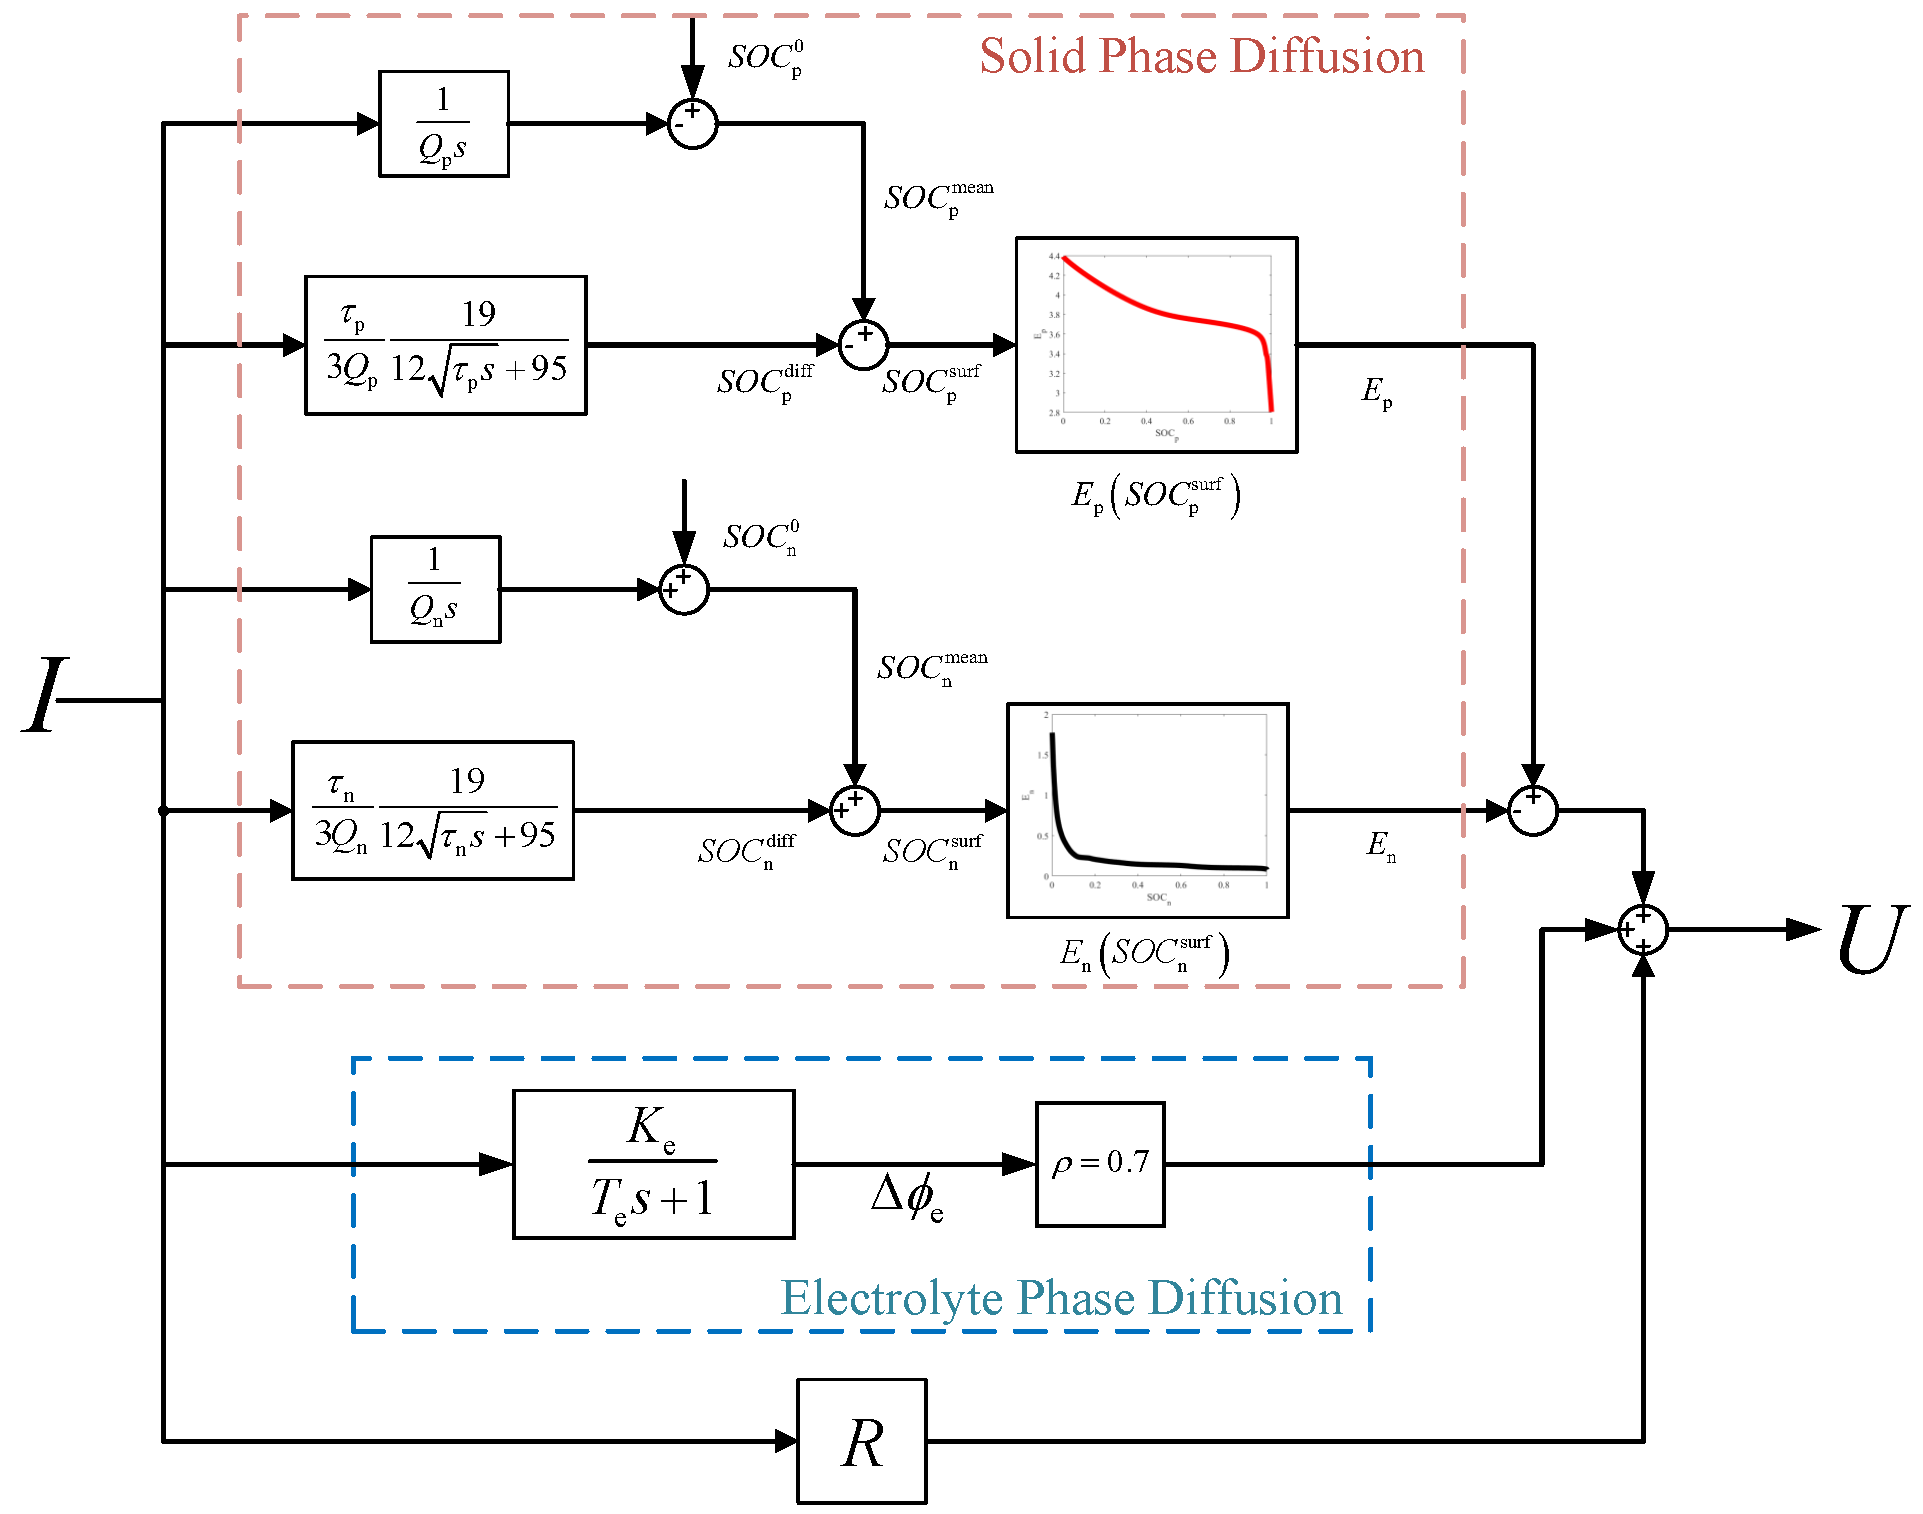
The FOMe includes nine parameters to be identified: Q p , Q n , S O C p 0 , S O C n 0 , τ p , τ n , T e , K e , and R. These parameters can be divided into three groups according to the time scale of the dynamics that they describe: thermodynamic parameters, including Q p , Q n , S O C p 0 , and S O C n 0 ; low-frequency dynamics parameters, including τ p , τ n , T e , and K e ; and the medium-high frequency dynamics parameter R.
The static-state performance of an LiB is only determined by thermodynamic parameters. In contrast, thermodynamic parameters and low-frequency dynamic parameters influence the transient-state performance. Therefore, first, the static-state performance of an LiB is tested to identify thermodynamic parameters. Second, the low-frequency dynamic parameters are determined based on the transient-state performance of the LiB, and thermodynamic parameters are obtained. The high-frequency dynamic parameter R can be obtained from the value of the voltage jump edge under HPPC excitation [23].

3.1. Identification of the Thermodynamic Parameters ( Q p , Q n , S O C p 0 , S O C n 0 )

The identification of thermodynamic parameters is based on the double-tank model proposed by Han [22]. For an LiB, after long-term relaxation, both low-frequency dynamics and medium-high frequency dynamics have reached their steady states, and the polarization overpotential is zero. Under this condition, the terminal voltage is only determined by S O C p mean , S O C n mean , and thermodynamic parameters. FOMe can be replaced by the double-tank model,
S O C p mean t = S O C p 0 1 Q p 0 t I t d t S O C n mean t = S O C n 0 + 1 Q n 0 t I t d t OCV DT t = E p S O C p mean E n S O C n mean
where OCV DT t is the open-circuit voltage (OCV) calculated using the double-tank model. The OCV of the battery experiencing long-term relaxation over the entire SOC range is tested and employed for thermodynamic parameter identification:
arg min Q p , Q n , S O C p 0 S O C n 0 OCV exp OCV DT 2 2
OCV exp can be approximately obtained from the voltage of LiB at a low discharging current of 0.05 C.

3.2. Identification of the Diffusion Parameters ( τ p , τ n , K e , T e ) Using SPD and EPD Characteristic Intervals

There are three low-frequency diffusion dynamics in FOMe: positive SPD, negative SPD, and EPD. Four parameters that describe these dynamics can be identified by solving Equation (1) with the thermodynamic parameters identified. The HPPC profile is adopted as the I exp for two reasons: only 120 s are needed, which makes parameter identification more efficient; it has a higher low-frequency component compared with driving profiles such as FUDS.
The contributions of SPDs and EPD to the terminal voltage are influenced by the slope of the positive and negative OCP curves, so they will vary with the operating point. For example, when the SOC is high, the negative SPD has almost no effect on the terminal voltage due to the high S O C s , n surf and the slight slope of the negative OCP curve. Thus, the terminal voltage is insensitive to the negative SPD time constant. Thus, according to the variation in the slope of positive and negative OCP curves with the SOC, the entire SOC range can be divided into three segments: the positive characteristic interval (PCI), negative characteristic interval (NCI), and positive and negative similar areas. For the operating points in the PCI, the terminal voltage is mainly influenced by the positive SPD and has a high sensitivity to the positive SPD parameters. Voltage is mainly influenced by the negative SPD in the NCI and has a high sensitivity to the negative SPD parameters. For the other operating point, the effects of positive and negative SPD on the terminal voltage are similar, and the SPD parameters are not easily identified. Furthermore, if there is a specific SOC interval such that both positive characteristics and negative characteristics are small, the terminal voltage is mainly determined by the EPD, and the electrolyte-phase characteristic interval (ECI) can be defined.
The parameters of the three dynamics have high sensitivity in the three characteristic intervals. Therefore, the current and voltage data from each of the three different characteristic intervals should be simultaneously employed to identify the dynamic parameters for accuracy. The optimization in Equation (1) should be rewritten as
arg min P ^ i = 1 3 U exp I exp , S O C 0 , i U MDL I exp , P ^ , S O C 0 , i 2 2
where
S O C 0 , 1 PCI S O C 0 , 2 NCI S O C 0 , 3 ECI
Particle swarm optimization (PSO) is selected as the optimization method, comprehensively considering the issues of convergence speed, global optimum, and algorithm complexity.
To determine the ranges of the PCI, NCI, and ECI, the slope of the OCP curve with SOC needs to be plotted. Since the correspondence among S O C p , S O C n and full-cell SOC is affected by the thermodynamic parameters, these parameters must be identified to further determine the three characteristic intervals.
On the other hand, since the battery operating point will deviate from the initial operating point during I exp excitation, this may lead to the following situation. Although the initial operating point of the battery is located within the characteristic interval, it may leave the characteristic interval during excitation. Therefore, the shift in the operating point should be considered to keep the battery in the characteristic interval during the experiment. This shift, according to FOMe, is
S O C i surf S O C i 0 = 1 3600 1 Q i s + τ i 3 Q i 19 12 τ i s + 95 I s , i = p , n
which is related to the parameter value and current magnitude. Considering the range of values of the parameters, the maximum value of this offset is approximately 4% when I exp is the HPPC.
Therefore, the process of determining the characteristic interval is as follows:
  • The slopes of the positive and negative OCP curves are plotted versus SOC without considering the SOC shift, and three characteristic intervals are calculated, denoted as PC I noShift , NC I noShift , and EC I noShift .
  • S O C p 0 is increased by 4% and S O C n 0 is decreased by 4%; the three intervals are recalculated, and are denoted as PCI Shift , NCI Shift , ECI Shift .
  • These are intersected with PCI noShift , NCI noShift , and ECI noShift to obtain the real PCI, NCI, and ECI.

4. Verification and Discussion

FOMe and the parameter identification method are verified with the P2D model and experiments for a commercial NCM battery. The test environment for the battery is listed in Section 4.1.
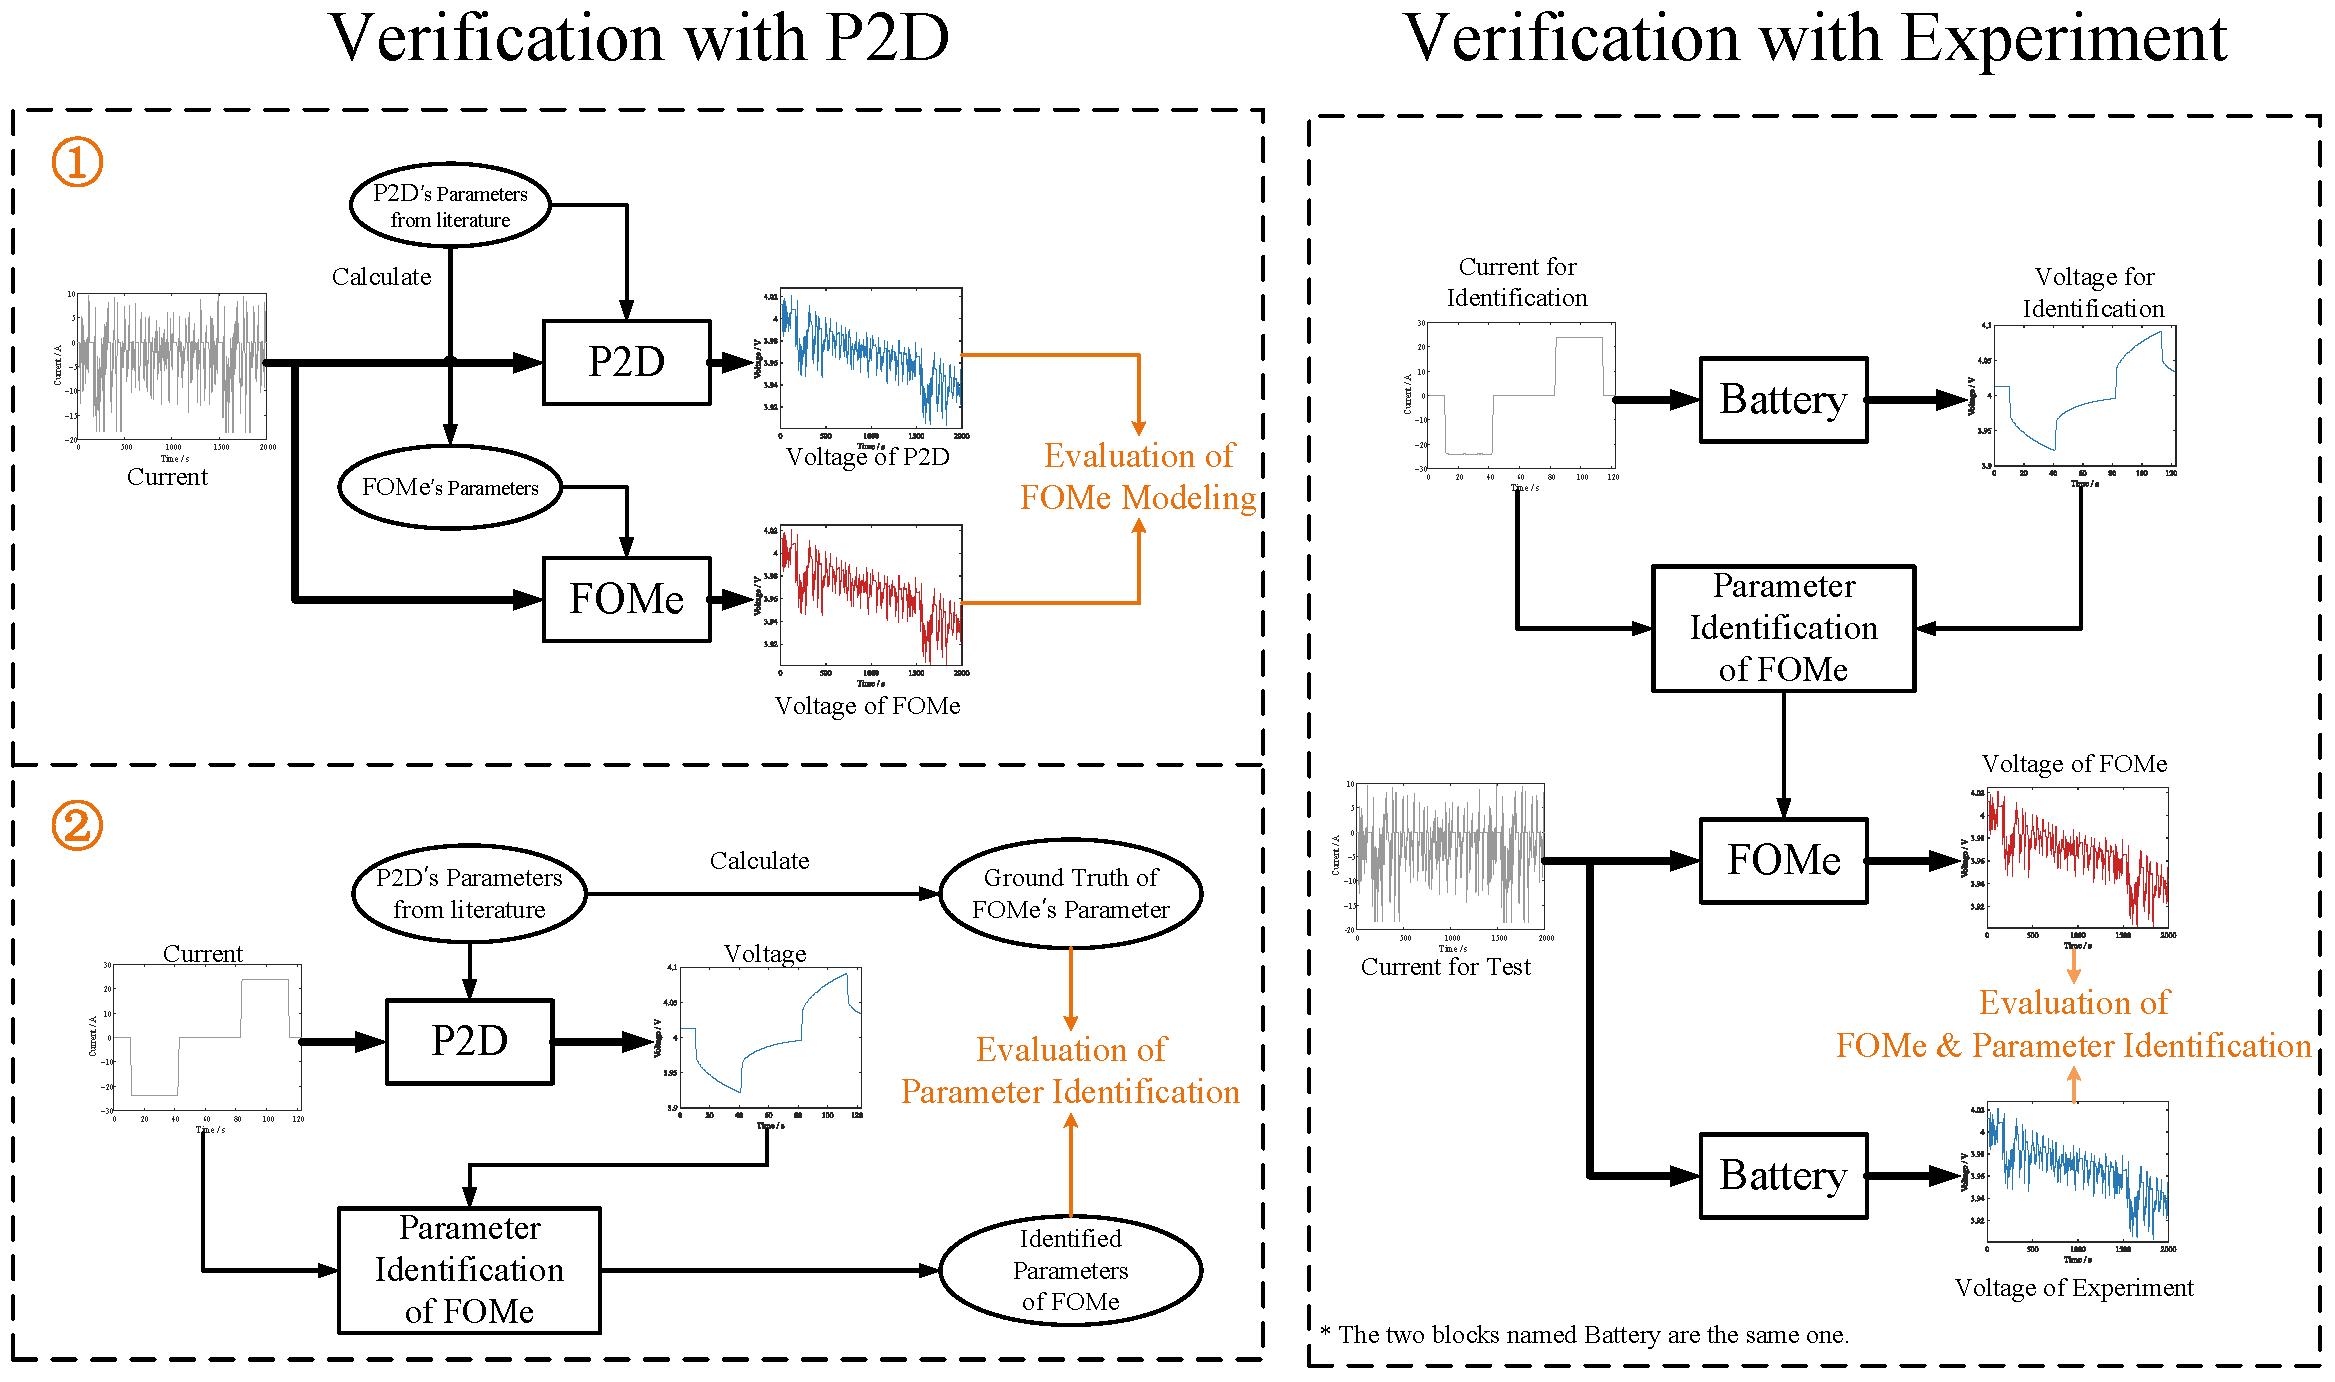
Two dependent parts need to be verified: the modeling of FOMe and the parameter identification method. However, the two parts cannot be separately verified for an actual battery since the true parameter values in the actual battery are unknown. However, the P2D model with known parameters can be treated as a digital twin of the real battery [39,40], allowing the two parts to be independently verified. Therefore, first, the P2D model is employed for verification. The modeling accuracy is verified by comparing the output voltage of the P2D model and FOMe with the same parameter configuration and excitation. Second, the output voltage of the P2D model is treated as the actual voltage, and the parameters of the FOMe are estimated using the proposed parameter identification method. Last, a comparison of the identification results with the actual values of the parameters in the P2D model is carried out to verify the effectiveness of the parameter identification method. A schematic is shown in Figure 4. This part will be elaborated in Section 4.4.
The verification procedures based on the actual battery data are presented as follows: First, all the parameters of the actual battery are identified. Second, the results are loaded into FOMe, and the voltage error between FOMe and the experimental battery under multiple profiles is compared. The EIS error between FOMe and the actual battery is analyzed.
The verification methods based on the P2D model and the actual battery require knowledge of the positive and negative characteristic intervals. Therefore, the results for identifying thermodynamic parameters and determining the PCI, NCI, and ECI will be provided in Section 4.2 and Section 4.3.

4.1. Experiment

A commercial NCM battery, whose parameters are given in Table 1, is tested. The experiment consists of three parts: a time domain experiment, EIS test, and half-cell test.
The time-domain experiments are performed with the Neware CT-4008-5V100A-NTFA, whose voltage sampling accuracy is ±0.05%FS. The sampling period is 1 s. The DGBELL BTH-150C thermal chamber maintains an ambient temperature of 25 C 
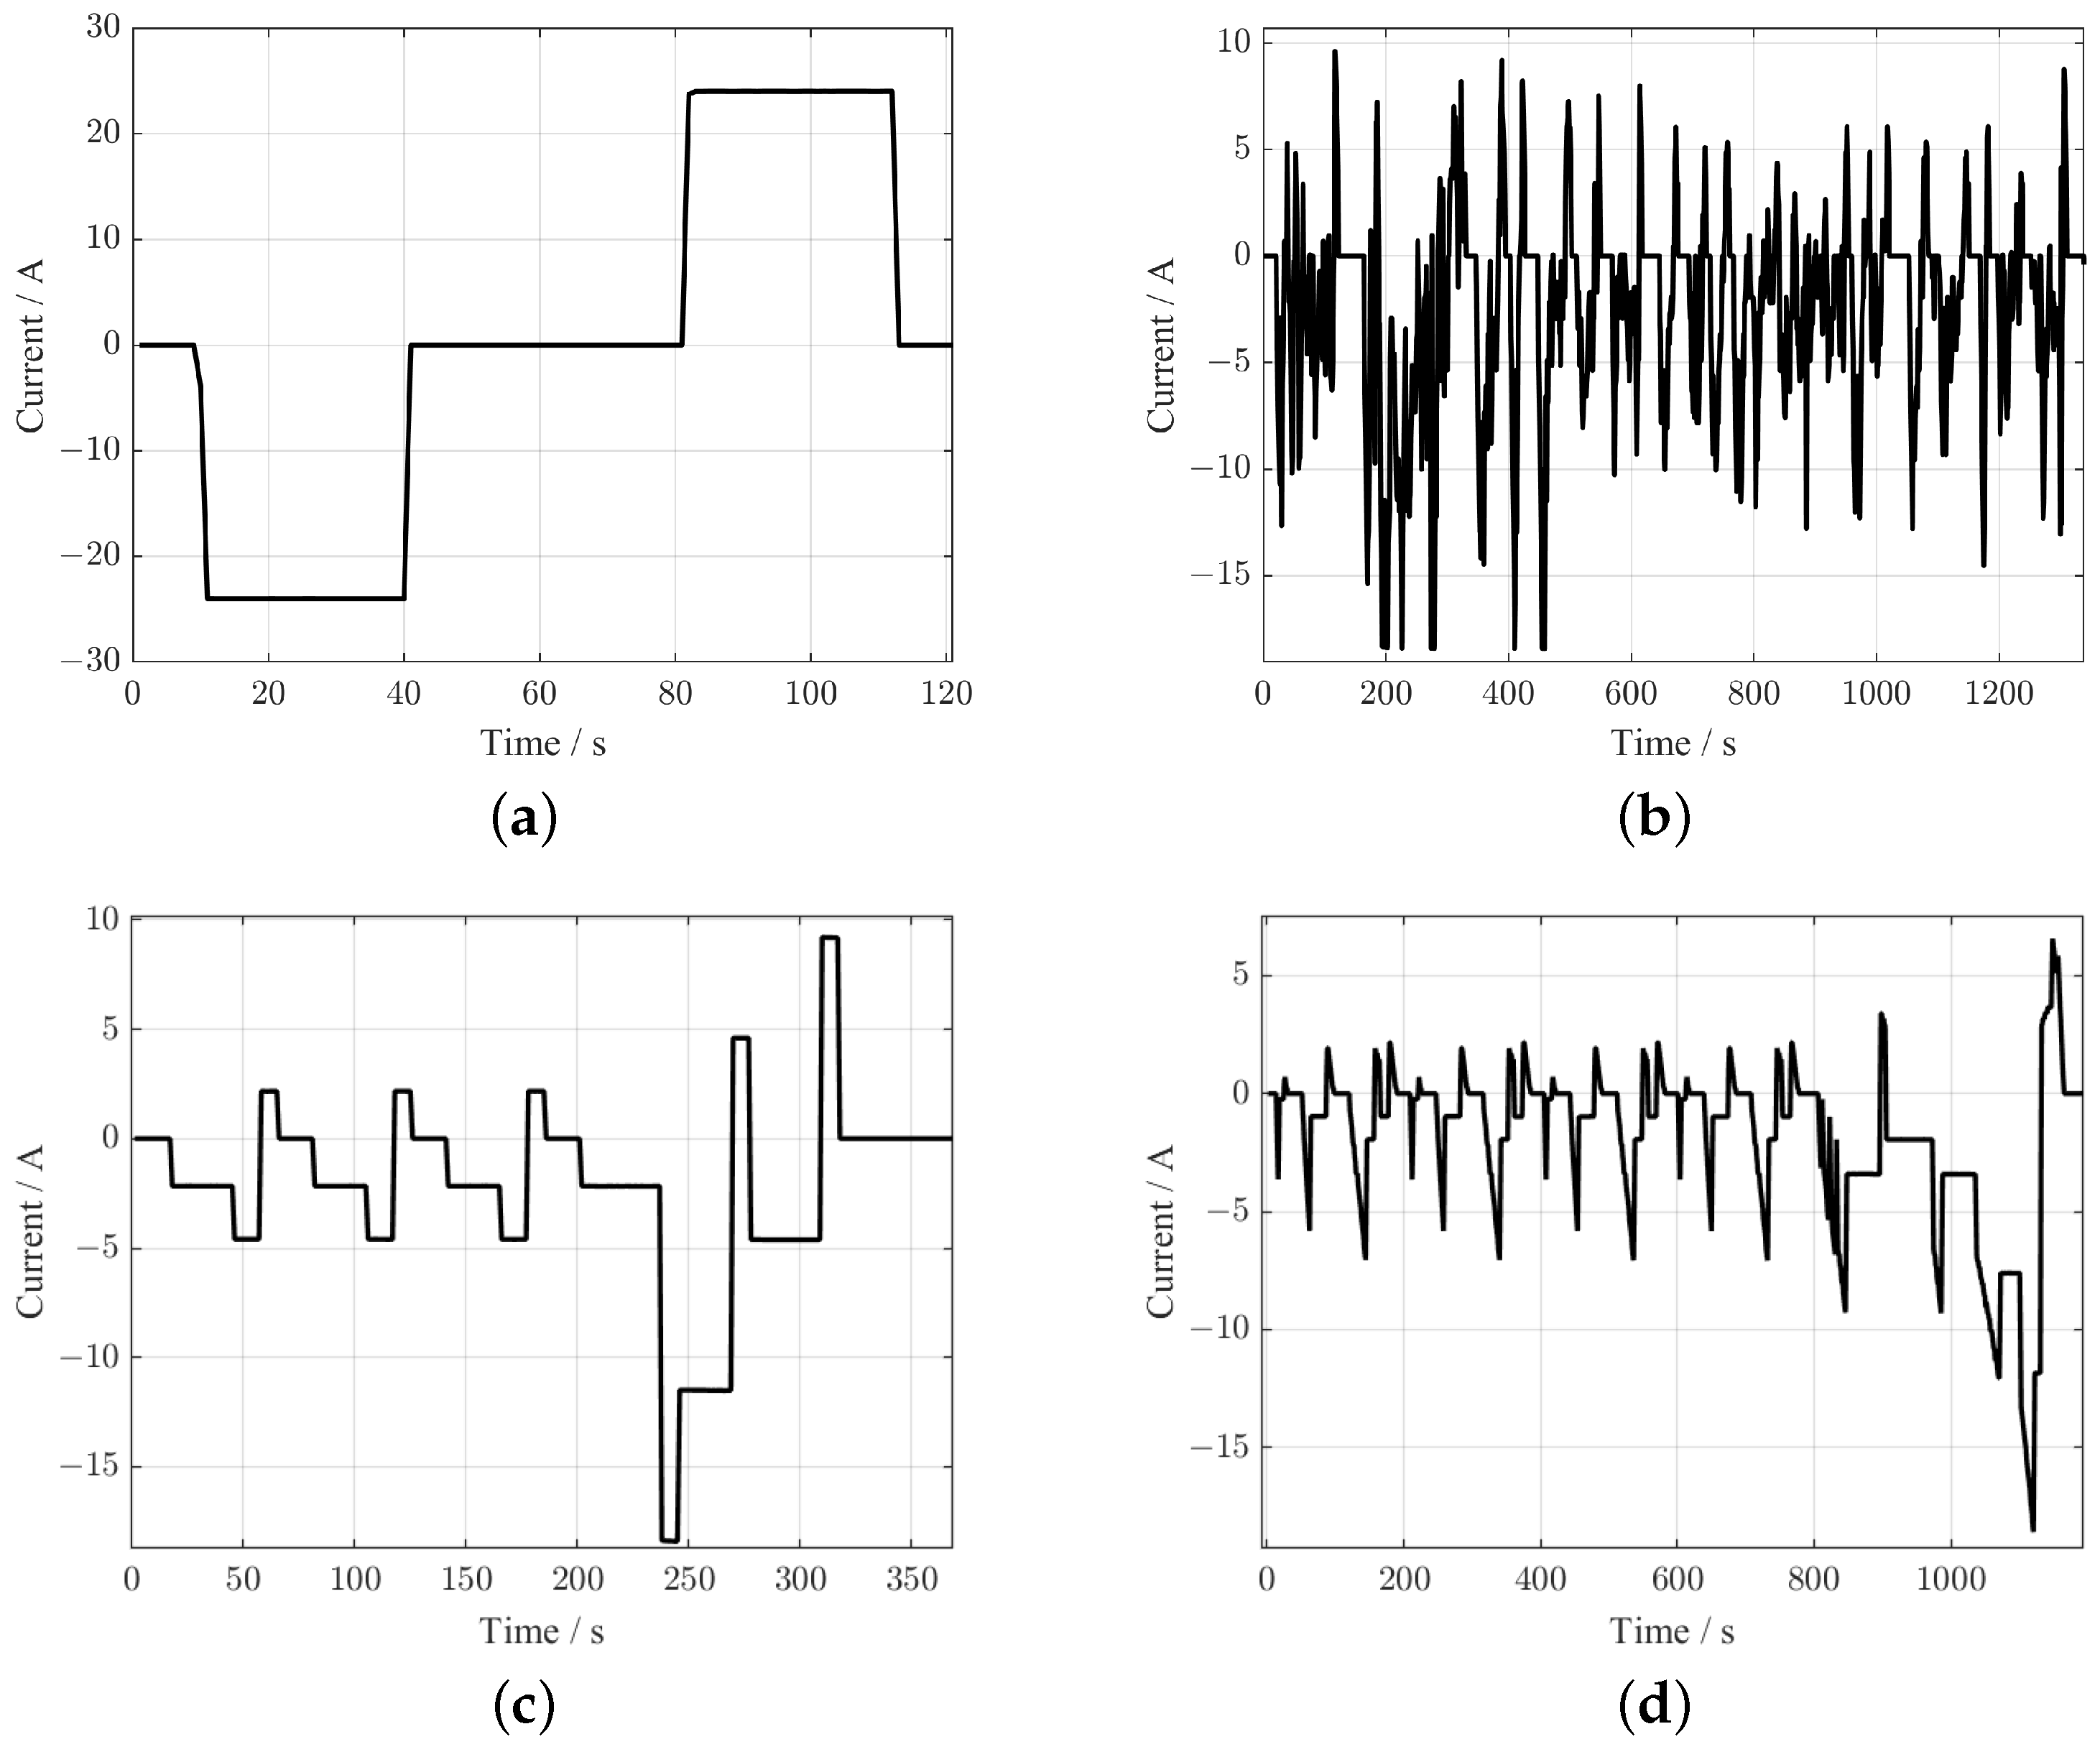
. The time-domain experiment means obtaining the response voltage of the battery under different excitation current profiles, including a discharging test with a current of 0.05C, an HPPC test, a FUDS test, a DST test, and an NEDC test. The currents of these four profiles are shown in Figure 5. The EIS test is implemented to capture battery performance in the frequency domain. The applied current amplitude of the EIS test is 0.5 A, and the frequency range is 2 mHz–2 kHz.
To measure the positive and negative OCP, the positive and negative electrodes of the battery are retrieved and used to assemble two half-cells. The details of the half-cell test are presented in Ref. [11].
The P2D model is established in COMSOL Multiphysics ver 5.4. FOMe, and the parameter identification method is programmed and simulated in MATLAB R2020a. All simulations are carried out with a Lenovo Legion R7000 computer.

4.2. Identification of Thermodynamic Parameters

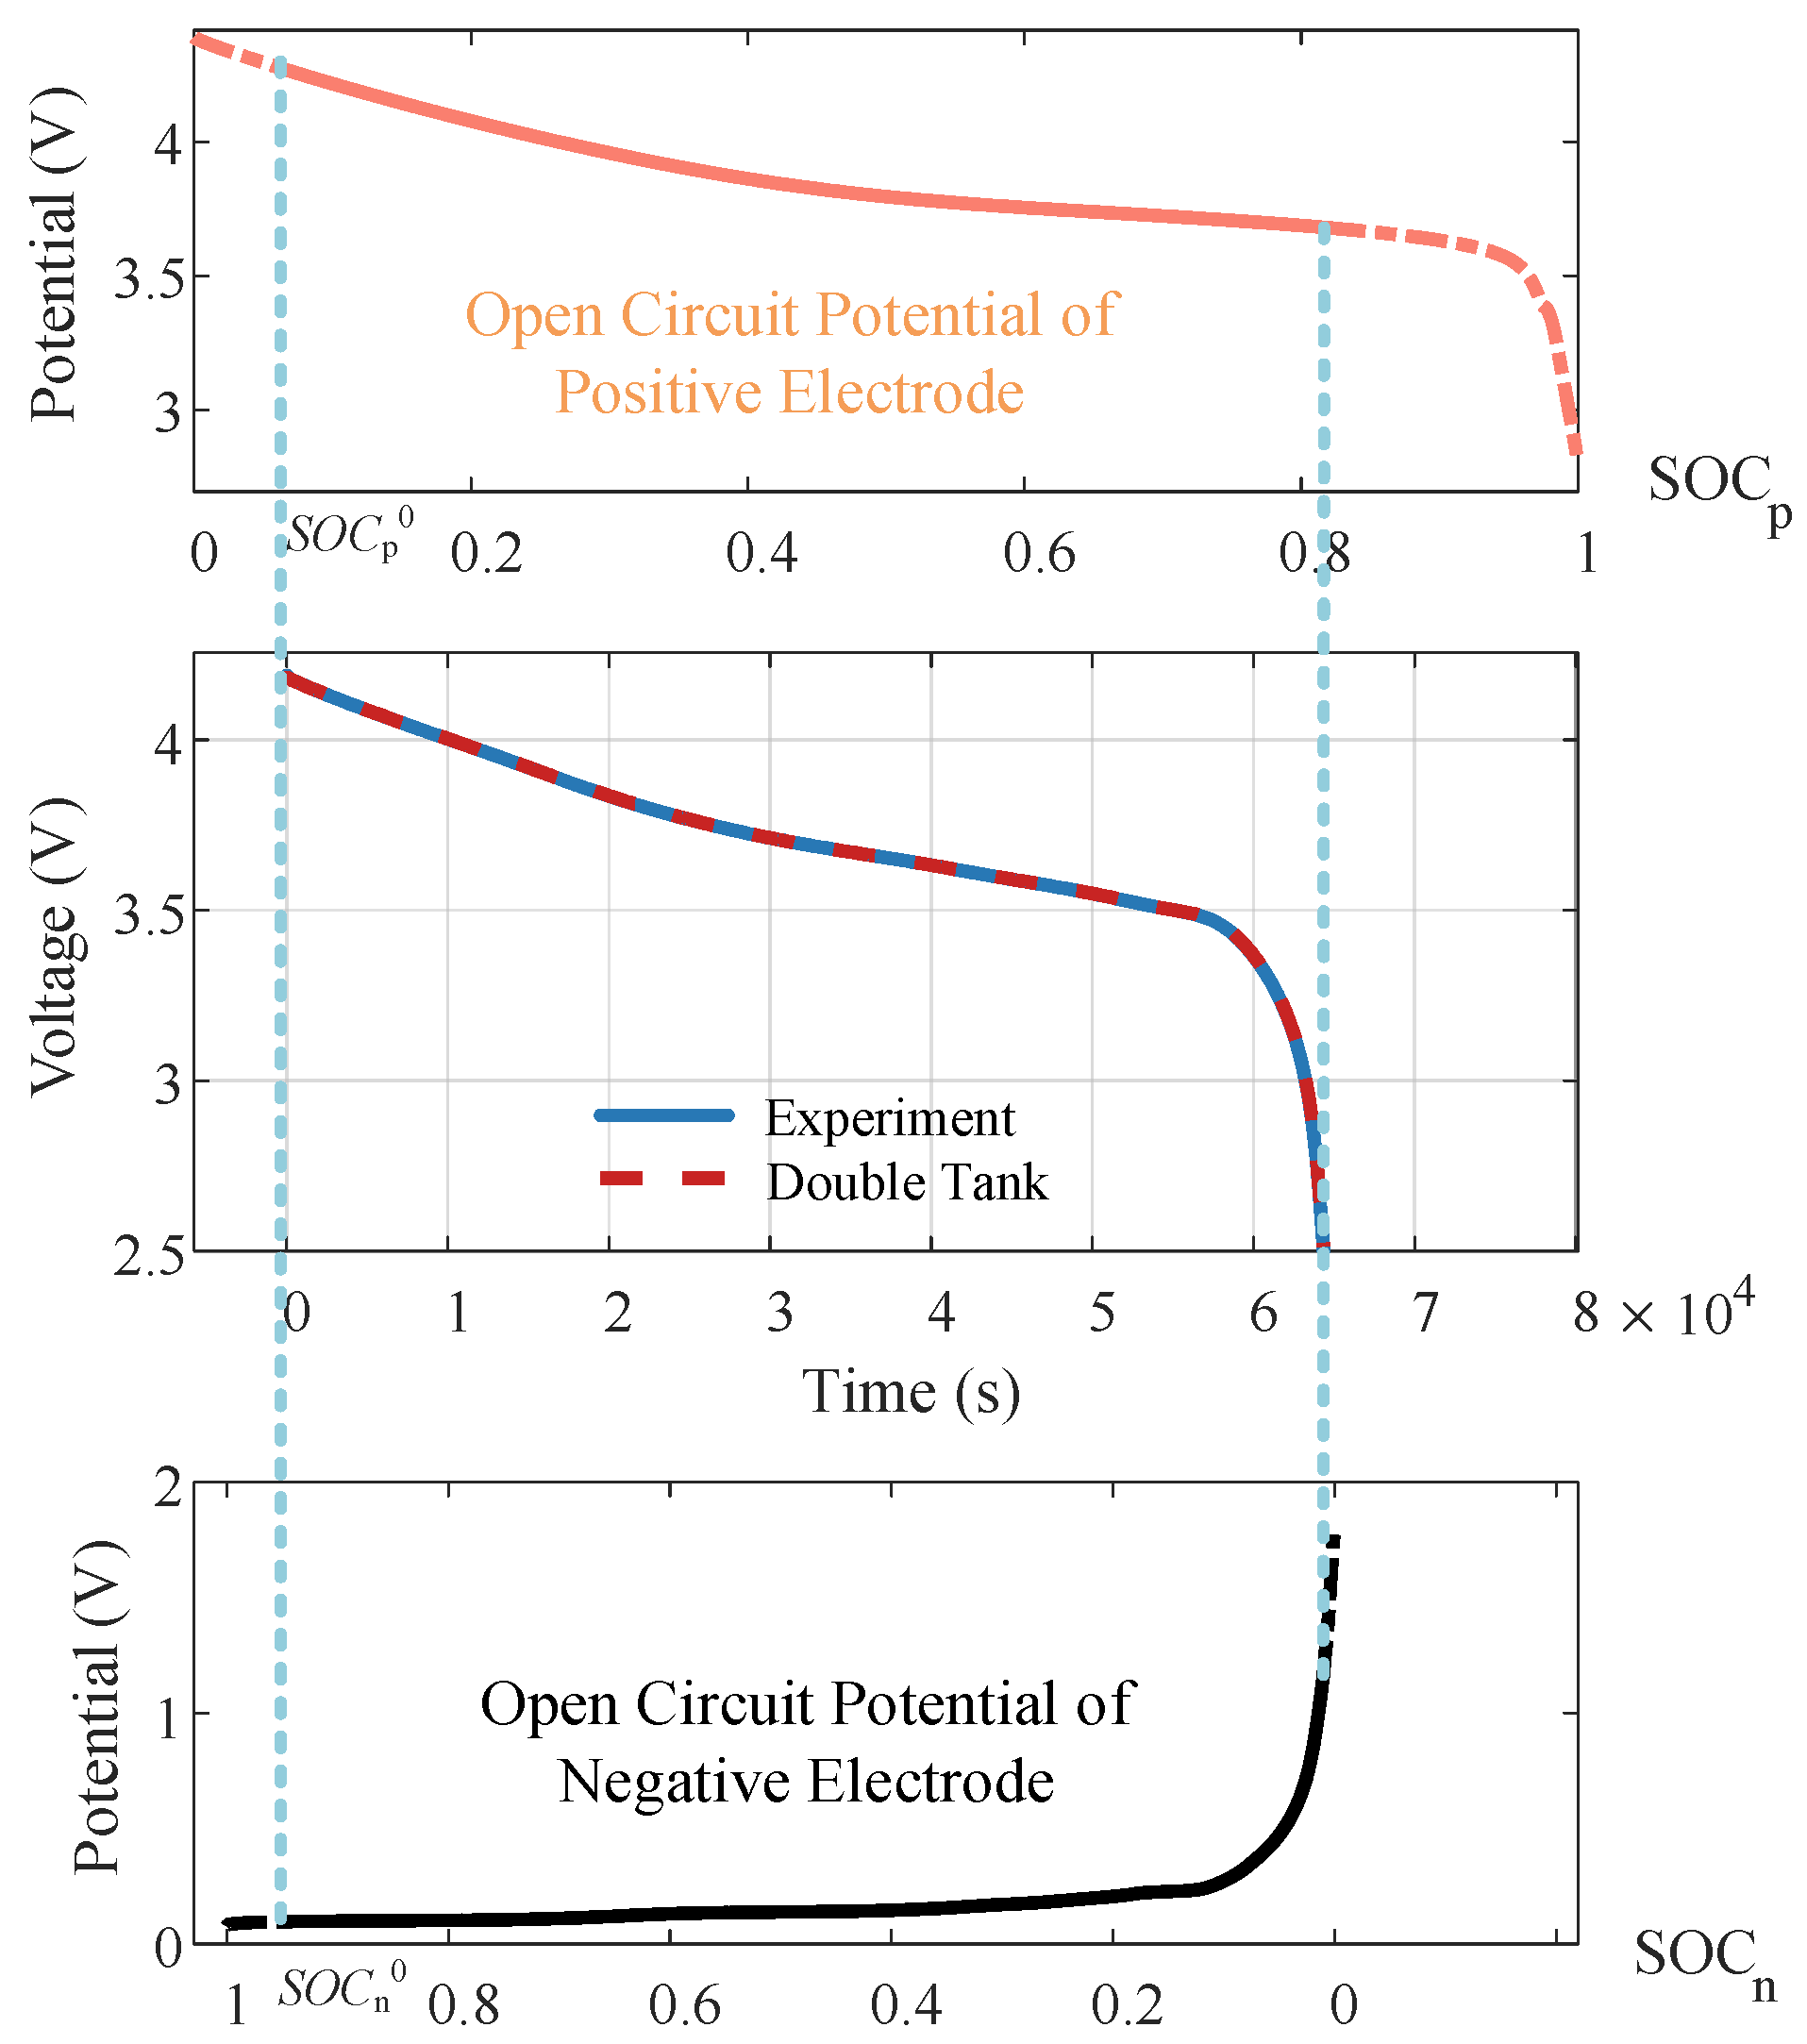
Figure 6 shows the OCP accessed through the half-cell test. The estimated results for the thermodynamic parameters are presented in Table 2. The simulated and measured voltage curves under 0.05C are shown in Figure 6, with a root mean square error (RMSE) of 0.61 mV.

4.3. Determination of PCI, NCI, and ECI

According to the method proposed in 
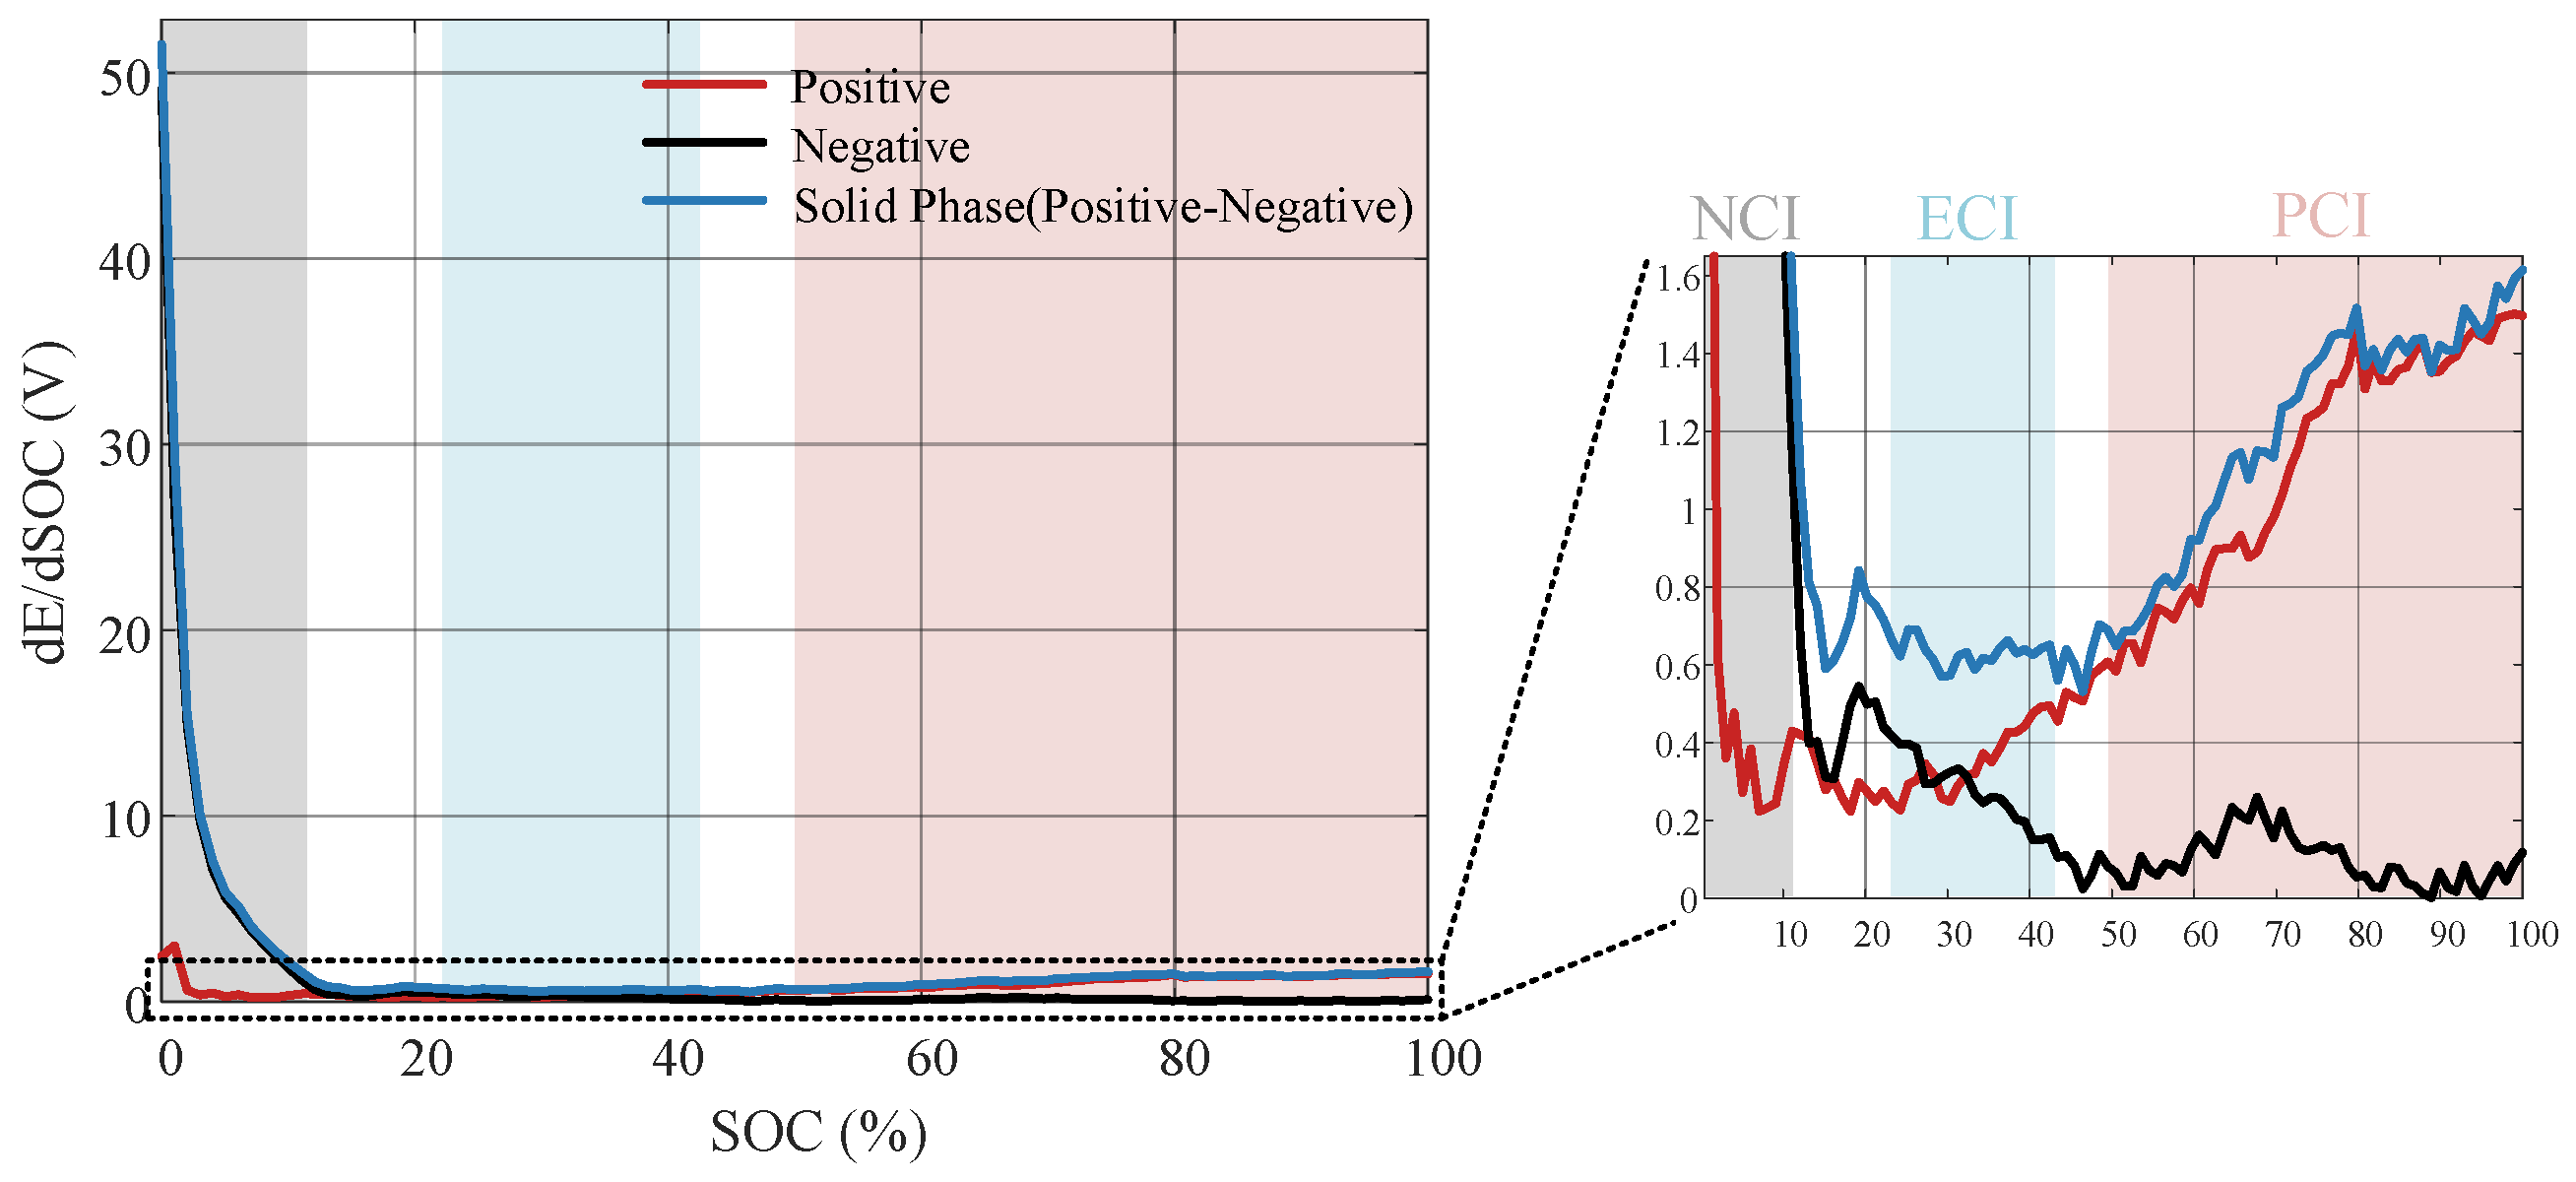
Section 3.2, the slope of the OCP curve is plotted with respect to the SOC, as shown in Figure 7. To quantify three characteristic intervals, we define the PCI as an SOC interval, where the positive characteristic is five times larger than the negative characteristic, and similarly defines the NCI. The interval where the difference between the slope of the positive OCP curve and the negative OCP curve is slight is defined as the ECI. Selecting the intersection of each characteristic interval before and after considering the SOC shift, we determine that the PCI ranges from 50% to 99%, that the NCI ranges from 0% to 10%, and that the ECI ranges from 23% to 42%.

4.4. Verification with the P2D Model

4.4.1. Verification of FOMe Modeling

The voltages under the FUDS of FOMe and P2D are compared. The parameters of P2D are listed in Table A1. The FOMe parameters are listed in Table 2, which are calculated according to the corresponding parameters of P2D. The parameters in Table A1 are derived from measurements (geometric parameters) or studies, and some parameters are estimated using the experimental results (thermodynamic parameters). The ranges of certain parameters of P2D are also given in Table A1; most of them are derived from Ref. [41]. The ranges of the P2D parameters are used to determine the upper and lower limits of the FOMe parameters in the PSO algorithm.
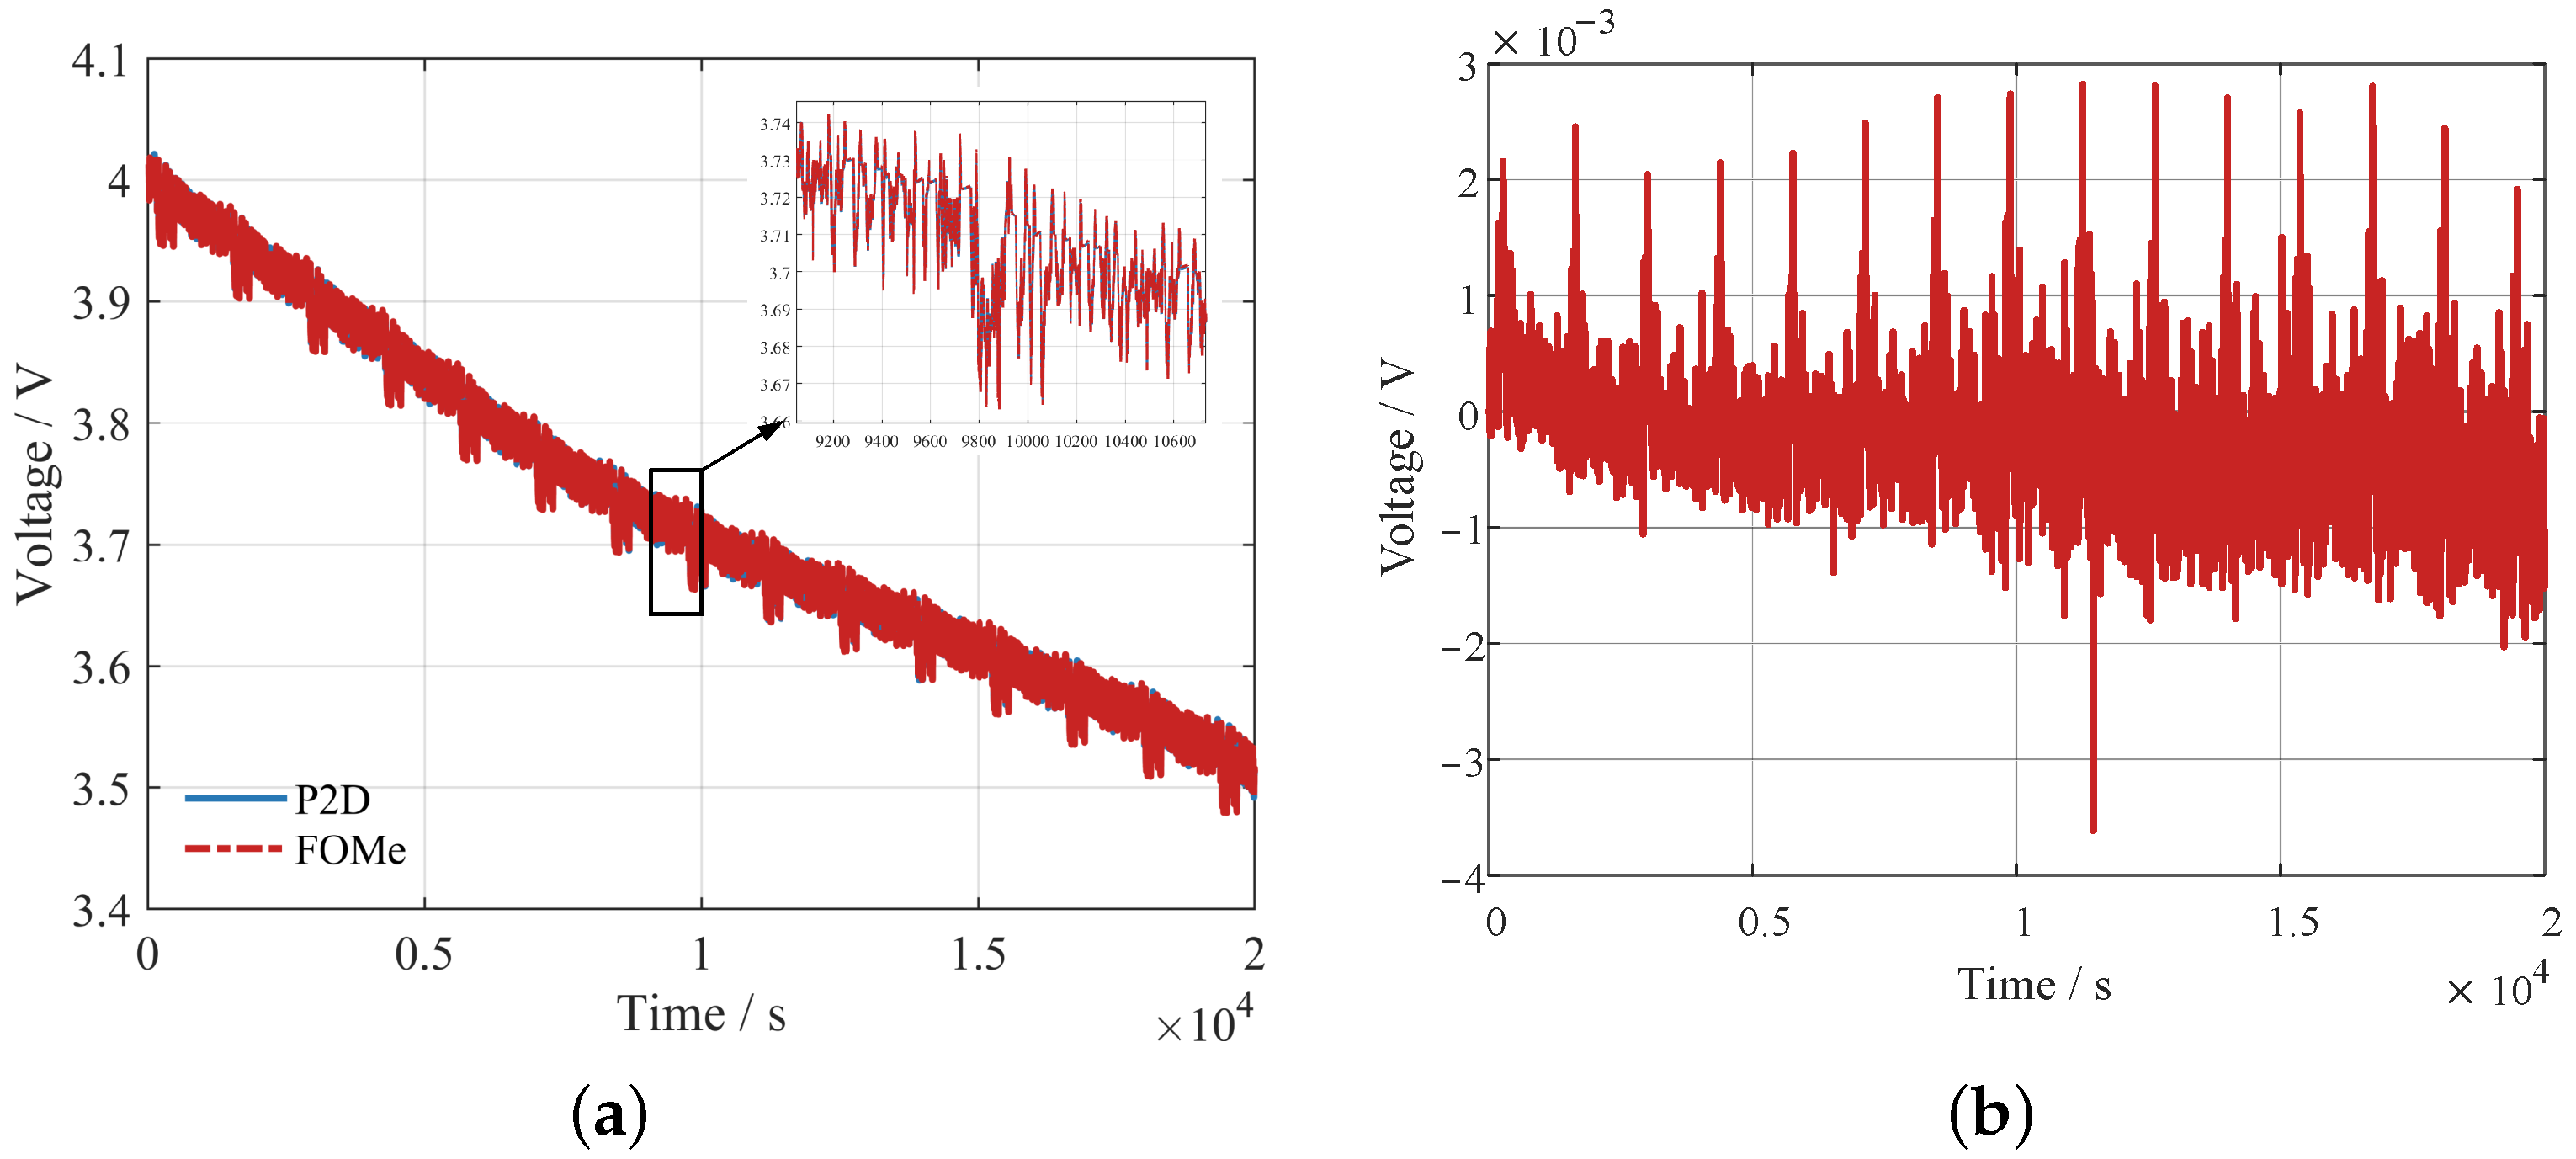
The voltages of P2D and FOMe are shown in Figure 8. The RMSE between the two voltages is 0.55 mV, and the maximum error is 3.6 mV. The results indicate that FOMe provides an adequate approximation of P2D. For the computation time, for the 20,000 s FUDS profile shown in Figure 8, the P2D model takes 21 min to solve, while FOMe needs only 7 s.

4.4.2. Verification of the Parameter Identification

First, the HPPC voltage response data of the P2D at the initial SOCs of 90%, 30%, and 10% are obtained through simulation with the parameter configuration in Table A1. Second, the voltage data are considered the output voltage of a virtual cell, and its corresponding FOMe parameters are identified using the parameter identification method described in Section 3.
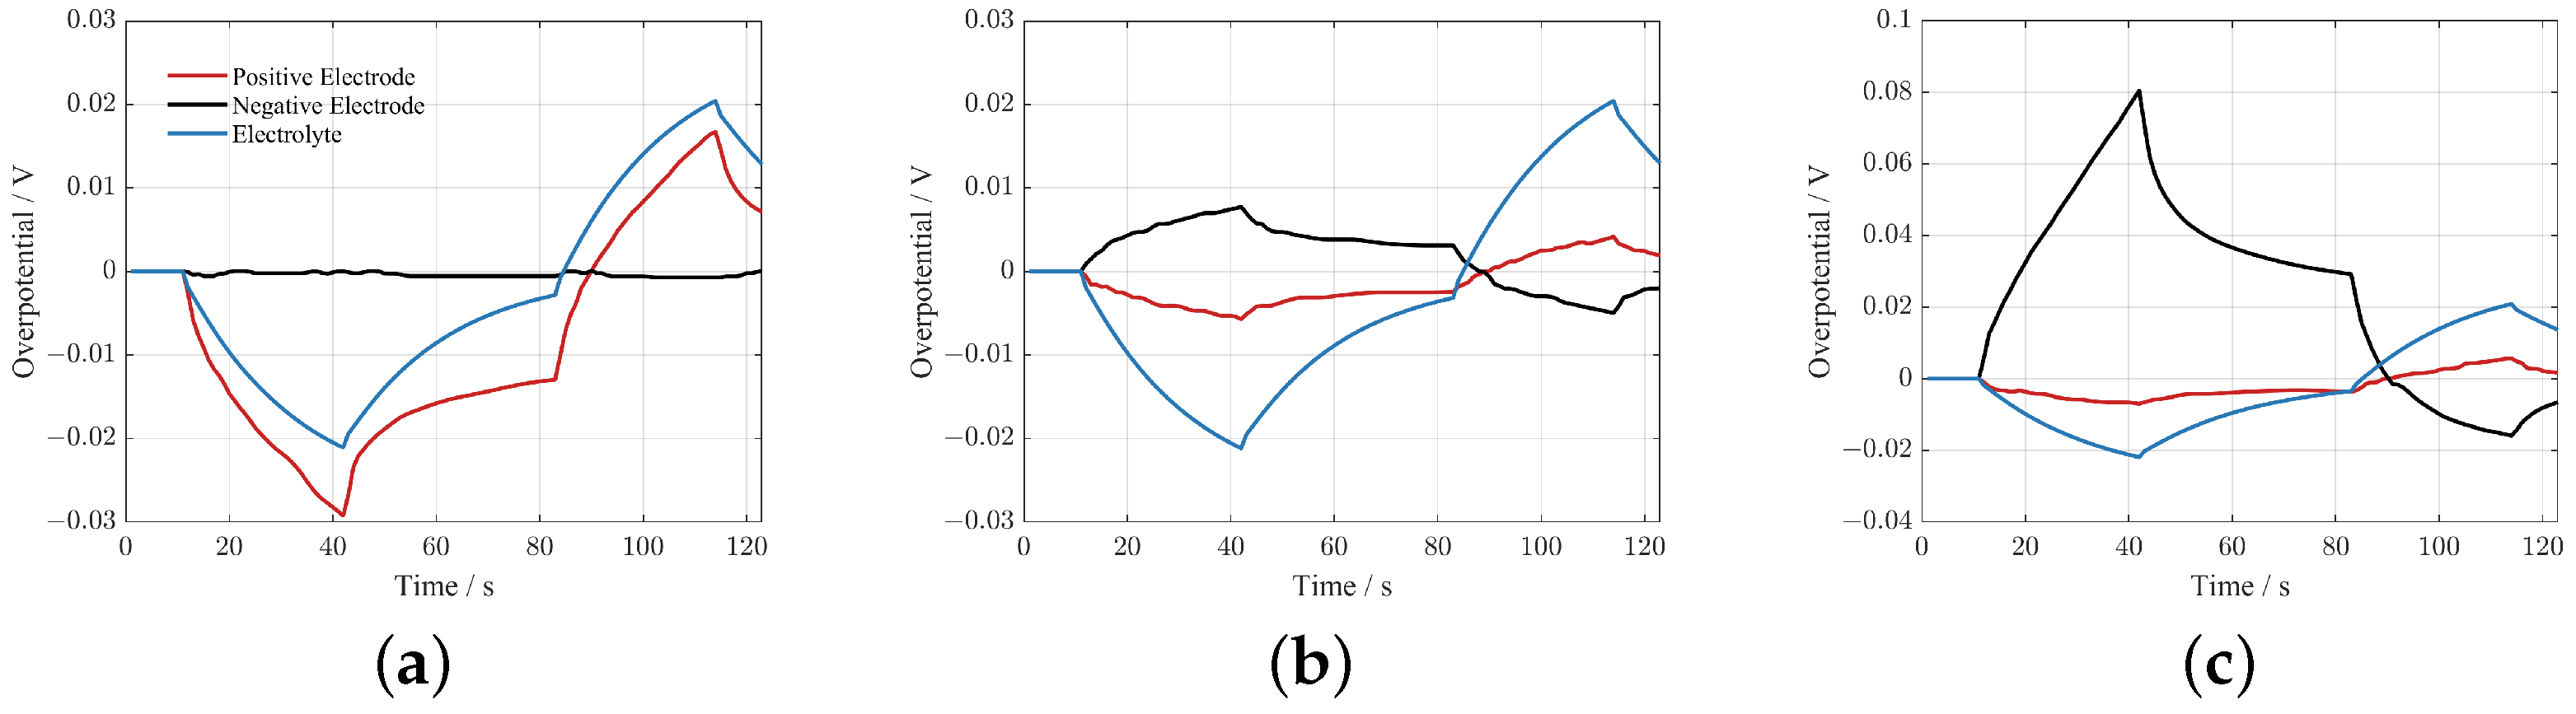
Figure 9 gives the positive SPD overpotential, negative SPD overpotential, and EPD overpotential for the P2D model at three operating points under the HPPC profile. The ratio of the three overpotentials varies, and the three operating points belong to three different characteristic intervals.
The results from comparing the identified values with the true values in the P2D model are shown in Table 3, which shows that this method can accurately estimate the parameters of the P2D model.

4.5. Verification with Experiment

First, HPPC experiments are conducted on the NCM battery at every 10% SOC from 90% to 10% SOC, and a total of nine HPPC experimental data are obtained. Second, the data of 90% SOC, 30% SOC, and 10% SOC are selected for diffusion parameter identification. The results are shown in Table 4.
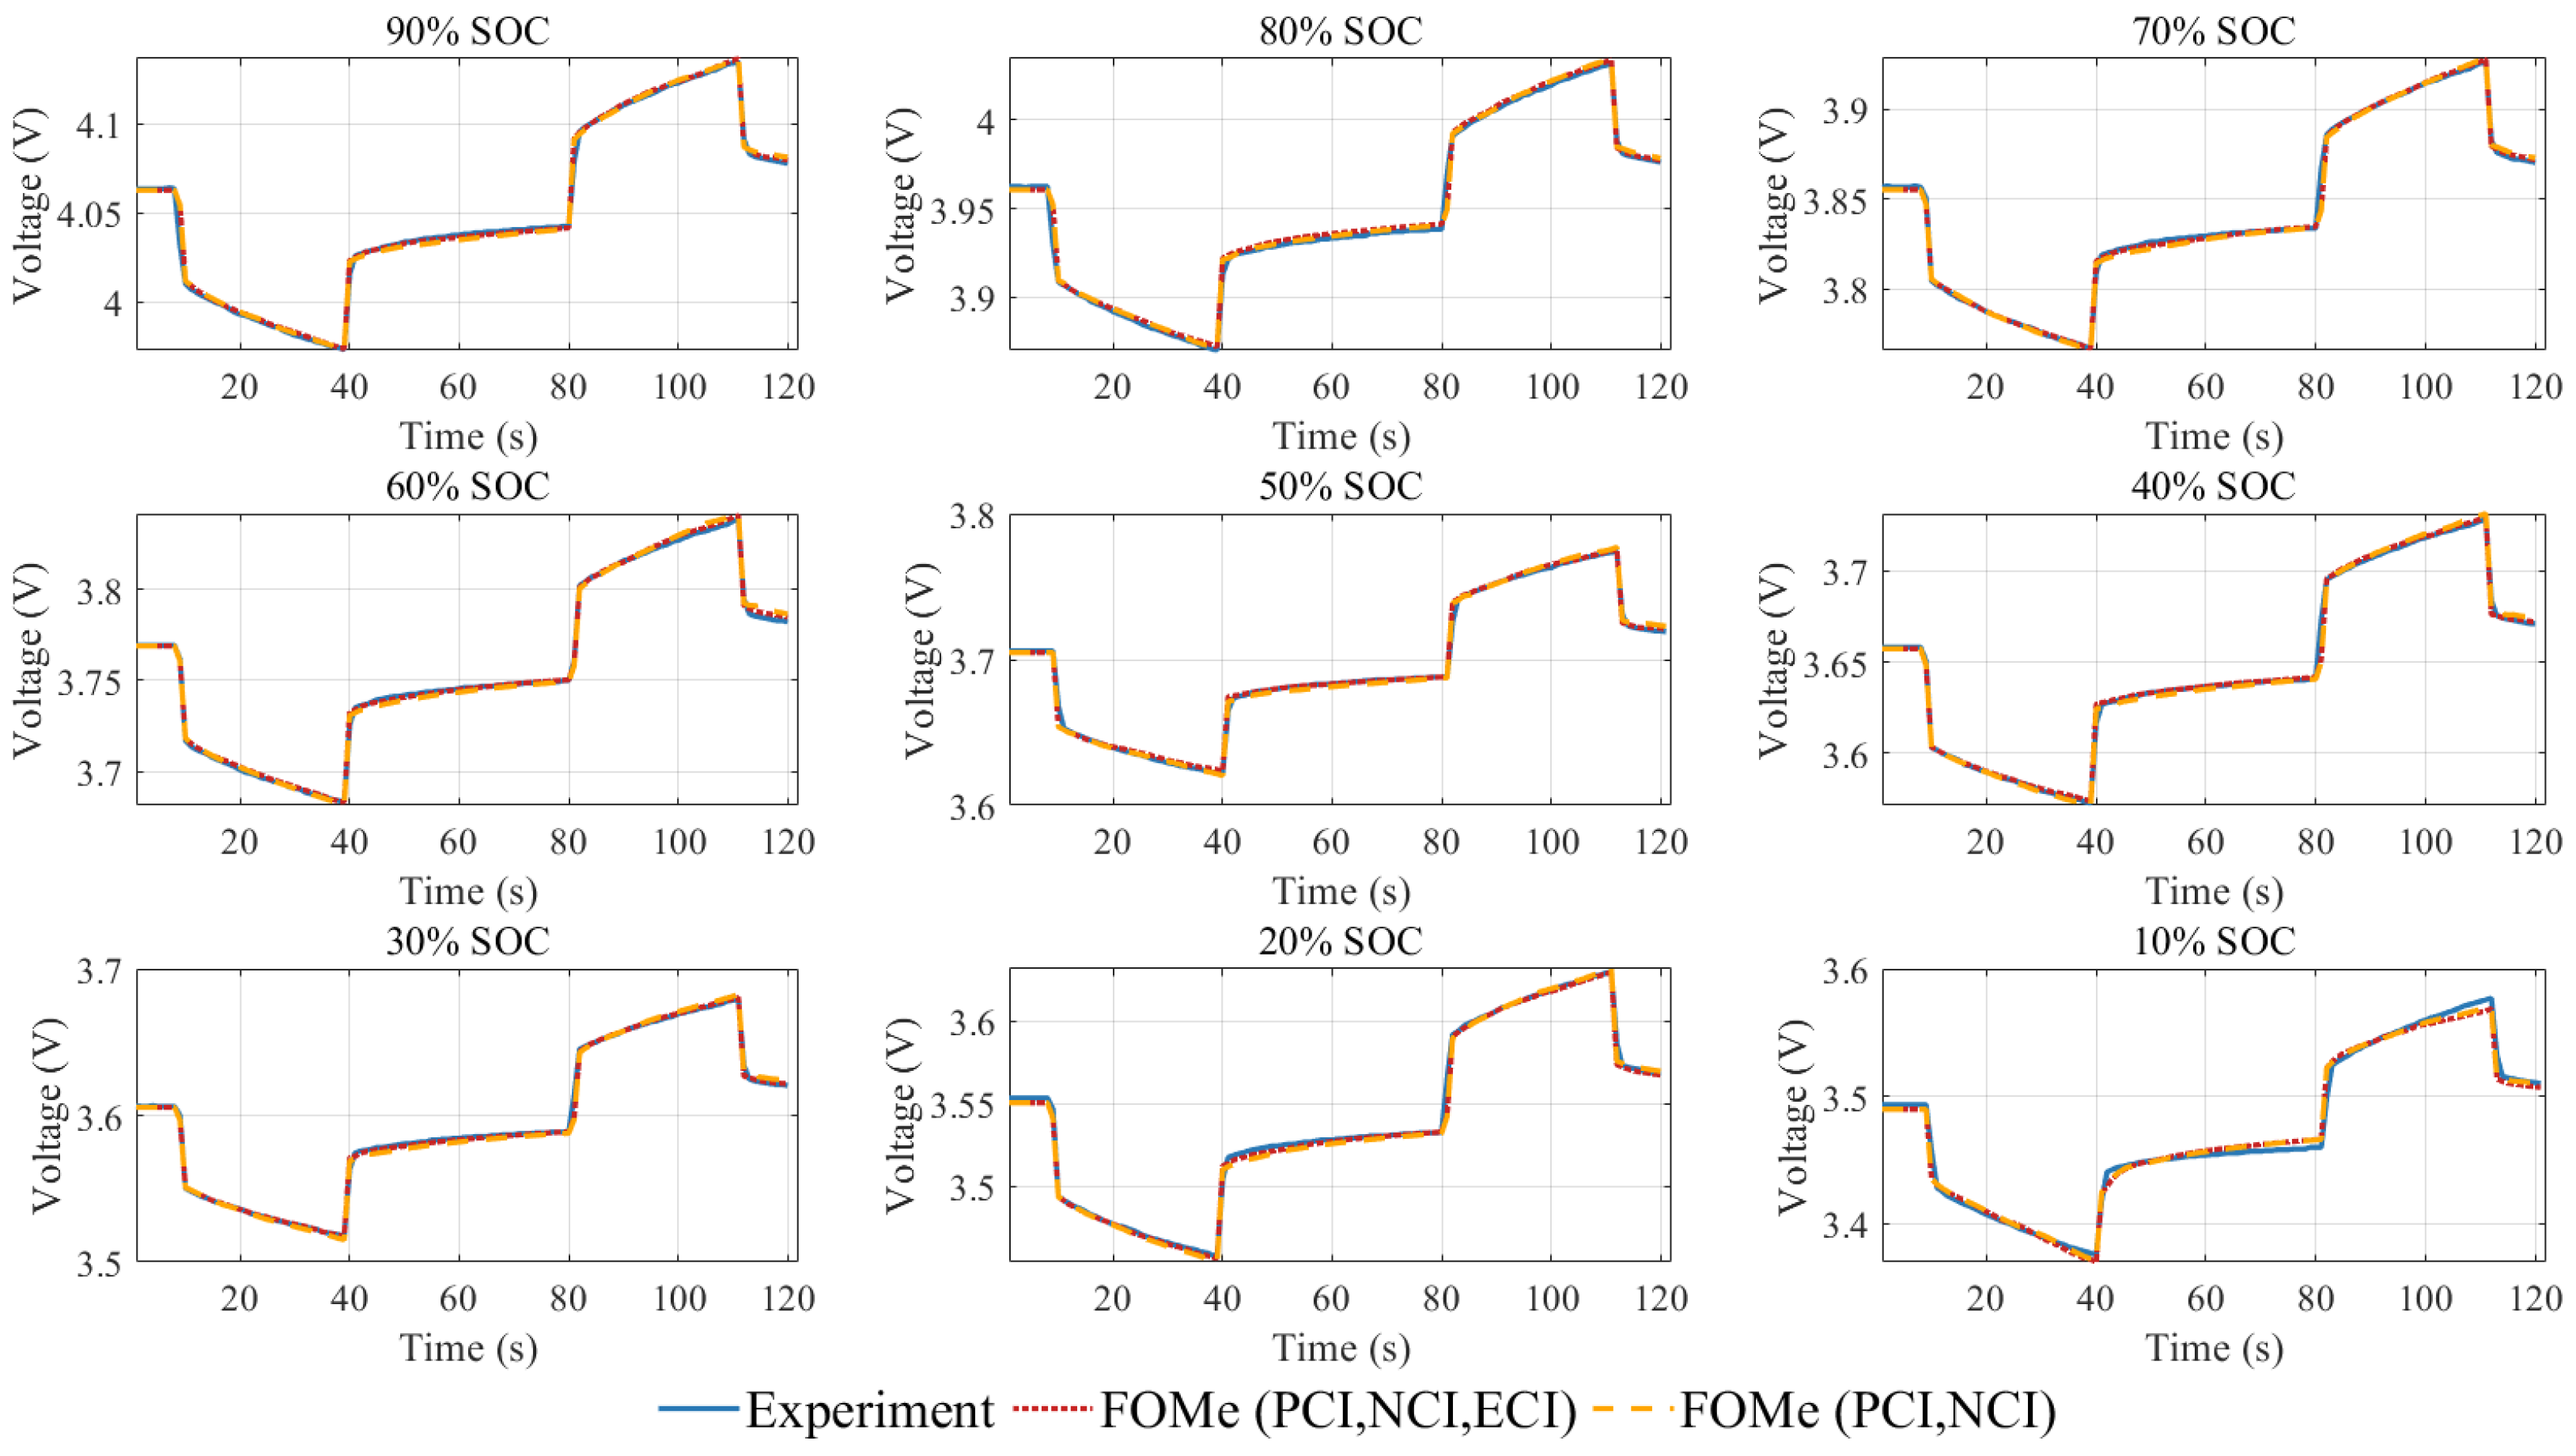
Substituting the results into FOMe, the comparison between FOMe and the actual voltages at nine operating points is shown in Figure 10. The RMSE over the nine operating points is 2.75 mV.
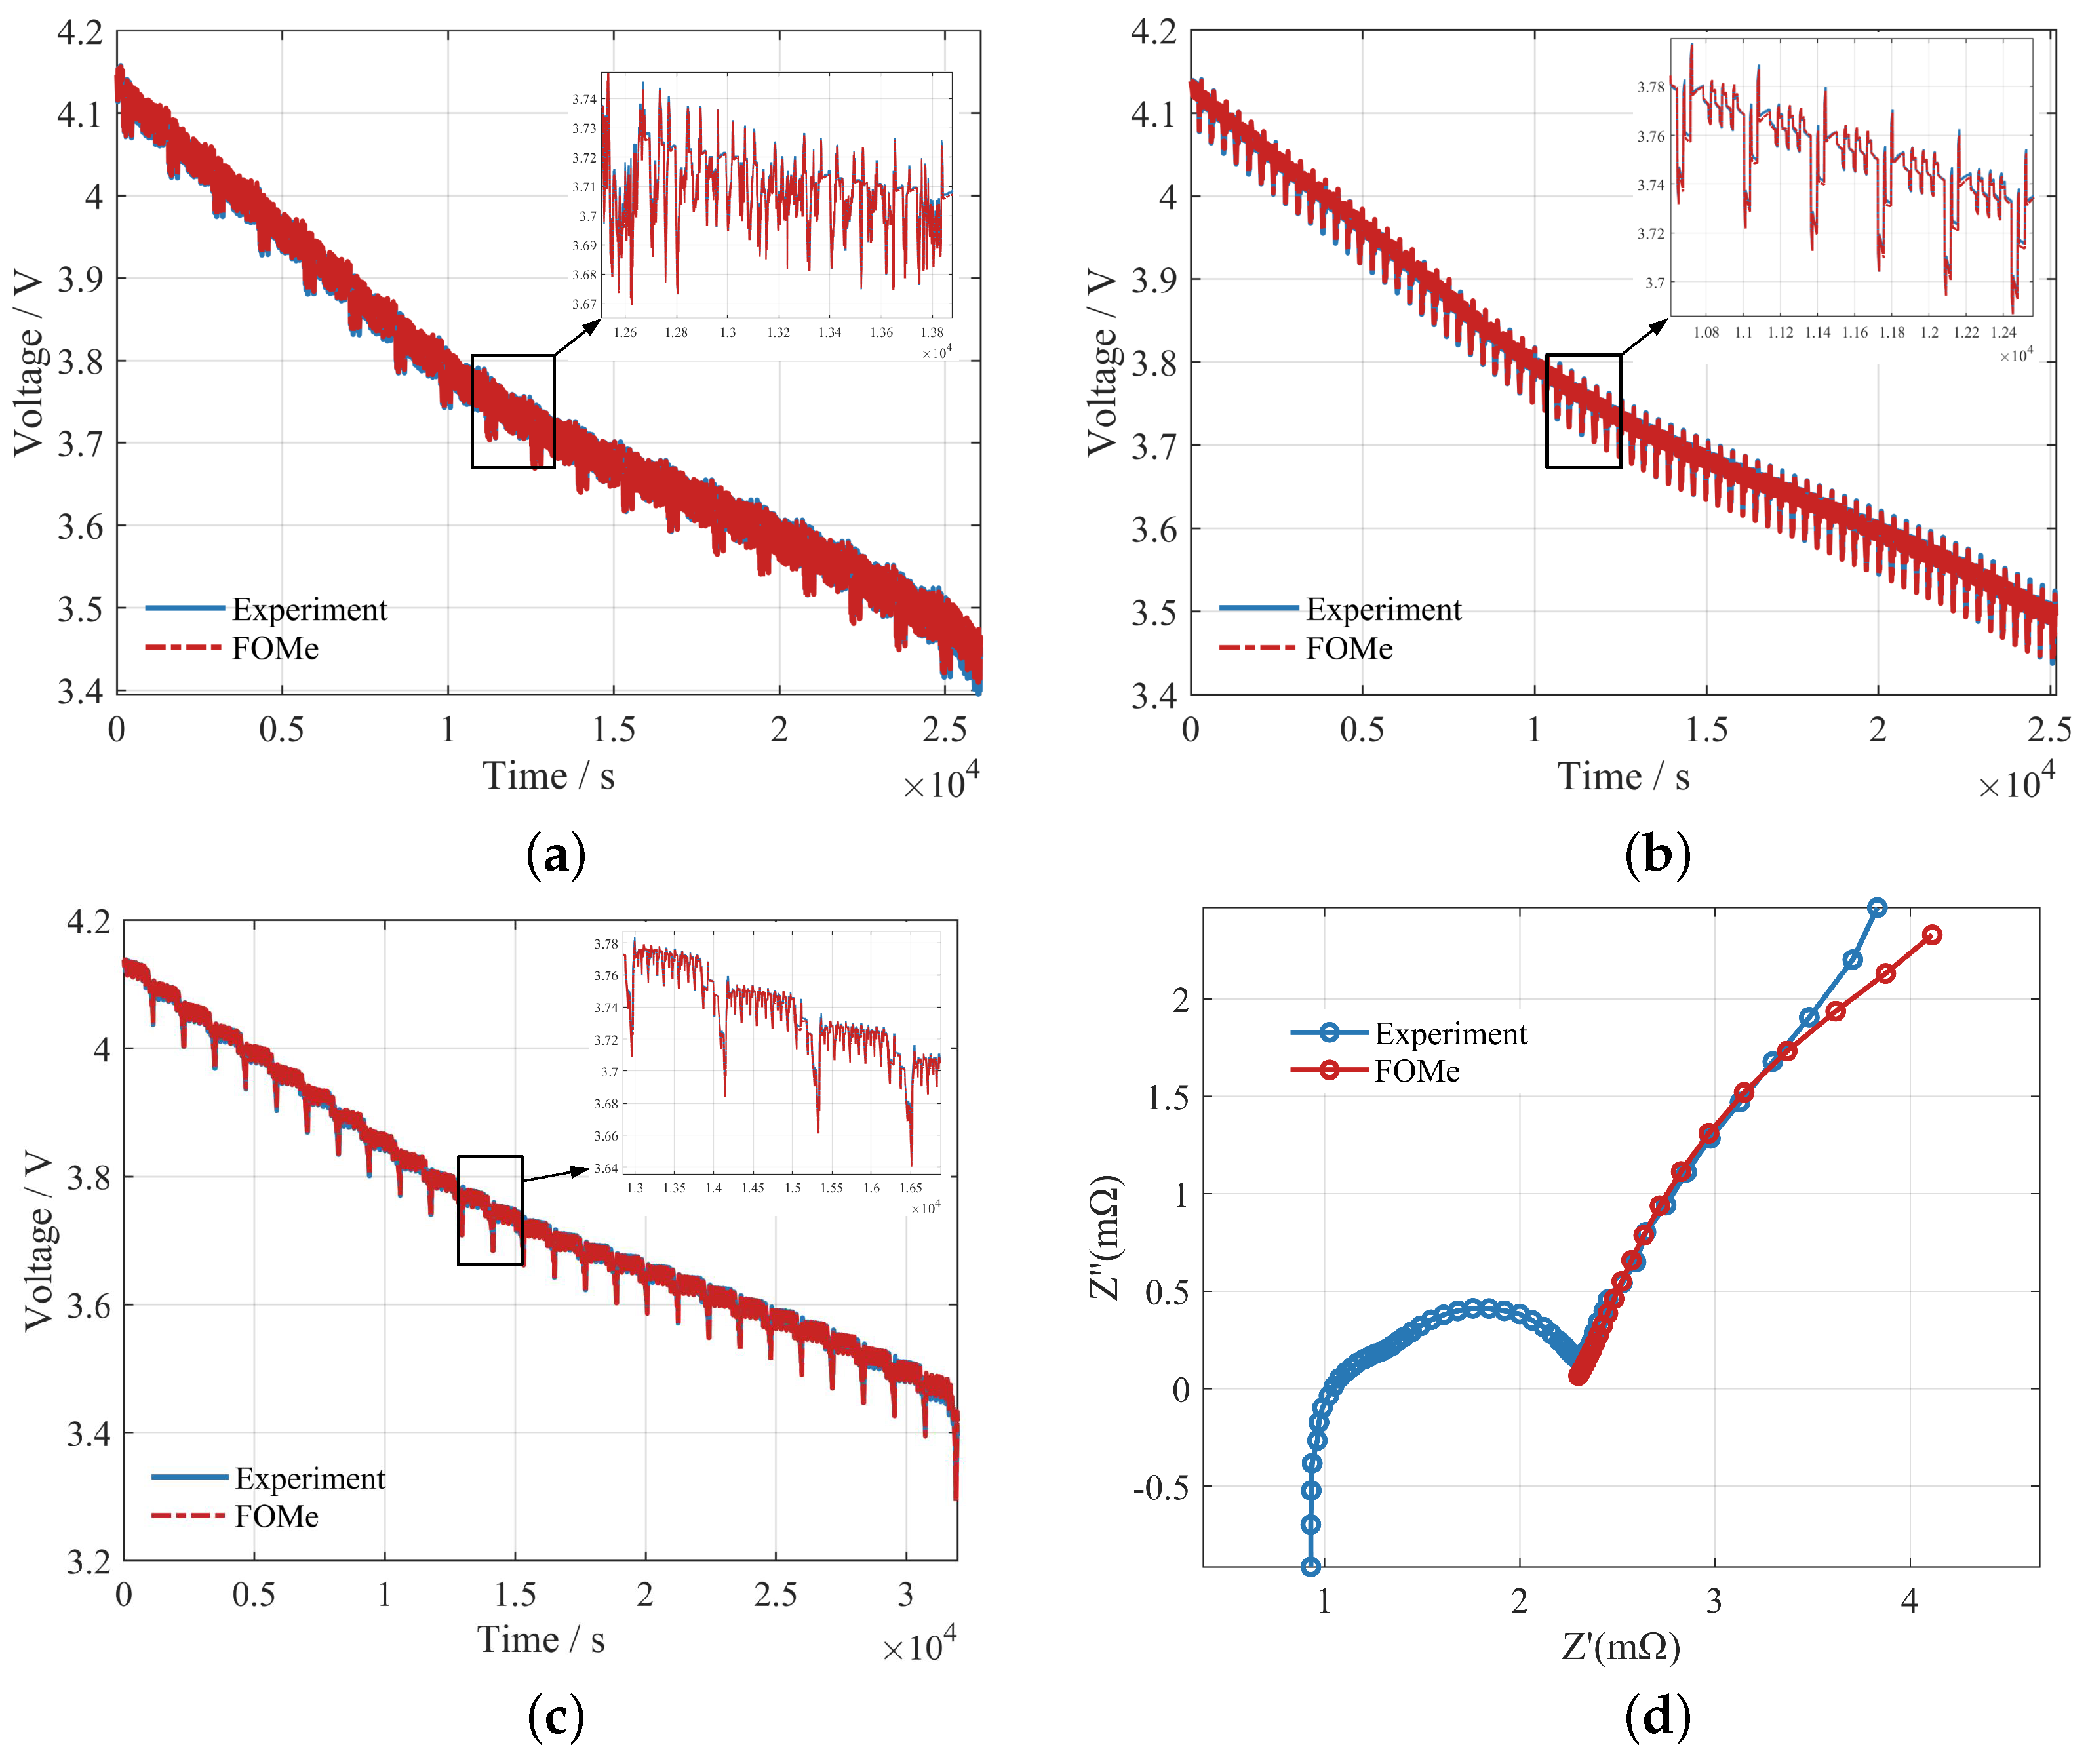
Furthermore, comparisons of the FOMe voltage with experiments under the FUDS, DST, and NEDC profiles are given. As shown in Figure 11, the statistics of errors are shown in Table 5. In addition, in the frequency domain, the simulated EIS of FOMe is compared with the measured EIS, as shown in Figure 11. The mean absolute percentage error (MAPE) in the low-frequency part is 2.03%. In summary, FOMe and its parameter identification method demonstrated high accuracy for the investigated battery.
Figure 11d shows a slight difference between the simulated EIS and the measured EIS in the very low frequency band. The measured EIS tends to be a straight line perpendicular to the real axis in this band, which indicates that the measured EIS is dominated by the Coulomb counting in this band. In contrast, the simulated EIS suggests that the influence of the solid- and electrolyte-phase diffusion dynamics remains significant in this band [6,42]. It indicates that the diffusion time constants obtained from our identification are slightly larger than those exhibited by the measured EIS, which is attributed to the subtle inconsistency between the time-domain test and the frequency domain test due to the nonlinearity of the battery.

4.6. Discussion on the Influence of the Operating Point on Identification Results

The proposed parameter identification method uses the HPPC experimental data of three operating points in PCI, NCI, and ECI to simultaneously identify the four diffusion parameters. The following part provides a comparison of this method with the method that uses only PCI and NCI data and the method that uses all nine operating points (denoted as ACI).
The results for the parameters identified by the above three methods are shown in Table 6. The identification results using PCI and NCI data are substituted into FOMe, and the output voltages under HPPC profiles are shown in 
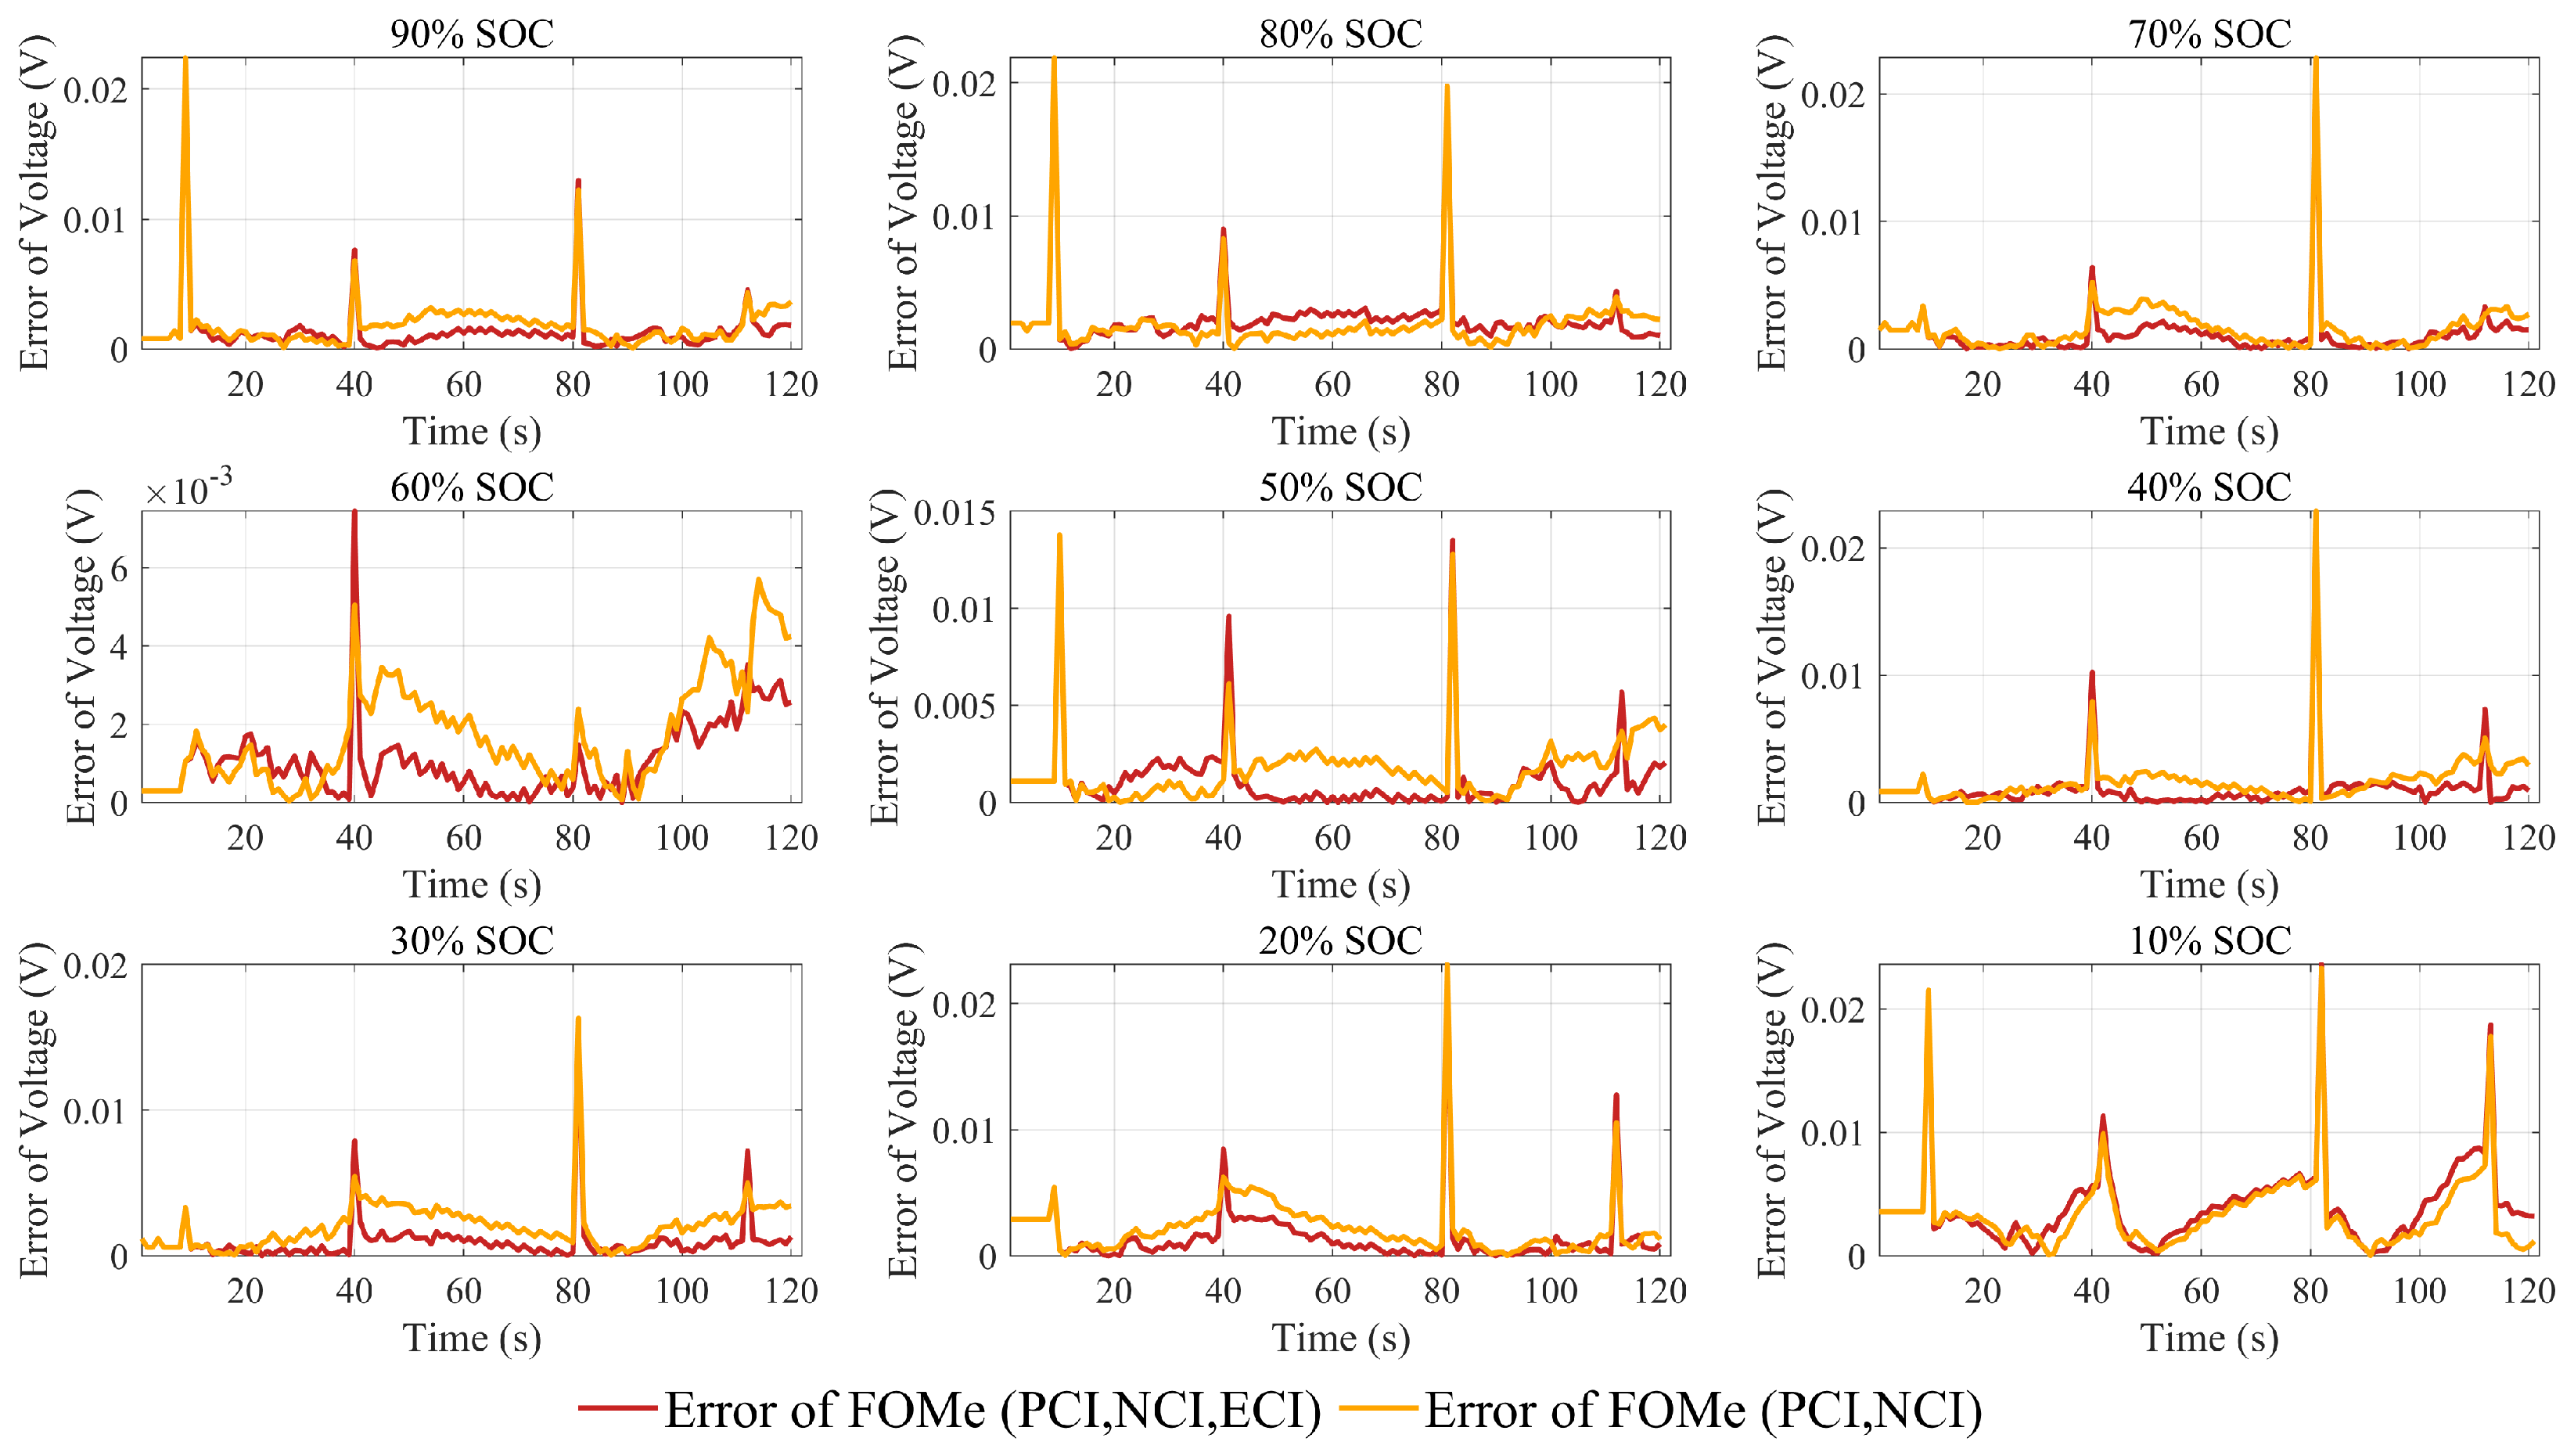
Figure 10. The voltage errors compared with the experiments are shown in Figure 12.
The error between the FOMe voltage and the experiment for the four profiles of HPPC, FUDS, DST, and NEDC under the above three sets of parameters are shown in Table 5.
According to Table 5, the identification results for the ACI allow FOMe to achieve the minimum error compared with the actual battery, followed by the identification results achieved using the PCI, NCI, and ECI. The identification results for the PCI and NCI allow FOMe to achieve the maximum error. In addition, the identification results for the ACI are similar to those of the PCI, NCI, and ECI, as shown in Table 6. Considering the time consumed by the three identification methods, it can be concluded that the method that uses the PCI, NCI, and ECI can yield high identification efficiency while ensuring the accuracy of parameter identification.

5. Conclusions

In this work, a fractional-order mechanistic model with simplified electrolyte-phase diffusion, named FOMe, is proposed. In addition, the parameter identification method of FOMe is presented. The key points of this study are summarized as follows:
  • A new FOMe model improves the accuracy of approximation to the P2D model with a slight increase in computational effort over the original model.
  • A method for determining the characteristic SOC intervals of positive and negative solid-phase diffusion and electrolyte-phase diffusion is given. The parameter identification method of FOMe is presented based on the three characteristic intervals. The paper also discusses the influence of the number of characteristic intervals used for parameter identification on the parameter identification results.
  • A verification framework that is based on simulation and physical experiments is proposed. First, based on the P2D model, the FOMe model and parameter identification method can be separately verified, thus ensuring the correctness of the content of the paper. Second, the physical experimental verification based on commercial NCM lithium batteries focuses on the overall verification of the "model + parameters". The results show that the proposed FOMe and parameter identification method exhibit high accuracy under complex operating conditions (e.g., NEDC).
Future work based on the proposed FOMe and its parameter identification method will address the following topics: (1) the use of more batteries of different batches and types to verify the model, (2) evaluation and improvement of the accuracy of the model in a wider range of application scenarios, such as under higher charging rates and extreme ambient temperatures, and (3) online parameter identification method of the model and aging diagnosis based on the model.

Author Contributions

Conceptualization, L.D. and G.Y.; methodology, Y.J.; software, D.G.; validation, L.L.; formal analysis, Y.J.; investigation, Y.J.; resources, D.G.; data curation, F.J.; writing—original draft preparation, Y.J.; writing—review and editing, G.Y.; supervision, L.L. and M.O.; project administration, L.D. and G.Y.; funding acquisition, G.Y. All authors have read and agreed to the published version of the manuscript.

Funding

This work was supported by the Delta Power Electronics Science and Education Development Program (Grant No. DREK2020001).

Institutional Review Board Statement

Not applicable.

Informed Consent Statement

Not applicable.

Data Availability Statement

Not applicable.

Conflicts of Interest

The authors declare no conflict of interest.

Abbreviations

The following abbreviations are used in this manuscript:
FOMFractional-order model
FOMeFractional-order model with electrolyte-phase diffusion
LiBLithium-ion battery
SPDSolid-phase diffusion
EPDElectrolyte-phase diffusion
SOCState of charge
PCICharacteristic interval of the positive electrode
NCICharacteristic interval of the negative electrode
ECICharacteristic interval of the electrolyte phase
HPPCHybrid pulse power characterization
FUDSFederal urban driving schedule
DSTDynamic stress test
NEDCNew European driving cycle
EISElectrochemical impedance spectrum
RMSERoot mean square error

Appendix A

Table A1. Parameters of P2D.
SymbolParameterUnitValueRange
Constant
FFaraday constantC/mol96,487
R g Ideal gas constantJ/(mol·K)8.314
TTemperatureK298.15
Geometric parameters and volume fractions
AArea of Electrode m 2 0.5 a0.4–0.6
δ p Lengthm 6.8 × 10 5 a 5 × 10 5 1 × 10 4
δ n 9 × 10 5 a 5 × 10 5 1 × 10 4
δ sep 3 × 10 5 a 2 × 10 5 4 × 10 4
R s Particle radiusm 1 × 10 6 [43] 5 × 10 7 2 × 10 6
ε e , p Volume fraction of the electrolyte phase10.444 [44]0.4–0.5
ε e , n 0.357 [44]0.3–0.4
ε e , sep 0.45 [44]0.4–0.5
ε s , p Volume fraction of the solid phase10.297 [44]0.4–0.5
ε s , n 0.471 [44]0.3–0.4
Transport properties
D s , p Solid-phase diffusion coefficient m 2 /s 1.14 × 10 15 [11] 5 × 10 16 5 × 10 14
D s , n 3.66 × 10 15 [11] 5 × 10 16 5 × 10 14
D e Electrolyte-phase diffusion coefficient m 2 /s 2.5 × 10 10 [41] 1 × 10 11 1 × 10 9
c e , 0 Initial concentration of L i + in electrolyte mol / m 3 1200 [43]800–1500
c s , p max Solid-phase maximum concentration of L i + mol / m 3 75,326 b
c s , n max 27,456 b
c s , p 0 Solid-phase initial concentration of L i + mol / m 3 5175 b
c s , n 0 27,107 b
t + Transference number10.35 [41]0.1–0.4
β Electrolyte activity coefficient10.9 [44]0.5–1
a The geometric parameters are derived from measurements of the NCM battery. b The thermodynamic parameters are identified from the low-rate discharging test.

References

  1. Lee, J.; Nam, O.; Cho, B. Li-ion battery SOC estimation method based on the reduced order extended Kalman filtering. J. Power Sources 2007, 174, 9–15. [Google Scholar] [CrossRef]
  2. Li, J.; Adewuyi, K.; Lotfi, N.; Landers, R.G.; Park, J. A single particle model with chemical/mechanical degradation physics for lithium ion battery State of Health (SOH) estimation. Appl. Energy 2018, 212, 1178–1190. [Google Scholar] [CrossRef]
  3. Uddin, K.; Perera, S.; Widanage, W.D.; Somerville, L.; Marco, J. Characterising lithium-ion battery degradation through the identification and tracking of electrochemical battery model parameters. Batteries 2016, 2, 13. [Google Scholar] [CrossRef]
  4. Hosseinzadeh, E.; Marco, J.; Jennings, P. Electrochemical-thermal modelling and optimisation of lithium-ion battery design parameters using analysis of variance. Energies 2017, 10, 1278. [Google Scholar] [CrossRef]
  5. Tran, M.K.; DaCosta, A.; Mevawalla, A.; Panchal, S.; Fowler, M. Comparative study of equivalent circuit models performance in four common lithium-ion batteries: LFP, NMC, LMO, NCA. Batteries 2021, 7, 51. [Google Scholar] [CrossRef]
  6. Wang, J.; Huang, Q.A.; Li, W.; Wang, J.; Bai, Y.; Zhao, Y.; Li, X.; Zhang, J. Insight into the origin of pseudo peaks decoded by the distribution of relaxation times/differential capacity method for electrochemical impedance spectroscopy. J. Electroanal. Chem. 2022, 910, 116176. [Google Scholar] [CrossRef]
  7. Doyle, M.; Newman, J.; Gozdz, A.S.; Schmutz, C.N.; Tarascon, J.M. Comparison of modeling predictions with experimental data from plastic lithium ion cells. J. Electrochem. Soc. 1996, 143, 1890. [Google Scholar] [CrossRef]
  8. Al-Gabalawy, M.; Hosny, N.S.; Hussien, S.A. Lithium-ion battery modeling including degradation based on single-particle approximations. Batteries 2020, 6, 37. [Google Scholar] [CrossRef]
  9. Fan, G. Systematic parameter identification of a control-oriented electrochemical battery model and its application for state of charge estimation at various operating conditions. J. Power Sources 2020, 470, 228153. [Google Scholar] [CrossRef]
  10. Yuan, S.; Jiang, L.; Yin, C.; Wu, H.; Zhang, X. A transfer function type of simplified electrochemical model with modified boundary conditions and Padé approximation for Li-ion battery: Part 1. lithium concentration estimation. J. Power Sources 2017, 352, 245–257. [Google Scholar] [CrossRef]
  11. Guo, D.; Yang, G.; Feng, X.; Han, X.; Lu, L.; Ouyang, M. Physics-based fractional-order model with simplified solid-phase diffusion of lithium-ion battery. J. Energy Storage 2020, 30, 101404. [Google Scholar] [CrossRef]
  12. Li, C.; Cui, N.; Wang, C.; Zhang, C. Simplified electrochemical lithium-ion battery model with variable solid-phase diffusion and parameter identification over wide temperature range. J. Power Sources 2021, 497, 229900. [Google Scholar] [CrossRef]
  13. Li, C.; Cui, N.; Wang, C.; Zhang, C. Reduced-order electrochemical model for lithium-ion battery with domain decomposition and polynomial approximation methods. Energy 2021, 221, 119662. [Google Scholar] [CrossRef]
  14. Pang, H.; Mou, L.; Guo, L.; Zhang, F. Parameter identification and systematic validation of an enhanced single-particle model with aging degradation physics for Li-ion batteries. Electrochim. Acta 2019, 307, 474–487. [Google Scholar] [CrossRef]
  15. Han, X.; Ouyang, M.; Lu, L.; Li, J. Simplification of physics-based electrochemical model for lithium ion battery on electric vehicle. Part I: Diffusion simplification and single particle model. J. Power Sources 2015, 278, 802–813. [Google Scholar] [CrossRef]
  16. Kim, J.; Chun, H.; Kim, M.; Han, S.; Lee, J.W.; Lee, T.K. Effective and practical parameters of electrochemical Li-ion battery models for degradation diagnosis. J. Energy Storage 2021, 42, 103077. [Google Scholar] [CrossRef]
  17. Zhou, X.; Huang, J.; Pan, Z.; Ouyang, M. Impedance characterization of lithium-ion batteries aging under high-temperature cycling: Importance of electrolyte-phase diffusion. J. Power Sources 2019, 426, 216–222. [Google Scholar] [CrossRef]
  18. Xu, J.; Wang, T.; Pei, L.; Mao, S.; Zhu, C. Parameter identification of electrolyte decomposition state in lithium-ion batteries based on a reduced pseudo two-dimensional model with Padé approximation. J. Power Sources 2020, 460, 228093. [Google Scholar] [CrossRef]
  19. Gao, Y.; Liu, C.; Chen, S.; Zhang, X.; Fan, G.; Zhu, C. Development and parameterization of a control-oriented electrochemical model of lithium-ion batteries for battery-management-systems applications. Appl. Energy 2022, 309, 118521. [Google Scholar] [CrossRef]
  20. Andersson, M.; Streb, M.; Ko, J.Y.; Klass, V.L.; Klett, M.; Ekström, H.; Johansson, M.; Lindbergh, G. Parametrization of physics-based battery models from input–output data: A review of methodology and current research. J. Power Sources 2022, 521, 230859. [Google Scholar] [CrossRef]
  21. Chu, Z.; Jobman, R.; Rodriguez, A.; Plett, G.L.; Trimboli, M.S.; Feng, X.; Ouyang, M. A control-oriented electrochemical model for lithium-ion battery. Part II: Parameter identification based on reference electrode. J. Energy Storage 2020, 27, 101101. [Google Scholar] [CrossRef]
  22. Han, X.; Ouyang, M.; Lu, L.; Li, J. A comparative study of commercial lithium ion battery cycle life in electric vehicle: Capacity loss estimation. J. Power Sources 2014, 268, 658–669. [Google Scholar] [CrossRef]
  23. Lou, T.T.; Zhang, W.G.; Guo, H.Y.; Wang, J.S. The internal resistance characteristics of lithium-ion battery based on HPPC method. Adv. Mater. Res. 2012, 455–456, 246–251. [Google Scholar] [CrossRef]
  24. Shen, Z.; Cao, L.; Rahn, C.D.; Wang, C.Y. Least squares galvanostatic intermittent titration technique (LS-GITT) for accurate solid-phase diffusivity measurement. J. Electrochem. Soc. 2013, 160, A1842. [Google Scholar] [CrossRef]
  25. Rahman, M.A.; Anwar, S.; Izadian, A. Electrochemical model parameter identification of a lithium-ion battery using particle swarm optimization method. J. Power Sources 2016, 307, 86–97. [Google Scholar] [CrossRef]
  26. Zhang, L.; Lyu, C.; Wang, L.; Zheng, J.; Luo, W.; Ma, K. Parallelized genetic identification of the thermal-electrochemical model for lithium-ion battery. Adv. Mech. Eng. 2013, 5, 754653. [Google Scholar] [CrossRef]
  27. Chen, L.; Xu, R.; Rao, W.; Li, H.; Wang, Y.P.; Jiang, T.Y.H.B. Electrochemical model parameter identification of lithium-ion battery with temperature and current dependence. Int. J. Electrochem. Sci. 2019, 14, 4124–4143. [Google Scholar] [CrossRef]
  28. Chun, H.; Kim, J.; Han, S. Parameter identification of an electrochemical lithium-ion battery model with convolutional neural network. IFAC-PapersOnLine 2019, 52, 129–134. [Google Scholar] [CrossRef]
  29. Guo, D.; Yang, G.; Han, X.; Feng, X.; Lu, L.; Ouyang, M. Parameter identification of fractional-order model with transfer learning for aging lithium-ion batteries. Int. J. Energy Res. 2021, 45, 12825–12837. [Google Scholar] [CrossRef]
  30. Kim, M.; Chun, H.; Kim, J.; Kim, K.; Yu, J.; Kim, T.; Han, S. Data-efficient parameter identification of electrochemical lithium-ion battery model using deep Bayesian harmony search. Appl. Energy 2019, 254, 113644. [Google Scholar] [CrossRef]
  31. Zhu, R.; Duan, B.; Zhang, C.; Gong, S. Accurate lithium-ion battery modeling with inverse repeat binary sequence for electric vehicle applications. Appl. Energy 2019, 251, 113339. [Google Scholar] [CrossRef]
  32. Lai, Q.; Ahn, H.J.; Kim, Y.; Kim, Y.N.; Lin, X. New data optimization framework for parameter estimation under uncertainties with application to lithium-ion battery. Appl. Energy 2021, 295, 117034. [Google Scholar] [CrossRef]
  33. Jokar, A.; Rajabloo, B.; Désilets, M.; Lacroix, M. An inverse method for estimating the electrochemical parameters of lithium-ion batteries. J. Electrochem. Soc. 2016, 163, A2876. [Google Scholar] [CrossRef]
  34. Wang, D.; Zhang, Q.; Huang, H.; Yang, B.; Dong, H.; Zhang, J. An electrochemical–thermal model of lithium-ion battery and state of health estimation. J. Energy Storage 2022, 47, 103528. [Google Scholar] [CrossRef]
  35. Yu, H.; Li, J.; Ji, Y.; Pecht, M. Life-cycle parameter identification method of an electrochemical model for lithium-ion battery pack. J. Energy Storage 2022, 47, 103591. [Google Scholar] [CrossRef]
  36. Xu, L.; Lin, X.; Xie, Y.; Hu, X. Enabling high-fidelity electrochemical P2D modeling of lithium-ion batteries via fast and non-destructive parameter identification. Energy Storage Mater. 2022, 45, 952–968. [Google Scholar] [CrossRef]
  37. Zhu, J.; Wang, Y.; Huang, Y.; Bhushan Gopaluni, R.; Cao, Y.; Heere, M.; Mühlbauer, M.J.; Mereacre, L.; Dai, H.; Liu, X.; et al. Data-driven capacity estimation of commercial lithium-ion batteries from voltage relaxation. Nat. Commun. 2022, 13, 2261. [Google Scholar] [CrossRef]
  38. Han, X.; Ouyang, M.; Lu, L.; Li, J. Simplification of physics-based electrochemical model for lithium ion battery on electric vehicle. Part II: Pseudo-two-dimensional model simplification and state of charge estimation. J. Power Sources 2015, 278, 814–825. [Google Scholar] [CrossRef]
  39. Lyu, C.; Song, Y.; Zheng, J.; Luo, W.; Hinds, G.; Li, J.; Wang, L. In situ monitoring of lithium-ion battery degradation using an electrochemical model. Appl. Energy 2019, 250, 685–696. [Google Scholar] [CrossRef]
  40. Singh, S.; Weeber, M.; Birke, K.P. Implementation of Battery Digital Twin: Approach, Functionalities and Benefits. Batteries 2021, 7, 78. [Google Scholar] [CrossRef]
  41. Edouard, C.; Petit, M.; Forgez, C.; Bernard, J.; Revel, R. Parameter sensitivity analysis of a simplified electrochemical and thermal model for Li-ion batteries aging. J. Power Sources 2016, 325, 482–494. [Google Scholar] [CrossRef]
  42. Guo, D.; Yang, G.; Zhao, G.; Yi, M.; Feng, X.; Han, X.; Lu, L.; Ouyang, M. Determination of the differential capacity of lithium-ion batteries by the deconvolution of electrochemical impedance spectra. Energies 2020, 13, 915. [Google Scholar] [CrossRef]
  43. Ren, D.; Smith, K.; Guo, D.; Han, X.; Feng, X.; Lu, L.; Ouyang, M.; Li, J. Investigation of lithium plating-stripping process in Li-ion batteries at low temperature using an electrochemical model. J. Electrochem. Soc. 2018, 165, A2167. [Google Scholar] [CrossRef]
  44. COMSOL AB. 1D Isothermal Lithium-Ion Battery. [EB/OL]. Available online: https://cn.comsol.com/model/1d-isothermal-lithium-ion-battery-686 (accessed on 8 December 2021).
Figure 1. Schematic of the lithium-ion battery P2D model.
Batteries 08 00090 g001
Figure 2. Typical EIS of lithium-ion batteries.
Batteries 08 00090 g002
Figure 3. Block diagram of FOMe.
Batteries 08 00090 g003
Figure 4. Block diagram of the verification method of FOMe and the parameter identification method.
Batteries 08 00090 g004
Figure 5. Current of (a) HPPC profile, (b) FUDS profile, (c) DST profile, and (d) NEDC profile.
Batteries 08 00090 g005
Figure 6. Positive and negative OCP and double-tank model simulation voltage.
Batteries 08 00090 g006
Figure 7. Slopes of positive and negative OCPs curves with SOC.
Batteries 08 00090 g007
Figure 8. (a) Voltage of P2D and FOMe under the FUDS profile, and (b) the error.
Batteries 08 00090 g008
Figure 9. Positive SPD overpotential, negative SPD overpotential, and EPD overpotential of P2D at the operating point of (a) 90% SOC (b) 30% SOC, and (c) 10% SOC.
Batteries 08 00090 g009
Figure 10. Voltage of the experiment and FOMe at nine operating points of the HPPC profile.
Batteries 08 00090 g010
Figure 11. Voltage of experiment and FOMe under (a) FUDS profile, (b) DST profile, (c) NEDC profile, and (d) the EISs of experiment and FOMe.
Batteries 08 00090 g011
Figure 12. Voltage error between the experiment and FOMe under HPPC.
Batteries 08 00090 g012
Table 1. Specifications of the battery.
TermValue
Positive electrodeNCM-LMO
Negative electrodeGraphite
TypeWX1413724
Rated capacity (Ah)24
Charge cut-off voltage (V)4.2
Discharge cut-off voltage (V)2.5
Table 2. Parameter configuration of FOMe.
SymbolParameterUnitValueRange
Q p Capacity of positive electrodeAh28.5420–30
Q n Capacity of negative electrodeAh21.8320–30
S O C p 0 Initial SOC of positive electrode16.87%0–20%
S O C n 0 Initial SOC of positive electrode198.73%80–100%
τ p Time constant of SPD in positive electrodes150020–3000
τ n Time constant of SPD in negative electrodes200020–3000
T e Time constant of EPDs26.485–735
K e Open-loop gain of electrolyte overpotential Ω 1.21 × 10 3 1.5 × 10 4 –0.01
RLumped resistance Ω 1.74 × 10 3 1 × 10 3 3 × 10 3
Table 3. Parameters’ ground truth of P2D and identification results.
τ p (s) τ n (s) K e ( Ω ) T e (s)
Ground truth15002000 1.19 × 10 3 26.4
Identification result14051859 1.12 × 10 3 22.9
Relative error6.3%7.1%5.8%13.2%
Table 4. Parameters’ identification result of FOMe.
τ p (s) τ n (s) K e ( Ω ) T e (s)
Identification result3962012 2.0 × 10 3 54.7
Table 5. Error between FOMe and experiment voltage (RMSE).
Data Used for IdentificationHPPC (mV)FUDS (mV)DST (mV)NEDC (mV)
ACI2.742.461.642.27
PCI and NCI and ECI2.752.511.672.28
PCI and NCI3.042.641.902.48
Table 6. Parameters’ identification results for the three methods.
Data Used for Identification τ p (s) τ n (s) K e ( Ω ) T e (s)Identification Time (min)
ACI4311939 2.036 × 10 3 58193
PCI & NCI & ECI3972012 2.004 × 10 3 5527
PCI & NCI2501725 2.331 × 10 3 5120
Publisher’s Note: MDPI stays neutral with regard to jurisdictional claims in published maps and institutional affiliations.

