
Development of an Innovative Procedure for Lithium Plating Limitation and Characterization of 18650 Cycle Aged Cells for DCFC Automotive Applications

 , , , , , , and
Abstract
:1. Introduction
2. Materials and Methods
2.1. Battery Cells
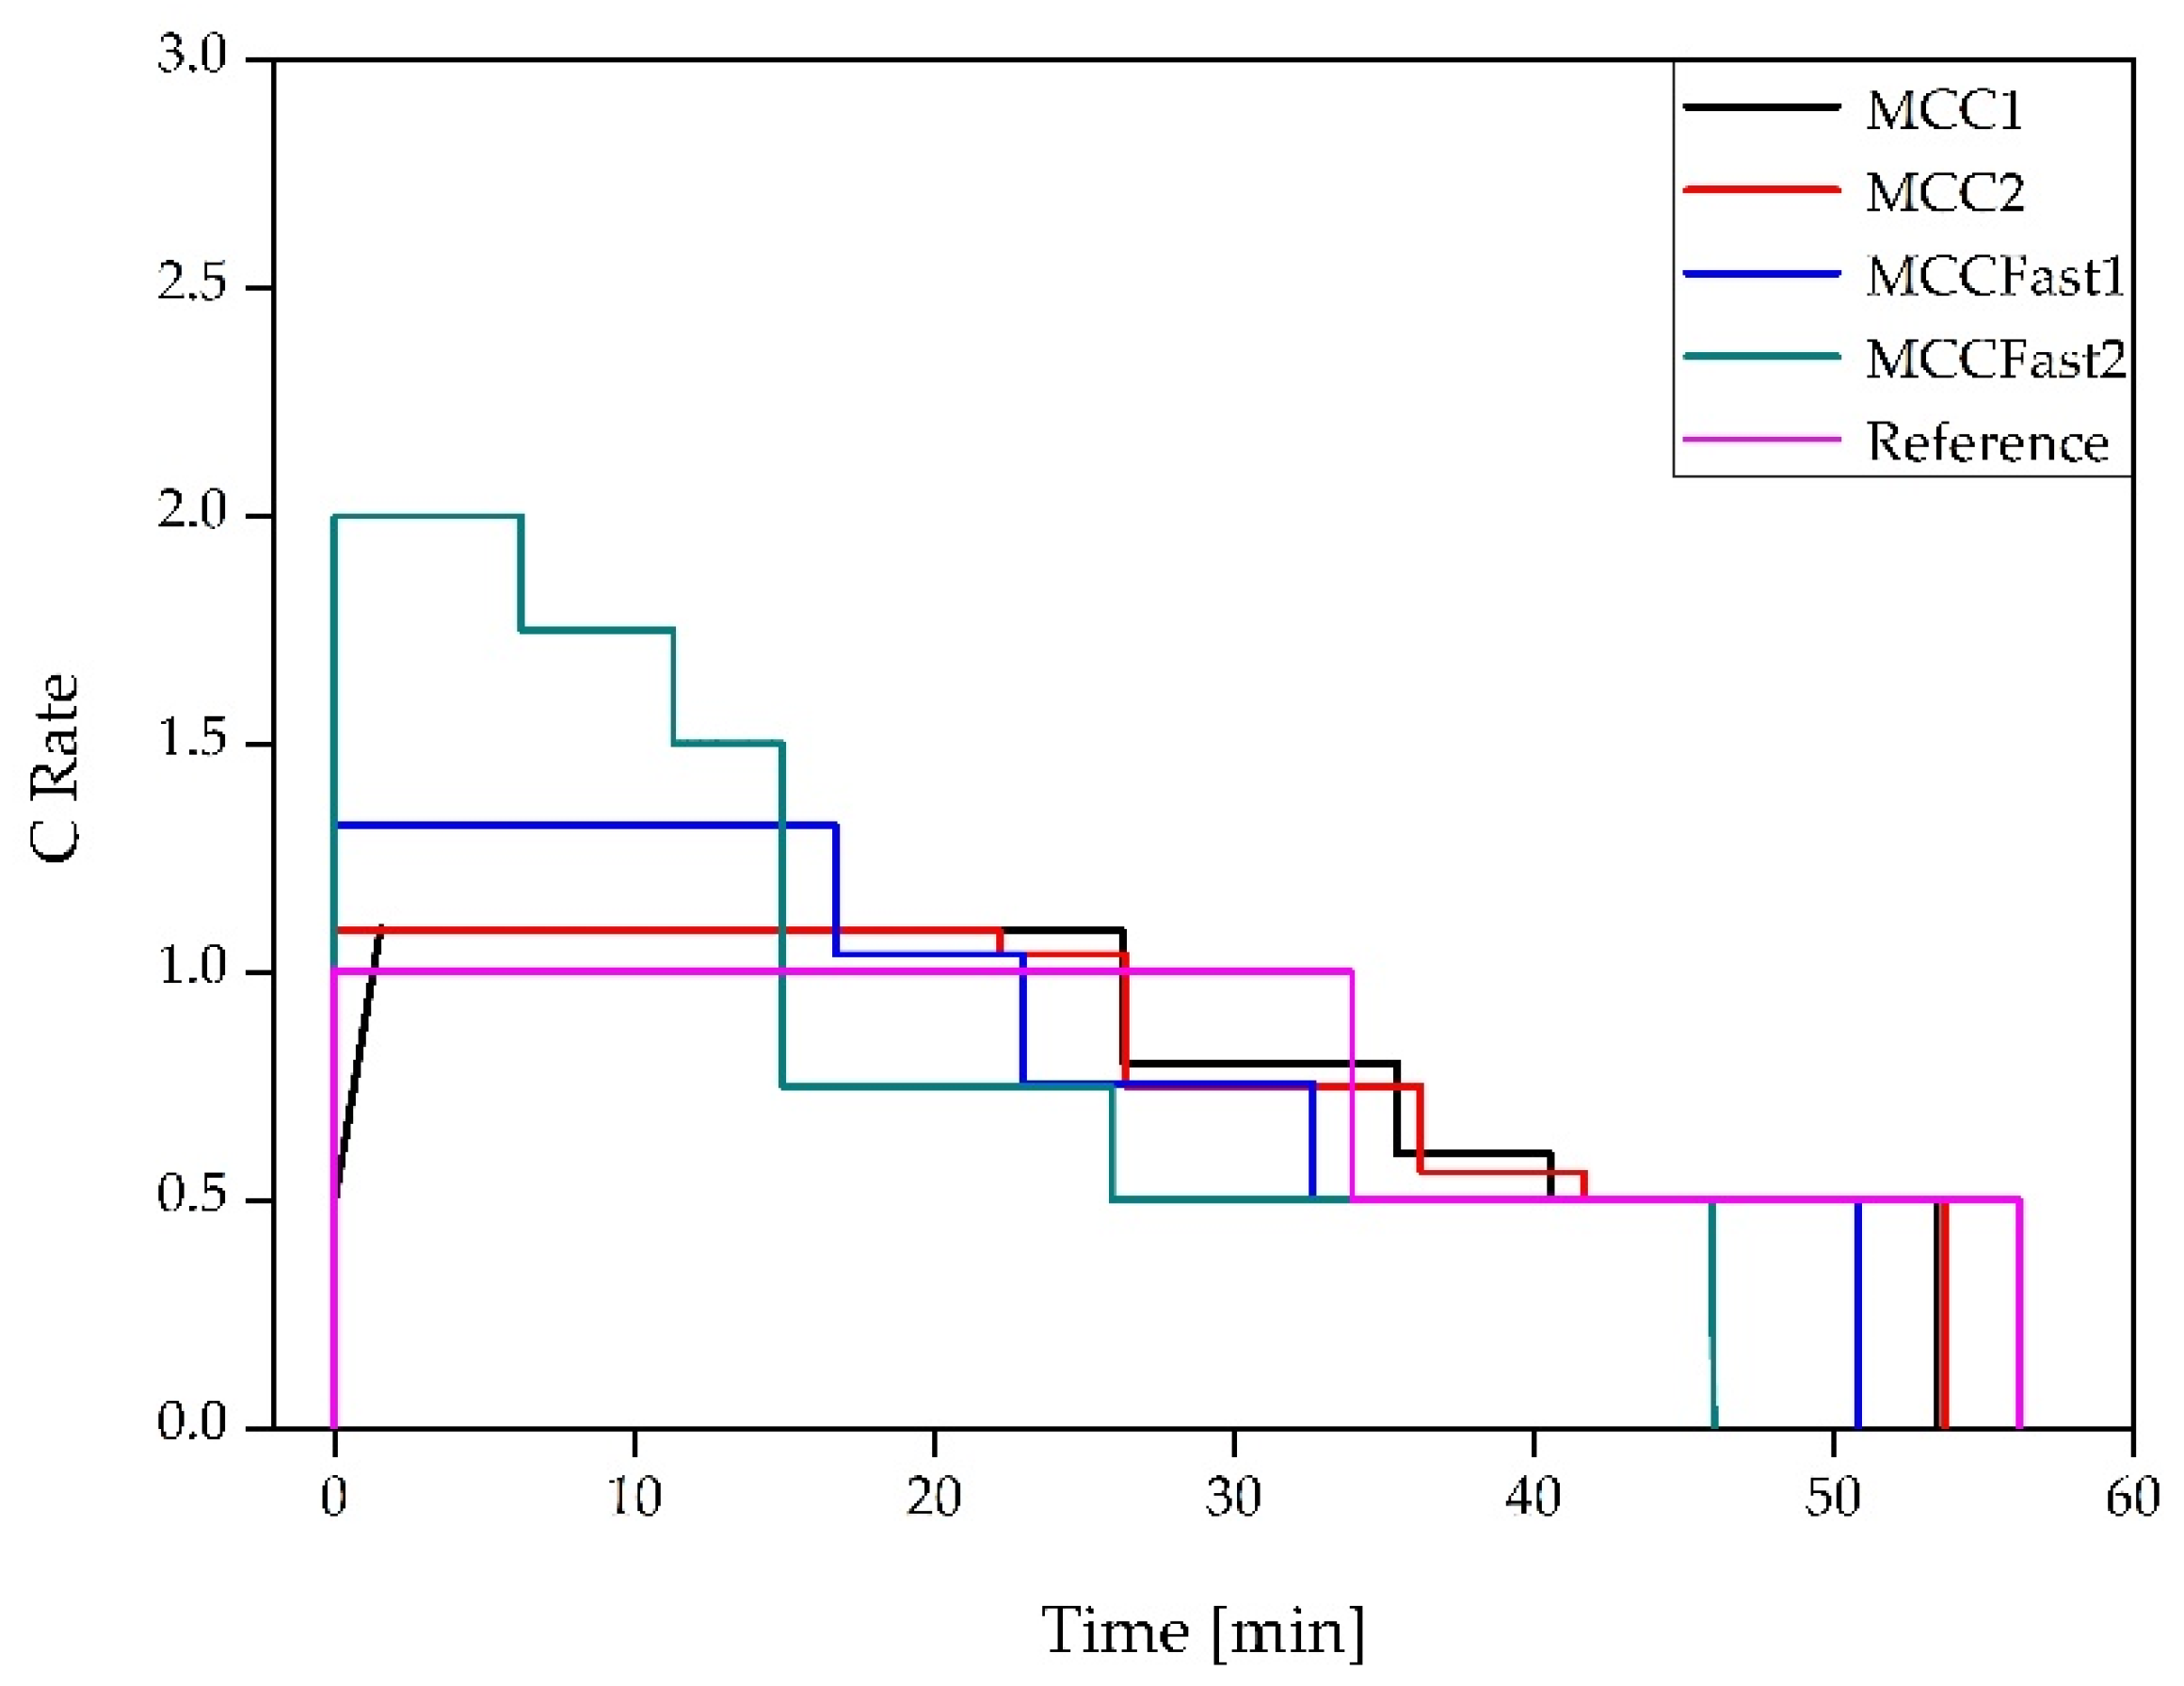
2.2. Cycling Condition and Experimental Setup
2.2.1. Testing Facilities
2.2.2. Electrochemical Testing
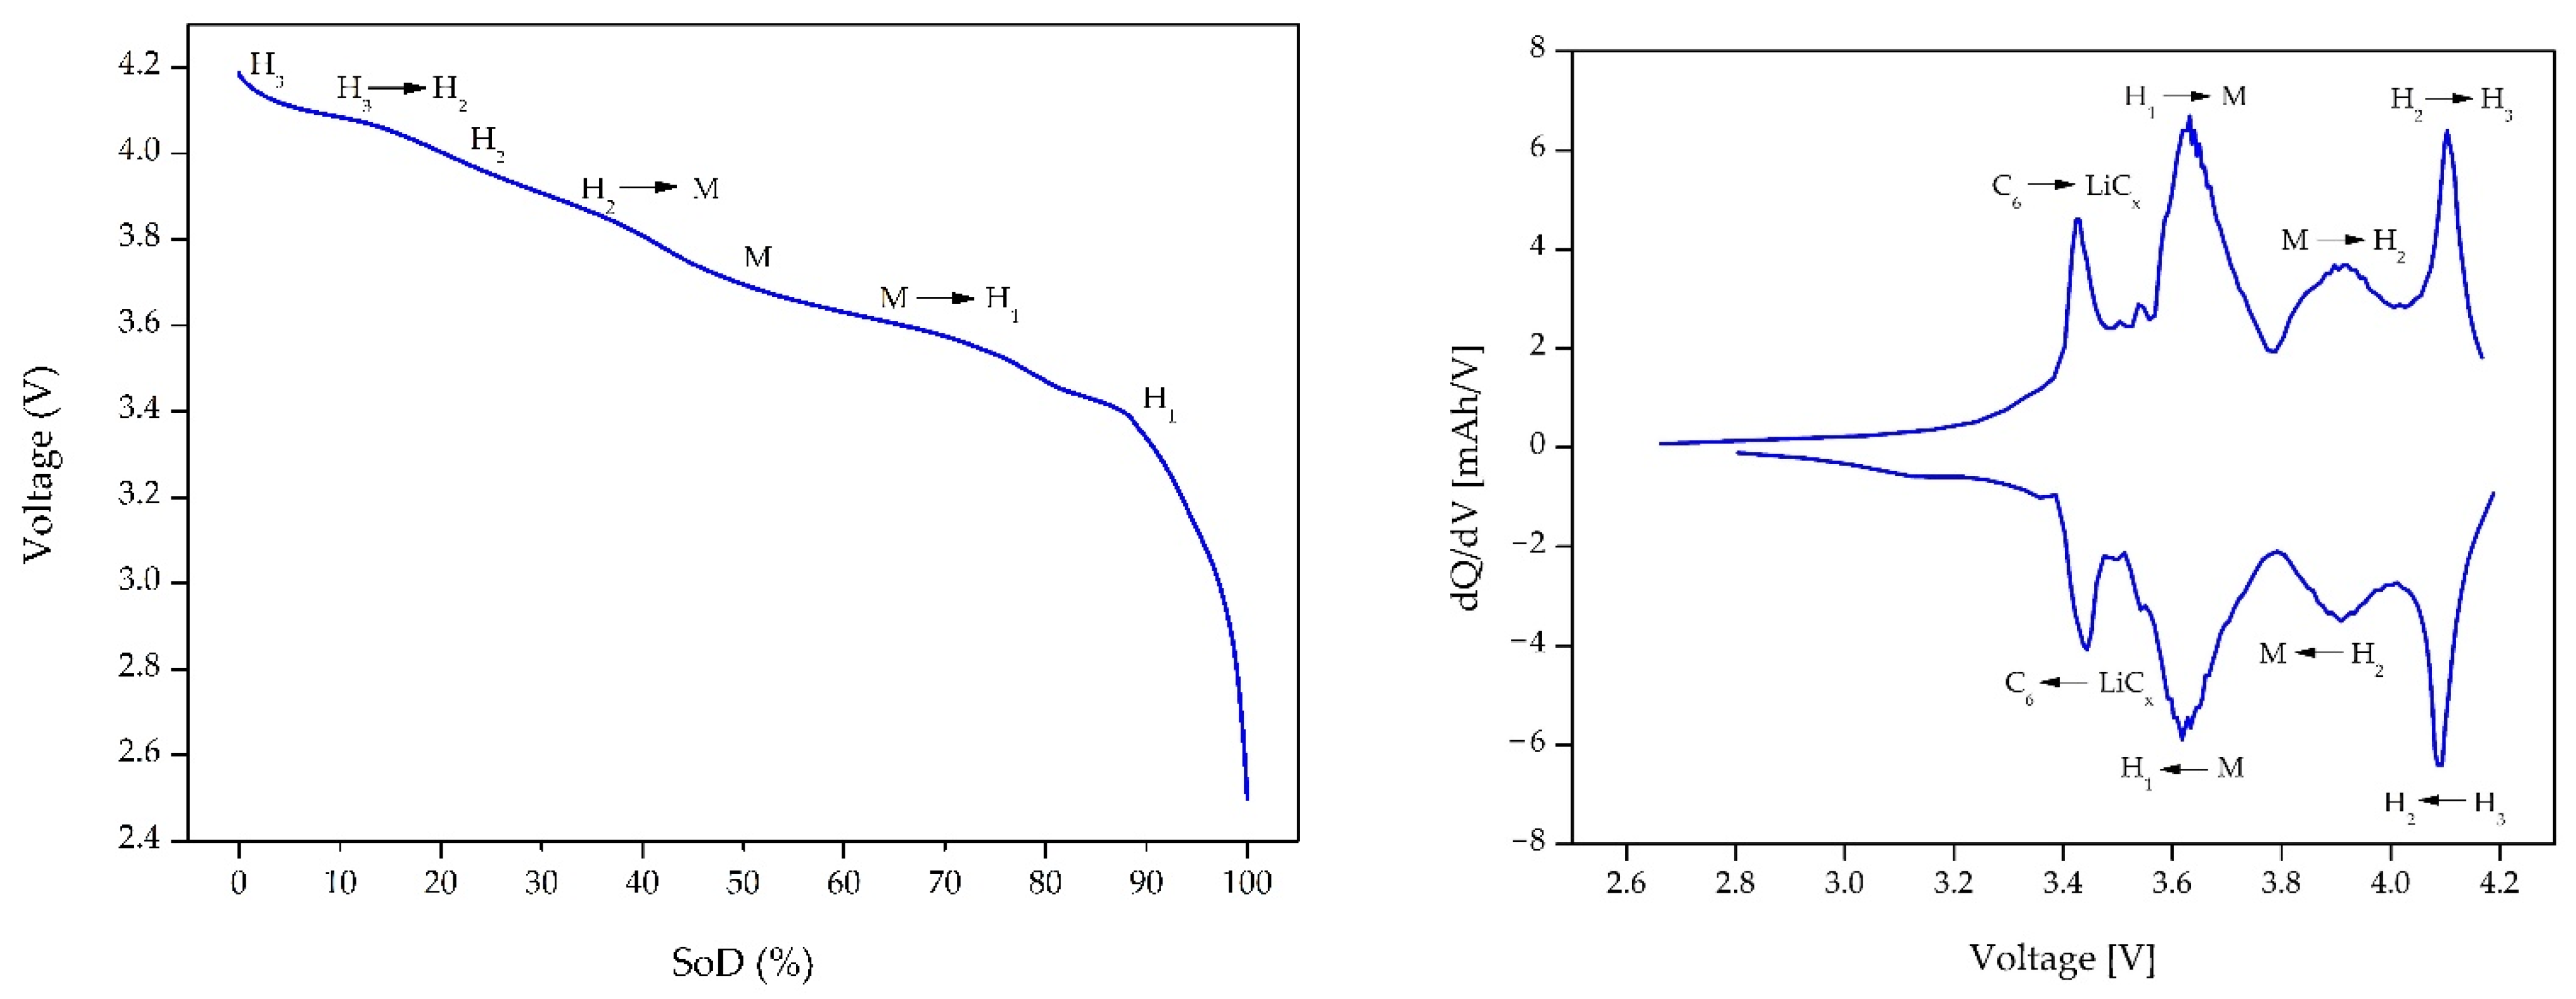
2.2.3. Incremental Capacity Analysis
2.3. Teardown and Sampling
2.4. XRD Analysis
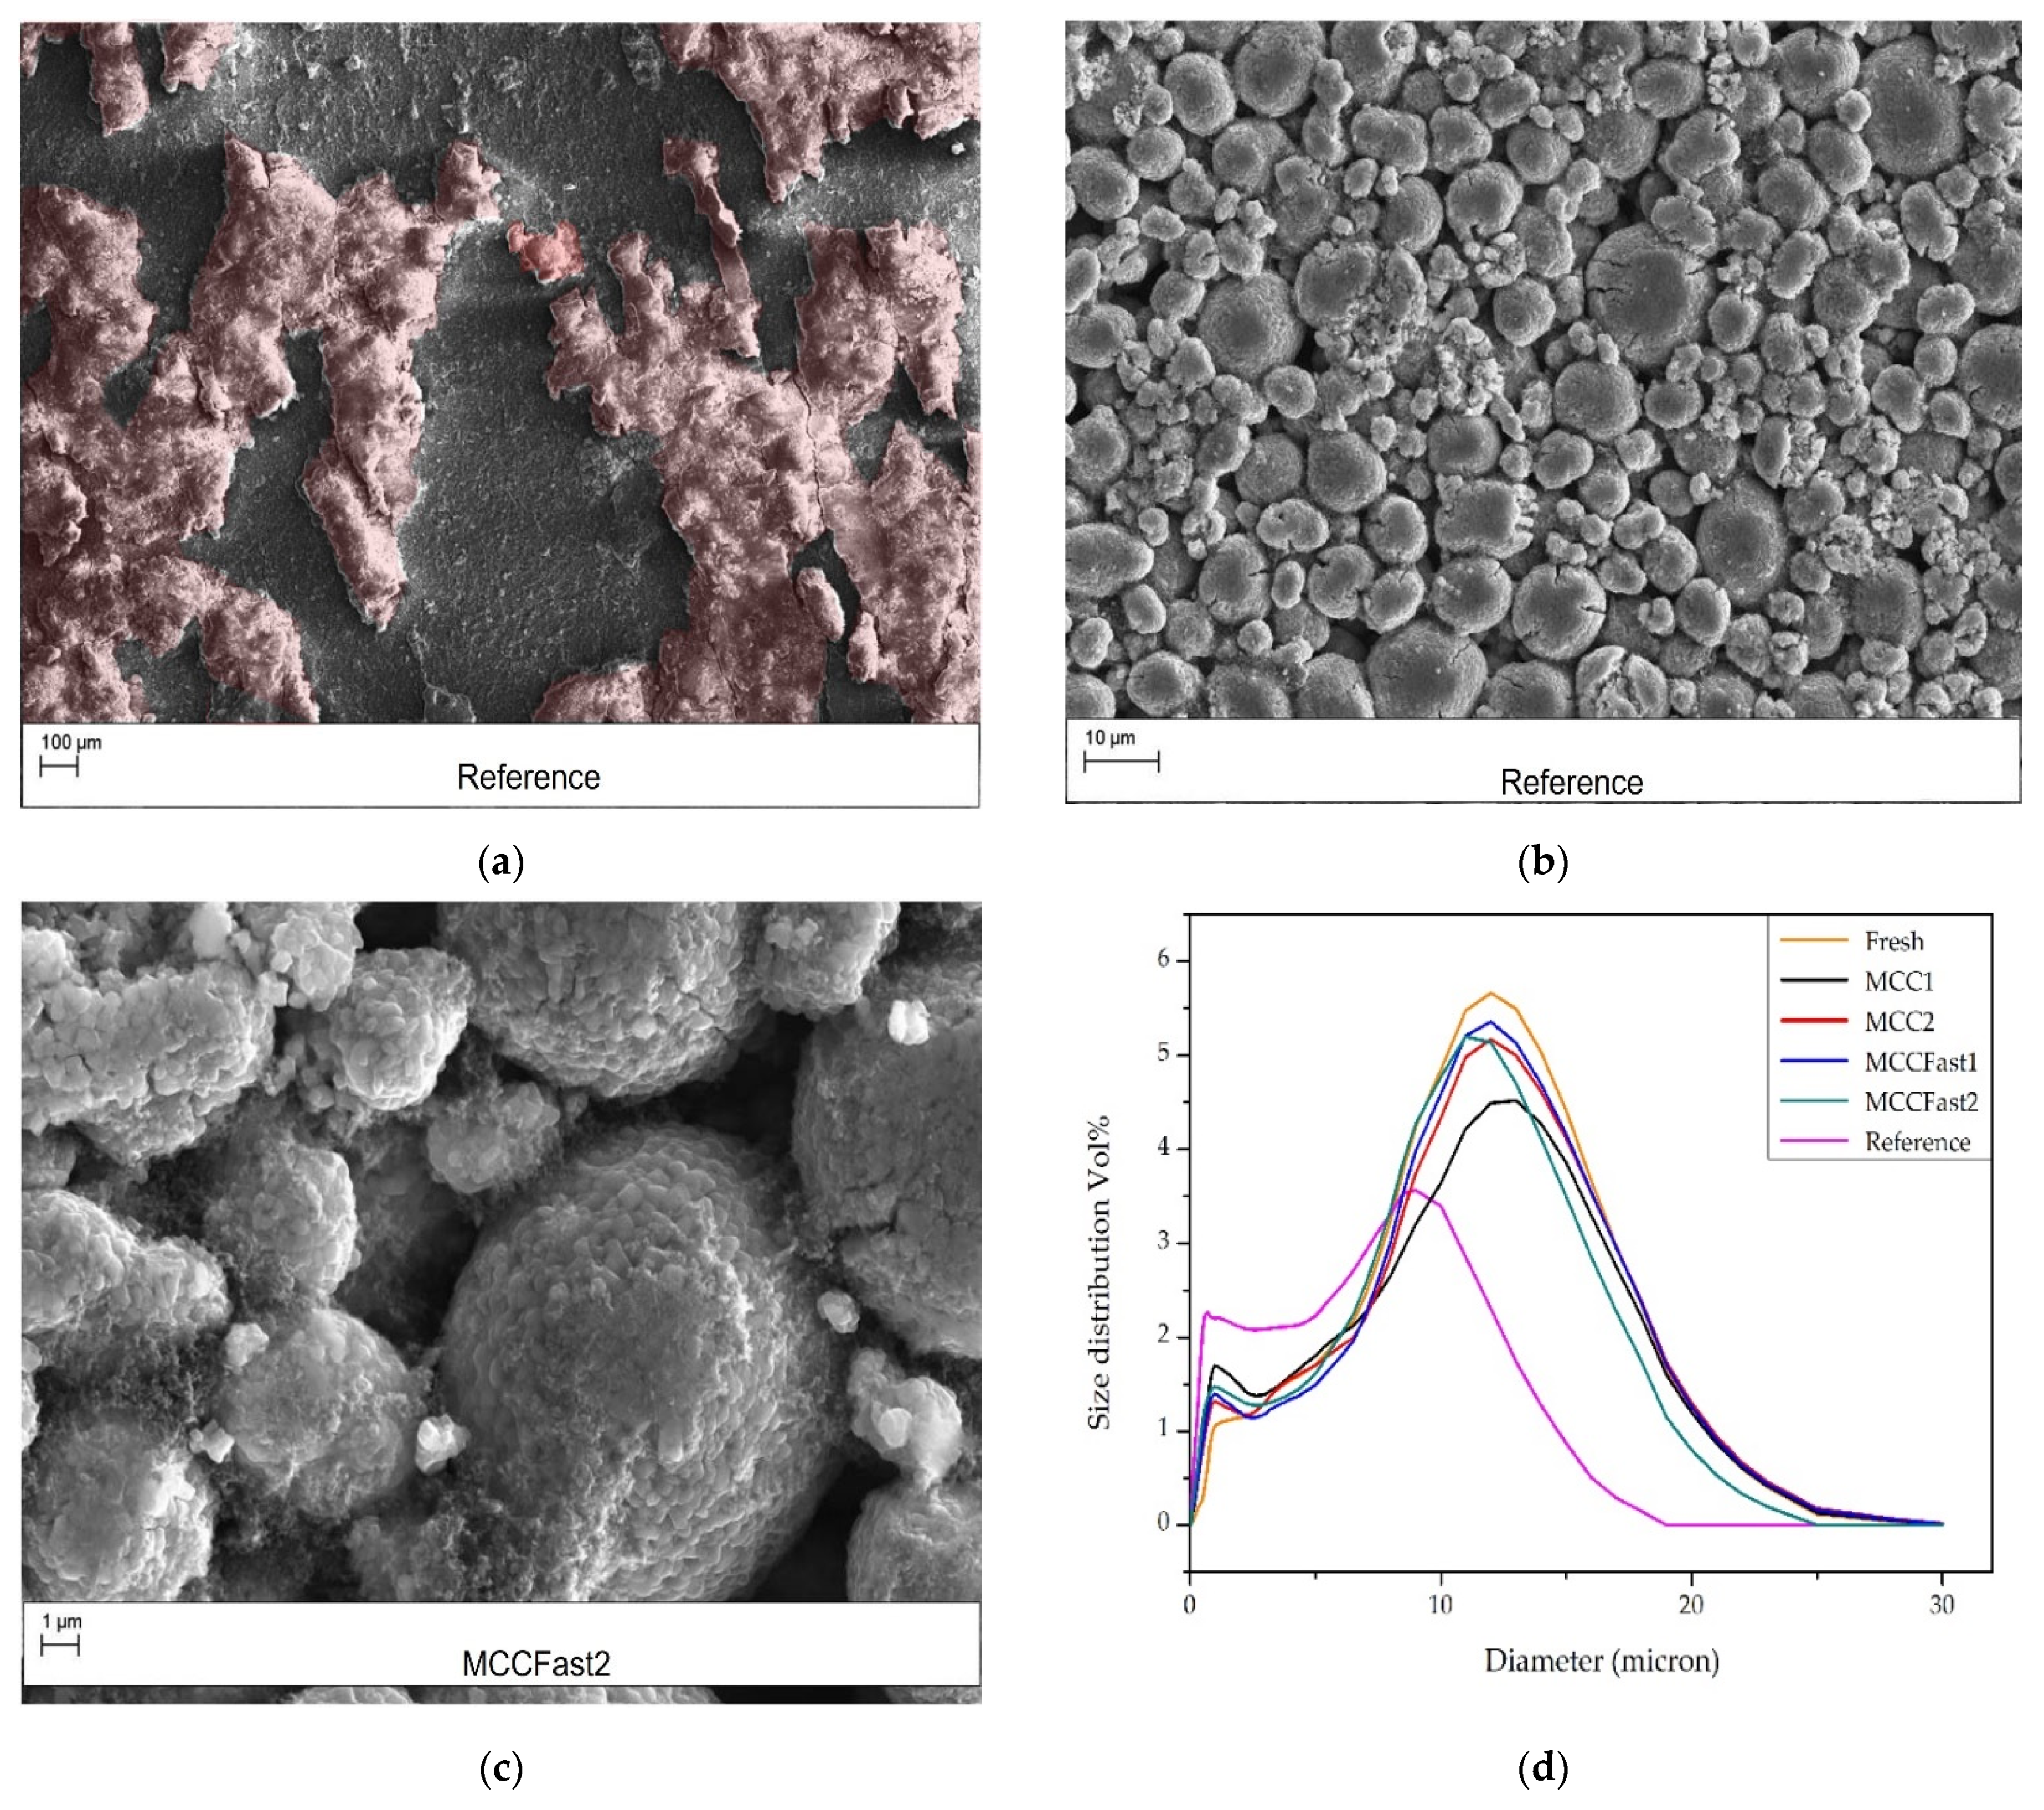
2.5. SEM/EDX
2.6. Particle Size Analysis
2.7. ICP-OES Analysis
2.8. Lab Scale Cells Preparation and Electrochemical Performances Tests
2.8.1. Samples Dismantling Procedure
2.8.2. Samples Selection
2.8.3. Lab Scale Cell Building
3. Results
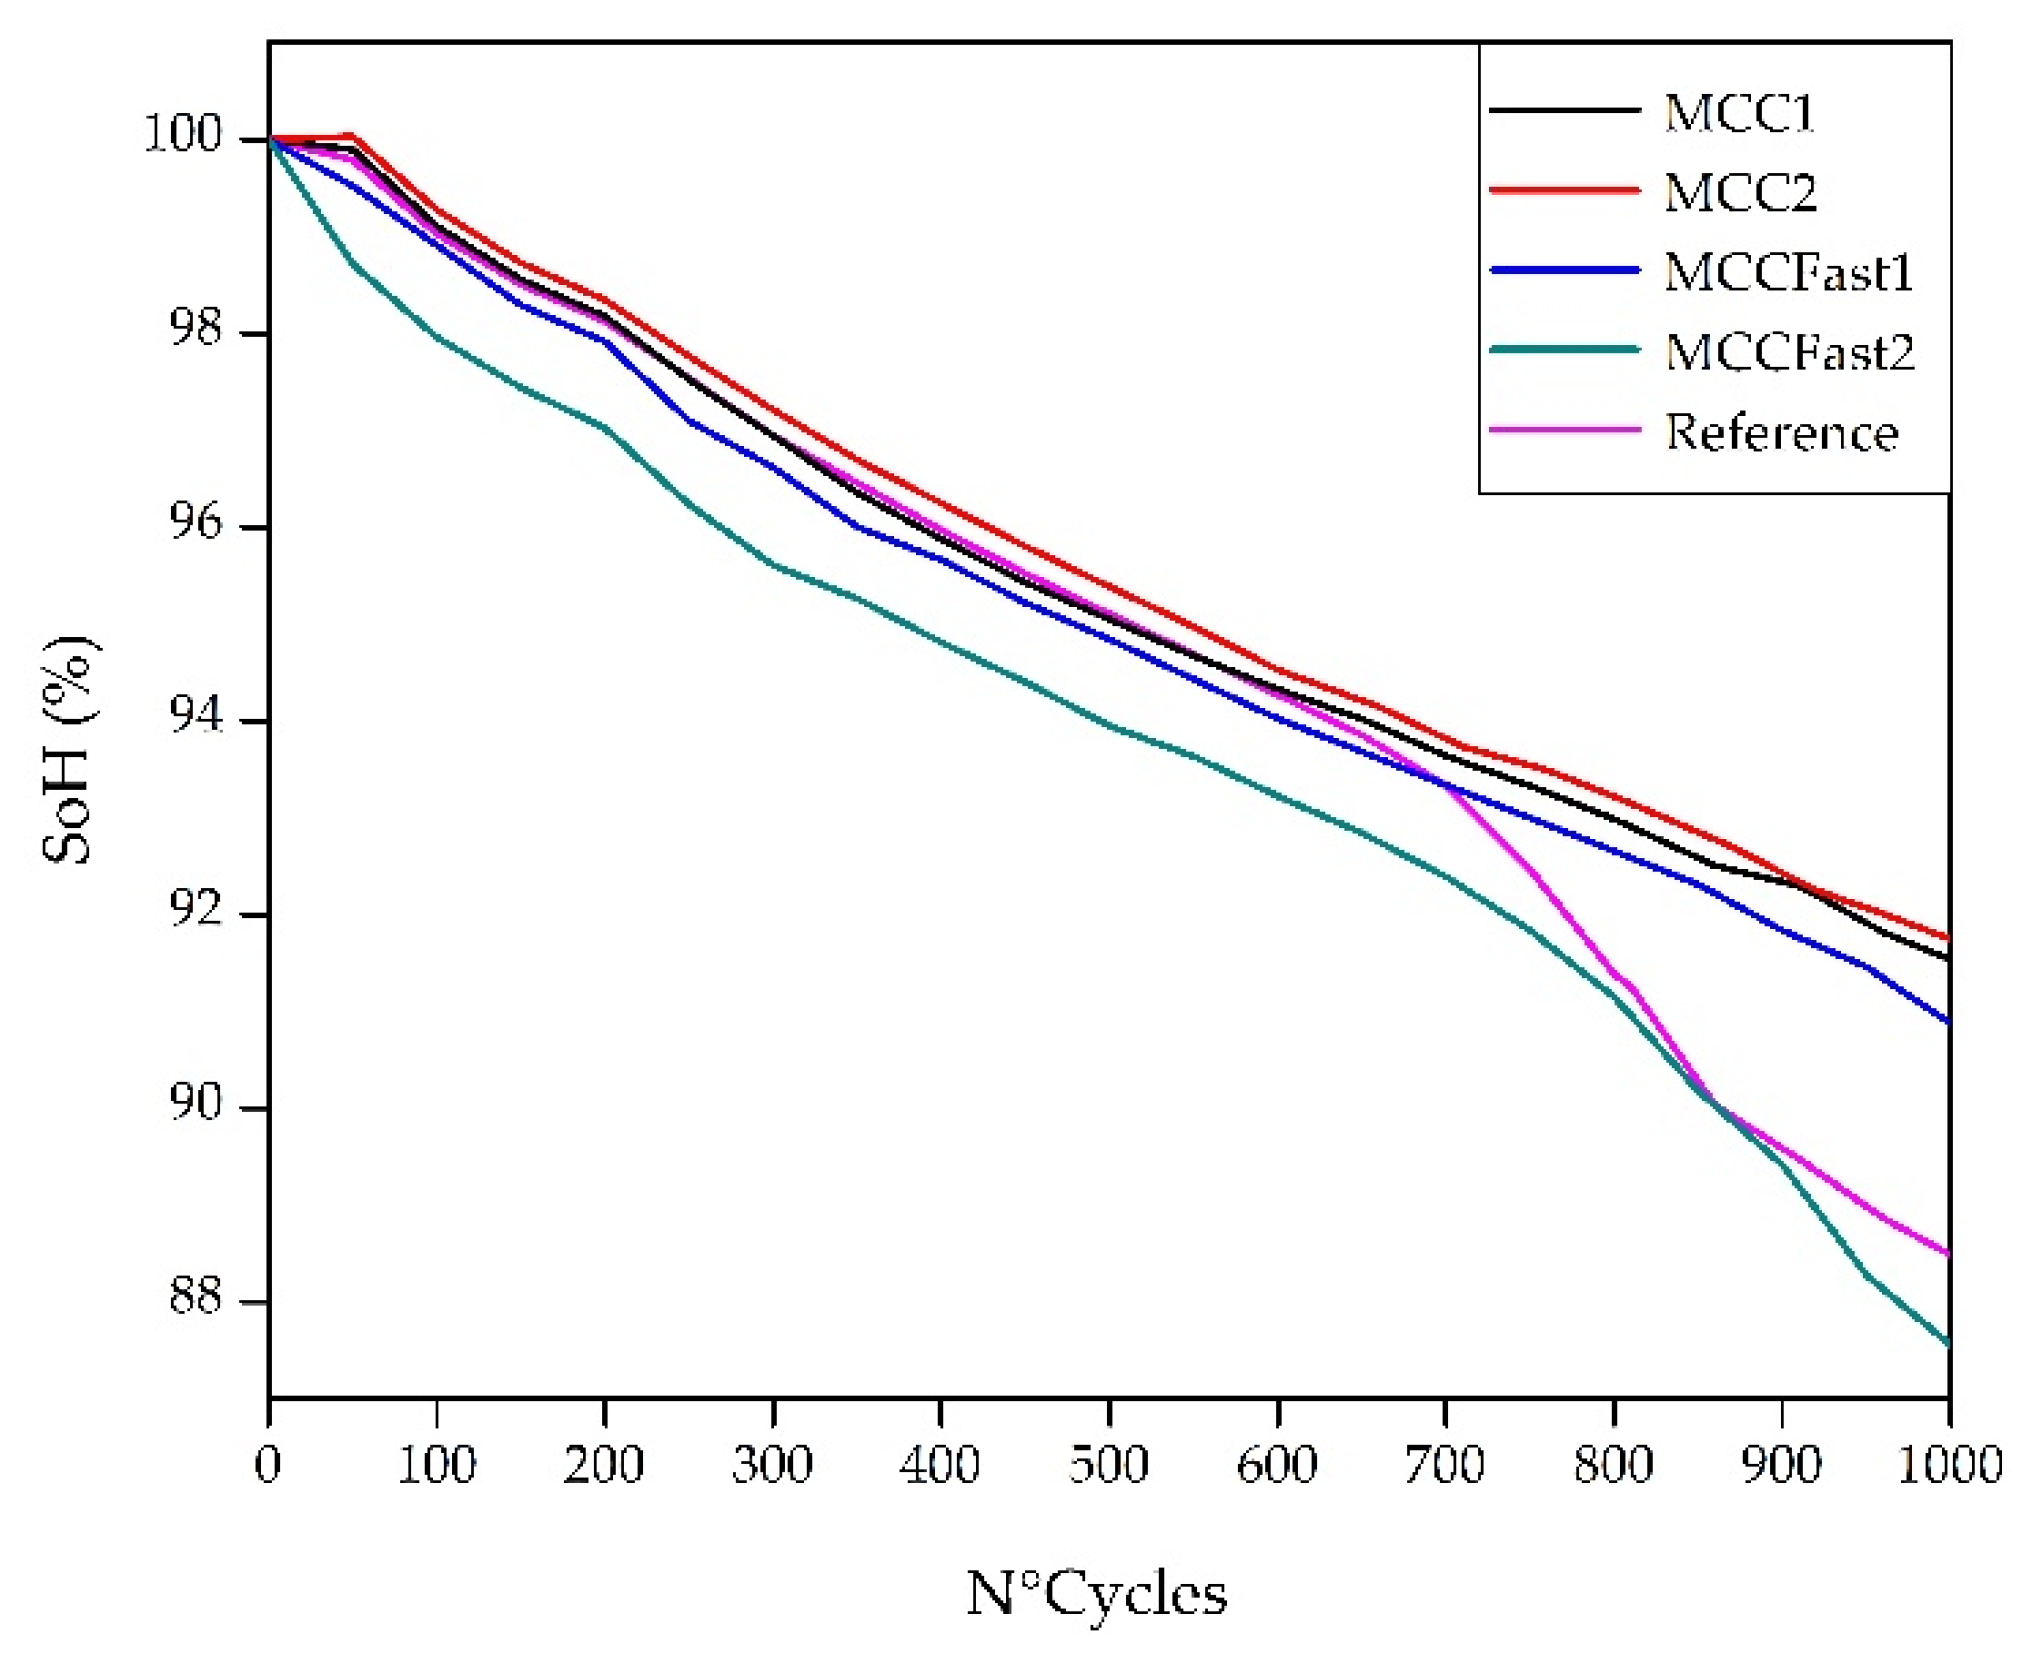
3.1. Cycle Aging Campaing
3.2. Non-Disruptive Characterization Techniques
3.3. Disruptive Characterization Techniques
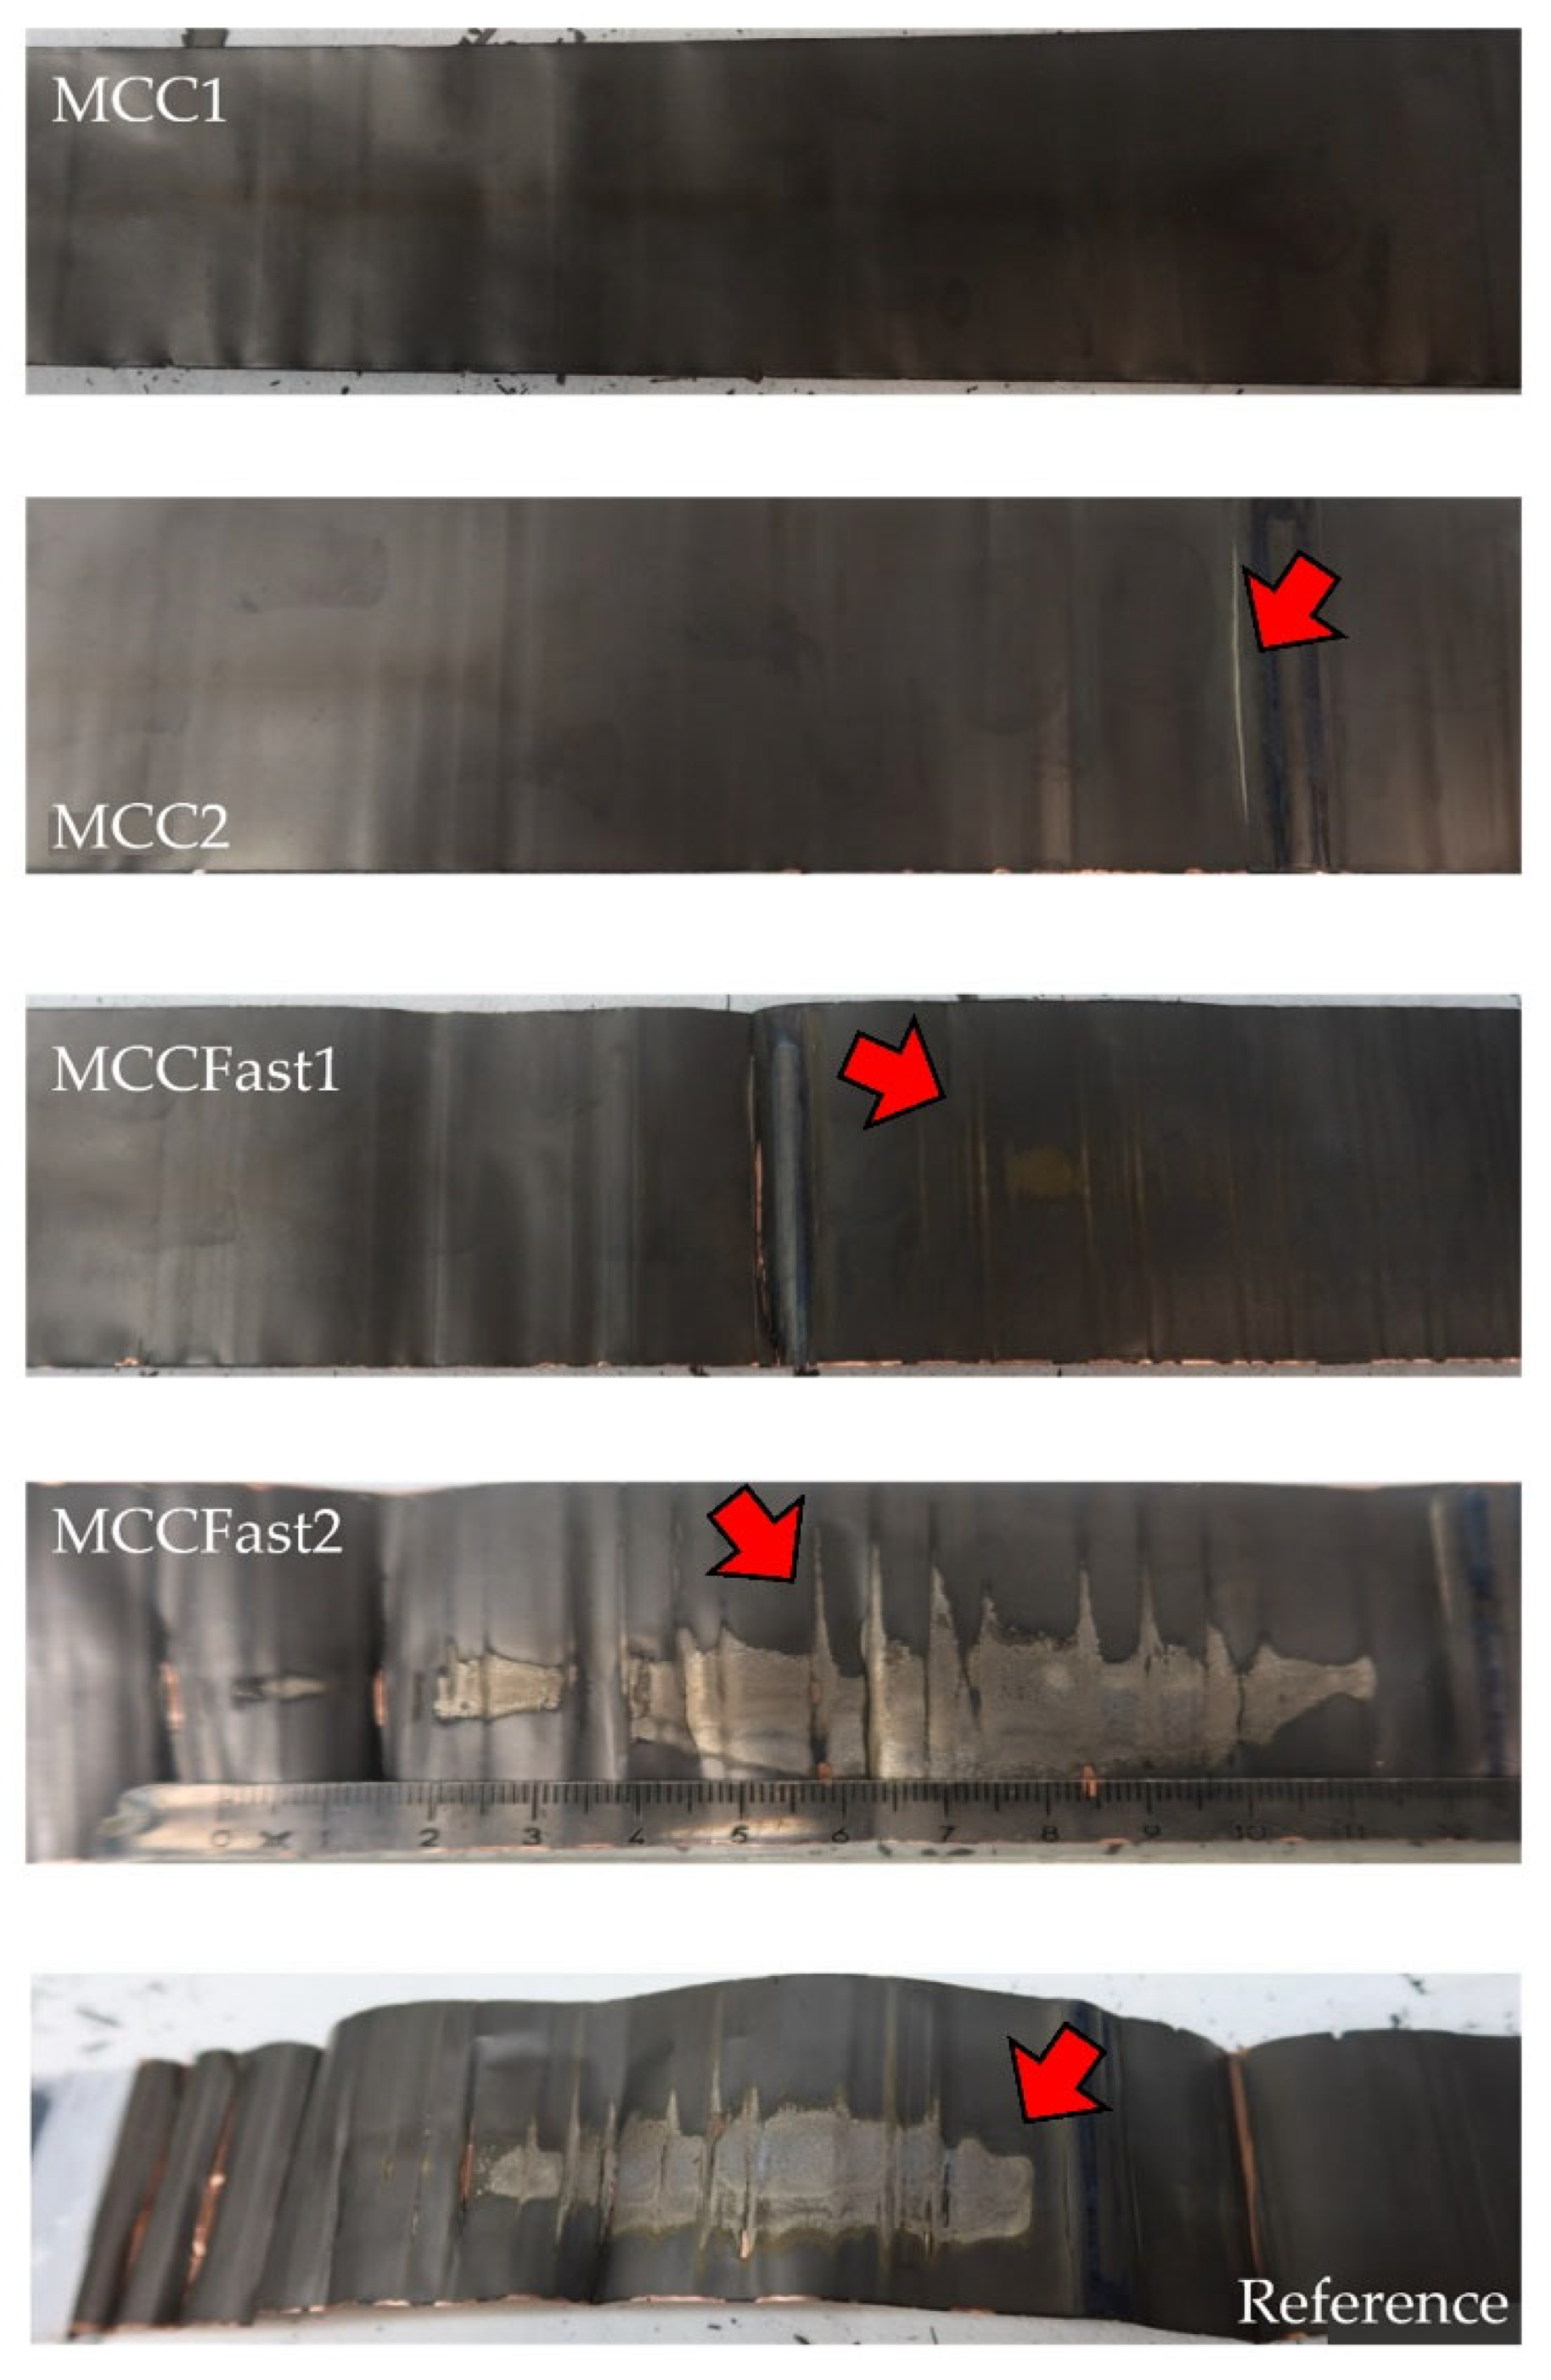
3.3.1. Visual Inspection
3.3.2. Scanning Electron Microscopy, ICP-OES, and Particle Size Analysis
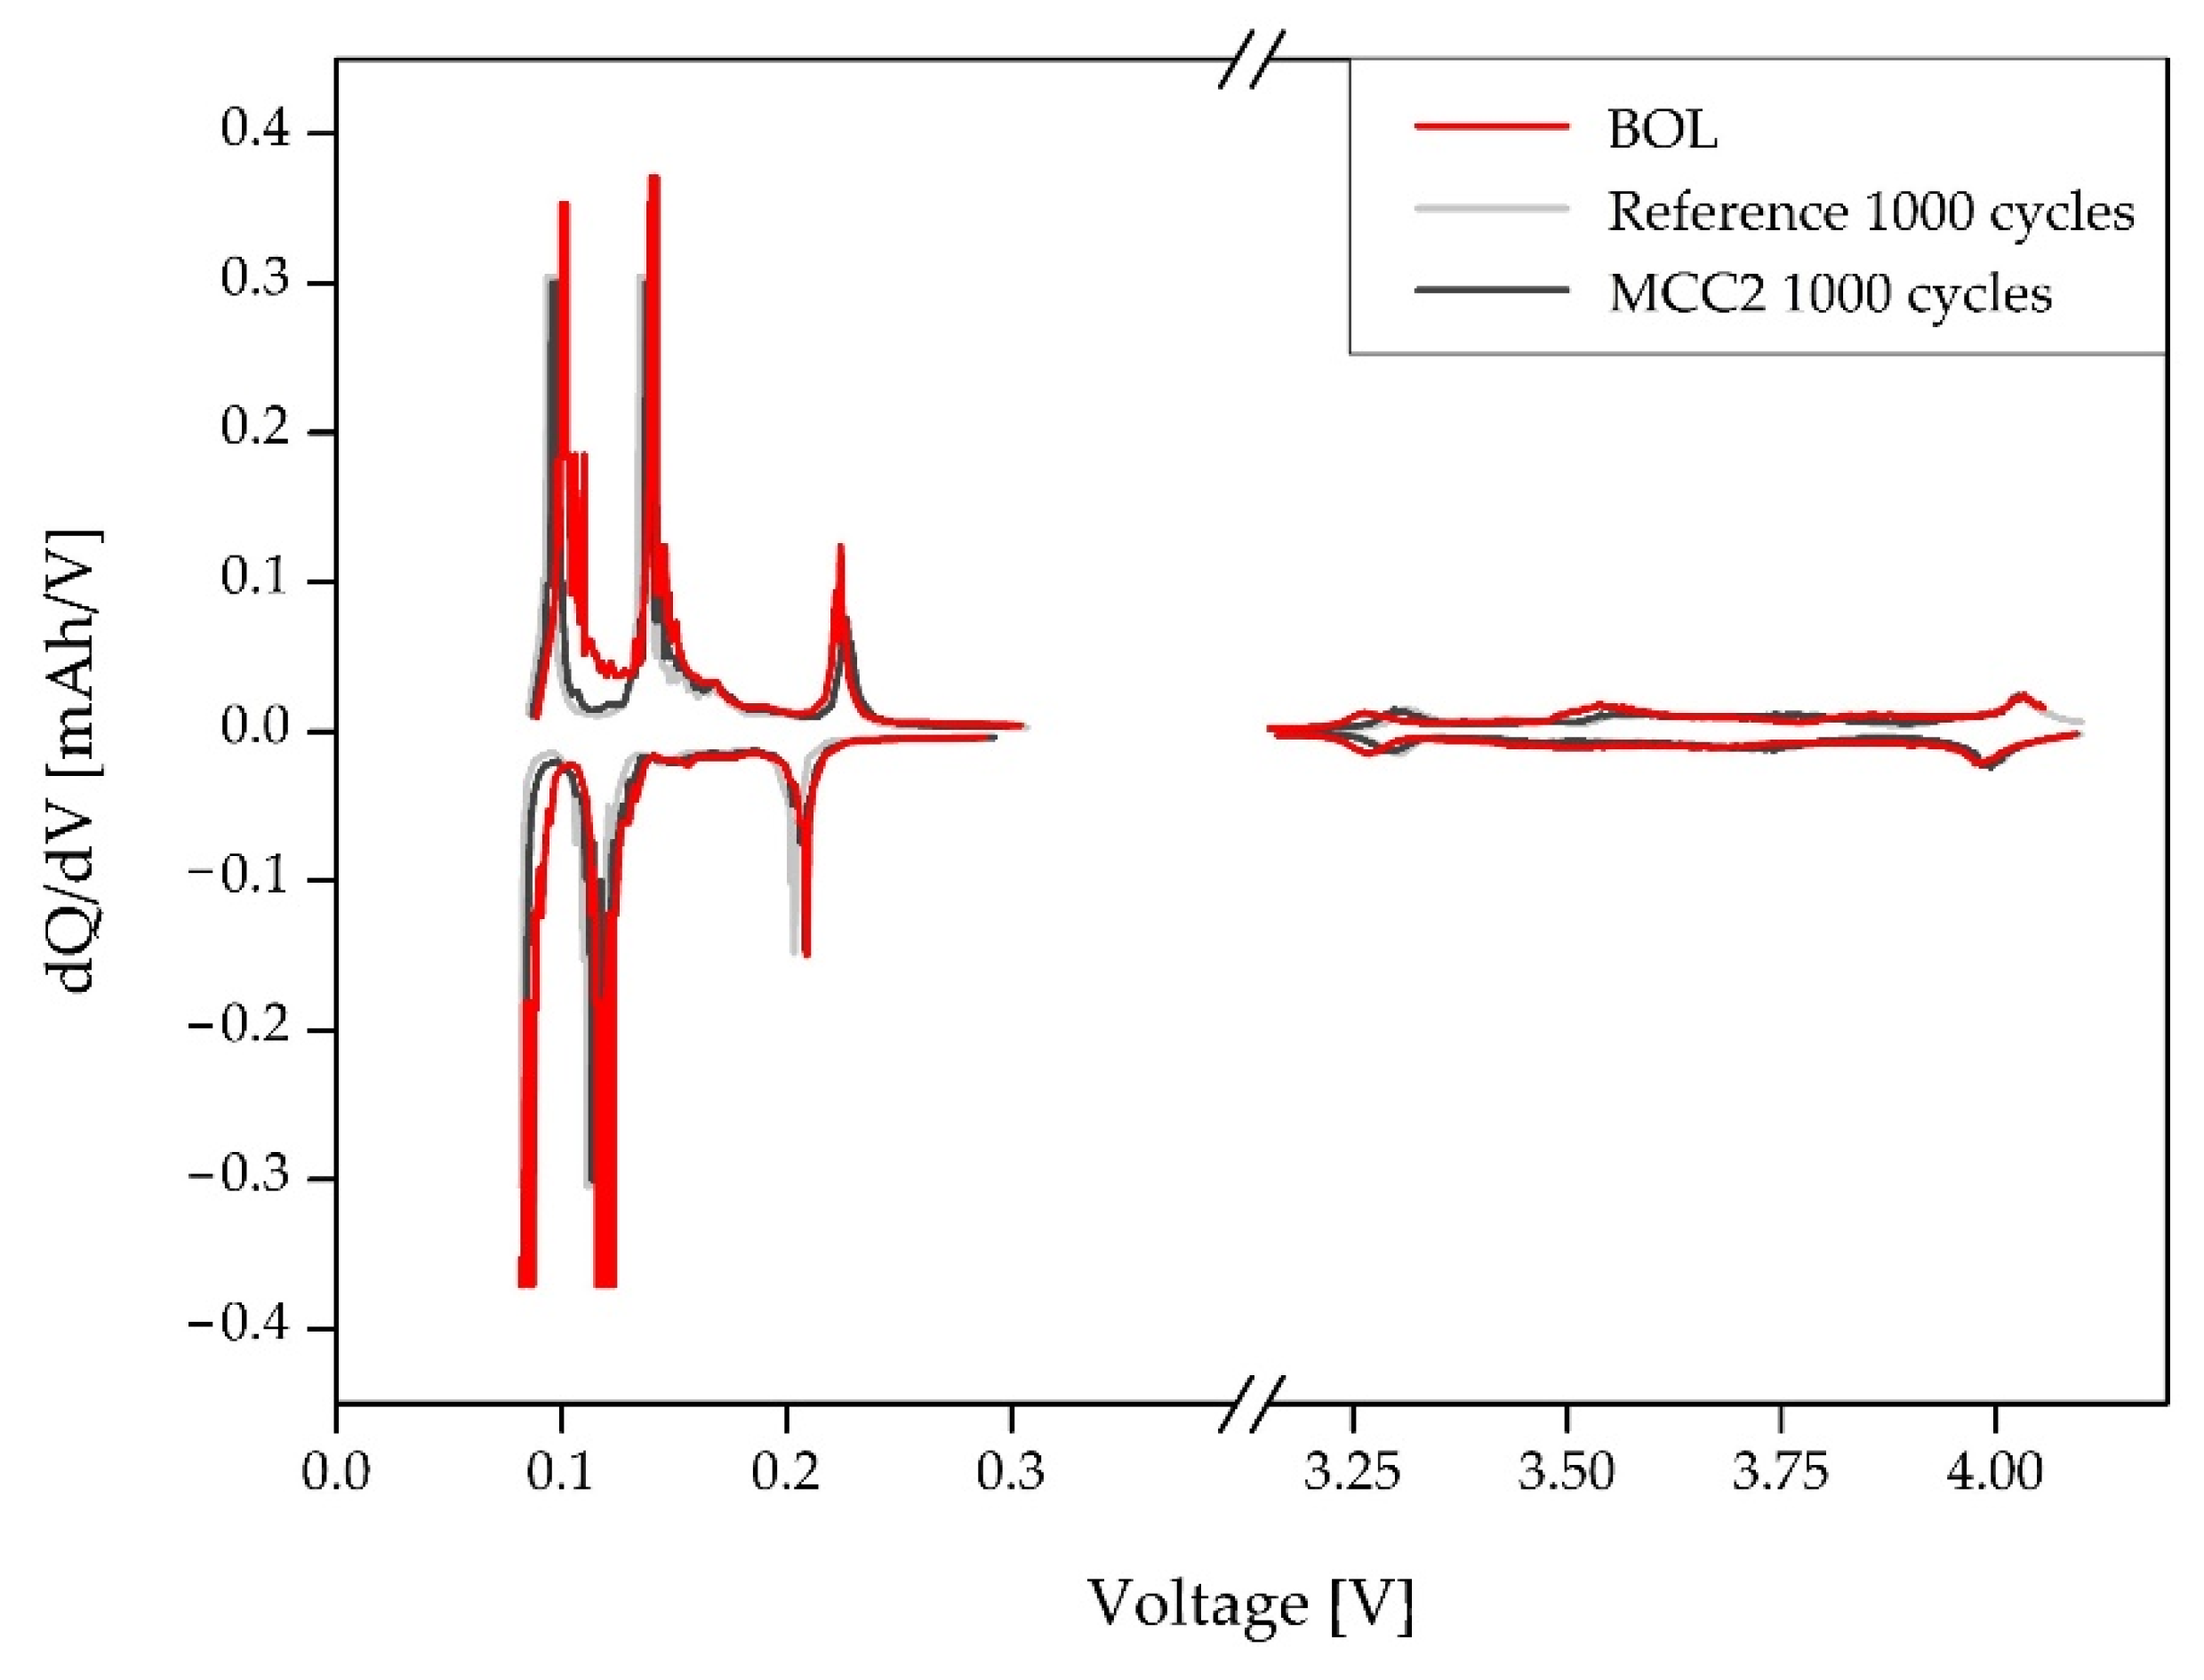
3.3.3. Three Electrode Lab Scale Cell–Incremental Capacity Analysis
3.3.4. X-ray Diffraction Analysis
- -
- Low a (Å) lattice parameter values for the most aged cells (Reference and MCCFast2);
- -
- High c (Å) lattice parameter values for the most aged cells (Reference and MCCFast2);
- -
- Absence of Li/Ni mixing.
4. Discussion
4.1. Cycle Aging Campaign
4.2. Non-Disruptive Characterization Techniques
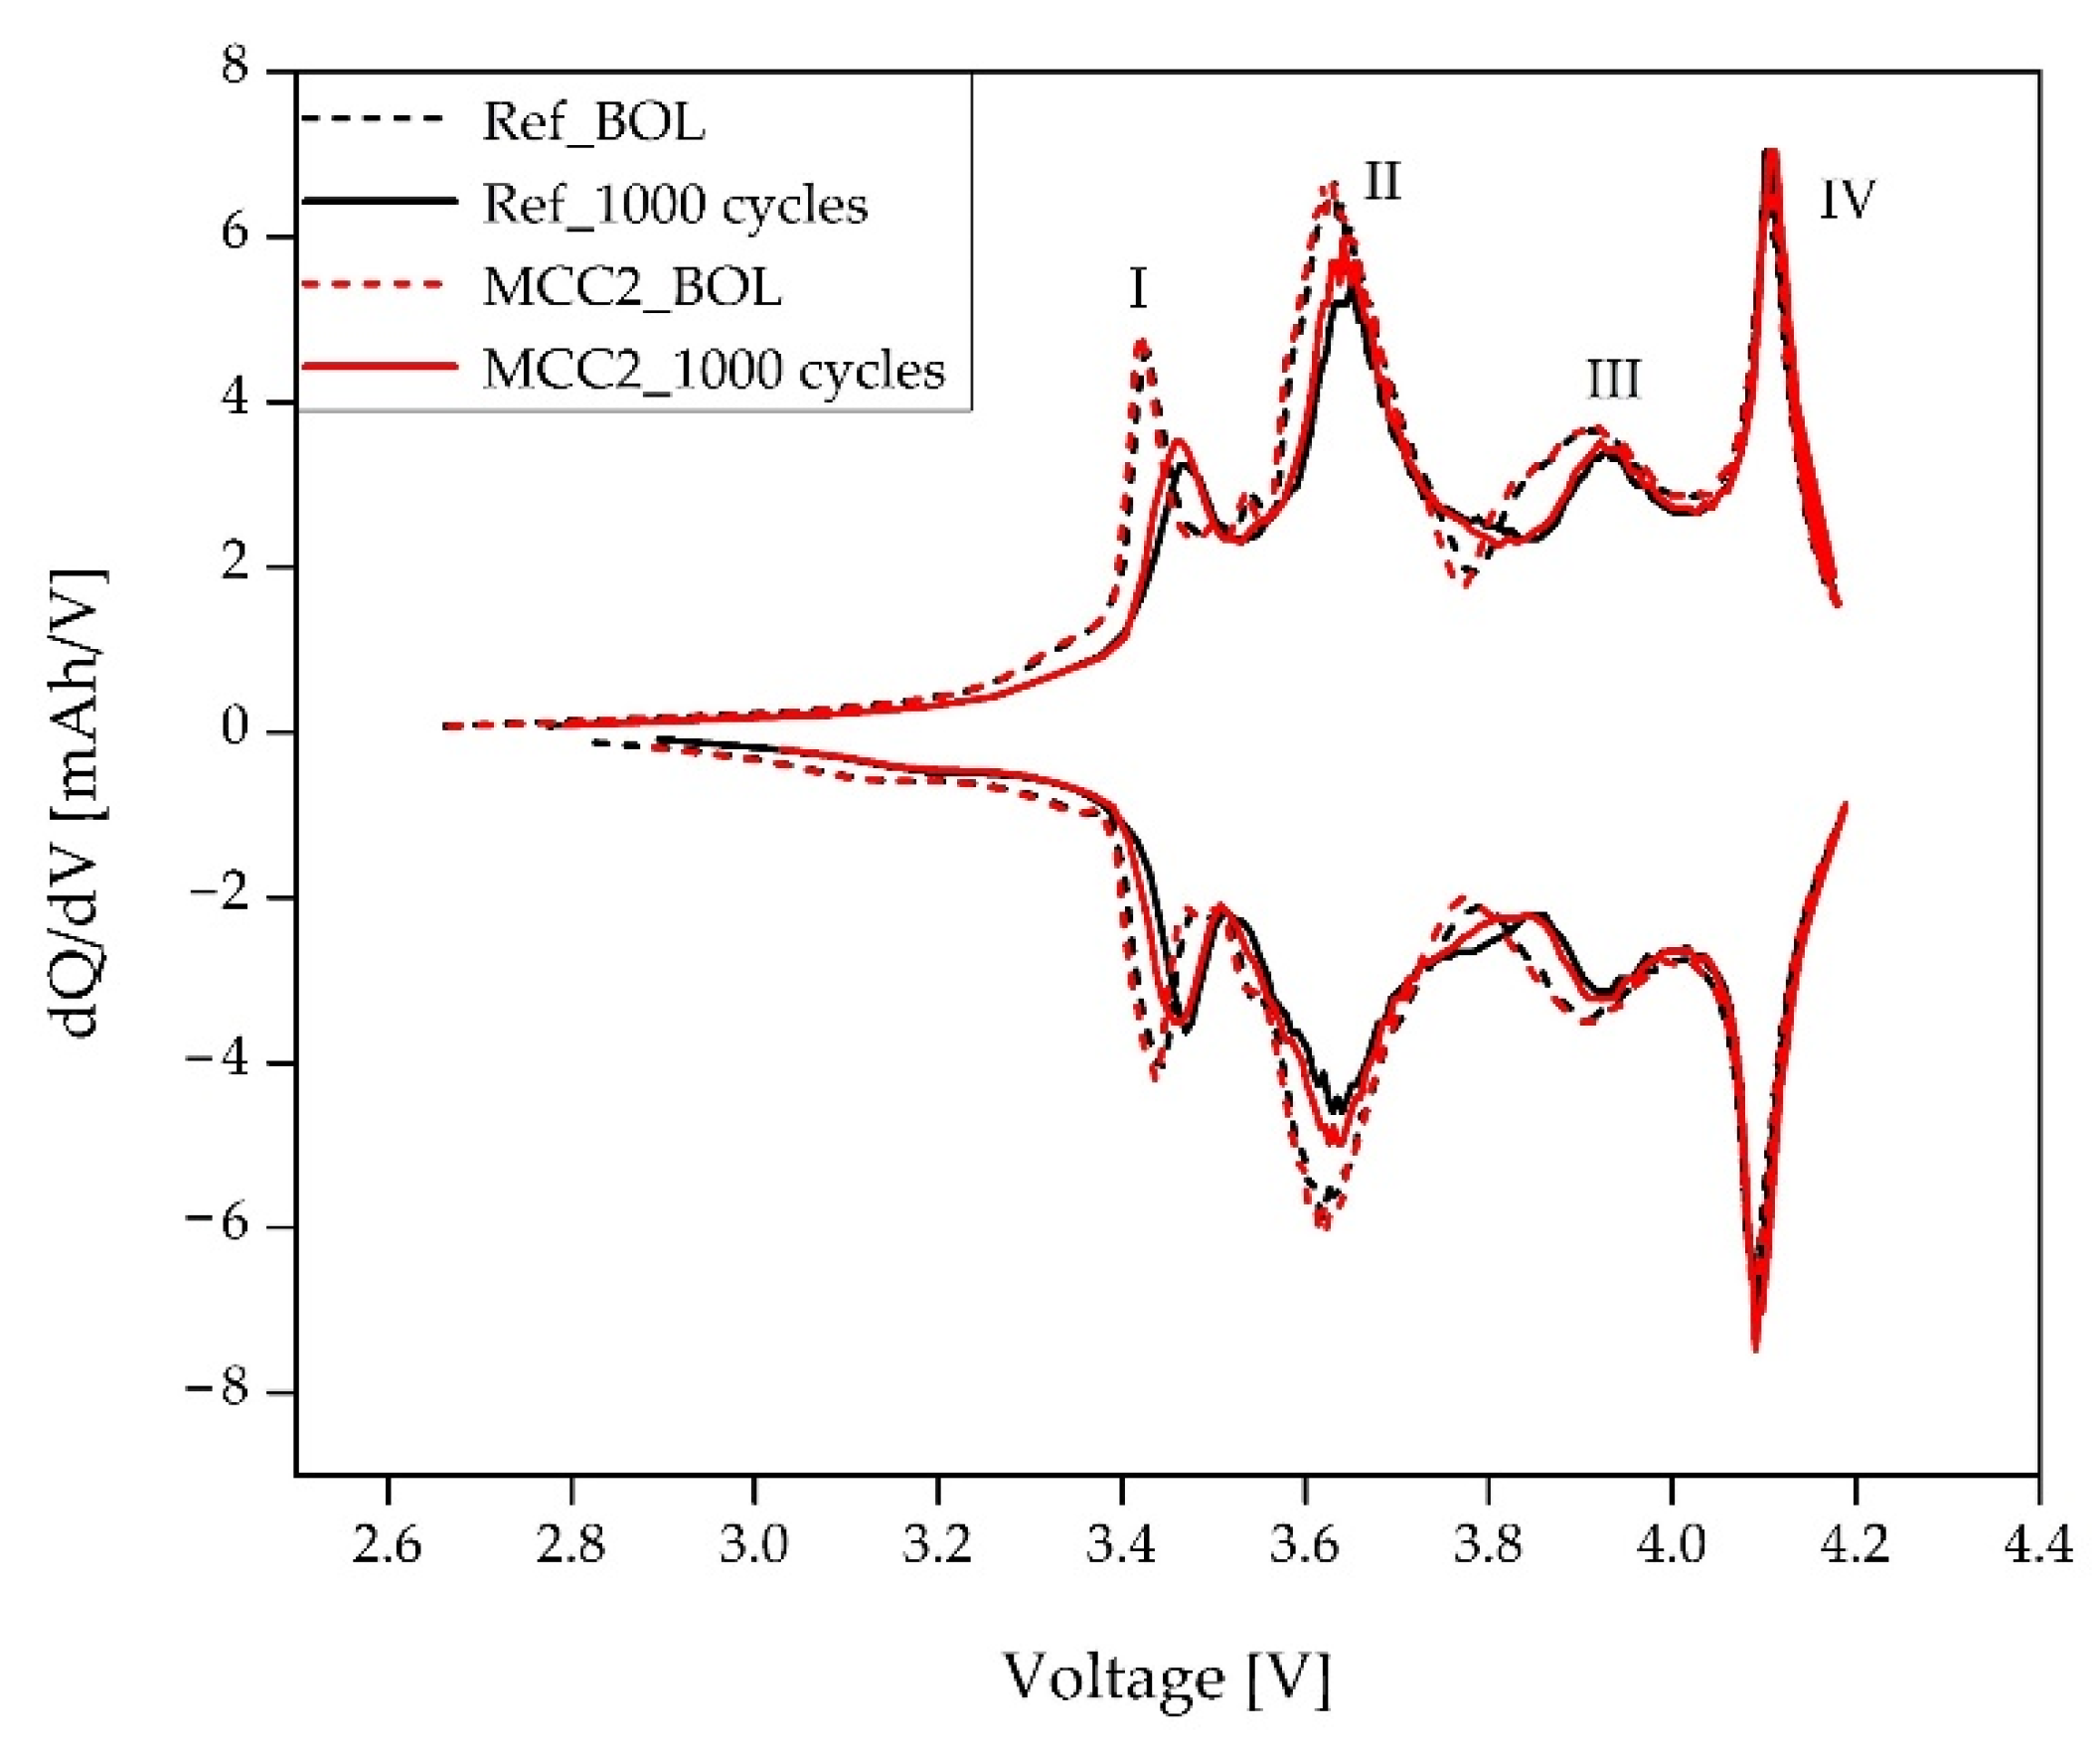
4.2.1. Incremental Capacity Analysis (ICA) on Full 18650 Cells
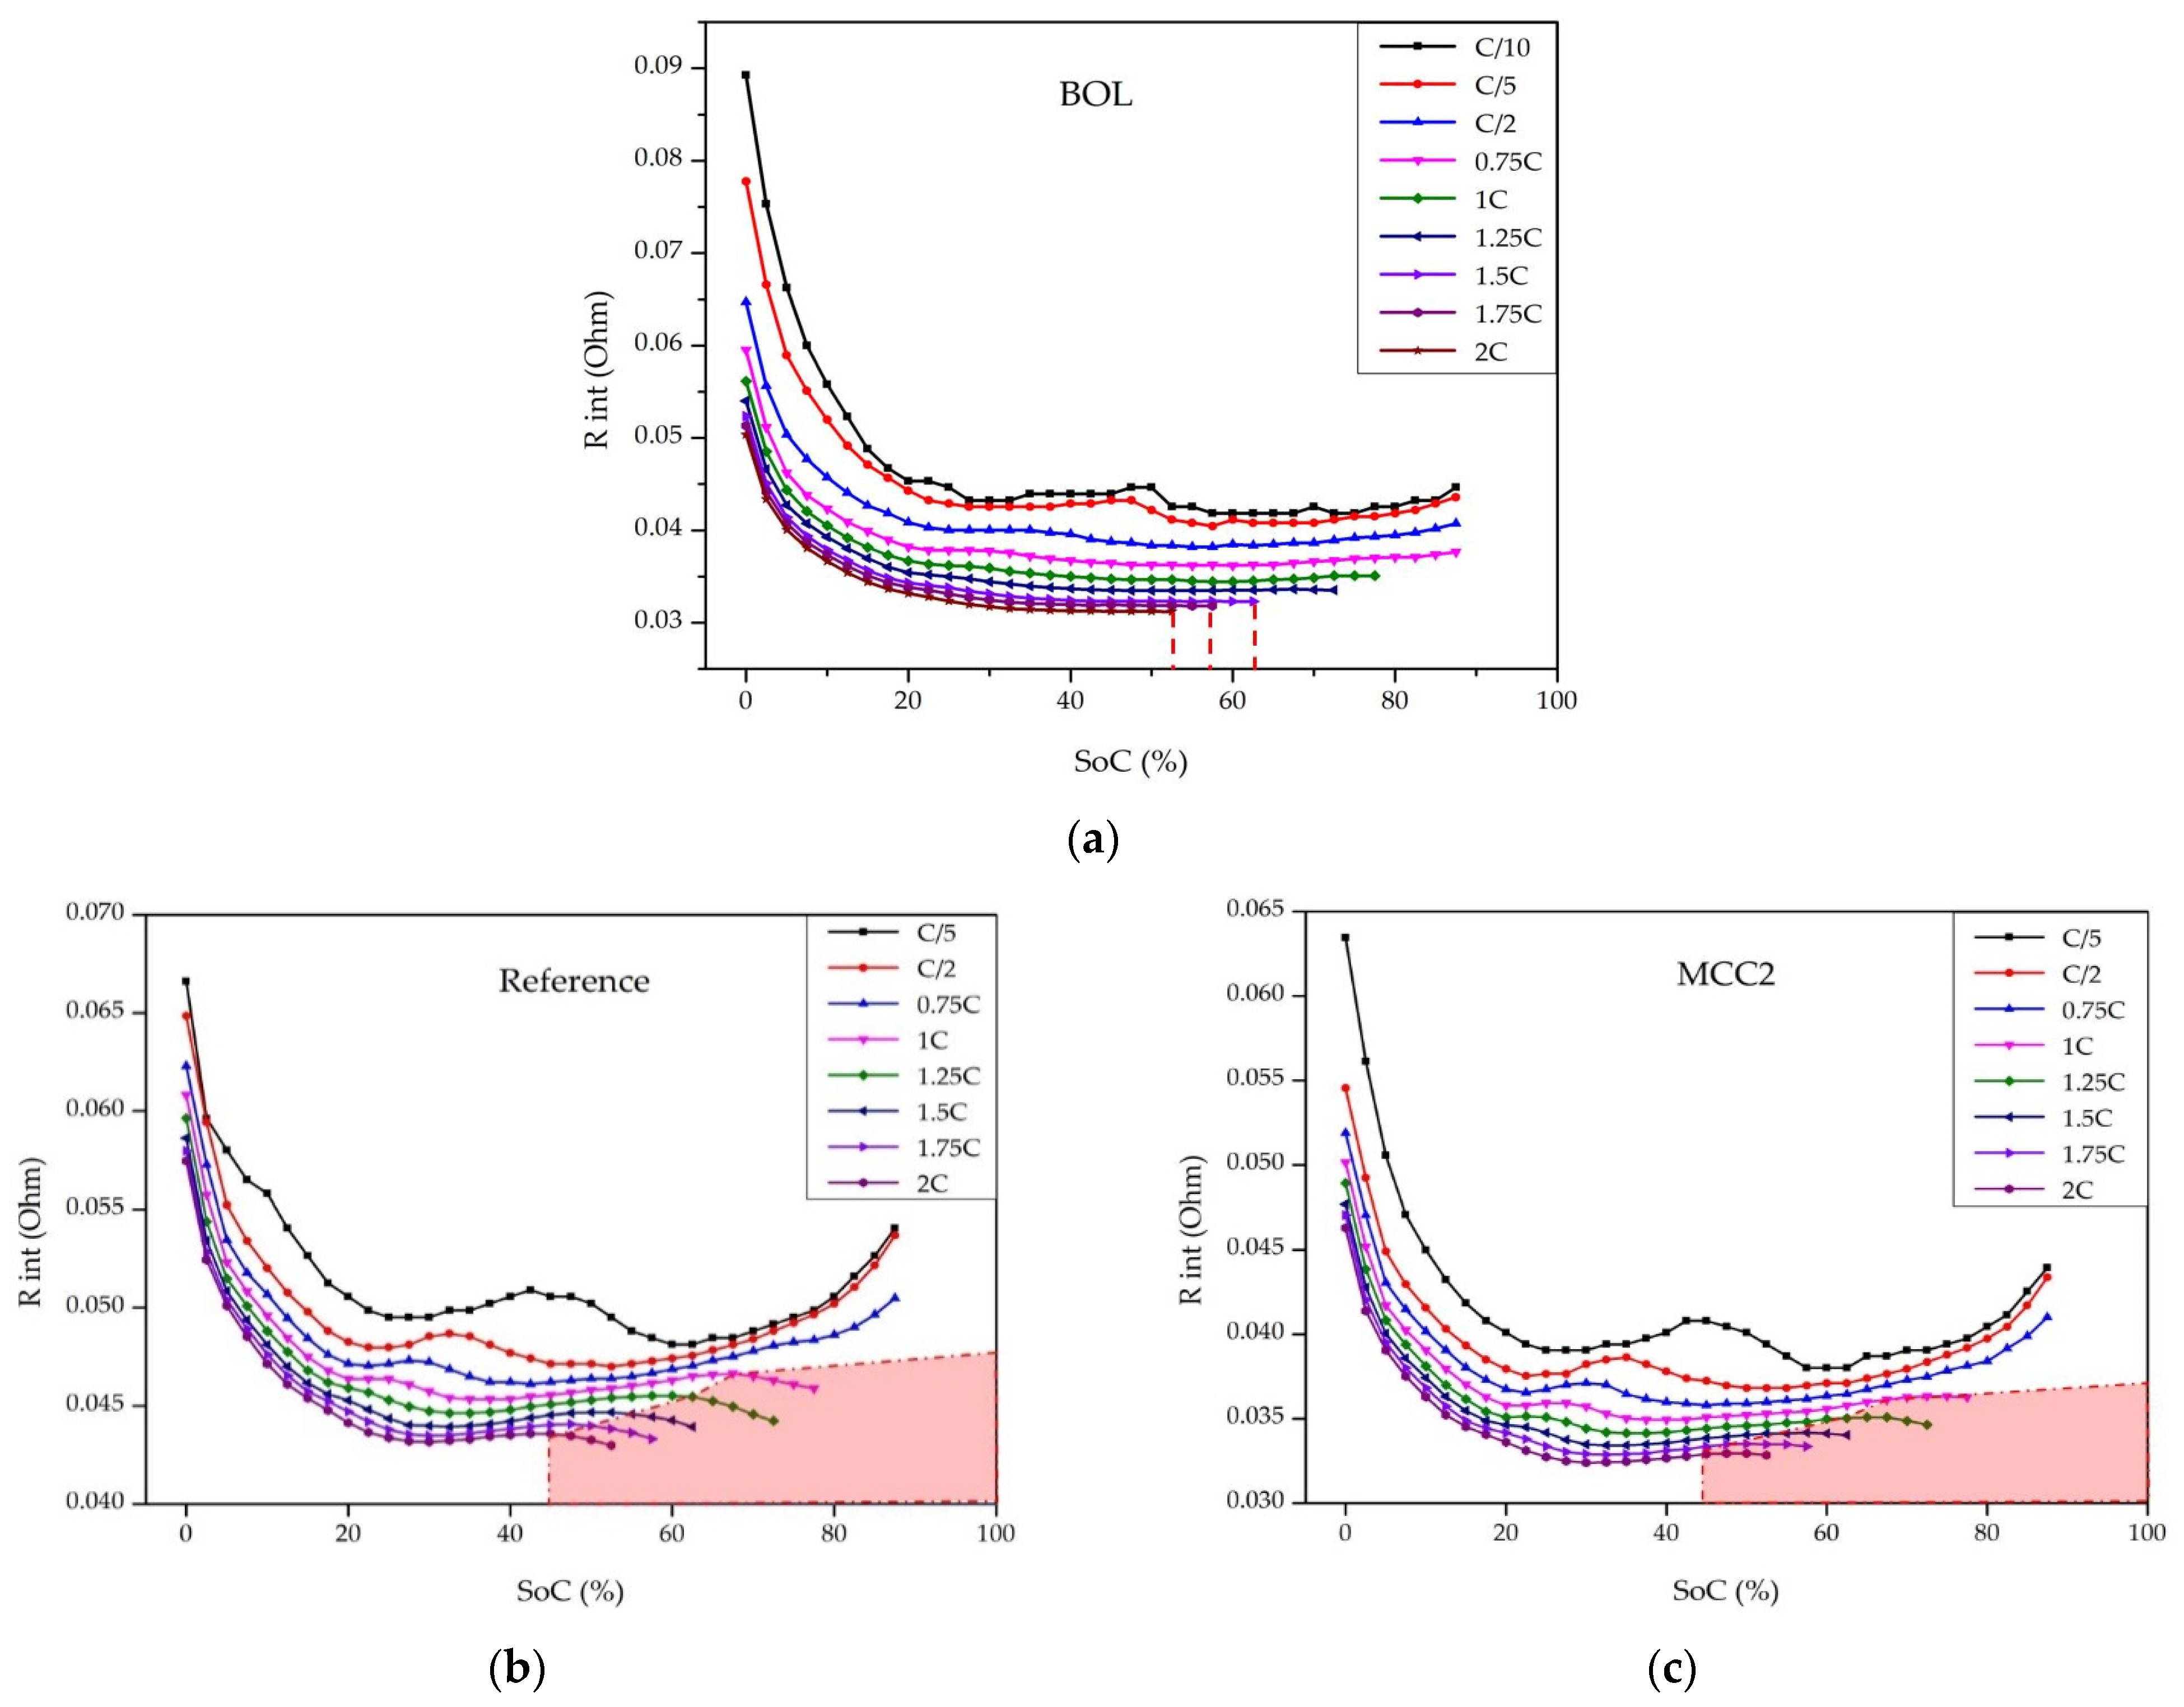
4.2.2. Internal Resistance Evolution
4.3. Disruptive Characterization Techniques
4.3.1. Visual Inspection
4.3.2. SEM, ICP-OES, and Particle Size Analysis
4.3.3. Three-Electrode Lab Scale Cell—ICA
4.3.4. XRD Measurements
5. Conclusions
- The use of ICA in the present study confirms the general good health of the tested cells, indeed no significant degradation on the NMC811 electrode was observed and localized degradation on the Si-C electrode, where lithium plating occurs, was noticed. Physicochemical characterization, along with visual inspection, confirms data obtained from ICA, both in full cells and in lab scale three-electrode cells. Where no evident damage is visible on the electrode samples, ICA responses confirm the absence of significant degradation;
- Among the new implemented approaches, internal resistance test (Rint vs. SoH%) can be considered as a useful “in situ” methodology to control the current (and voltage) limits on the cell, during the aging cycle.
Supplementary Materials
Author Contributions
Funding
Institutional Review Board Statement
Informed Consent Statement
Data Availability Statement
Conflicts of Interest
Abbreviations
| MCC | Multistage Constant Current |
| Ref | Reference |
| SEM | Scanning Electron Microscopy |
| XRD | X-Ray Diffraction |
| ICE | Internal Combustion Engine |
| BMS | Battery Management System |
| DoD | Depth of Discharge |
| LLI | Loss of Lithium Inventory |
| SEI | Solid Electrolyte Interphase |
| LAM | Loss of Active Material |
| ORI | Ohmic Resistance Increase |
| SoH | State of Health |
| ICA | Incremental Capacity Analysis |
| EC:DMC | Ethylen carbonate:Dymethyl carbonate |
| LiPF6 | Lithium exafluorophosfate |
| DCFC | Direct Current Fast Charging |
| EOL | End of Life |
| C-rate | Charging rate |
| SoD | State of Discharge |
| WD | Working Distance |
| EDX | Energy Dispersive X-Ray Analysis |
References
- Abraham, K.M. How Comparable Are Sodium-Ion Batteries to Lithium-Ion Counterparts? ACS Energy Lett. 2020, 5, 3544–3547. [Google Scholar] [CrossRef]
- Li, C.; Wang, Z.; He, Z.; Li, Y.; Mao, J.; Dai, K.; Yan, C.; Zheng, J. An Advance Review of Solid-State Battery: Challenges, Progress and Prospects. Sustain. Mater. Technol. 2021, 29, e00297. [Google Scholar] [CrossRef]
- Kwak, W.-J.; Rosy; Sharon, D.; Xia, C.; Kim, H.; Johnson, L.R.; Bruce, P.G.; Nazar, L.F.; Sun, Y.-K.; Frimer, A.A.; et al. Lithium–Oxygen Batteries and Related Systems: Potential, Status, and Future. Chem. Rev. 2020, 120, 6626–6683. [Google Scholar] [CrossRef] [PubMed]
- Sun, K.; Peng, Z. Intermetallic Interphases in Lithium Metal and Lithium Ion Batteries. InfoMat 2021, 3, 1083–1109. [Google Scholar] [CrossRef]
- Li, S.; Leng, D.; Li, W.; Qie, L.; Dong, Z.; Cheng, Z.; Fan, Z. Recent Progress in Developing Li2S Cathodes for Li–S Batteries. Energy Storage Mater. 2020, 27, 279–296. [Google Scholar] [CrossRef]
- Ahniyaz, A.; de Meatza, I.; Kvasha, A.; Garcia-Calvo, O.; Ahmed, I.; Sgroi, M.F.; Giuliano, M.; Dotoli, M.; Dumitrescu, M.-A.; Jahn, M.; et al. Progress in Solid-State High Voltage Lithium-Ion Battery Electrolytes. Adv. Appl. Energy 2021, 4, 100070. [Google Scholar] [CrossRef]
- Armand, M.; Axmann, P.; Bresser, D.; Copley, M.; Edström, K.; Ekberg, C.; Guyomard, D.; Lestriez, B.; Novák, P.; Petranikova, M.; et al. Lithium-Ion Batteries—Current State of the Art and Anticipated Developments. J. Power Sources 2020, 479, 228708. [Google Scholar] [CrossRef]
- Ding, Y.; Cano, Z.P.; Yu, A.; Lu, J.; Chen, Z. Automotive Li-Ion Batteries: Current Status and Future Perspectives. Electrochem. Energy Rev. 2019, 2, 1–28. [Google Scholar] [CrossRef]
- Opitz, A.; Badami, P.; Shen, L.; Vignarooban, K.; Kannan, A.M. Can Li-Ion Batteries Be the Panacea for Automotive Applications? Renew. Sustain. Energy Rev. 2017, 68, 685–692. [Google Scholar] [CrossRef]
- Li, J.; Du, Z.; Ruther, R.E.; An, S.J.; David, L.A.; Hays, K.; Wood, M.; Phillip, N.D.; Sheng, Y.; Mao, C.; et al. Toward Low-Cost, High-Energy Density, and High-Power Density Lithium-Ion Batteries. JOM 2017, 69, 1484–1496. [Google Scholar] [CrossRef]
- Dotoli, M.; Milo, E.; Giuliano, M.; Rocca, R.; Nervi, C.; Baricco, M.; Ercole, M.; Sgroi, M.F. Detection of Lithium Plating in Li-Ion Cell Anodes Using Realistic Automotive Fast-Charge Profiles. Batteries 2021, 7, 46. [Google Scholar] [CrossRef]
- Epding, B.; Rumberg, B.; Mense, M.; Jahnke, H.; Kwade, A. Aging—Optimized Fast Charging of Lithium Ion Cells Based on Three-Electrode Cell Measurements. Energy Technol. 2020, 8, 2000457. [Google Scholar] [CrossRef]
- Atalay, S.; Sheikh, M.; Mariani, A.; Merla, Y.; Bower, E.; Widanage, W.D. Theory of Battery Ageing in a Lithium-Ion Battery: Capacity Fade, Nonlinear Ageing and Lifetime Prediction. J. Power Sources 2020, 478, 229026. [Google Scholar] [CrossRef]
- Barré, A.; Deguilhem, B.; Grolleau, S.; Gérard, M.; Suard, F.; Riu, D. A Review on Lithium-Ion Battery Ageing Mechanisms and Estimations for Automotive Applications. J. Power Sources 2013, 241, 680–689. [Google Scholar] [CrossRef]
- Schlasza, C.; Ostertag, P.; Chrenko, D.; Kriesten, R.; Bouquain, D. Review on the Aging Mechanisms in Li-Ion Batteries for Electric Vehicles Based on the FMEA Method. In Proceedings of the 2014 IEEE Transportation Electrification Conference and Expo (ITEC), Dearborn, MI, USA, 15–18 June 2014; pp. 1–6. [Google Scholar]
- Lin, C.; Tang, A.; Mu, H.; Wang, W.; Wang, C. Aging Mechanisms of Electrode Materials in Lithium-Ion Batteries for Electric Vehicles. J. Chem. 2015, 2015, 104673. [Google Scholar] [CrossRef]
- Xiong, R.; Pan, Y.; Shen, W.; Li, H.; Sun, F. Lithium-Ion Battery Aging Mechanisms and Diagnosis Method for Automotive Applications: Recent Advances and Perspectives. Renew. Sustain. Energy Rev. 2020, 131, 110048. [Google Scholar] [CrossRef]
- Essl, C.; Seifert, L.; Rabe, M.; Fuchs, A. Early Detection of Failing Automotive Batteries Using Gas Sensors. Batteries 2021, 7, 25. [Google Scholar] [CrossRef]
- Birkl, C.R.; Roberts, M.R.; McTurk, E.; Bruce, P.G.; Howey, D.A. Degradation Diagnostics for Lithium Ion Cells. J. Power Sources 2017, 341, 373–386. [Google Scholar] [CrossRef]
- Koleti, U.R.; Rajan, A.; Tan, C.; Moharana, S.; Dinh, T.Q.; Marco, J. A Study on the Influence of Lithium Plating on Battery Degradation. Energies 2020, 13, 3458. [Google Scholar] [CrossRef]
- Agubra, V.; Fergus, J. Lithium Ion Battery Anode Aging Mechanisms. Materials 2013, 6, 1310–1325. [Google Scholar] [CrossRef]
- Keil, J.; Paul, N.; Baran, V.; Keil, P.; Gilles, R.; Jossen, A. Linear and Nonlinear Aging of Lithium-Ion Cells Investigated by Electrochemical Analysis and In-Situ Neutron Diffraction. J. Electrochem. Soc. 2019, 166, A3908–A3917. [Google Scholar] [CrossRef]
- Diao, W.; Saxena, S.; Han, B.; Pecht, M. Algorithm to Determine the Knee Point on Capacity Fade Curves of Lithium-Ion Cells. Energies 2019, 12, 2910. [Google Scholar] [CrossRef]
- Schuster, S.F.; Bach, T.; Fleder, E.; Müller, J.; Brand, M.; Sextl, G.; Jossen, A. Nonlinear Aging Characteristics of Lithium-Ion Cells under Different Operational Conditions. J. Energy Storage 2015, 1, 44–53. [Google Scholar] [CrossRef]
- Waldmann, T.; Iturrondobeitia, A.; Kasper, M.; Ghanbari, N.; Aguesse, F.; Bekaert, E.; Daniel, L.; Genies, S.; Gordon, I.J.; Löble, M.W.; et al. Review—Post-Mortem Analysis of Aged Lithium-Ion Batteries: Disassembly Methodology and Physico-Chemical Analysis Techniques. J. Electrochem. Soc. 2016, 163, A2149–A2164. [Google Scholar] [CrossRef]
- Kuntz, P.; Raccurt, O.; Azaïs, P.; Richter, K.; Waldmann, T.; Wohlfahrt-Mehrens, M.; Bardet, M.; Buzlukov, A.; Genies, S. Identification of Degradation Mechanisms by Post-Mortem Analysis for High Power and High Energy Commercial Li-Ion Cells after Electric Vehicle Aging. Batteries 2021, 7, 48. [Google Scholar] [CrossRef]
- Buchberger, I.; Seidlmayer, S.; Pokharel, A.; Piana, M.; Hattendorff, J.; Kudejova, P.; Gilles, R.; Gasteiger, H.A. Aging Analysis of Graphite/LiNi1/3 Mn1/3 Co1/3 O2 Cells Using XRD, PGAA, and AC Impedance. J. Electrochem. Soc. 2015, 162, A2737–A2746. [Google Scholar] [CrossRef]
- Tian, Y.; Lin, C.; Li, H.; Du, J.; Xiong, R. Detecting Undesired Lithium Plating on Anodes for Lithium-Ion Batteries—A Review on the in-Situ Methods. Appl. Energy 2021, 300, 117386. [Google Scholar] [CrossRef]
- Schindler, S.; Bauer, M.; Petzl, M.; Danzer, M.A. Voltage Relaxation and Impedance Spectroscopy as In-Operando Methods for the Detection of Lithium Plating on Graphitic Anodes in Commercial Lithium-Ion Cells. J. Power Sources 2016, 304, 170–180. [Google Scholar] [CrossRef]
- Janakiraman, U.; Garrick, T.R.; Fortier, M.E. Review—Lithium Plating Detection Methods in Li-Ion Batteries. J. Electrochem. Soc. 2020, 167, 160552. [Google Scholar] [CrossRef]
- Dotoli, M.; Rocca, R.; Giuliano, M.; Sgroi, M.; Belforte, L.; Li Pira, N.; Mangione, G.; Milo, E.; Nicol, G.; Parussa, F. Physical-Chemical Characterization of Cycle Aged Commercial Cells of Automotive Interest. In Proceedings of the WCX SAE World Congress Experience, Detroit, MI, USA, 5–7 April 2022. SAE Technical Paper 2022-01-027. [Google Scholar]
- Krupp, A.; Ferg, E.; Schuldt, F.; Derendorf, K.; Agert, C. Incremental Capacity Analysis as a State of Health Estimation Method for Lithium-Ion Battery Modules with Series-Connected Cells. Batteries 2020, 7, 2. [Google Scholar] [CrossRef]
- Riviere, E.; Sari, A.; Venet, P.; Meniere, F.; Bultel, Y. Innovative Incremental Capacity Analysis Implementation for C/LiFePO4 Cell State-of-Health Estimation in Electrical Vehicles. Batteries 2019, 5, 37. [Google Scholar] [CrossRef]
- Bach, T.C.; Schuster, S.F.; Fleder, E.; Müller, J.; Brand, M.J.; Lorrmann, H.; Jossen, A.; Sextl, G. Nonlinear Aging of Cylindrical Lithium-Ion Cells Linked to Heterogeneous Compression. J. Energy Storage 2016, 5, 212–223. [Google Scholar] [CrossRef]
- Fly, A.; Chen, R. Rate Dependency of Incremental Capacity Analysis (DQ/DV) as a Diagnostic Tool for Lithium-Ion Batteries. J. Energy Storage 2020, 29, 101329. [Google Scholar] [CrossRef]
- Christensen, J.; Newman, J. A Mathematical Model of Stress Generation and Fracture in Lithium Manganese Oxide. J. Electrochem. Soc. 2006, 153, A1019. [Google Scholar] [CrossRef]
- Kalaga, K.; Rodrigues, M.-T.F.; Trask, S.E.; Shkrob, I.A.; Abraham, D.P. Calendar-Life versus Cycle-Life Aging of Lithium-Ion Cells with Silicon-Graphite Composite Electrodes. Electrochim. Acta 2018, 280, 221–228. [Google Scholar] [CrossRef]
- Chen, Y.; Torres-Castro, L.; Chen, K.-H.; Penley, D.; Lamb, J.; Karulkar, M.; Dasgupta, N.P. Operando Detection of Li Plating during Fast Charging of Li-Ion Batteries Using Incremental Capacity Analysis. J. Power Sources 2022, 539, 231601. [Google Scholar] [CrossRef]
- Plattard, T.; Barnel, N.; Assaud, L.; Franger, S.; Duffault, J.-M. Combining a Fatigue Model and an Incremental Capacity Analysis on a Commercial NMC/Graphite Cell under Constant Current Cycling with and without Calendar Aging. Batteries 2019, 5, 36. [Google Scholar] [CrossRef]
- Jung, R.; Metzger, M.; Maglia, F.; Stinner, C.; Gasteiger, H.A. Oxygen Release and Its Effect on the Cycling Stability of LiNi x Mn y Co z O 2 (NMC) Cathode Materials for Li-Ion Batteries. J. Electrochem. Soc. 2017, 164, A1361–A1377. [Google Scholar] [CrossRef]
- de Biasi, L.; Schwarz, B.; Brezesinski, T.; Hartmann, P.; Janek, J.; Ehrenberg, H. Chemical, Structural, and Electronic Aspects of Formation and Degradation Behavior on Different Length Scales of Ni-Rich NCM and Li-Rich HE-NCM Cathode Materials in Li-Ion Batteries. Adv. Mater. 2019, 31, 1900985. [Google Scholar] [CrossRef]
- Li, T.; Yuan, X.-Z.; Zhang, L.; Song, D.; Shi, K.; Bock, C. Degradation Mechanisms and Mitigation Strategies of Nickel-Rich NMC-Based Lithium-Ion Batteries. Electrochem. Energy Rev. 2020, 3, 43–80. [Google Scholar] [CrossRef]
- Jung, S.-K.; Gwon, H.; Hong, J.; Park, K.-Y.; Seo, D.-H.; Kim, H.; Hyun, J.; Yang, W.; Kang, K. Understanding the Degradation Mechanisms of LiNi 0.5 Co 0.2 Mn 0.3 O 2 Cathode Material in Lithium Ion Batteries. Adv. Energy Mater. 2014, 4, 1300787. [Google Scholar] [CrossRef]
- Cho, I.-H.; Lee, P.-Y.; Kim, J.-H. Analysis of the Effect of the Variable Charging Current Control Method on Cycle Life of Li-Ion Batteries. Energies 2019, 12, 3023. [Google Scholar] [CrossRef]
- Sieg, J.; Bandlow, J.; Mitsch, T.; Dragicevic, D.; Materna, T.; Spier, B.; Witzenhausen, H.; Ecker, M.; Sauer, D.U. Fast Charging of an Electric Vehicle Lithium-Ion Battery at the Limit of the Lithium Deposition Process. J. Power Sources 2019, 427, 260–270. [Google Scholar] [CrossRef]
- Rodrigues, M.T.F.; Son, S.-B.; Colclasure, A.M.; Shkrob, I.A.; Trask, S.E.; Bloom, I.D.; Abraham, D.P. How Fast Can a Li-Ion Battery Be Charged? Determination of Limiting Fast Charging Conditions. ACS Appl. Energy Mater. 2021, 4, 1063–1068. [Google Scholar] [CrossRef]
- Baker, D.R.; Verbrugge, M.W. Modeling Overcharge at Graphite Electrodes: Plating and Dissolution of Lithium. J. Electrochem. Soc. 2020, 167, 013504. [Google Scholar] [CrossRef]
- Sun, G.; Sui, T.; Song, B.; Zheng, H.; Lu, L.; Korsunsky, A.M. On the Fragmentation of Active Material Secondary Particles in Lithium Ion Battery Cathodes Induced by Charge Cycling. Extrem. Mech. Lett. 2016, 9, 449–458. [Google Scholar] [CrossRef]
- Aishova, A.; Park, G.; Yoon, C.S.; Sun, Y. Cobalt—Free High—Capacity Ni—Rich Layered Li[Ni0.9 Mn0.1 ]O2 Cathode. Adv. Energy Mater. 2020, 10, 1903179. [Google Scholar] [CrossRef]
- Friedrich, F.; Strehle, B.; Freiberg, A.T.S.; Kleiner, K.; Day, S.J.; Erk, C.; Piana, M.; Gasteiger, H.A. Editors’ Choice—Capacity Fading Mechanisms of NCM-811 Cathodes in Lithium-Ion Batteries Studied by X-Ray Diffraction and Other Diagnostics. J. Electrochem. Soc. 2019, 166, A3760–A3774. [Google Scholar] [CrossRef]
- Wu, X.; Bai, Y.; Li, Z.; Liu, J.; Zhao, K.; Du, Z. Effects of Charging Rates on LiNi0.6Mn0.2Co0.2O2 (NMC622)/Graphite Li-Ion Cells. J. Energy Chem. 2021, 56, 121–126. [Google Scholar] [CrossRef]
- Sun, H.; Zhao, K. Electronic Structure and Comparative Properties of LiNix Mny Coz O2 Cathode Materials. J. Phys. Chem. C 2017, 121, 6002–6010. [Google Scholar] [CrossRef]
- Gupta, H.; Singh, R.K. High-Voltage Nickel—Rich NMC Cathode Material with Ionic-Liquid-Based Polymer Electrolytes for Rechargeable Lithium-Metal Batteries. ChemElectroChem 2020, 7, 3597–3605. [Google Scholar] [CrossRef]
- Radziuk, D.; Möhwald, H. Ultrasonically Treated Liquid Interfaces for Progress in Cleaning and Separation Processes. Phys. Chem. Chem. Phys. 2016, 18, 21–46. [Google Scholar] [CrossRef] [PubMed]


| Lattice Parameters from the Rietveld Refinement for EOL 1000 Cycles Cells | |||||
|---|---|---|---|---|---|
| Reference | MCC1 | MCC2 | MCCFast1 | MCCFast2 | |
| a (Å) | 2.867 | 2.871 | 2.870 | 2.870 | 2.868 |
| c (Å) | 14.258 | 14.252 | 14.249 | 14.252 | 14.257 |
| I003/I104 | 1.49 | 1.54 | 1.59 | 1.54 | 1.53 |
| Reference | MCC1 | MCC2 | MCCFast1 | MCCFast2 | |
|---|---|---|---|---|---|
| SoH % | 88.48 | 91.53% | 91.74% | 90.88% | 87.55% |
| Time for Charge [Minute] | 5 | 10 | 15 | 20 | 25 | 30 |
|---|---|---|---|---|---|---|
| Reference | 16% | 25% | 33% | 41% | 50% | 58% |
| MCC1 | 16% | 25% | 35% | 44% | 53% | 60% |
| MCC2 | 17% | 26% | 35% | 44% | 53% | 60% |
| MCCFast1 | 19% | 30% | 41% | 50% | 58% | 64% |
| MCCFast2 | 25% | 40% | 53% | 59% | 65% | 70% |
Publisher’s Note: MDPI stays neutral with regard to jurisdictional claims in published maps and institutional affiliations. |
© 2022 by the authors. Licensee MDPI, Basel, Switzerland. This article is an open access article distributed under the terms and conditions of the Creative Commons Attribution (CC BY) license (https://creativecommons.org/licenses/by/4.0/).
Share and Cite
Dotoli, M.; Milo, E.; Giuliano, M.; Tiozzo, A.; Baricco, M.; Nervi, C.; Ercole, M.; Sgroi, M.F. Development of an Innovative Procedure for Lithium Plating Limitation and Characterization of 18650 Cycle Aged Cells for DCFC Automotive Applications. Batteries 2022, 8, 88. https://doi.org/10.3390/batteries8080088
Dotoli M, Milo E, Giuliano M, Tiozzo A, Baricco M, Nervi C, Ercole M, Sgroi MF. Development of an Innovative Procedure for Lithium Plating Limitation and Characterization of 18650 Cycle Aged Cells for DCFC Automotive Applications. Batteries. 2022; 8(8):88. https://doi.org/10.3390/batteries8080088
Chicago/Turabian StyleDotoli, Matteo, Emanuele Milo, Mattia Giuliano, Arianna Tiozzo, Marcello Baricco, Carlo Nervi, Massimiliano Ercole, and Mauro Francesco Sgroi. 2022. "Development of an Innovative Procedure for Lithium Plating Limitation and Characterization of 18650 Cycle Aged Cells for DCFC Automotive Applications" Batteries 8, no. 8: 88. https://doi.org/10.3390/batteries8080088
APA StyleDotoli, M., Milo, E., Giuliano, M., Tiozzo, A., Baricco, M., Nervi, C., Ercole, M., & Sgroi, M. F. (2022). Development of an Innovative Procedure for Lithium Plating Limitation and Characterization of 18650 Cycle Aged Cells for DCFC Automotive Applications. Batteries, 8(8), 88. https://doi.org/10.3390/batteries8080088