1. Introduction
Lithium ion batteries are a widely used option for energy storage. Due to their numerous applications, they are suitable both as stationary energy storage devices [
1] and for supplying energy to several mobile applications [
2,
3].
Ren et al. [
4] and Zhang et al. [
5] stated that the overcharging of lithium ion batteries is still one of the most common safety problems for large-scale applications of lithium ion batteries. The main causes are manufacturing defects and malfunctions of the battery-management system (BMS) [
5].
To ensure safety, and thus the longest possible service life, the battery must be monitored efficiently and precisely. This is of particular importance for larger cell assemblies, such as those in electric vehicles (EV) and energy storage systems (ESS). Liao et al. [
6] pointed out that, due to the wide use of lithium ion batteries in safety-critical applications, a main task of the industry and academia is to continuously improve the monitoring methods for lithium ion batteries.
In order to ensure the error-free monitoring of lithium ion batteries, measurement signals must be recorded redundantly [
6]. The challenge here is to realise the redundancy and accuracy of the monitoring system in a cost-effective and space-saving way. In addition, the data volumes of the monitoring system must not overload the battery management system (BMS), so that the total number of sensors is limited.
Presently, cell monitoring in general is primarily based on the parameters of cell voltage and cell temperature [
7]. To detect a thermal runaway, the cell parameters cell voltage/current, cell temperature, and the occurrence of characteristic gases are currently used [
6]. Liao et al. [
6] lists three methods that correspond to the current state of the art for detecting thermal runaway in lithium ion batteries:
Real-time detection of the cell/module terminal voltage and its surface temperature;
Real-time monitoring of the internal temperature and the strain of the lithium ion battery;
Real-time monitoring of vent gas components during thermal runaway.
The method most frequently used for battery monitoring is the real-time detection of cell voltage and cell temperature at defined points in the battery module [
6].
Based on these parameters, Duan et al. [
8] define three state areas for nickel-manganese-cobalt oxides (NMC)-based lithium ion batteries. In the normal area, the cell is within its intended working window. In this case, the voltage limits are defined from 2.5 V (lower limit) to 4.2 V (upper limit). The cell temperature is allowed to fluctuate between −30 °C and 55 °C. Between the damage area where the cell suffers irreversible damage and the normal area, the authors define a so called safe area. Duan et al. [
8] assume that the cell is not irreversibly damaged up to a cell voltage of 4.5 V (upper limit) or 1.8 V (lower limit) and cell temperatures between −40 °C and 80 °C and thus does not enter a permanent critical range.
As soon as the limits of this safe area are exceeded, the cell enters an irreversible, critical state. If an abnormal signal (i.e., outside the defined safe area) occurs, an alarm is triggered by the battery management system (BMS) [
9]. To reduce false alarms, redundant voltage sensors are usually used for each cell unit [
6]. However, this increases the cost, the amount of wiring, and the amount of data that the BMS has to process for the real-time monitoring of the battery. Further on, the problems of temperature sensors are a comparatively low detection accuracy and a high susceptibility to environmental influences [
6].
In [
10], it is highlighted how the additional monitoring of batteries can be completed by providing strain data based on the expansion behavior of the battery to the BMS. With regard to non-critical cell states, this expansion behavior has been investigated in various previous works for both pouch cells [
11,
12,
13,
14], prismatic cells [
15], and cylindrical cells [
16].
In order to create another possibility of battery monitoring, and thus increase redundancy while circumventing the technical and design disadvantages of previous methods, this work investigates a monitoring system for detecting critical conditions in pouch cells due to their expansion behavior. The main focus will be on the suitability of strain gauges. Those are promising for the smart, cost-effective, and low-energy monitoring of lithium ion batteries and battery modules.
For the investigations conducted in this work, an adapted definition of a critical cell state is useful. In this work, the critical state is reached as soon as reactions take place that are not provided in regular cell operation. These are mainly decomposition and/or oxidation reactions that result in a significant release of heat and gases; they will be discussed in detail in the subsequent sections.
In the following sections, the used experimental setup is presented. Furthermore, the expansion behavior under normal conditioning is compared to that in an overcharge range. Due to long-term observation measurements and statistical analysis, statements are made about the sequence and reproducibility of critical events as well as the derivable detection possibilities (detection criterion). Finally, the findings from this work are discussed against the background of further research.
2. Theory
The expansion behavior of lithium ion batteries usually results from the superimposition of several effects that occur in parallel and/or with a time delay depending on the boundary conditions. The most important expansion effects during the normal operation of the cell are caused by
the intercalation of lithium ions into the active material [
11,
13,
15]
thermal swelling (volume increase of the cell components due to a temperature in-crease) [
17,
18,
19]
lithium plating (caused by low cell temperatures (<0 °C), high charging currents, high cell voltage) [
20,
21].
A significant expansion effect is the intercalation of lithium ions into the active material. These process occur every time the cell is charged. The process of intercalation/deintercalation has not yet been fully investigated. However, there are several models that describe the process [
22,
23,
24,
25].
The intercalation of lithium ions leads to an increase in the volume of the graphite anode [
22,
26]. This is due to the fact that the compound of carbon atoms with intercalated lithium ions requires more space than without intercalated lithium. Since the process of intercalation (and deintercalation) is reversible, the change in the volume of the cell due to this phenomenon is also reversible.
Another major cause for a volume change of lithium ion batteries is thermal swelling. According to [
18], there are two internal heat sources in a lithium ion battery: heat generation caused by entropy change and Joule’s heat, also called the heat of the current.
Joule’s heat describes the conversion of electrical energy into heat due to the ohmic resistance of the electrical conductor through which the electrical current flows. Dissipation work is performed in the form of friction work, which is completely converted into heat. Joule’s heat is, therefore, irreversible and is released both during charging and discharging. It is always exothermic [
27].
The so-called “entropy heat” occurs due to the chemical reactions taking place in the cell. It balances the residual energy in the energy-conversion process between the enthalpy and the free reaction enthalpy (Gibbs energy) [
18]. The “entropy heat” depends on the direction and the extent of the chemical reactions taking place. It is only exothermic during the discharge process [
17].
Lithium plating is caused by the accumulation of lithium ions between the SEI (Solid Electrolyte Interface) and the anode surface. Due to an excess of lithium ions, more lithium ions move to the anode than can be intercalated in the same time step [
20]. The limiting factor is the rate at which the lithium ions are deposited onto the anode material [
21].
Low cell temperatures lead to lower intercalation rates, as chemical reactions generally occur more slowly at lower temperatures. The charge current determines how many free-charge carriers are moved within a time step. A high charge current results in a large number of lithium ions being moved from the cathode to the anode in a given time step.
In the normal use case, lithium plating leads to a steady, irreversible increase in volume over the entire service life, as was investigated in [
16].
Outside the normal operation range of the cell (see definition of state areas in
Section 1), there are mainly external influences that cause cell parameters such as cell temperature or cell voltage to exceed critical limits [
28]. The external influences, in the form of misuse, lead to a sequence of events that can ultimately result in a critical cell state. The most common types of external misuse can be summarised into three categories [
29]:
thermal
electrical
mechanical misuse.
With regard to [
4,
5], overcharging was carried out as an electrical abuse for initiating critical cell states in that work. This guarantees a well-known input of energy, i.e., the quantification of the applied cell stress.
According to [
5,
30], a cell overcharge initially results in a further discharge of lithium ions from the cathode, which reach the anode via the separator and are deposited there. This initially corresponds to the continuation of the charging process of the battery. Consequently, the cell voltage increases steadily with an increasing delithiation of the cathode. This generates Joule’s heat, which causes the cell temperature to rise [
31].
In [
32], pouch cells with a NMC cathode and graphite anode were overcharged to States of Charge (SOC) values between 100% SOC and 250% SOC. Subsequently, the anode and cathode structures were examined with different postmortem methods. Bareno et al. [
32] found that the degree of lithiation of the cathode drops sharply from a SOC of about 120% and continues to decrease at higher overcharge states. Bareno et al. [
32] associate this first, marked drop of the lithium content in the cathode with the incipient incorporation of lithium ions into the SEI layer of the anode. Bareno et al. [
32] mention that this could also be related to changes in the crystal structure of the cathode, which is why the lithium ions cannot intercalate back during discharge. Peng et al. [
33] point out that the first excessive delithiation of the cathodes’ material results in irreversible structural changes of the cathode material and thus in oxygen release as well as the oxidization of organic solvents.
Qi et al. [
34] overcharged 10 Ah
/graphite lithium ion batteries to different SOCs and investigated the morphological and structural changes of the active material post mortem. They found that an increasing number of small particles appeared in the cathode structure with an increase of SOC. Qi et al. [
34] associate this with the gradual powdering of the cathode material with ongoing overcharge. Qi et al. [
34] observed an irreversible conversion of the hexagonal phase of the cathode material. They found that the deintercalation of lithium ions from the cathode leads to an increase of covalency between the M (Ni, Co, Mn)-O bonds, which causes the lattice parameter c to decrease with an increase of SOC. Qi et al. [
34] point out that a destruction of the graphite structure of the anode was not observed during overcharge.
Further overcharging leads to reaction between the lithium ions and the components of the primary SEI and cause its destruction [
30]. As soon as the SEI is partially destroyed, reduction reactions of electrolyte components with the anode occur at these points, as the SEI layer can no longer fulfil its function. Lithium ions are also significantly involved in these reduction reactions. The consequence is an initial significant gas formation within the cell [
35].
There are several studies on the gas release of lithium ion batteries in the case of different abuses [
8,
36,
37,
38]. During overcharging the gas formation depends on the cell chemistry in detail. Fernandes et al. [
37] point out that there is no data available in the literature on the gas analysis of the overcharging process of lithium ion batteries with a NMC cathode. In this work we measured the released gases during overcharge with a Fourier Transform Infrared Spectrometers (FT-IR). The results are presented in
Section 4.
Fernandes et al. [
37] found that gases are mainly released in two steps while overcharging. In the first step, the gases dimethyl carbonate (
), ethylmethyl carbonate (
),
,
,
,
, and
were released. This occurred until an SOC of about 120% and before cell opening.
The gas releasing decomposition reactions (reduction reactions) of the electrolyte at the anode are exothermic. As a result, the cell temperature increases. According to the Arrhenius equation, the reaction rate increases as the temperature of the system rises.
The gases accumulate inside the cell and lead to a pressure build-up, which results in an initial significant cell expansion [
12]. With continued overcharging, the internal cell pressure steadily increases. If the mechanical load limits of the cell envelope are exceeded, this can lead to the cell opening. Fernandes et al. [
37] found the second step of gas releasing while the cell was opening at an SOC of around 130%. They measured
,
, and
as new gases.
At a certain SOC, the hexagonal crystal structure of the carbon of the anode is completely occupied by lithium ions. Afterwards, no more lithium ions can intercalate [
39,
40]. From this point on, there is a massive accumulation of lithium ions on the anode surface. As a result, the plated lithium forms dendrites which grow continuously at the anode [
41].
These lithium dendrites react with electrolytes and generate a large amount of the gases mentioned, heat, and continuous growth of lithium dendrites, which could further penetrate the separator and hence result in an internal short circuit of the batteries [
42].
Furthermore, Rago et al. [
43] found that the reduction reactions of the electrolyte with the anode material are accompanied by a significant dendrite growth at the anode. Rago et al. [
43] attribute this to the onset of electrolyte reduction reactions at the anode, in which a certain proportion of the lithium ions is deposited as pure lithium. Further overcharging generates a great value of Joule’s heat due to the increasing internal cell resistance [
41].
Further overcharging leads to a rise in cell voltage and the penetration of the separator by dendrite growth. Finally, an intense local short circuit can occur [
29]. This causes the release of very high amounts of heat (Joule’s heat caused by high current in a very short time in case of short circuit), which in turn leads to separator melt [
44]. This finally leads to the failure of the separator and thus to a thermal runaway.
3. Materials and Methods
3.1. Cells
In this work, we investigated cells from lithium ion batteries in pouch cell format. The manufacturer of the cells is “Kokam” (serial number: SLPB125255255H). The cathode is based on
(NMC). The anode is made of graphite. The electrolyte is mainly liquid and contains polymeric components. The parameters of the investigated cells are listed in
Table 1.
3.2. Experimental Setup
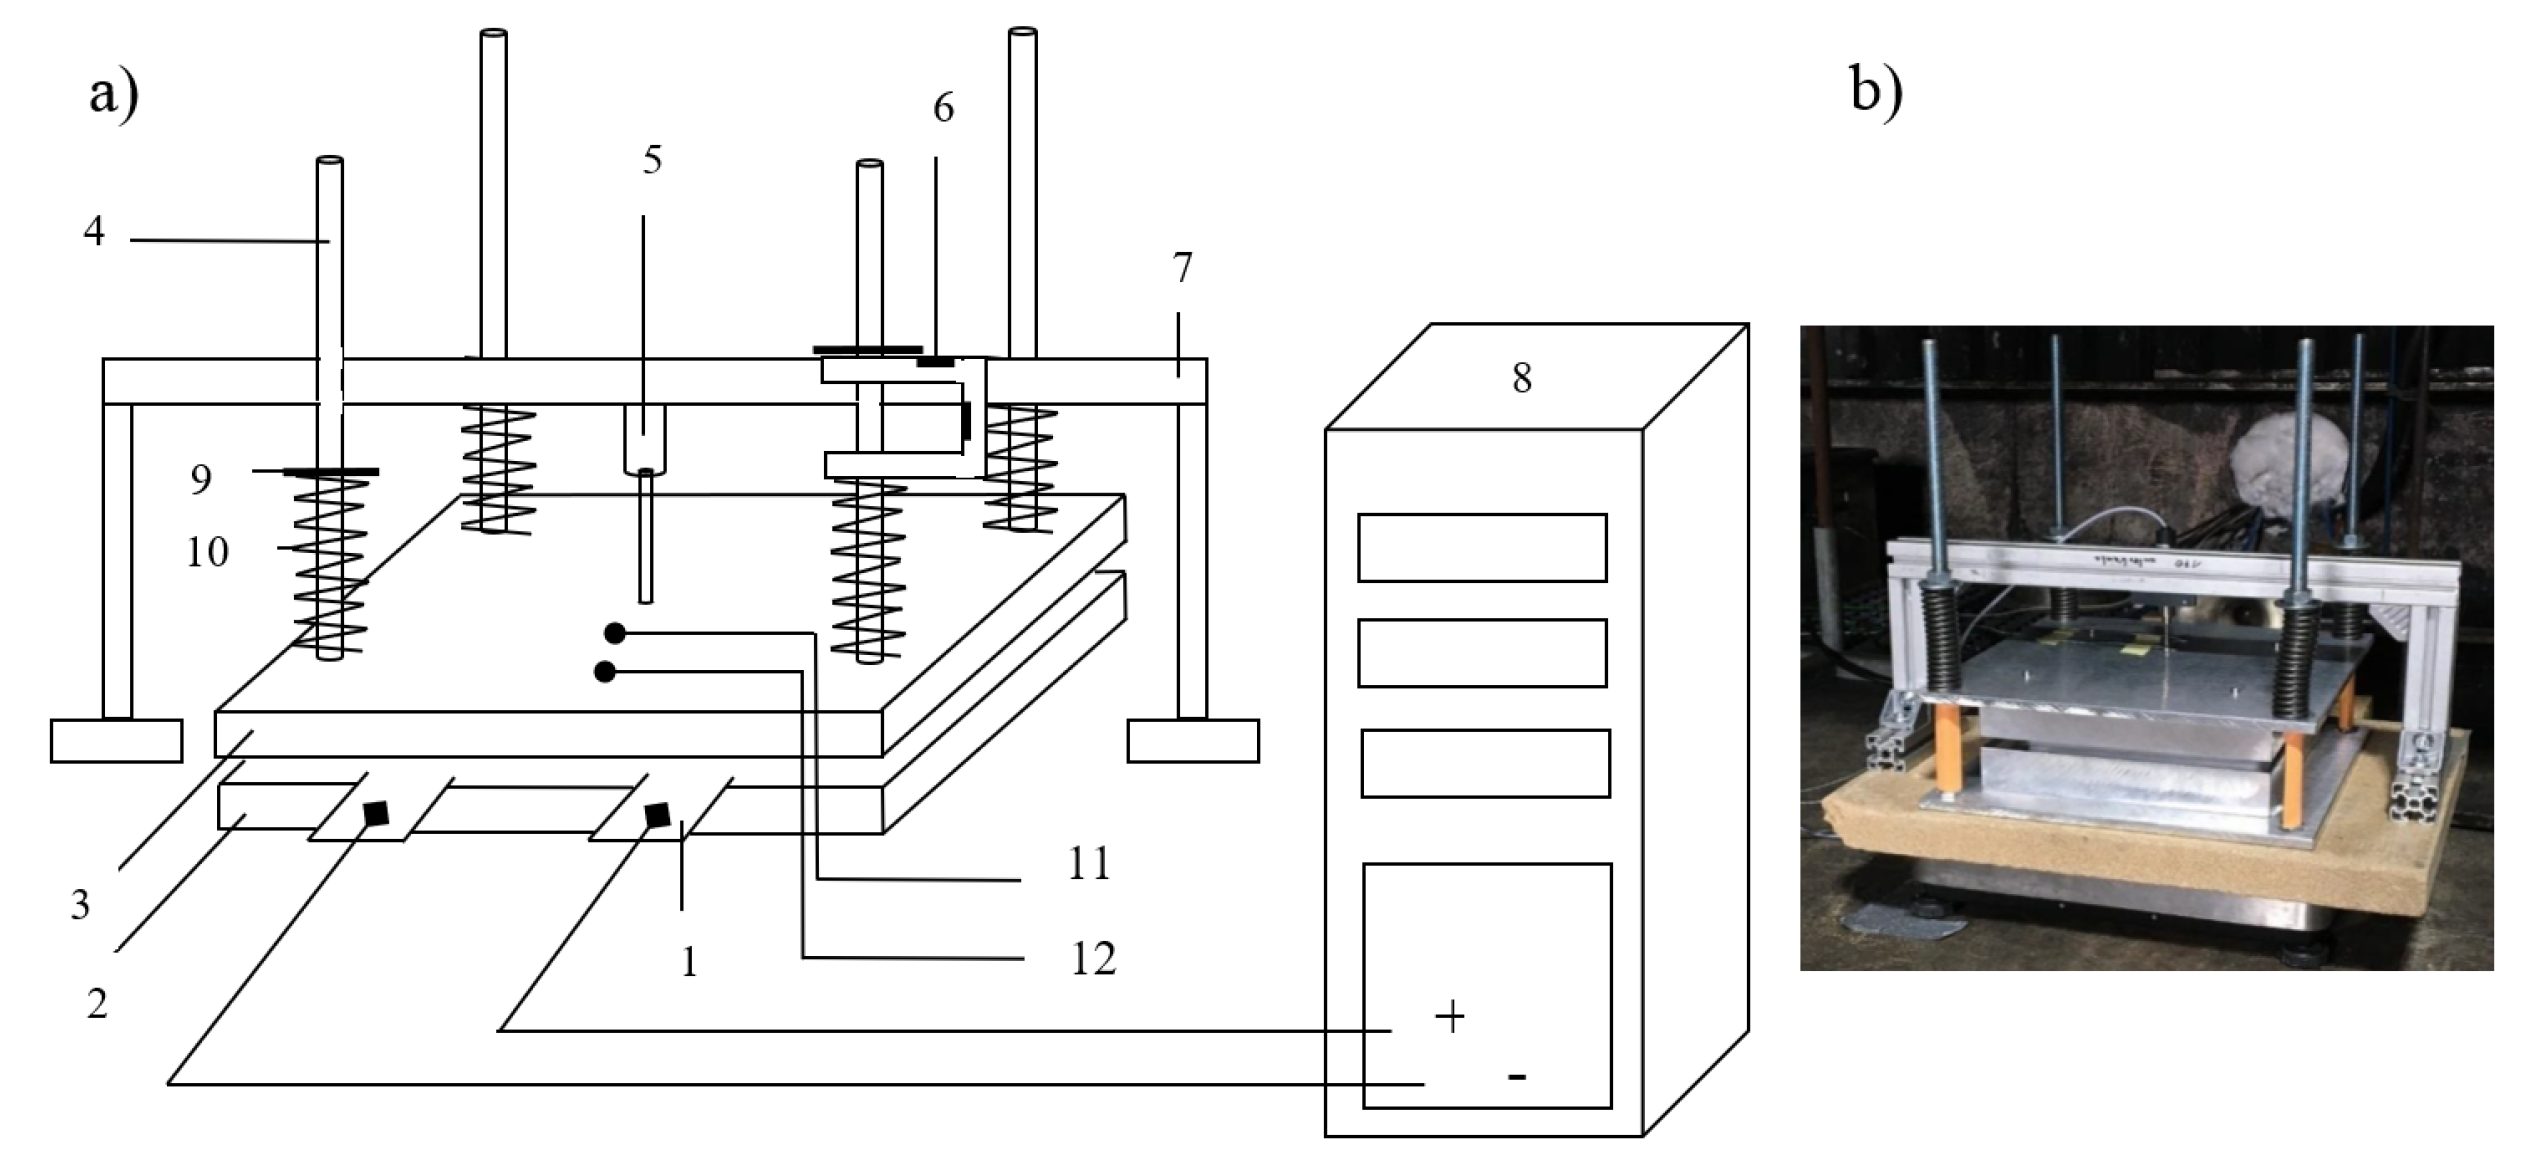
Figure 1 shows the basic experimental setup. It consists of a clamping device (2, 3, 4, 9, 10), a bidirectional power supply (8), and the lithium ion battery (1), as well as sensors of temperature (11, 12) and of cell expansion (5, 6). The clamping device applies the required clamping pressure (50 kPa) to the cells. The clamping pressure is adjustable by means of the compression springs (10).
A bidirectional power supply from “REGATRON” was used for cell cycling. The TC.GSS.20.65.4WR.S covers a voltage range of (0 ± 65) V and a current range of (0 ± 385) A [
12]. Additional software (“BatControl”) was used to implement a standard constant-current and constant-voltage (CC–CV) charging and discharging profile.
The accurately measurement of the cell voltage occured with the four-wire measurement method. Thereby the voltage drop/potential drop could be avoided, which is contained in the voltage measurement about the power line.
With the aid of an inductive displacement sensor, “IEDT10-K-2410” (5), which was positioned centrally above the upper plate of the clamping device, the expansion of the cell was measured. The measuring range of the cell expansion measuring device was of 0 mm to 10 mm. The measuring uncertainty of the “IEDT10-K-2410” was ±0.5%.
In addition to the thickness change the equivalent force change of the clamping force was measured using the strain gauges on the modified load cell (6). Therefore, strain gauges of type “6/120 LY41” from “HBM” were applied in the form of a Wheatstone half-bridge. The load cell was compressed when the cell pushed the cover plate (3) upwards. The load cell measured the resulting force, composed by pre-load and change due to increasing or decreasing cell volume. The uncertainty of the force measurement was ±7 N.
Cell temperature was measured using two type-K thermocouples (11, 12). Thermocouple 1 (11) measured the cell temperature centered on the cell surface. Thermocouple 2 (12) measured the cell temperature near the pole lugs. The uncertainty of the temperature measurement was ±0.3 K.
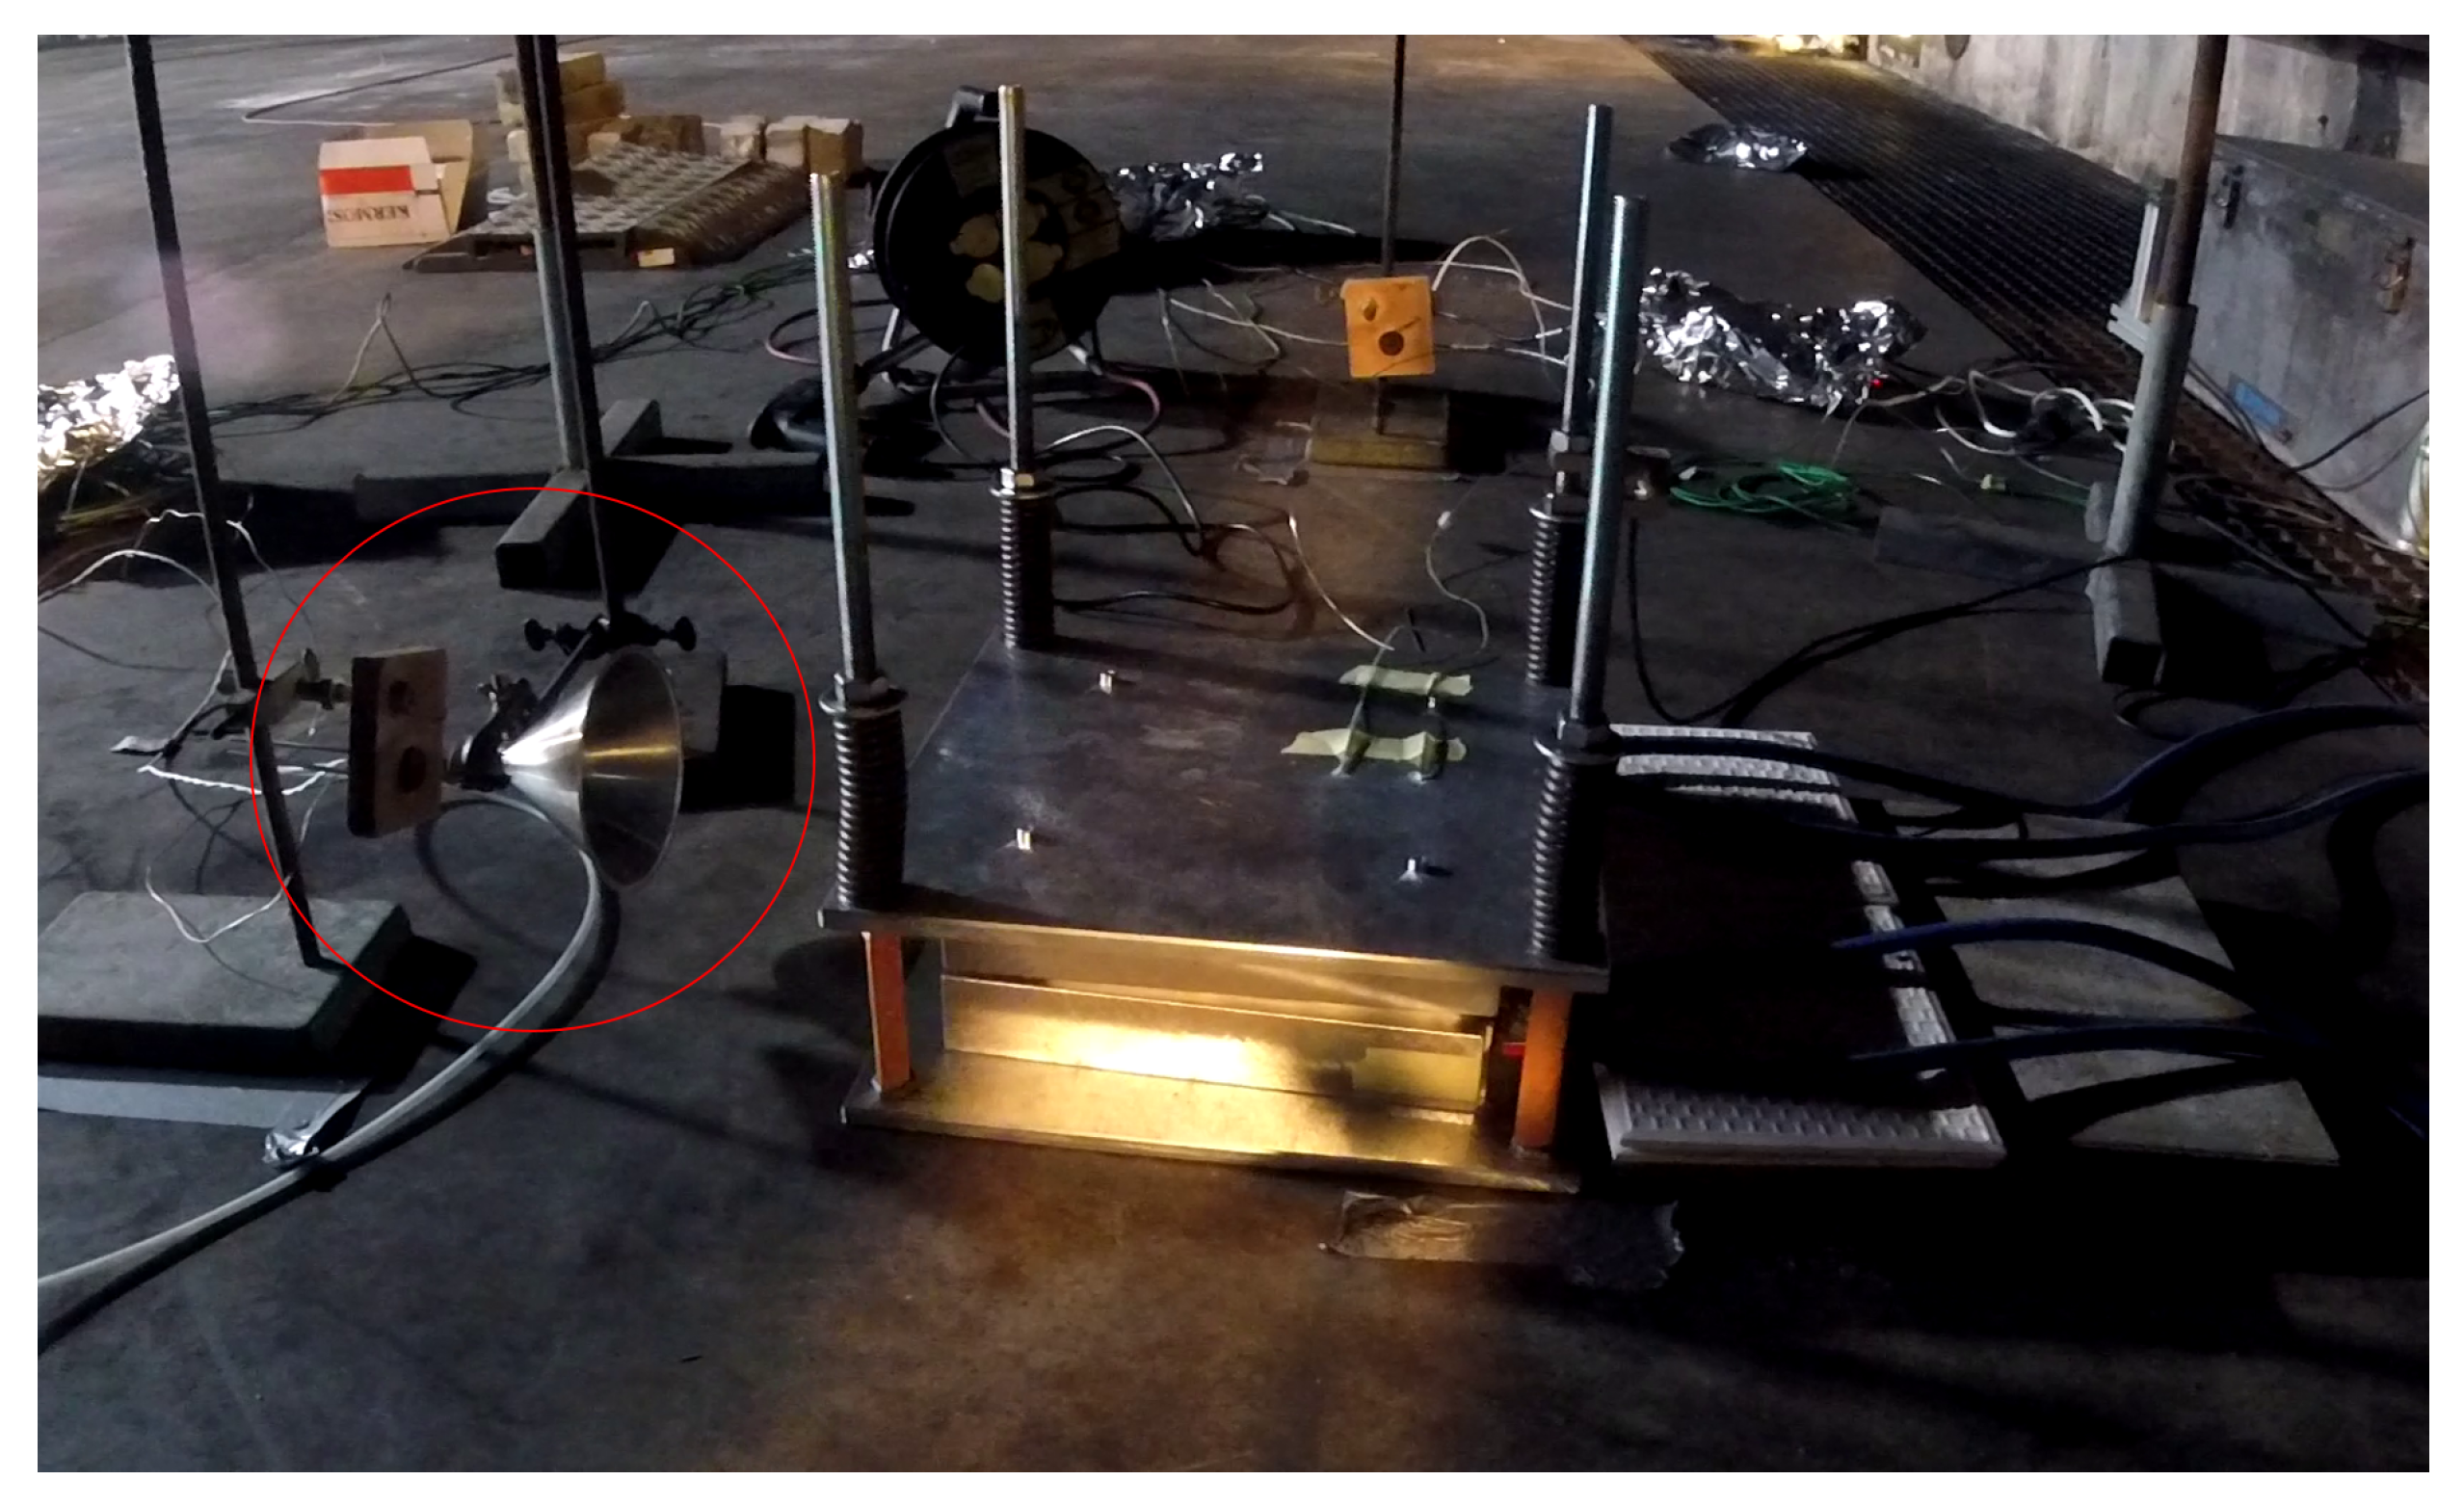
The released gases were collected with a stainless steel funnel placed at the height of the cell on the opposite side of the pol lugs (see
Figure 2).
The horizontal distance between the funnel and the cell was always 30 cm. An FT-IR (Gasmet DX4000) was connected to the funnel. The determined gas concentrations were measured in ppm and depending of the experiment duration.
3.3. Experimental Procedure
During charge and discharge cycles a standard CC–CV profile with 150 A (2C) was performed. After reaching the voltage limits (upper: 4.2 V; lower: 2.7 V) while charging, respectively discharging the voltage was clamped at which time was held (CV) until the current sinked to C/20 (approx. 7 A).
In pre-tests the maximum cell capacity was determined by means of charge counting. Therefore the internal charge counter of the TC.GSS.20.65.4WR.S was used which integrates the amount of charge carriers that are moved out of (charging process) or into (discharging process) the bidirectional power supply over time. The average maximum cell capacity determined in 8 charge/-discharge cycles with 4 identical cells was approximately 78 Ah.
With reference to [
45] the
estimation during all experiments was carried out according to Equation (
1):
is a well known state of charge at a start time . is the current flowing into or out of the battery and is the leakage current, which is converted into heat by dissipation work in the form of friction work due to the ohmic resistance of the electrical conductors. The difference of the two currents is integrated over the time interval and set in relation to the maximum cell capacity .
The cell voltage near the margins of the SOC (upper and lower voltage limit) differs significantly from the average cell voltage [
46]. Therefore the end-of-discharge voltage (2.7 V) or end-of-charge voltage (4.2 V) can be used for
determination. If the current of the CV method falls below the termination criterion (C/20) a SOC of 100% or 0% is assumed.
According to Equation (
1) any SOC value between 0% SOC and 100% SOC is reached during subsequent charging/discharging processes. However, any SOC value above 100% SOC can also obtained.
The integration of the current over time (charge counting) was performed internally by TC.GSS.20.65.4WR.S. Therefore the leakage current through the conductor between bidirectional power supply and battery could not considered into account. The systematic error caused by the unrecorded leakage current should be minimised. For this porpose a copper conductor with a cross-section of 140 mm2 and a length of max. 3 m (max. 6 m in total) is used between the battery and the current source.
In standard conditioning tests the dynamic (transient) swelling of the cells was measured over the state of charge (SOC) in a range between 0% and 100% SOC.
Overcharge tests were carried out after the investigation of the swelling behaviour in standard SOC ranges. Therefore the cell was charged to 100% SOC using the CC-CV method resulting in a
(
) = 100%. Overcharges up to SOC’s > 100% with constant current load (CC) were performed from this point on. An overview of the overcharge tests performed shows
Table 2.
The overcharge current varied between 1 C and 3 C. The overcharge procedure terminated if the maximum SOC was reached. First slow overcharge tests (1 C) were started up to about 150% SOC. The aim is to identify a reproducible sequence of events, in particular an initial measurable increase in the cell volume.
Based on these findings, further overcharge tests were performed until the first significant volume increase (112%). Subsequently overcharge tests were carried out up to 200% SOC. These experiments were based on the assumption that a thermal runaway would certainly occur. The aim of this test variant was to find out which critical cell states developing to the point of cell fire.
Experiments performed up to cell fire during the overcharge tests simultaneously provided data for the occurrence of events prior to cell fire.
4. Results
4.1. Cell Swelling in Standard Conditions
Periodic (reversible) changes in cell thickness due to the process of intercalation, respectively deintercalation, could be measured during the preconditioning tests. In 6 tests thickness changes of 0.22 mm up to 0.23 mm were measured within one charge cycle (see
Figure 3). This is consistent with previous findings from Bitzer et al. [
12].
Figure 3 confirms a dependence between cell thickness and state of charge of the cell. It can be clearly seen how the cell thickness increases during the charging process and reaches a relative maximum at the end of the charging process. Afterwards the cell thickness decreases again as the cell is discharged. This process occurs periodically with the charging cycles.
First of all it can be seen that the cell temperature increases steadily on average with increasing time. This is mainly due to the release of Joule’s heat (see
Section 2).
The thickness of the cell changes periodically with the charging and discharging process, resulting mainly from the reversible process of intercalation/deintercalation of lithium ions into and out of the active material. Furthermore it can be seen that the offset of the cell thickness shifts slightly upwards with increasing time (and thus steadily increasing cell temperature). This effect shows the influence of cell temperature on cell thickness (see thermal swelling in
Section 2). But in the area of standard conditioning this influence is small compared to the reversible change in cell thickness by the reason of the intercalation/ deintercalation of lithium ions into the active material.
The temperature rises slightly at high charging currents. If the charging or discharging current decreases in magnitude, the measured cell temperature also decreases slightly. This behaviour can be observed both during charging and discharging. From this it can be concluded that the cell temperature change is essentially caused by Joule’s heat (see
Section 2).
4.2. Critical Cell States
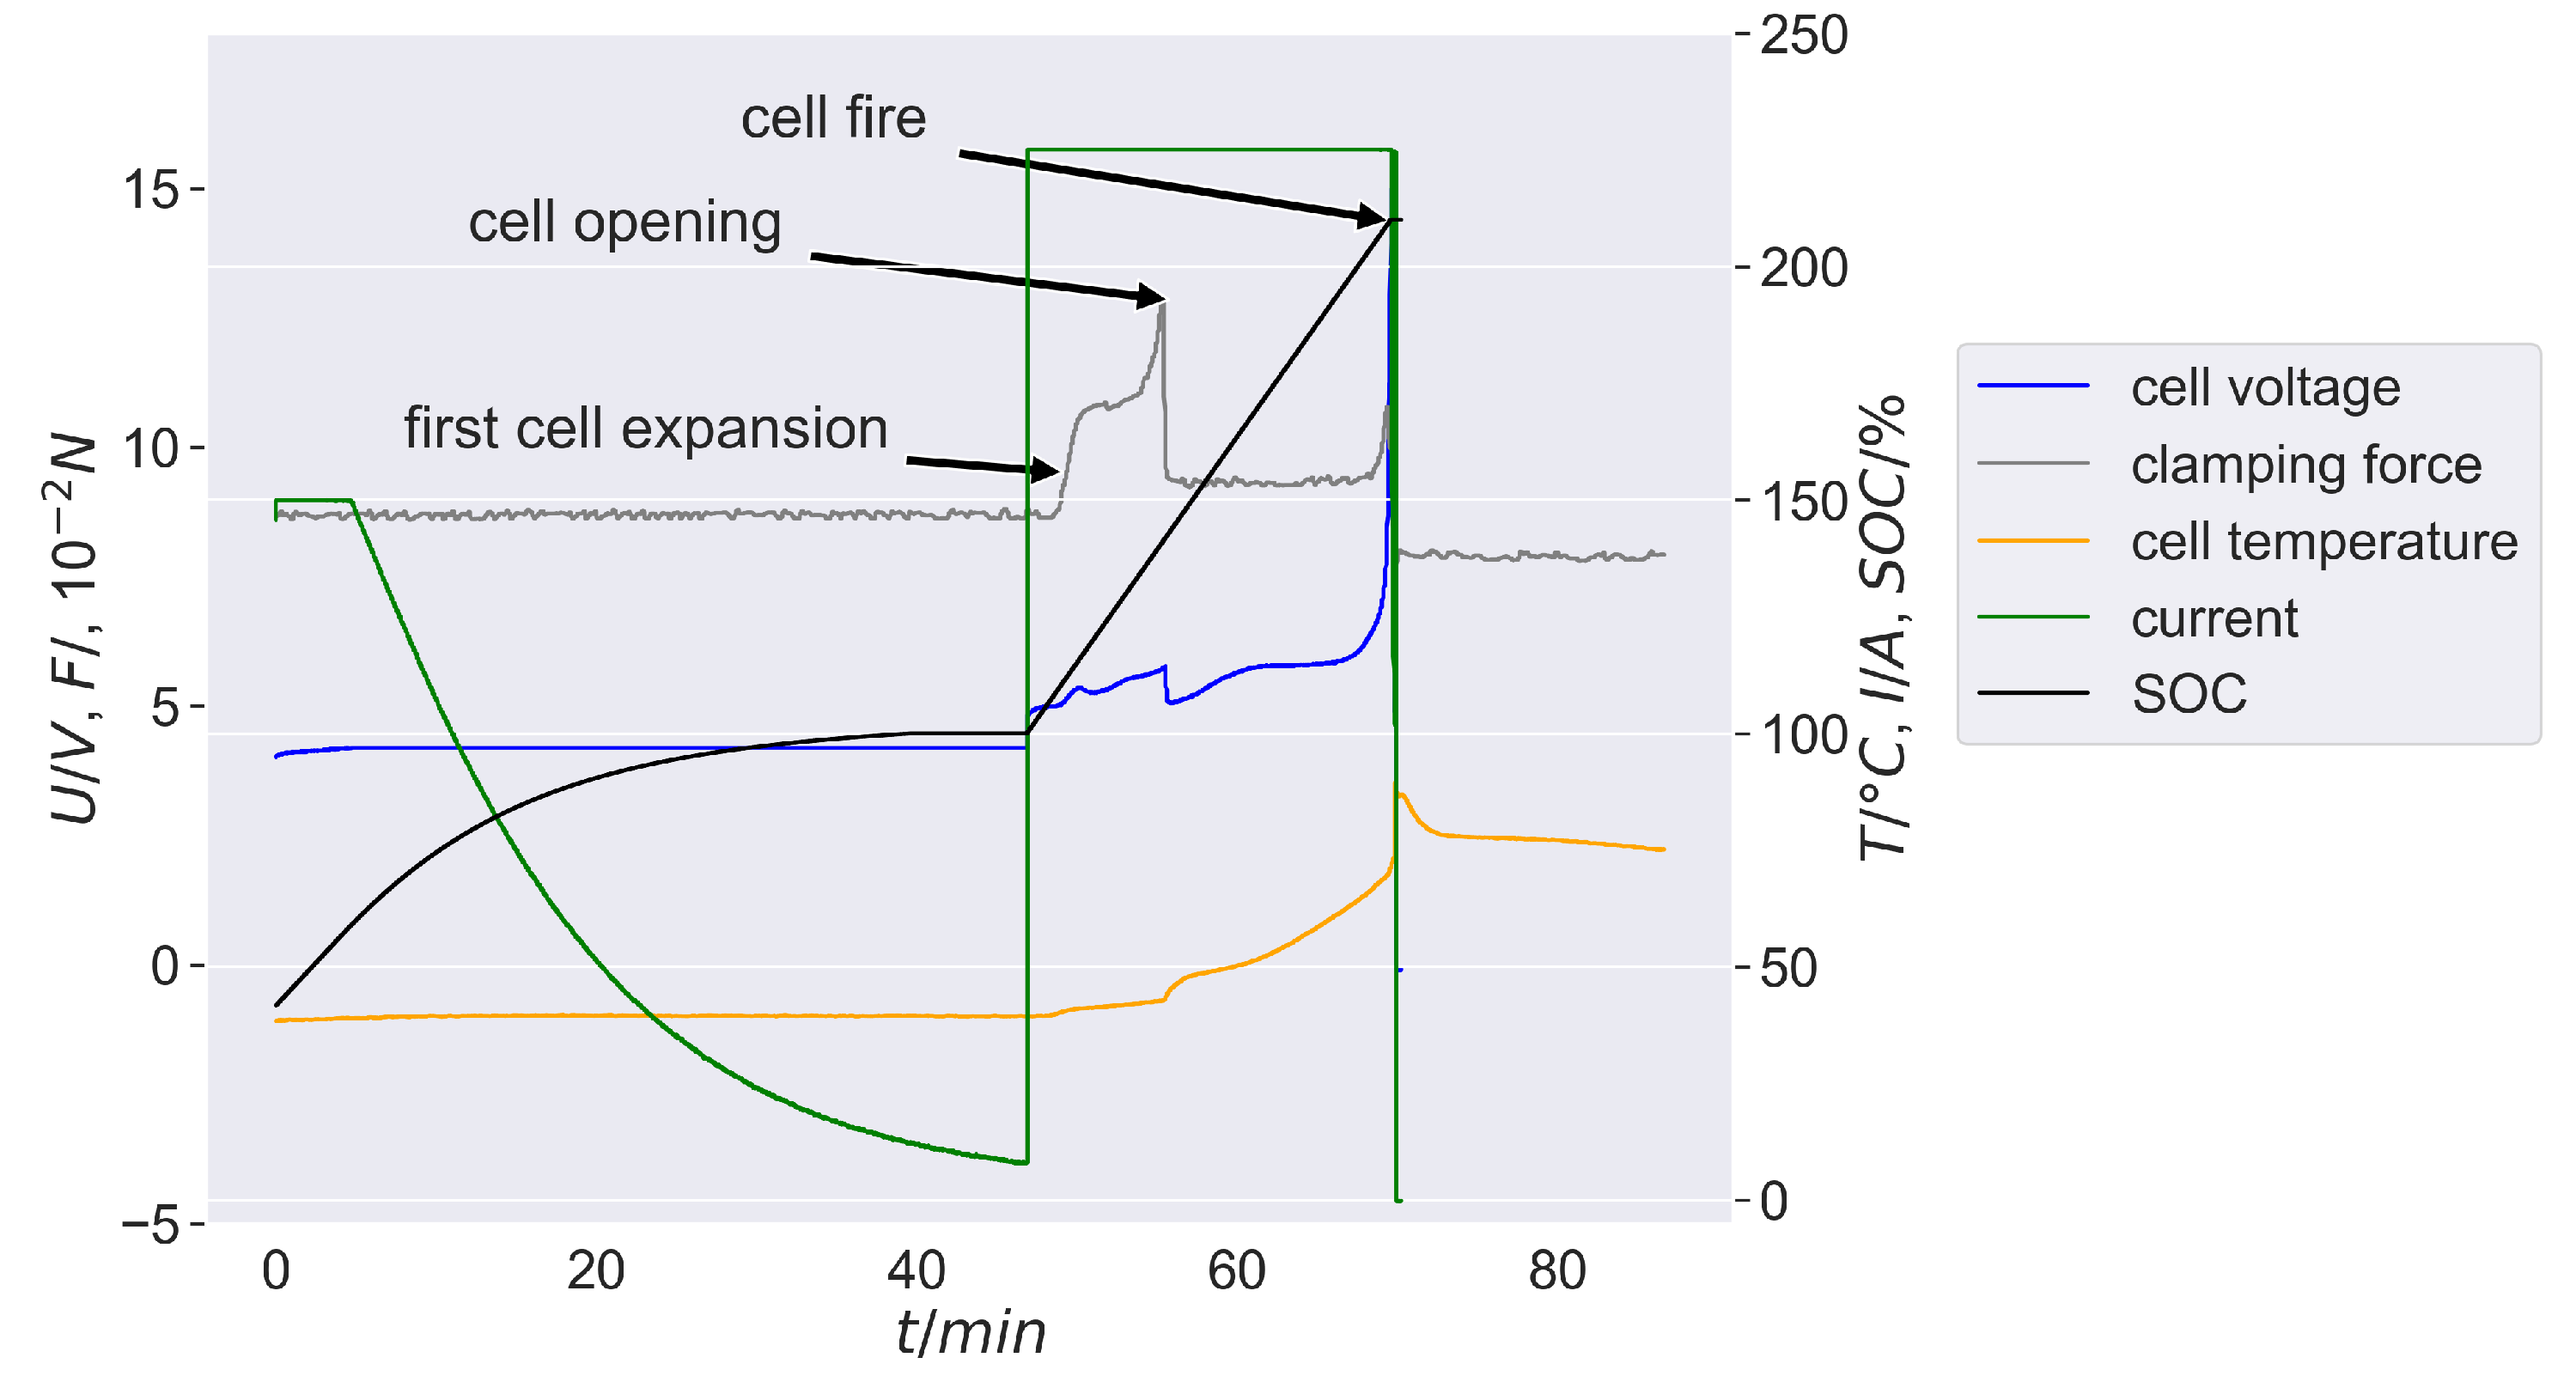
Figure 4 shows a representative example of the described overcharge process over time up to 210% SOC. Three peaks are cognisable in the curves of cell tension, cell temperature and clamping force: they mark the first cell expansion, the first cell opening and the beginning of the cell fire.
In
Figure 4 a significant increase in the clamping force is at about 112% SOC as a result of the first mainly gas release reactions in the cell. Thereby the first significant cell expansion marks this. The clamping force rises to a relative maximum of approx. 1090 N simultaneously. This behavior corresponds to a force increase of around 240 N compared to the offset (850 N). Cell temperature grains from approx. 39 °C up to 42 °C. The cell voltage grows up to 4.9 V.
The clamping force increases steadily to a global maximum of about 1290 N with further overcharging. The cell voltage reaches a relative maximum of approx. 5.8 V and the cell temperature increases up to 47 °C. At approx. 149% SOC the first cell opening occurs which can be seen in the rapid drop of the clamping force to 920 N. Despite the significant decrease the clamping force remains around 60 N above the offset before overcharging.
Mao et al. [
47] found that massive lithium plating occurs at the cathode from SOC values of approximately 130% to 150%. According to [
48,
49], deposited lithium takes up significantly more volume than an equivalent proportion of intercalated/deintercalated lithium ions.
The cell expansion is determined by the gas formation inside the cell before cell opening. The overpressure in the cell decreases with the cell opening, whereby gases/aerosol are released into the environment. Depending on the gas release rate, it cannot be ruled out that a slight overpressure remains in the cell if more gas volume is formed in the cell in the same time step than can escape through the cell opening.
Nevertheless, especially due to the offset of the clamping force (and thus cell thickness) of approximately 60 N, which remains constant until cell fire, it can be assumed that a relevant proportion of this offset was caused by lithium plating. Before cell opening, this offset was not visible, as the volume expansion due to the cell-internal gas formation dominated. On the basis of the measured variables recorded in this work, it is not possible to differentiate more precisely what proportion lithium plating has in the offset of the cell thickness after cell opening. Further investigations are required to determine this.
Figure 5 shows the gases released from the time of cell opening, which were measured with the FT-IR.
It can be seen that in the concentration range of 0–50 ppm (respectively, Vol% for
concentration) mainly
and some solvent components of the electrolyte are released: ethylene carbonate (EC,
), vinylene carbonate (VC,
), propylene carbonate (
), diethyl carbonate (
), and dimethyl carbonate (DMC,
). In higher concentration ranges up to 1000 ppm, mainly combustible gases such as ethene (
), ethane (
), propane (
), and methanol (
) were measured in addition to large amounts of methyl ethyl carbonate (
). This essentially confirms the measurements of Fernandes et al. [
37]. It is interesting that methyl ethyl carbonate is released in two peaks, once directly with the cell opening and then again shortly before the cell fire. The absolute values and maxima of the measured gas concentrations vary considerably within the experiments and are therefore only reliable to a limited extent. This is due to the fact that the gas measurement was carried out as a point measurement at one location, and the gases were not collected in a controlled volume. For further analysis of the gas release, please refer to [
50].
With cell opening, the cell voltage drops to approximately 5 V and thus remains clearly above the end-of-charge voltage of the cell. With further overcharging, the cell voltage rises steadily to a global maximum of 8.52 V. The cell temperature continues to rise steadily, with a significantly higher increase after the first cell opening. This is mainly due to the sharp increase in the internal resistance of the cell and the resulting increase in the Joule’s heat as a result of the escape of the electrolyte through the cell opening. The escape of the electrolyte is clearly visible in the gas measurements in
Figure 5.
The clamping force remains constant, which is due to the pressure equalisation through the cell opening. At 210% SOC, the cell voltage reaches its maximum and collapses to 0 V as a result of the internal cell short-circuit. Cell fire occours at this point. The cell temperature reaches its maximum of approximately 90 °C, and the clamping force drops to approximately 800 N, which is roughly 60 N below the offset before the overcharge. The violent burning of the cell components within a few seconds is causative for this purpose.
In
Figure 5 the combustion from gas spezies ethene (
), ethane (
), propane (
) and methanol (
) but also a few solvent components of the electrolyte are mainly dominat at this point. Methyl ethyl carbonate (
) and diethylcarbonate (
)—these gases are no longer measurable shortly after combustion. While the
concentration drops noticeably, the
concentration first increases significantly up to 60,000 ppm at the beginning of the cell fire. Subsequently the
concentration decreases after two peaks and the
concentration rises at the same time. This behavior reflects the combustion situation. The combustion is initially very incomplete and will increasingly completed as the flame front propagates at time.
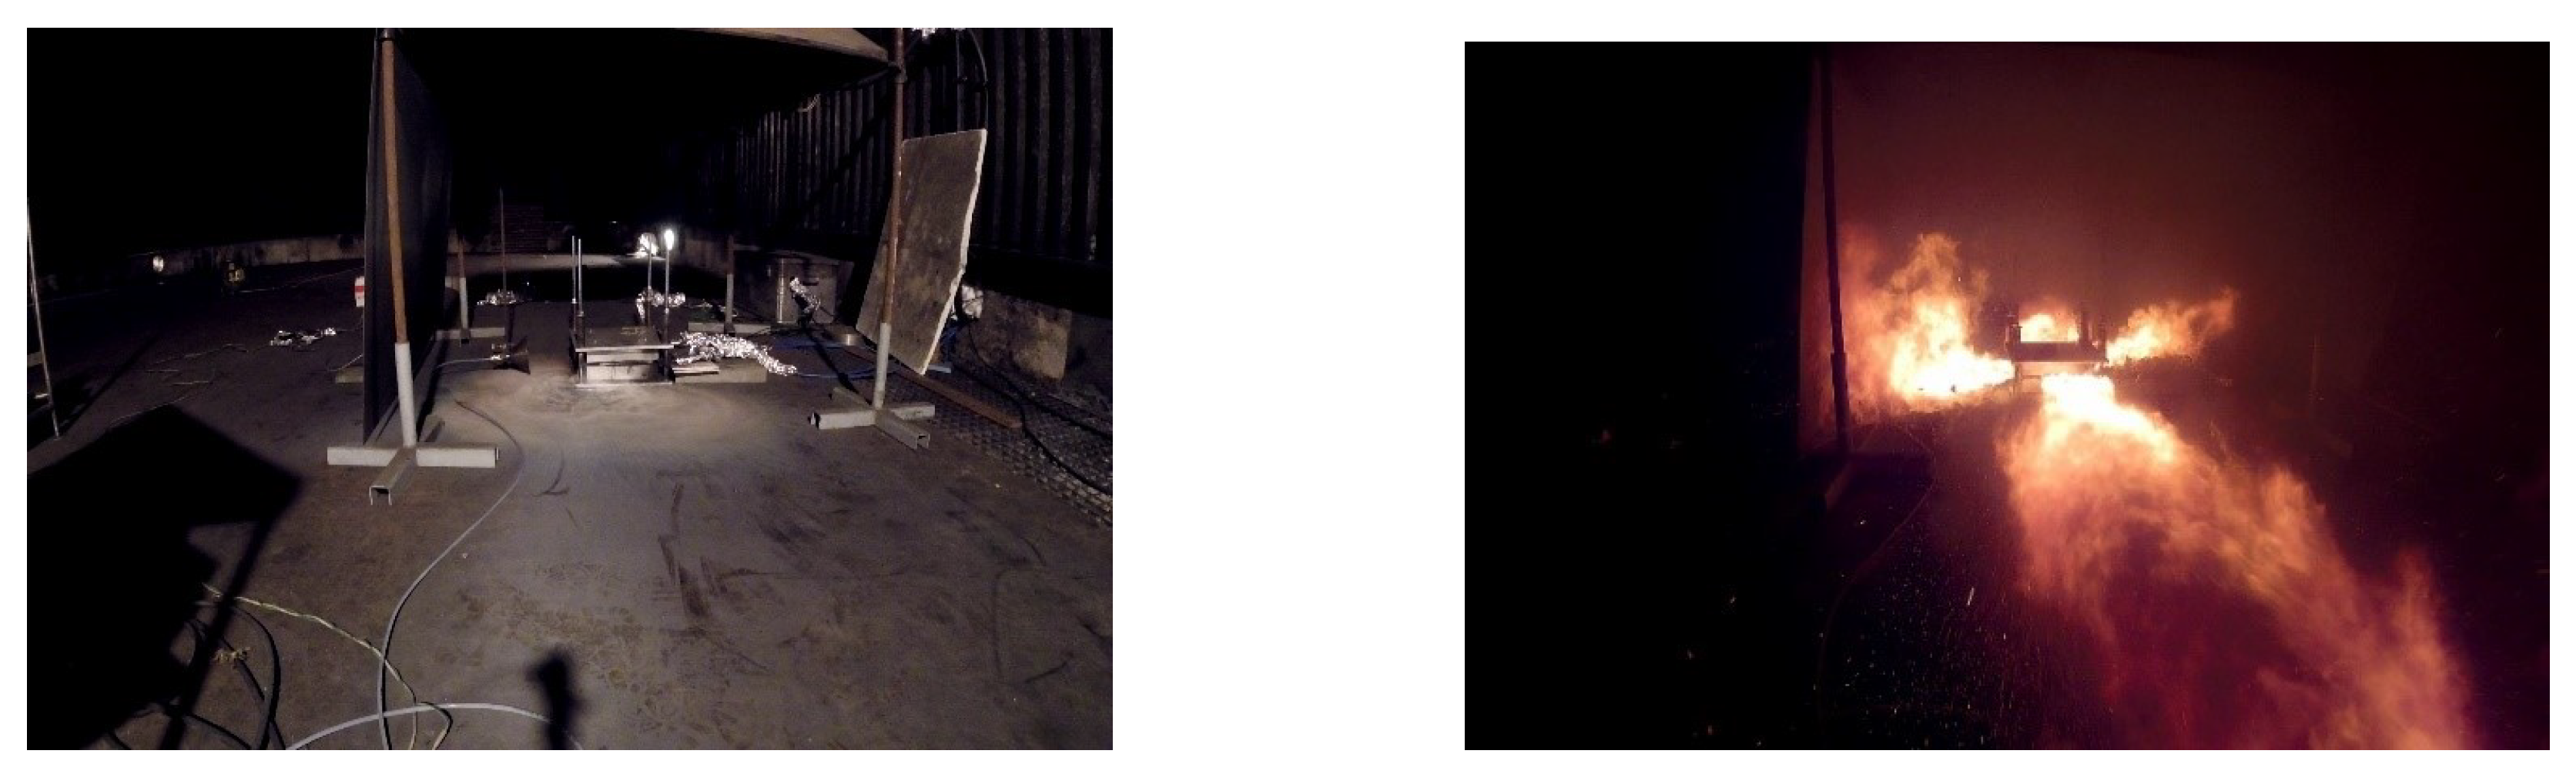
In all overcharge tests a first significant cell expansion because of gas formation within the cell occurred at SOCs of around 112%. This approximately confirms the results from [
32] (120% SOC). The continuing overcharge advaced a pressurisation until the cell opens between 142% and 153% SOC and thus an initial release of gas. The gases escaping into the environment and accumulate near the bottom, especially in the form of pools, as can be seen in
Figure 6, left. An intense local short circuit occurs between 210% and 219% SOC with further overcharging. This leads to the failure of the separator and thus to a thermal runaway in the form of a cell fire, as can be seen in
Figure 6, right.
The sequence of these events is characteristic for all 13 tested cells, as shown in
Figure 7. The critical events occur in the following order in each experiment:
- I
first cell expansion
- II
first cell opening
- III
cell fire.
The SOC increases steadily between these events. It can be seen from
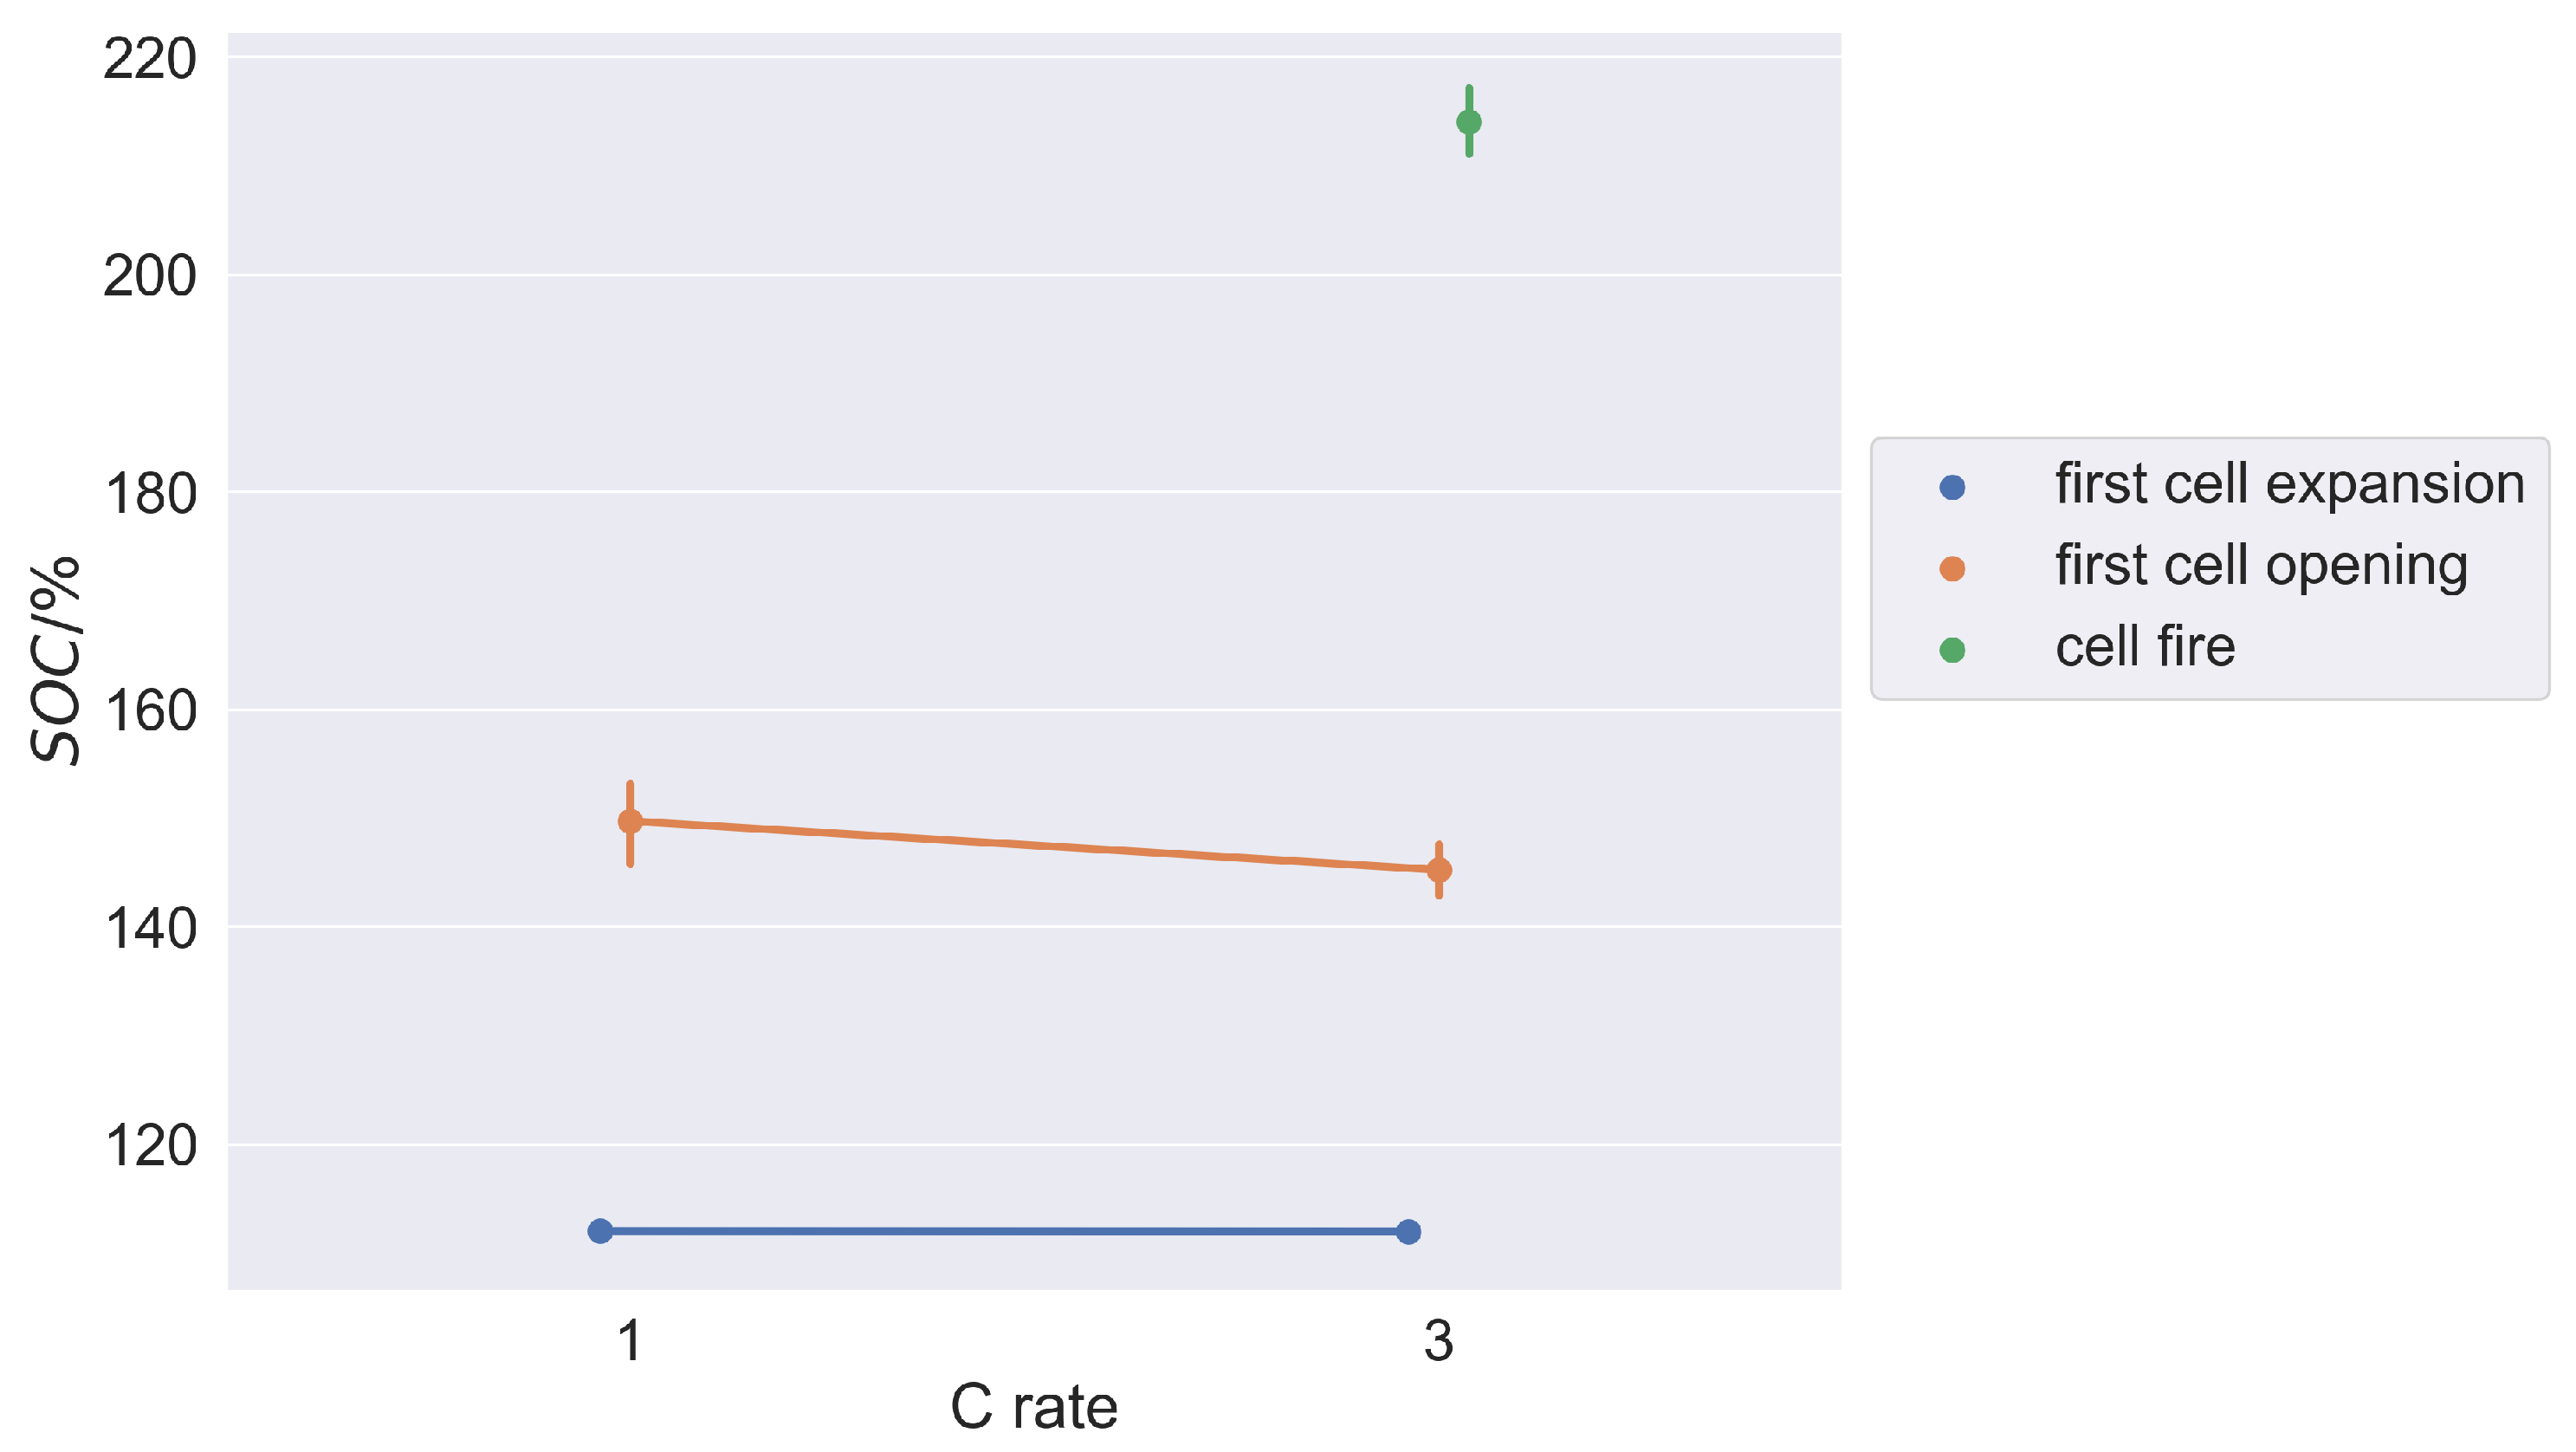
Figure 7 that upper and lower bounds of the SOC values are formed. The maximum and minimum SOC values of the event’s first cell opening and cell fire scatter more strongly than the values of the first cell expansion but lie within an approximately constant band.
Table 3 summarizes the statistical parameters of the SOC values. In particular, the first cell-expansion event shows very good reproducibility. This occurs in all trials (
N = 12) on average at approximately 112% SOC. Cell opening occurred in a total of
N = 7 of all trials at an average SOC of approximately 147%. Cell fire occurred in
N = 4 trials at an average SOC of 214%.
The characteristic sequence of the mentioned events is due to the cell-internal processes carried out in
Section 2. The first gas-forming decomposition reactions occur mainly due to the initial destruction of the SEI as a result of the massive incorporation of excess lithium ions in the SEI layers near the anode, which turns out to be a very reproducible process. Further gas-forming decomposition reactions are increasingly controlled by the heat development within the cell (exothermic decomposition reactions and Joule’s heat due to increasing cell internal resistance). This explains why the SOC values in the event’s first cell opening and cell fire are more scattered and thus somewhat less reproducible than those of the first significant cell expansion. Since Joule’s heat in particular increases at higher C rates, this explains the shift in SOC values of the first cell opening with higher C rates towards lower SOC values as can be seen in
Figure 8.
The first significant cell expansion occurs independently of the overcharge rate. That is because the C rate merely determines the amount of time after which a certain state of charge (degree of lithiation of the anode) is reached. However, regardless of the C rate a certain number of charge carriers must flow to cause the destruction of the SEI and thus the first gas-forming decomposition reactions. The event of first cell expansion is therefore dependent on the overcharge rate when time is considered as the basis. It is independent of the C rate, when the state of charge of the cell is taken as the basis. The exact SOC value of the occurring phenomenon depends on the cell chemistry and especially on the (over)dimensioning of the anode [
51]. These cell characteristics differ on the cell type and the cell manufacturer. But the first significant cell expansion of a particular cell type is suitable as a reproducible detection criterion for a critical cell state.
For the experiments in which overcharging was carried out until cell fire, unfortunately only data for higher C rates (3 C) are available. However, based on the explained mechanisms of the overcharging process, it can be assumed that the SOC values are somewhat higher at lower C rates (equivalent to the first cell opening). The SOC values of the detection criterion (first cell expansion) remain unchanged with regard to the C rate.
4.3. Detection Criterion
To prove that the initial cell expansion can be used as a reliable criterion for detecting critical cell conditions, overcharge tests up to that first cell expansion were carried out as is depicted in an exemplary state in
Figure 9.
The first significant cell expansion occoured approximately at 112% SOC (see
Figure 9). The overcharging process was stopped at this point. The initiated decomposition reactions lead to irreversible gas formation within the cell, causing it to expand rapidly from the offset (−0.39 mm) to approximately 1.82 mm by 2.21 mm under clamped conditions. The cell continues to expand steadily after the overcharge ends, but much less than during the overcharge.
The clamping force increases by 72 N from approximately 917 N to approximately 989 N at the same moment. After overcharging the force initially remains almost constant. The cell temperature rises minimally by 1.1 K from the offset (34.95 °C) to 36.05 °C during the overcharge. Afterwards, the cell temperature remains almost constant at 36 °C. The cell voltage rises to a maximum of 4.62 V during the overcharge. After overcharging, the cell voltage drops to 4.24 V. The cell voltage remains 0.04 V above the end-of-charge voltage of the cell.
The overcharge process was stopped after overcharging up to 112% SOC and long-term observation was carried out. The results are visualized in
Figure 10. The 45 h long-term observation was carried out under ambient conditions (local ambient air temperature). The conditions were selected to simulate the case where a damaged cell in a car is not replaced immediately.
The cell thickness increases slightly but steadily by another 0.66 mm during the 45 h of post-observation although the cell temperature drops on average. This behavior indicates that further gas-forming decomposition reactions have taken place during the post-observation phase.
Due to the very small increase in cell thickness, the reaction rate is significantly lower than during the overcharge.
Stopping the abuse of the cell (overcharging) after detection of the first significant cell expansion ensures that neither cell opening nor cell fire occur within the subsequent 45 h of post observation.
Furthermore the cell temperature decreases on average. Changes in the ambient air temperature slightly influence the cell temperature. However the cell temperature does not equalise with the ambient temperature but is above the ambient temperature at all times.
Overall the cell temperature falls slightly below the pre-test offset during the post-observation phase. A thermal runaway is not visible.
No damage events such as cell opening or thermal runaway are set in although by stopping the abuse at the onset of the detection criterion, irreversible, gas-forming decomposition reactions have already taken place in the cell as the analysis of the gas measurement in
Section 4 has shown.
Overcharging leads to a significant delithiation of the cathode and an irreversible structural change of the cathode material as explained in
Section 2. As a result, metallic lithium is deposited and is no longer available as a charge carrier. In addition, the internal resistance of the cell increases significantly, so that at least a considerable loss of performance must be assumed for a further use of the cell. On this facts, the functionality of the cell can no longer be ensured after overcharging, which is why the cell should be replaced.
6. Discussion
The tendency of the SOC values of the critical events as a function of the C rate visualized in
Figure 8 should be confirmed for the event cell fire for a C rate = 1 C.
In further investigations the influence of the cooling of the cells on the occurrence of the critical events should be examined. In particular one experiment, where the centre cell of three stacked cells was overcharged, showed a higher cell temperatures lead to the onset of the critical events cell opening and cell fire being shifted to slightly lower SOC values. However the detection criterion remained unaffected.
The investigations in this work are based on new cells that have not previously experienced any charging/discharging cycles. In further experiments, the influence of the state of health (SOH) on the criterion for detecting critical cell conditions should be investigated. The effect of irreversible lithium plating over the lifetime of the cell in particular could play a significant role [
13,
20]. It is expected that the permanent monitoring of cell expansion, as studied in this work, can also be used as a correlating variable for the determination of the SOC and SOH [
46,
52,
53].
Henceforth the determined SOC values should be validated for overcharge rates < 1 C, especially those for the onset of the first, significant cell expansion. In the experiments of this work the values were only confirmed for C rates > 1 C. The fixture was manufactured of solid aluminium plates, which a high cooling capacity exhibits to ensure resistance to cell fire. In further investigations the results from this work should be validated for different thermal boundary conditions (e.g., in the form of a constant temperature control of the test stand as in [
12,
16] or [
51]).
It can be assumed that, in particular, the detection criterion found in this work will occur regardless of the temperature control of the cell (see
Figure 8). With regard to the critical event’s cell opening and cell fire, it can be expected that these will already occur at somewhat lower SOC values at higher ambient temperatures (see
Figure 8).
In further investigations, it would be interesting to examine the quantity of charge/discharge cycles of a cell that has previously been overcharged up to the detection criterion to determine if it can still be subjected without further critical events such as a cell opening and/or thermal runaway setting in. In addition the expected performance loss should be quantified in case of further use of the cell.


 ,
, 


