1. Introduction
Lithium-ion batteries (LIBs) can undergo so-called energetic failures due to thermal abuse, mechanical impact, or overcharging. Several investigations have been conducted with NMC lithium-ion batteries (e.g., [
1,
2,
3]), but only a few studies have been conducted on the characteristic behavior and gaseous release at variable state of charge (SOC) levels [
4]. The findings from an investigation with an 18-battery module with 24 Ah (≈100
) pouch cells at 100% SOC revealed that during thermal propagation, the unaffected adjacent cells transferred current to the cells in a thermal runaway (TR) [
5]. This resulted in an increase in temperature by 10 K. Other studies by a number of researchers have mainly concentrated on pouch LIBs with 100% SOC [
6,
7,
8]. Experiments by Ziebert and his group with 2.5
(≈10
) pouch LIBs at 100% SOC showed controlled pressure reduction could be used as a safety measure for TR prevention [
8]. Further findings by Sturk et al. indicated significant differences in the gaseous emissions from 14 Ah (≈58
) lithium nickel manganese cobalt dioxide/lithium manganese oxide (NMC/LMO) cells as compared with 7 Ah (≈23
) lithium iron phosphate (LFP) cells at 100% SOC, i.e., a measured volume of 50
(normalized volume =
) from LFP cells with 1500
(normalized volume = 780
) from the NMC/LMO cells [
7]. In addition, the duration of gaseous release in NMC/LMO cells was approximately one-tenth of the total venting time of the LFP cells. According to the investigators, TR tests are mostly carried out in an inert atmosphere and the results could differ from those obtained in atmosphere with air since some chemical reactions may occur only when oxygen is present [
7].
Several studies have been previously conducted on fire and explosion incidents caused by TR of LIBs. The investigations involved various reactor vessels (RVs) ranging from small- to large-scale vessels. An accelerating rate calorimeter (ARC) chamber with a diameter (d) of 10 cm and a height (h) of 10 cm was used to study the thermal behavior of commercial 18650 cells (cylindrical geometry, d = 18 mm, h = 65 mm) with LiMn
2O
4 (LMO) (≈7
), LiFePO
4 (LFP) (≈4
), and Li(Ni
0.33Mn
0.33Co
0.33)O
2 (NMC) (≈9.20
) cathodes. The researchers studied the correlation between temperature and pressure (internal and external) of the aforementioned LIBs at 100% SOC and concluded that under thermal abuse (heating and high temperature), cells with LFP cathode were more stable than cells with NMC cathode [
9].
Another study was conducted using an ARC to analyze the properties of thermal failure of fully charged 18650 LIBs with an NMC cathode (≈9.20
) [
10]. The group identified that surface dependent features such as specific surface area played a major role in the degree of heat generated during failure. In addition to the above, a calorimetric instrument was found to be helpful for quantifying the heat generation during TR. Some common utilizations of the calorimetric instrument in such studies include adiabatic calorimetry, C80 micro-calorimeter, modified cone calorimetry, modified ARC, ARC, etc. [
11,
12,
13,
14,
15].
Further previous studies have proven that the types of gases released from LIBs are dependent on the type of LIB, the test method, and the test equipment used [
6]. At 10 psia (~0.7 bar), approximately 1
, 2.5
, and 8
were released from 18650 LiCoO
2 single cells (≈11
) at SOC levels of 10, 50, and 100%, respectively [
16]. Golubkov et al. investigated the gas release of 18650 cells with NCA (lithium nickel cobalt aluminium oxides) and LFP cathodes depending on the SOC level. For an NCA cell with 100% SOC (≈12
), a volume of released gas of approximately 7
(314
) was measured, and LFP cells (≈4
) showed a relatively smaller gas release. For 100% SOC, only a tenth, as compared with the NCA cells, was detectable (0.72
or 32 mmol). On the one hand, for the NCA cells, the gas release decreased with decreasing SOC. On the other hand, the gas release of the LFP cells showed independent SOC behavior in the experiments [
17]. Another study investigated the gas release from 41 Ah cells for EV applications with an NMC/LMO cathode. At 100% SOC, gas production of 1.3
was detectable [
18].
Koch et al. investigated the gas release of different NMC pouch and hard case cells from 20
to 81
(73–311
) at 100% SOC. The volume of the produced gas was in a range of 1.3–2.5
[
4]. The experiments of the ZSW (Zentrum für Sonnenenergie- und Wasserstoff-Forschung Baden-Württemberg) showed results in the same range. During overcharge-induced thermal runaway of an NMC pouch cell, a gas release of 140
was ascertainable (2.8
) [
19]. Fleischhammer et al. and Koch et al. both investigated NMC cells, but did not vary the SOC level [
4,
19].
Penetration-induced TR of fully charged LIBs has been reported with the production of a smaller amount of toxic gases as compared with that of thermal treatment [
6]. Penetration tests were conducted on pouch and 18650 LIBs with a sealed penetration device in a custom-designed chamber connected to an FTIR. In this study, particulate matter, mainly electrolyte, was released together with CO
2, CO, CH
4, HF, and acrolein (C
3H
4O) gases [
20]. A recent study indicated the release of 1.56 ± 0.04
of gaseous components at a rate of 34 ± 2
from NMC pouch LIBs (216
) at 100% SOC using FTIR and gas chromatography techniques [
21]. Furthermore, some research has dealt with the TR behavior of 18650 NMC cells and dependency on the SOC level. Ouyang et al. and Wang et al. used cone calorimeters to characterize the TR by parameters such as the heat release rate (HRR) and the total heat release (THR). According to these experimental investigations, it was reported that, with increasing SOC, the thermal runaway was more severe [
22] and HRR and THR increased [
23]. Wang et al. and Ouyang et al. did not focus on the amount of gas released.
Therefore, the focus of the present study is on pressure generation, temperature rise, and release of gases during thermal abuse of LIBs at different SOC levels in an airtight enclosure.
Some research works have involved the use of larger vessels to analyze TR. For instance, a study by Maloney was conducted in a 21.7
test sphere and a 10 m
3 chamber [
16]. The test results showed that a variation in the SOC had a substantial effect on the TR and volume of gas produced. In addition to the few experiments conducted in large containers, a 64 ft
3 (1.81 m
3) fire test chamber was constructed to evaluate the flammability of LIBs in aircrafts [
24]. According to Summer, TR of pouch lithium polymer (Li-Po) cells with 8 Ah capacity (34
) resulted in significantly high temperature and pressure increases as compared with cylindrical cells. This calls for the need to conduct more studies with larger enclosures to examine the TR behavior of LIBs with an NMC cathode [
24].
In this study, the investigations reported aimed to demonstrate the effect of the SOC level on the characteristic behavior and gaseous emissions during TR of pouch NMC cells. In total, 19 tests with 25 NMC LIBs were carried out. Two different types of ignition sources were applied: a glow plug and a heating plate, as described in the experimental section. The tests were conducted by exposing specific types of LIBs with an Li(NixMnyCo1 – x − y)O2 cathode to overheating until they underwent TR in a pressure-resistant vessel with an inner volume of 100 . The TR of the LIBs was analyzed primarily using maximum pressure rise, , maximum reaction temperature, , and rate of temperature rise,.
2. Results and Discussion
2.1. Pressure Evolution,
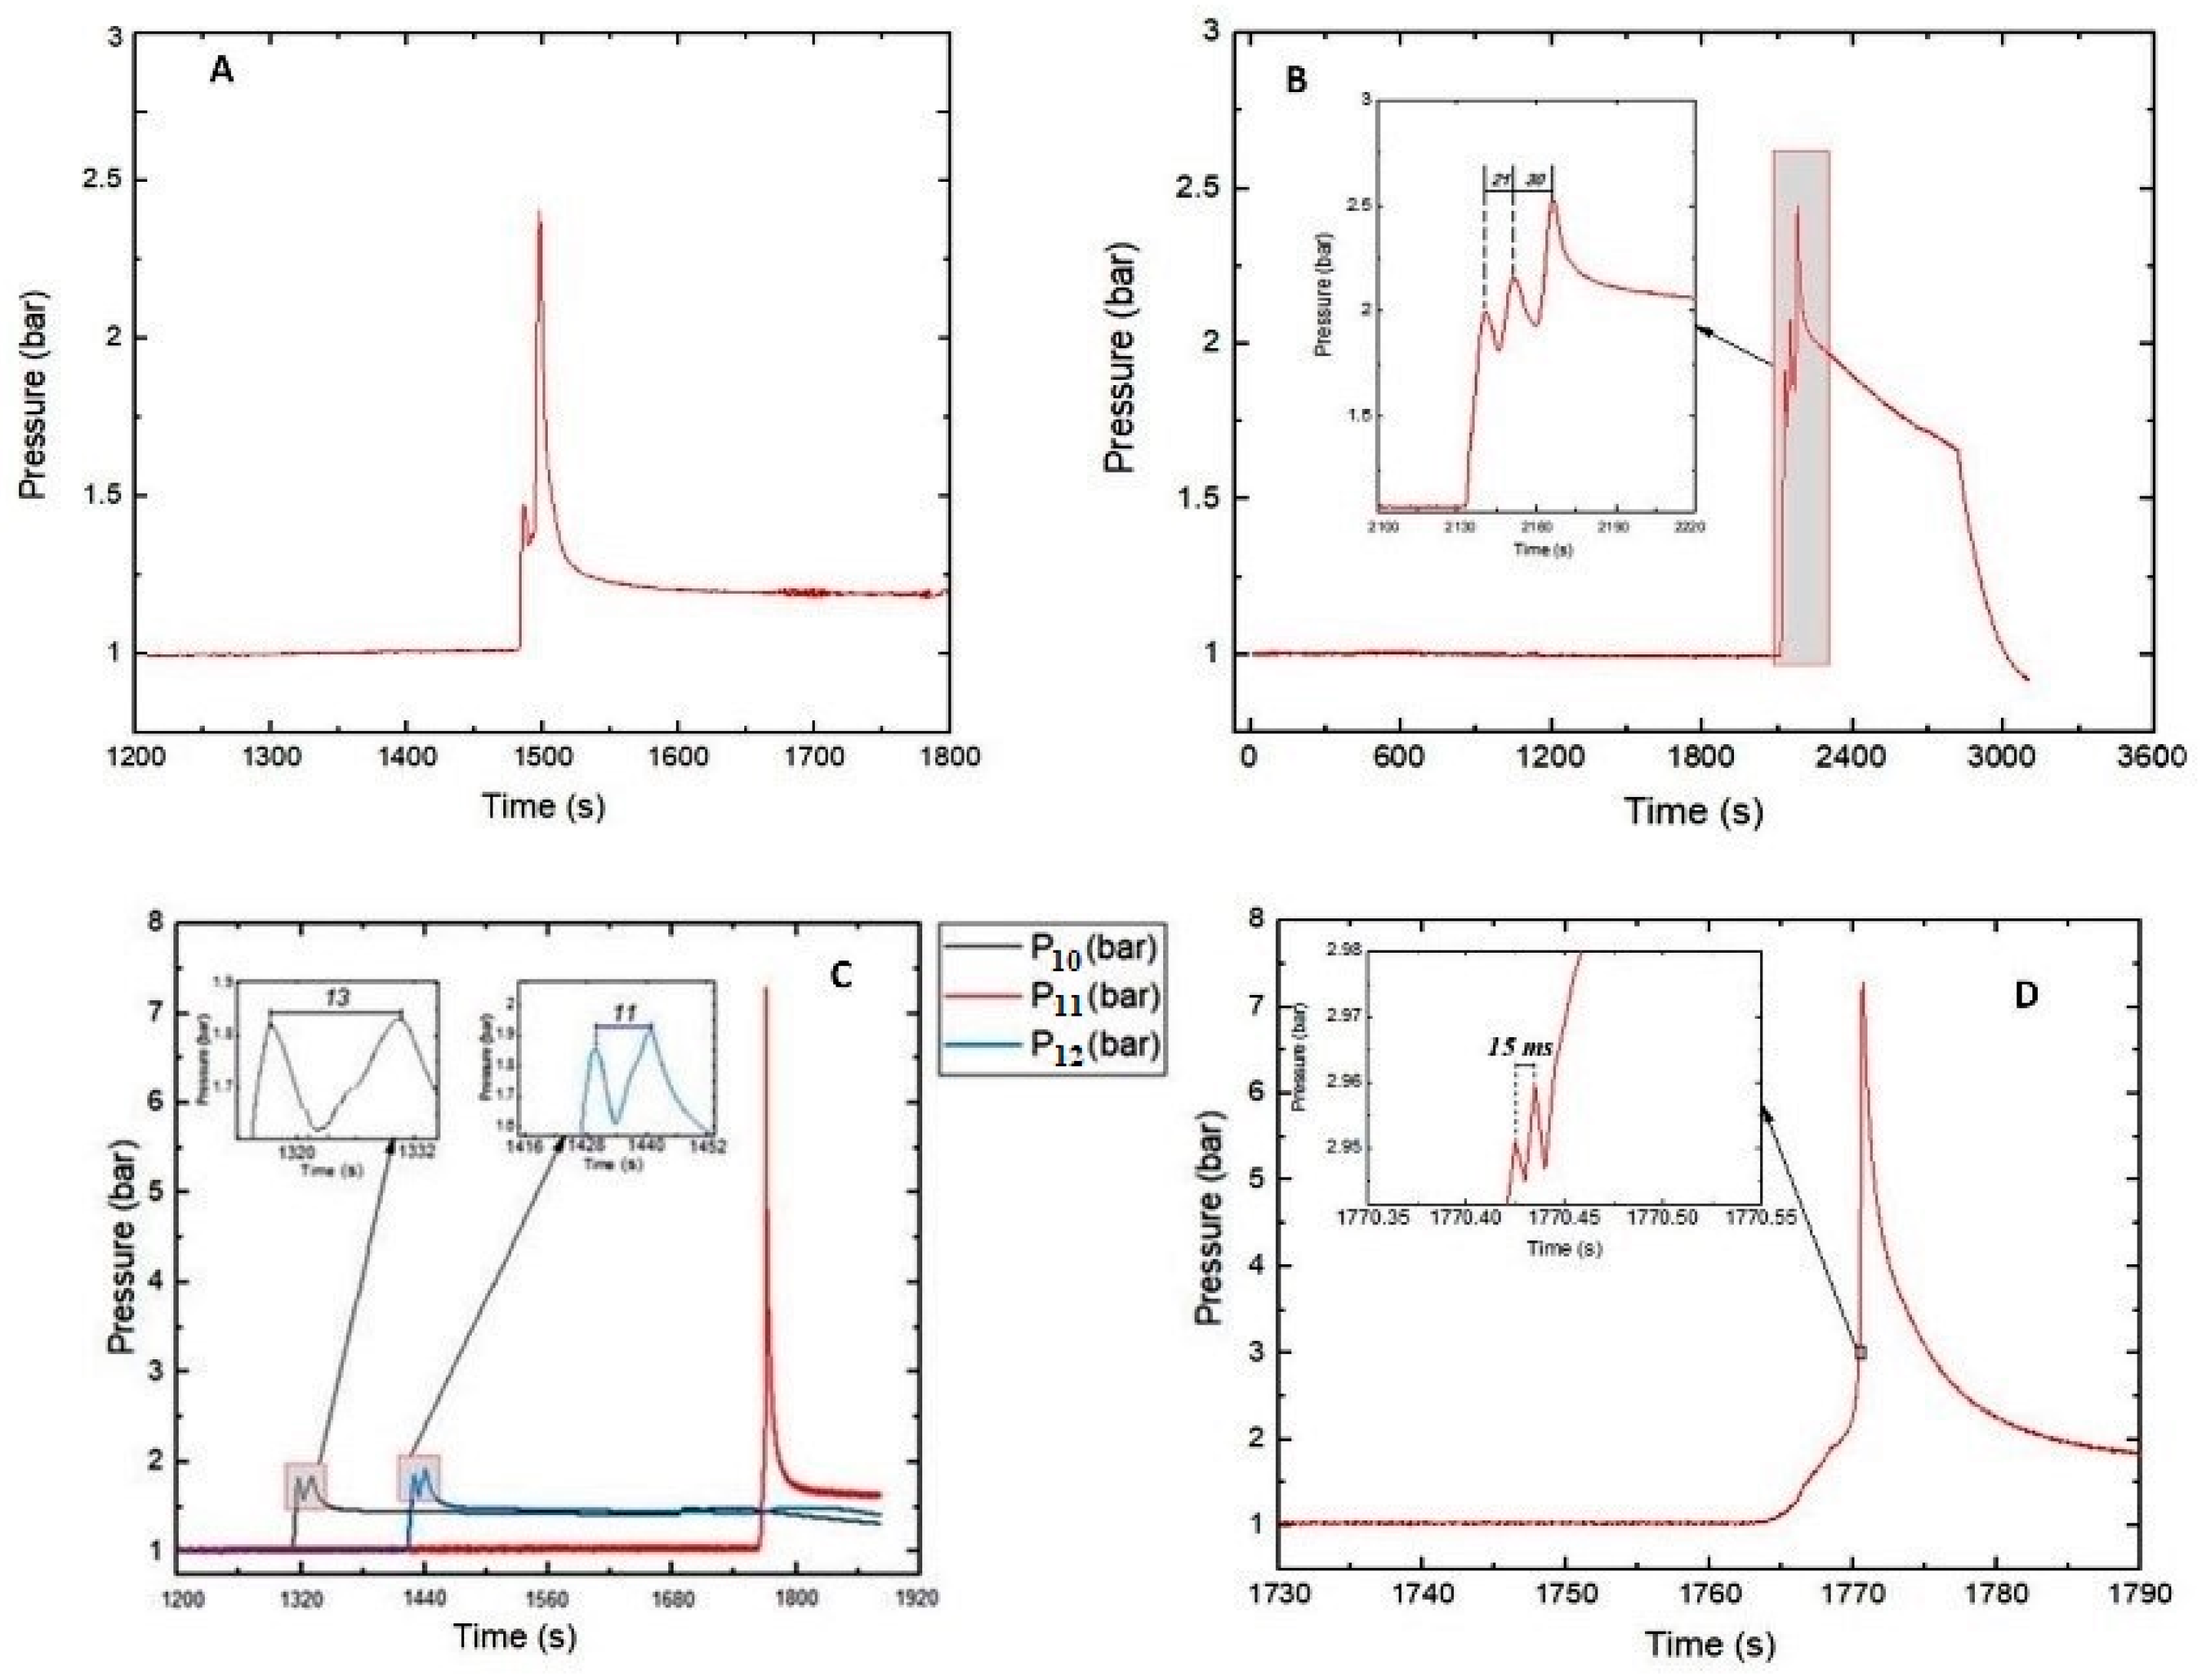
Here, the pressure characteristics of the TR for the LIBs tested at various SOC levels are discussed. The curves shown are the signals of the pressure transducer monitoring the internal pressure in the RV. The pressure measured was post-filtered with a Savitzky–Golay smoothing algorithm. For each test, the data were smoothed at 100 data points, hence, the time resolution of the smoothed data was 10 Hz. With Test #04 (single run) as an exception, the mean values of all tests were considered. As presented in
Figure 1A–D, a sharp rise in pressure occurred during TR.
The maximum pressures (absolute) obtained inside the reactor vessel due to gas release from the cells are shown in
Table 1. In the Series 1 tests, in which the SOC ranges were 80–89% and 90–100%, the maximum pressures observed were 2.4 ± 0.05 bar and 2.52 bar, respectively. The latter occurred for Test #04 with the SOC range of 90–100%.
The successive pressure peaks seen in
Figure 1B demonstrate the effect of TR due to heat generation and propagation across the cells of a battery stack (Test #04). The highest measured pressure was 2.52 bar. The ignition source (heating plug) installed between cells A and B triggered TR with heat release which then propagated to the neighboring cells in a cascade-like behavior (see
Section 3.2 for cell configuration). TR in cells C and D did not occur simultaneously but with a time difference of 30 s. As depicted in the insert of
Figure 1B, the absolute pressure peaks were 2 bar (after TR in cells A and B,
= 1 bar), 2.15 bar (cell C,
= 0.15 bar), and 2.52 bar (cell D,
= 0.37 bar). Hence, the resulting pressure rise in the RV after the runaway of all four battery cells was Δ
p = 1.52 bar.
An important observation was the short pressure spike produced before the
was obtained (see
Figure 1A). This may be due to the effect of the glow plug used as an ignition source. The relatively small heating surface area (≈200 mm
2) of the glow plug was directly in contact with the LIBs. In the area of contact, some reactions might have occurred with the release of hot gases resulting in the generation of an initial pressure spike. Propagation of the hot gases through the cells led to the occurrence of TR. As evident in the temperature profiles presented in
Section 2.2, the heat generated was transferred to the other sections of the cells.
In the Series 2 tests, the cells with two nominal capacities exhibited quite contrasting behavior. A lower
(⪅1.5 bar) was recorded at SOC levels ≤89% for the LIBs (Tests #01–#06). Generally, at 30–50% SOC, the obtained
did not show high-pressure spikes, even though the depicted rise in temperature,
in
Figure 2, from the thermal abuse of the cells (Tests #01–#03) indicated TR.
In three tests (Tests #11, #13 and #14) with the range of 90–100% SOC, maximum pressures higher than 7 bars occurred. Pressure values of this magnitude cannot be explained by the increase in the number of moles added to the gas phase due to gas release. In these tests, obviously, the gas released from the batteries into the RV underwent a gas explosion. Although the lower explosion limits and the minimum ignition temperatures of the gas mixtures released during thermal runaway are the subjects of a succeeding project, it can be stated that the composition of the gas mixture inside the RV could have reached the explosible range and the surface temperatures of the cells during runaway exceeded the minimum ignition temperature of the emerging gas mixture in some tests. Tests #10–#12 provide a typical illustration, where the concentrations of CO, CH4, and C2H4 gases released at TR exceeded their respective lower flammability limit (LFL).
At the range of 90–100% SOC, the
values of the 10 Ah cells and 32 Ah cells were 4.1 ± 0.7 and 7.05 ± 0.5 bar, respectively.
Figure 1C depicts the pressure-time curves of Tests #10 (
), #11 (
), and #12 (
), in which, for each, two cells with a capacity of 10 Ah and 90–100% SOC were used. Two peaks were produced in two cases within a period of 13
(for Test #10) and 11
(for Test #12). Interestingly, Test #11 did not exhibit this behavior. A peak was generated with high pressure at a relatively longer
338 ± 36
. From the insert in
Figure 1D, the thermal runaway of the two cells occurred within a period of 15
and generated a
of 2.96 bar. In addition, the maximum temperature rise attained from
(on cell A) and
(on cell B) indicate that TR did not occur simultaneously but with a time difference of 2
. A successive high-pressure peak (
= 7.28 bar) was attained 35
afterwards.
Thermal runaway of the cells tested in Series 2 did not occur with an initial pressure spike as observed in Series 1. This is presumably due to the more uniform introduction of heat by the heating plate used as an ignition source. The large surface contact area of the heating plate increased the homogeneity of heat distribution across the LIBs. It may have caused TR to occur almost at the same time across the LIBs with rapid propagation of heat and subsequent ejection of hot gases.
2.2. Temperature
The cells tested in Series 1 and 2 were all triggered into TR. The mean values of the maximum temperature measured ranged from 642 to 1186 K. The lithium-ion cells underwent thermal runaway with explosion at a characteristic temperature increase rate above 10 K/s.
Onset temperatures, peak temperatures, times to peak temperature,
, and
for all tests performed together with the corresponding SOC level are given in
Table 1. From
Figure 2, the
and
measured are primarily dependent on the SOC. Thermal propagation in the battery stack included several sequential processes. The TR occurred after approximately 35 min of test initiation. After the trigger, the TR produced
1060 K (
), 1139 K (
), and 1070 K (
) at the various positions described in
Figure 3. These temperatures were reached at 71
, 69
, and 111
after the trigger at
of 402 K, 349 K, and 321 K, respectively. The reduction in
was due to the enhanced heat propagation from the combusted cells. From
, the thermal runaway of cells A and B produced enough heat to trigger TR of the neighboring cells C and D.
Taking into account the results of the Series 2 tests, the
of LIBs generally decreased with higher SOC levels (see
Table 1). The
of
TR was ≤690 K at SOC ≤89%. At the said SOC level, a temperature increase rate of less than 27 K/s was measured from the cells that underwent thermal explosion.
The onset temperatures, , of the Series 1 tests ranged between 344 ± 5 K and 362 K. The results obtained during the Series 2 tests also indicate that the measured were from 393 ± 36 K to 487 ± 10 K. The results of the 10 Ah cells tested indicated the had an inverse relationship with the SOC levels of the LIBs.
2.3. Rate of Temperature Rise
Table 1 also shows the maximum rates of temperature rise,
, observed in the different tests. In the Series 2 tests, there was a direct relation of
with the SOC level. With respect to the battery stack, the
was quite minimal despite the comparatively high
recorded. This outcome was possibly due to the influence of the heating source (i.e., heating plug) used and the surface area due to the LIB arrangement. With the assumption of one-dimensional steady-state heat transfer, the possible reason could be a reduction in heat flow from the ignition source and/or initial cell across the battery stack by conduction. In the Series 2 tests, in which a heating plate with a large surface contact area was used for the 10 Ah double cells tested in the range of 90–100% SOC, the
obtained was notably higher as compared with that of the battery stack. Characteristically, the rate of heat transfer by conduction within the cell must have been enhanced by the larger surface area of the heating plate used. Hence, it could tentatively be concluded that the surface contact area of the heating source has some impact on
.
2.4. Gaseous Emissions
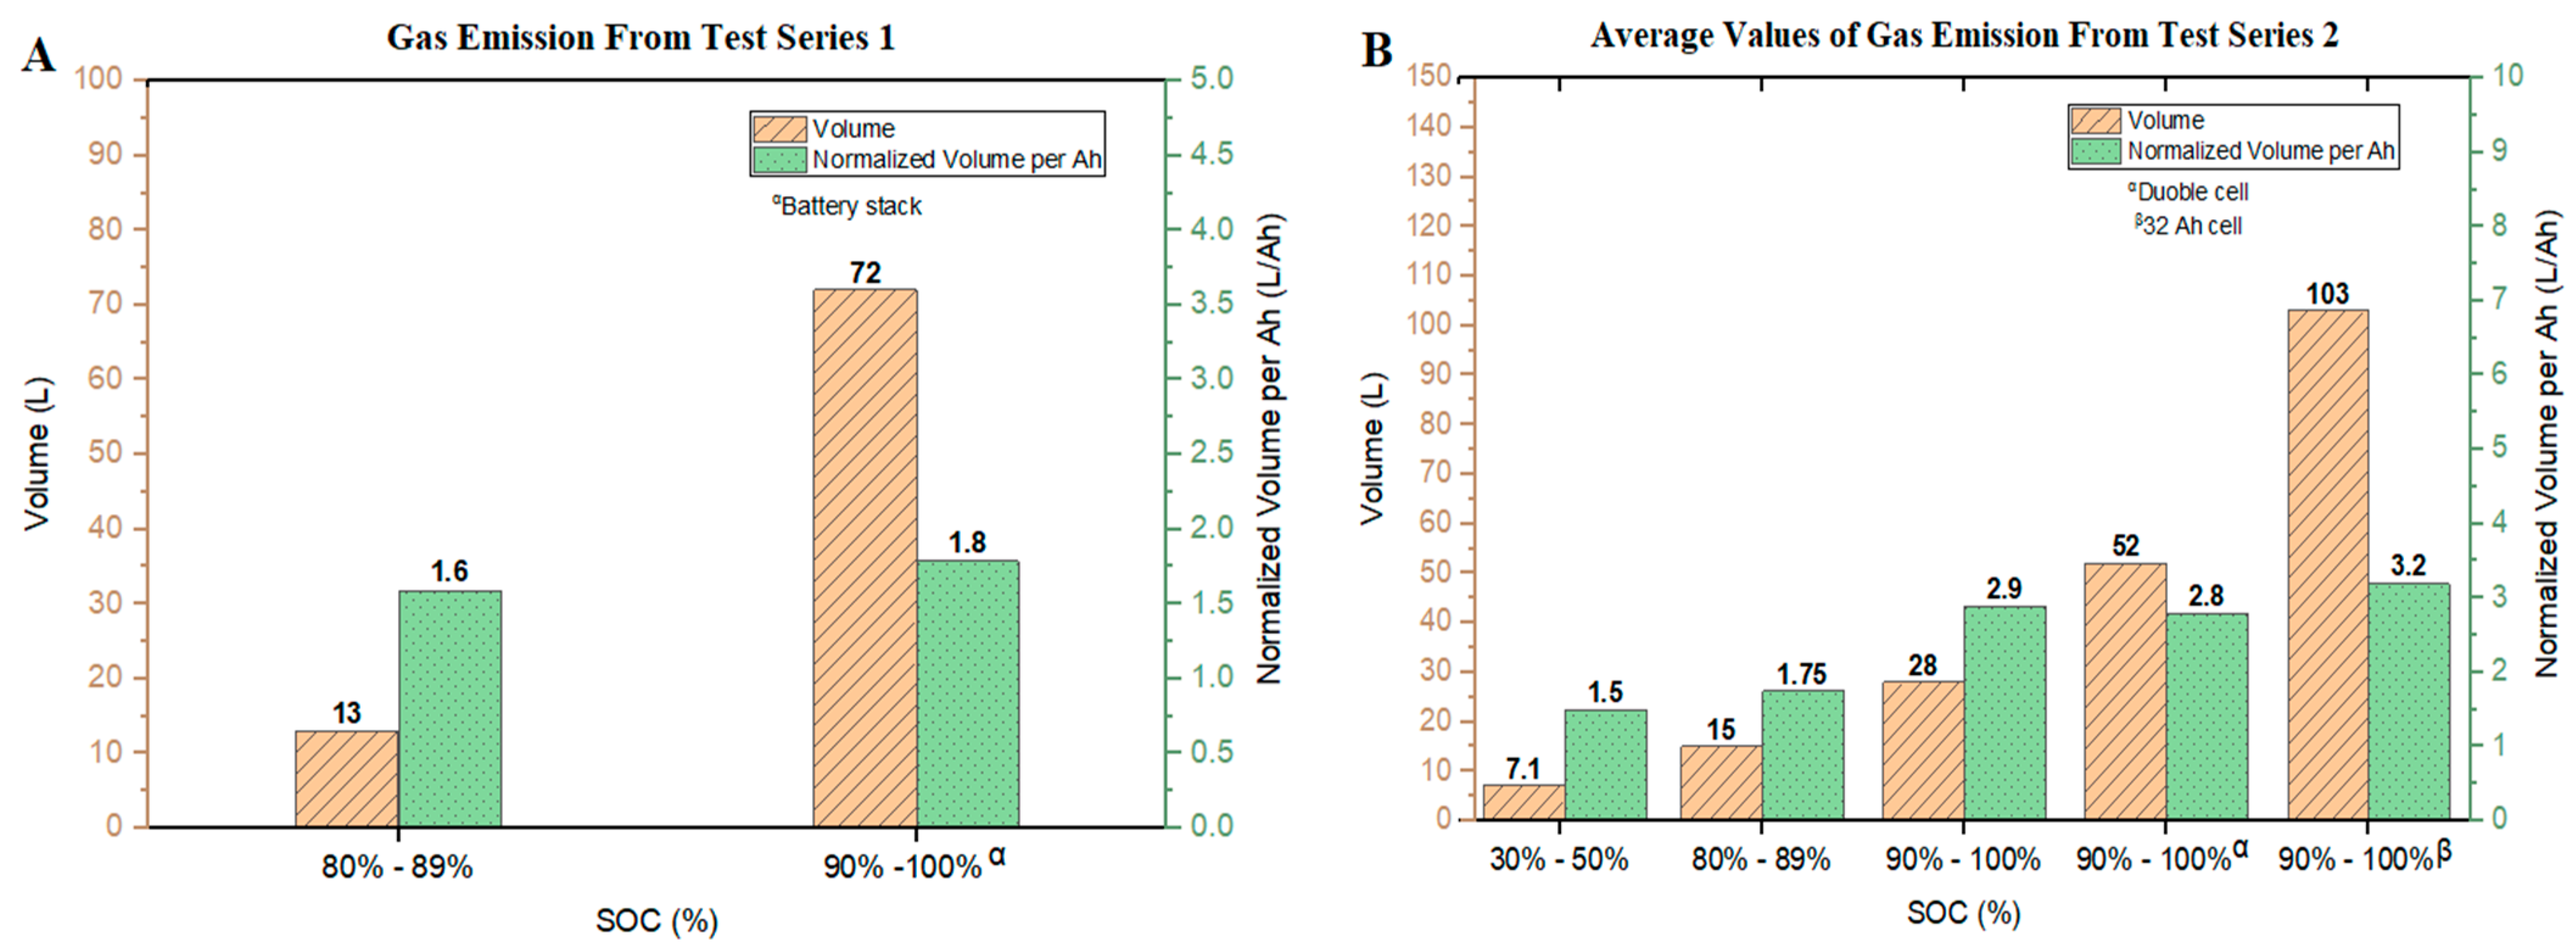
Based on the pressure differences measured in the tests conducted, an estimate could be made of the total amount of gas released using Equation (2) (see
Section 3.3) and converting moles to volumes using Avogadro’s Law. The total volume of gases released and the corresponding values related to the battery cell capacities are shown in
Figure 4.
For the experiments in Series 1, the gas volume released from Tests #01–#03 was 13
(0.58
) with the gas release per battery capacity of 1.6
. A volume of 72
(1.8
) was attained from the battery stack (Test #04). In this test series, the normalized volume of gas released from the battery stack was 0.2
higher as compared with the single cells. The fact that a higher margin was not observed could be due to the limited amount of oxygen in the closed RV and the associated change in the reaction mechanism when energy was stored with a higher capacity and underwent thermal runaway. This is clearly visible from the evaluated FTIR results of the gas analysis after each test. The data are shown in
Table 2. Carbon monoxide and hydrocarbon (especially CH
4 and C
2H
4) volume fractions are elatively higher in the 4-cell stack test than in the single cell tests.
Consequently, the reaction is less complete than the single cell tests. In contrast, H2O as a product of the complete reaction is relatively homogeneous for all four tests. This could be another indicator that the total amount of the gas released is partly oxygen driven.
Contrarily, one might assume that, if a RV with a higher inner volume had been used, a higher number of moles of products of complete reactions would have been obtained, especially from the 4-cell stack test. With respect to this, the determination of the total number of moles of gas released might, to some extent, depend on the apparatus.
The gaseous emissions from the Series 2 tests are presented in
Figure 4B. The highest gas production (103
, 4.58
) evolved from the 32 Ah NMC cells. For the double cells at 90–100% SOC, the gas volume released was 52
. Hence, the double cells released about half the amount of gas as compared with the single 32 Ah NMC cells. The reason for this behavior could be explained by the relative electrical energy stored in the cells. Applying the ratio of 32 Ah cells to double cells (20 Ah in total), one obtains a value which gives an approximate fit as compared with the observed gas release.
In experiments where 10 Ah cells with a range of 90–100% SOC were tested, the gas released per battery capacity values were 2.8 (double cells) and 2.9 (single cells), showing a deviation of about 10% as compared with the gas released per battery capacity for the 32 Ah cells (3.2 ).
The highest release of gas was obtained from the 32 Ah cells with a range of 90–100% SOC, with the least at a range of 30–50% SOC (1.5
). This is typically due to electrolyte combustion. An appropriate explanation for this occurrence can be deduced from the lithiation level at the anode of the LIBs which provides suitable electrochemical stability. At an SOC level ≤50%, the thermal decomposition which occurs is largely driven by the SEI, organic electrolyte, and continuous evaporation of the electrolyte in the presence of oxygen, resulting in the release of the measured amount of gases per Ah. An increase in the amount Li
+ at the anode could have hindered the activity of the aforementioned components due to lithium carbide formation (Li
2C
2) at elevated temperatures [
25]. The presence of thermodynamically stable Li
2C
2 can have an influence on the amount of gas released per Ah. The lithiation level at the anode and delithiation level at the cathode at a SOC level ≤50% may have caused the cell to be less reactive and enhanced the thermal stability of the cells. At an SOC level >50%, an increase in the lithiation level at the anode influences the thermal decomposition of the delithiated metal oxide, resulting in the observed characteristics of a higher amount of gas release per Ah, higher gas release rates, and higher pressure peaks during the TR.
It is quite a complex analysis to compare the measured values with other experimental investigations. One influential factor is the cell chemistry, especially the cathode type. Golubkov et al. quantified gas release due to thermal runaway for three different cell types (NMC, LFP, and LCO/NMC). The gas release for the LFP was only a fifth as compared with that of the LCO/NMC [
26]. To negate the influence of the cathode material, the comparison in
Table 3 comprised only tested cells with (also partial) an NMC cathode.
The results for the gas release in this experimental program fit very well with the literature data. The literature data are in a range of 1.3–2.5
and the data of the compared tests of this work are in a range of 1.8–2.9
. The 10-Ah tests and the 20-Ah tests (see
Table 3, no. 4 and no. 5) resulted in nearly the same normalized gas volume. The value for the 40-Ah test decreases significantly (see
Table 3, no. 6). As already explained above, this is due to the limiting amount of oxygen available in the RV or the insufficient volume of the RV in relation to the energy content of the cells under thermal runaway. In this context, it would be interesting to determine at which RV volume the normalized gas volume would remain constant.
Another impacting factor is the calculation method of the released gas volume from the pressure signal. The pressure signal is easy to measure relative to the local temperature inside the reactor. The calculation method employed makes the obtained results independent of the local temperature variations, since standard temperature and pressure (STP) conditions were considered before and after the tests.
The volume concentrations measured with the FTIR gas analyzer of the most relevant gaseous components released during TR in the different tests are depicted in
Table 2. Prevailing gas components were CO, H
2O, and hydrocarbons (CH
4, C
2H
6, and C
2H
4). These findings are comparable to former investigations [
4,
26]. Furthermore, HF, HCN, and NH
3 were also measured in considerable amounts. The concentration of HF produced (≤10 ppm) was only slight. However, Larsson et al. measured clearly higher values for HF, indeed, they tested cells with divergent cell chemistry (cathode material LFP, LCO, and NCA-LATP). One reason for the different HF scale could be the different measurement procedures. The measurements in this work were performed after the test, whereas Larsson et al. performed an online analysis over the whole test time [
27]. The difference between the Series 1 and 2 HF measurements could be explained by the different dilution factors (1:10 in Series 1 vs. 1:100 in Series 2), so that presumably, HF appeared below the sensitivity threshold of the analyzer in Series 2. The HCN concentration was identified to be within the range of 48–287 ppm for both test series. The relative concentration of CO was clearly higher at a higher SOC level and capacity. With regards to the Series 2 tests, the concentrations of HCN and C
2H
6 were minimal at higher cell capacity. As evident in
Table 2, the emissions of gaseous components such as CH
4 and C
2H
4 were enhanced at a high SOC level.
2.5. Effective Period of TR, Gas Release Rate, and Mass Loss
The effective period of thermal runaway as explained in
Section 3.3, the time derivative of the number of moles released, together with the relative mass loss of the cells are given in
Table 4. For those tests where a considerable pressure increase was noticed, mass losses varied from 21 to 47% with the trend visible from the Series 2 tests to be highest for the range of 90–100% SOC.
3. Materials and Methods
3.1. Cells
In total, 25 pieces of lithium-ion batteries with an Li(NixMnyCo1 – x – y)O2 (NMC) cathode were investigated. Each cell had a graphite anode combined with lithium hexafluorophosphate (LiPF6) conducting salt and varying organic solvent concentrations of ethylene carbonate (EC), dimethyl carbonate (DMC), diethyl carbonate (DEC), and ethyl methyl carbonate (EMC).
The batteries tested were pouch cells with nominal capacities of 10 Ah and 32 Ah. The parameters of the studied cells are presented in
Table 5. As can be seen from
Table 6, 19 tests were carried out with the LIBs in two different test series. A battery stack consisting of four cells assembled together was also studied.
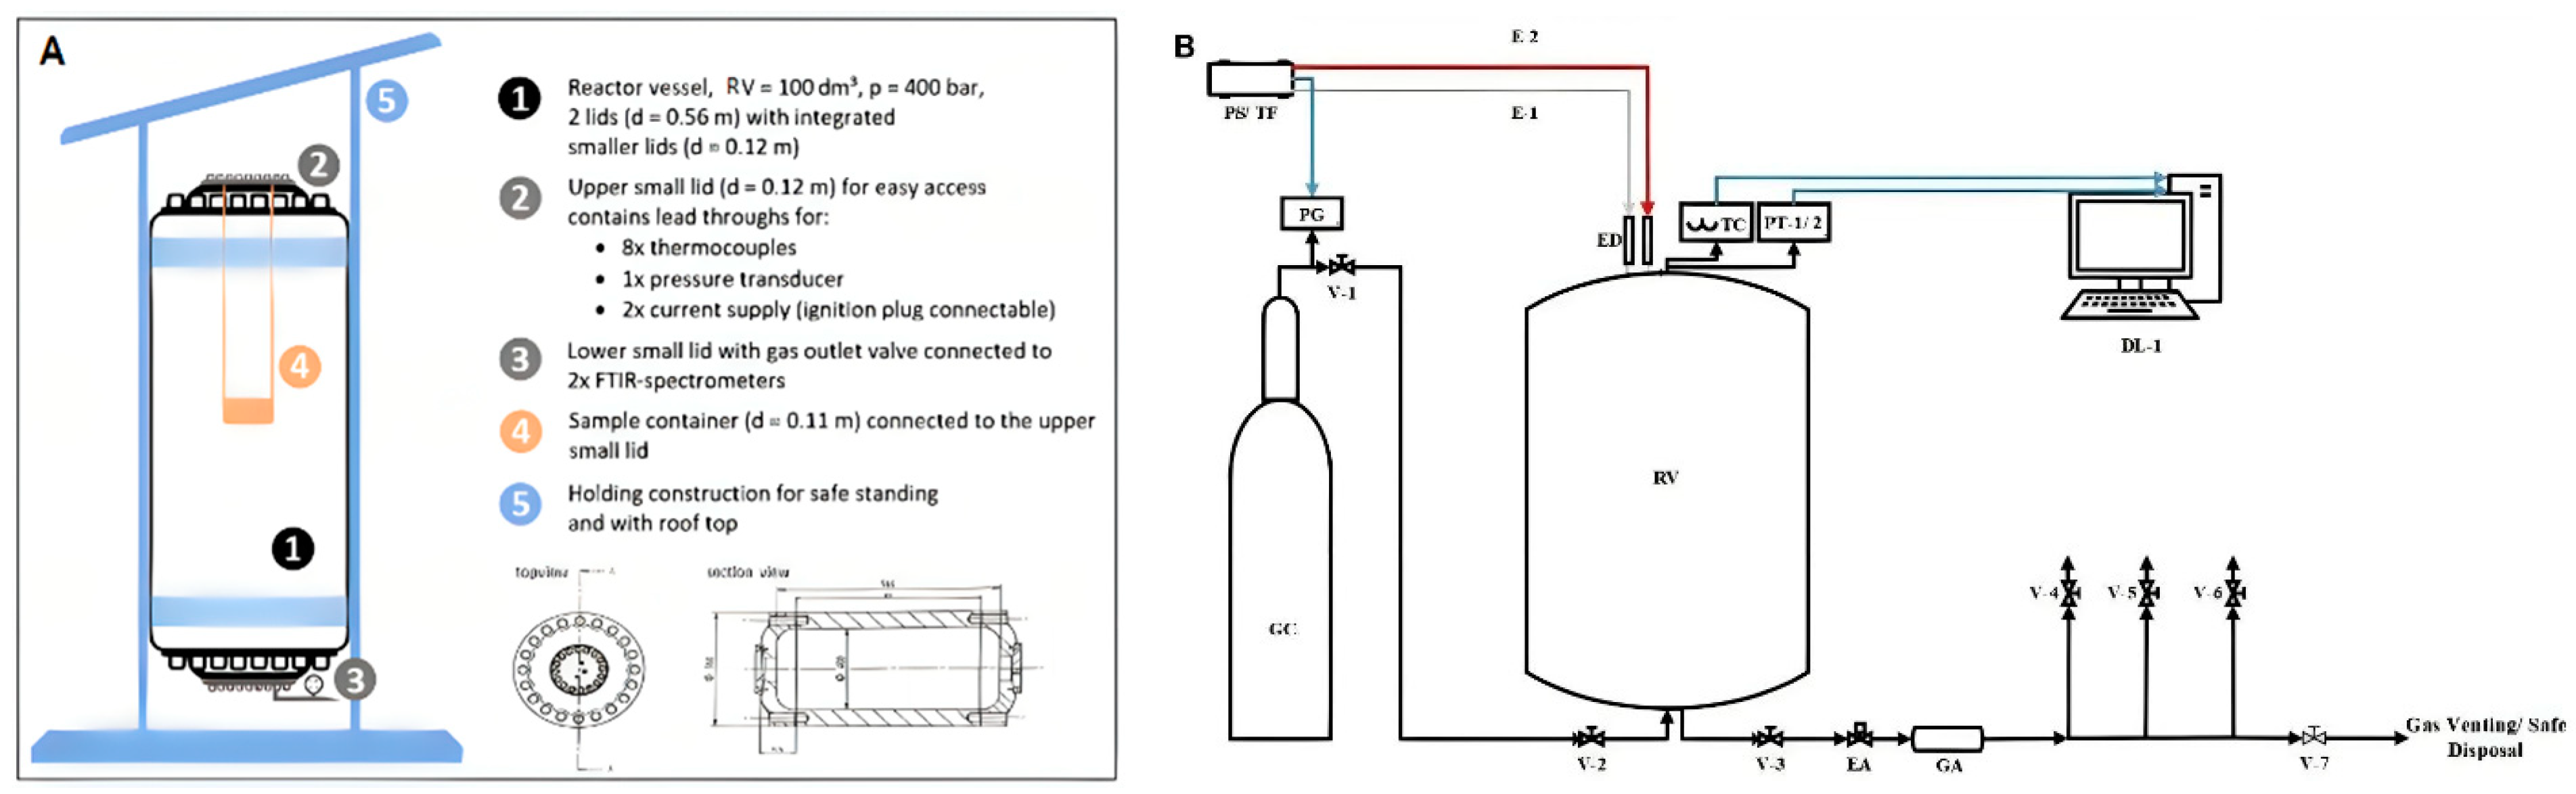
3.2. Experimental Setup
The experimental setup consisted of a stainless steel reactor vessel with 100 dm
3 inner volume, an inner diameter of 0.40 m, and a height of 0.95 m.
Figure 5A shows a schematic drawing of the RV. A sample container, as shown in
Figure 6, was used to place the sample in the center of the vessel during the test.
Thermal runaway was triggered by local overheating of the cells using two different heat sources: a glow plug in Series 1 tests and a heating plate in Series 2 tests.
The connected voltage regulator PS (Voltcraft SPS 1540 PFC, Wels, Austria) and the transformer TF (Thalheimer LTS 606 Isolation Transformer, Ellwangen (Jagst, Germany) were used to maintain the power supply to the respective heat source used, see
Figure 5B. The heating surface of the glow plug had a diameter of 5 mm and a height of 25 mm, while the dimensions of the surface of the heating plate were
(
).
The power of the heating plate was varied throughout the experiments and was limited to a maximum of 400 . From the temperature readings, it could be concluded that this allowed a temperature rise of about 30 K/min at the surface of the heating plate.
To measure the temperature and the absolute pressure, K-type thermocouples (8 pieces maximum) and a pressure transducer, Kistler’s Piezoresistive Amplifier 4603b (Kistler Group, Sindelfingen, Germany) were installed on the RV. The pressure transducers and thermocouple worked with a sampling rate of 1 kHz and 0.1 kHz, respectively.
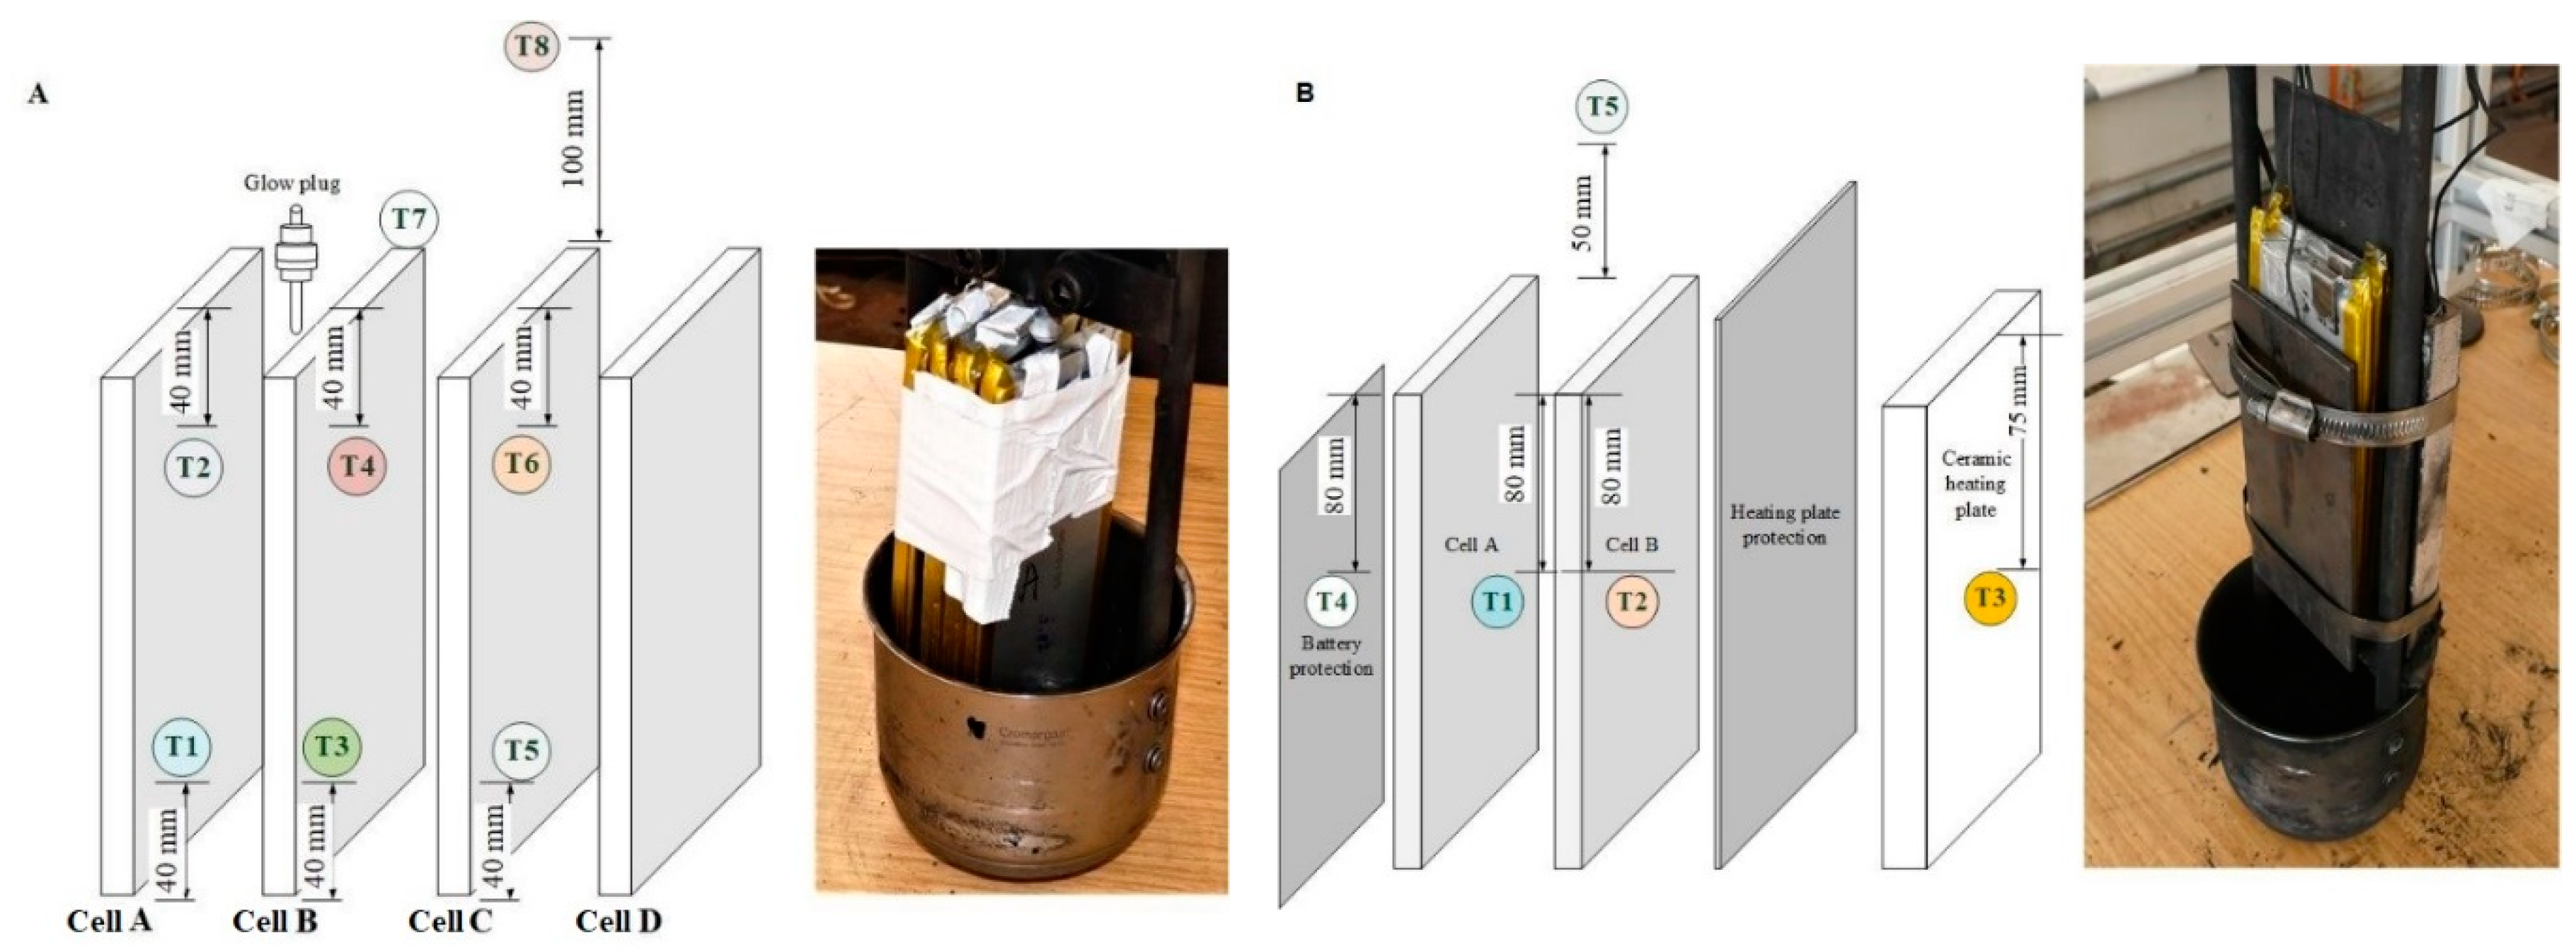
Figure 6 shows the positioning of the heat source and the arrangement of thermocouples on the battery stack and double cells. As illustrated in
Figure 6, the cells of the stack were labeled from A to D. An electrical actuator (EA) and a gas accumulator (GA) were installed to ensure a smooth flow of gas during the emission measurement. N
2 gas was made available for pressure regulation in the RV during operation and purging. The data loggers, Agilent Data Manager (DAQ U2355A)
DL-1 (Agilent Technologies, Boeblingen, Germany) for acquisition of pressure and temperature readings and
DL-2 Gasmet FTIR analyzer DX4000 (Gasmet Technologies Oy, Helsinki, Finland) to record the readings from the FTIR with P-Hot sampling system (Ansyco GmbH, Karlsruhe, Germany) were used.
A gas extraction pipe was mounted to the bottom section of the RV and connected to the FTIR. The FTIR was equipped with a suction pump to extract the gas sample from the RV after the test and to transfer it into the analyzer. The entire gas transfer line was operated at 180 °C, according to the recommended operating temperature of the gas analyzer.
3.3. Description of the Experiments
The experiments were conducted in two test series as listed in
Table 6. In the first series of tests, 7 pieces of 10 Ah Li cells were ignited by a glow plug. The glow plug was installed 20 mm at the top section of the LIBs to supply direct heat, as shown in
Figure 6A. A triplicate run of single cells (with the range of 80–89% SOC) and a single run of a four-cell battery stack with the range of 90–100% SOC were performed.
In the first part of the Series 2 tests (Tests #01–#12), TR in 10 Ah NMC cells was studied depending on their SOC levels (SOC = 30–50%, 80–89%, and 90–100%). Here, a ceramic heating plate was used as an ignition source. To protect the heating plate from the direct impact of TR, a stainless steel panel of 2 mm thickness was installed between the heating plate and the LIB, as shown in
Figure 6B. For the second part of the Series 2 test (#13–#15), 32 Ah NMC cells were used. Then, a triplicate analysis was conducted and the mean values of results were used for the evaluation of pressures, temperatures, and gas concentrations.
Before the TR tests, all cells were checked to ensure they did not have any physical damage. The capacities of the cells were determined by three charging and discharging processes using a Voltcraft multifunctional charger, V-Charge 100 Duo (Conrad Electronic International (HK) Limited, Hong Kong). In this way, the minimum voltage (≈ 0% SOC, 3 V) and voltage at full charge (100% SOC, 4.2 V) were also known. Each cell was fully charged to 100% SOC, and then adjusted to its respective final SOC level. Basically, a nonlinear relationship was established between the aforementioned open-cell voltages in terms of the state of charge (see
Supplementary Materials, Figure S1).
A weighing balance (Sartorius Lab Instrument, Goettingen, Germany) was used to determine the weights of the prepared LIBs prior to and after TR. Then, each sample was placed into a sample container to minimize and probably prevent the distribution of particulate fragments in the RV. The signals recorded in the tests were pressure and temperature. From these measurements, the time derivates of both were derived. The total volume of gas produced in each test, , was calculated using the ideal gas law, as described below.
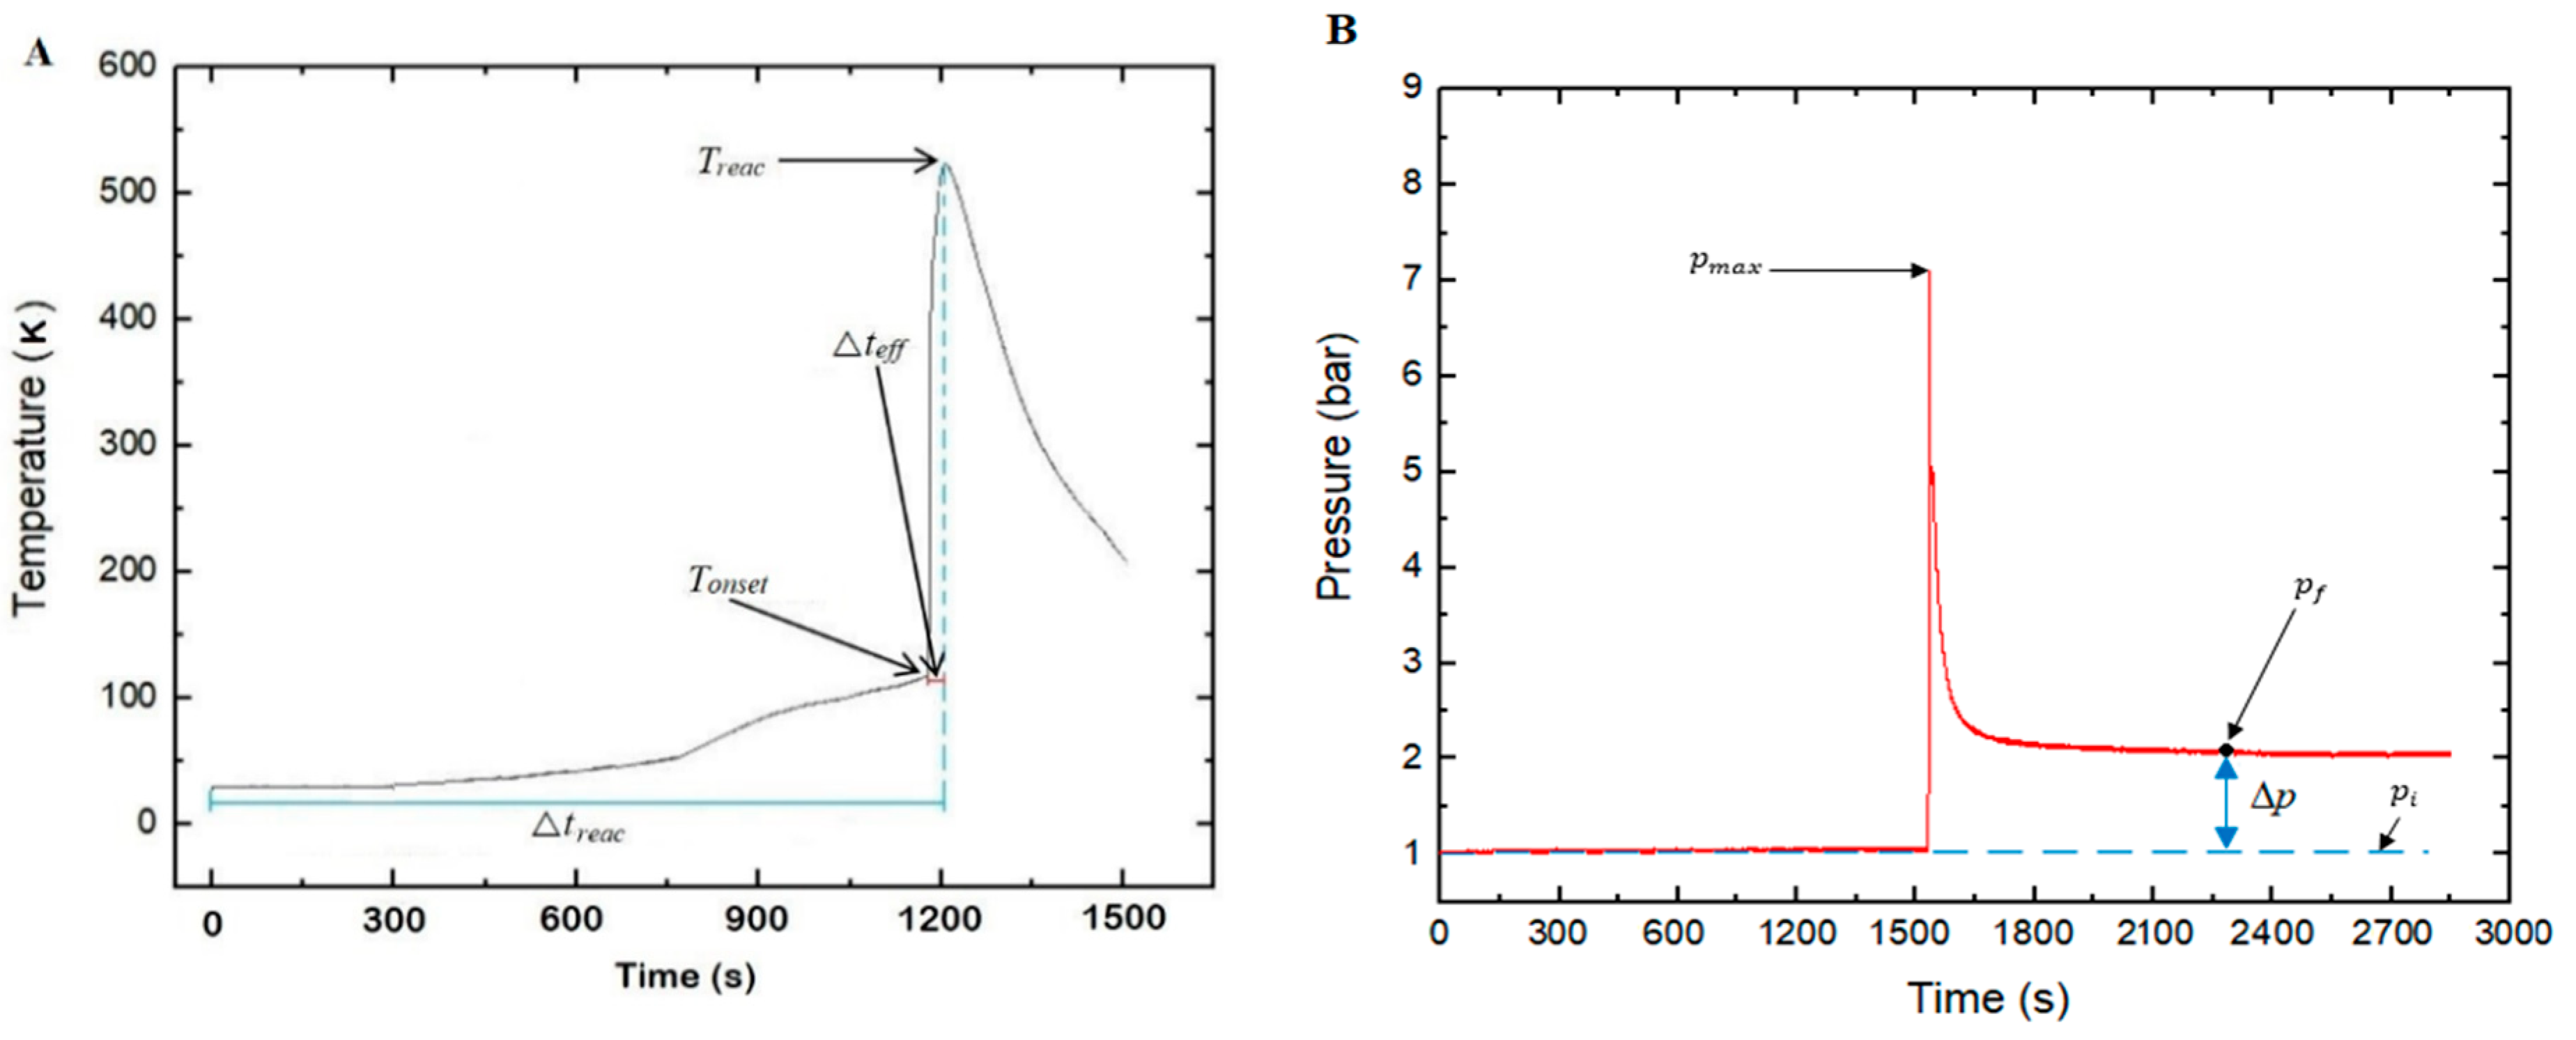
Here, the parameters considered during the study are briefly explained. As illustrated in
Figure 7, the
was considered to be the maximum temperature measured by any of the thermocouples after test initiation. The onset temperature,
, was the temperature from which a clear exothermic effect was measurable. Typically,
was defined as the period between the time of heat exposure (test initiation) and when the
was reached. The period between the
and
obtained was also termed as the effective period of thermal runaway or Δ
teff.
The change in the number of moles of gas during runaway from the LIB was calculated from Equation (1) as a derivation of the ideal gas law:
where
VR is the volume of the reactor,
is the absolute pressure inside the reactor,
R is the universal gas constant, and
T is the temperature.
Under the assumption that the reactor was perfectly gas tight and allowed to cool down to the initial temperature after the runaway,
in Equation (1) vanishes and after integration the number of moles of gas released can be calculated as:
where
is the difference between the final pressure (
) and initial pressure (
), as illustrated in
Figure 7B. Further, this includes the assumption that the number of moles of runaway products condensing during cooling is negligible as compared with those remaining in the gas phase.
For all samples, the gaseous products released during runaway were analyzed according to their composition with the FTIR analyzer.
The FTIR analyzer was operated at the required temperature of 180 °C to prevent condensation of flue gas components in the measuring line. It was calibrated manually using the Calcmet Analysis STD Software (Gasmet Technologies Oy) ahead of the flue gas analysis. As volume fractions of some gases, for example, carbon monoxide, were expected to be beyond the measurement range, the flue gas was diluted with N2 (g) before it entered the FTIR. In the Series 1 tests, a ratio of 1:10 was used; a dilution factor of 1:100 was used during the Series 2 tests. The gas samples were measured every 10 consisting of 3 scans, enabling relatively fast real-time measurements during the analysis process. Mean values from the 3 scans were used for all gas analysis measurements.
Carbon dioxide measurements did not give realistic results because of strong interference with some of the carbonyl compounds that may have been released at TR. Technically, these compounds have a close wavenumber of the absorption region. This problem could have been resolved by increasing the dilution factor, but then, this would have led to the dilemma that the components with low concentrations could not have been measured.
4. Conclusions
A total of 19 tests with 25 NMC lithium ion cells were conducted. The cells underwent thermal runaway with gas ejection within a reaction time of about 1200 ≤ ≤ 2100 after heat exposure. The cells with a SOC level ≤50% had low propensity to undergo thermal runaway. As a trend, at higher SOC levels and capacity, the tested cells generated higher pressures in the closed volume.
The numbers of moles released from the batteries and consequently mass loss were observed to be highest in the range of 90–100% SOC. The volume of gas released per cell capacity clearly showed SOC dependency.
Among the gases released, CO, CH4, and H2O had the highest volume fractions, while respect to toxicity, and especially, HCN also needs to be taken into account. The concentrations of HF measured were below 10 ppm, but it cannot be excluded that some of the HF released from the cells had already reacted inside the RV and did not reach the gas analyzer.
In two experiments, pressures higher than 7 bar occurred which could not be explained by the amount of gases released alone. A possible explanation is that the gases released may have been ignited after injection into the RV. The concentrations of the flammable components in the ejected gas seem to be sufficient to exceed the lower explosion limit when mixed with the air in the free volume of the RV. The temperatures measured at the different locations of the experimental setup also provided an indication that the minimum ignition temperatures of the gases in the mixture could have been exceeded, thus, satisfying the conditions necessary for a gas explosion.


 ,
, 


