
Comparison of Model-Based and Sensor-Based Detection of Thermal Runaway in Li-Ion Battery Modules for Automotive Application

 ,
,  , , , and
Abstract
:1. Introduction
- Decreasing the heat transfer from cell to cell by constructive changes [18,19], active or passive cooling [20,21] and/or thermal isolation [22] to slow down or rather stop Thermal Propagation and increase warning and evacuation times. This approach is in agreement with the US Vehicle Battery Safety Roadmap Guidance that states Thermal Propagation must not occur [23], acknowledging the imminent risk of one-cell faults [7].
- Early detection of battery faults to provide warning and evacuation time, which is also the subject of this work. In this context, the Global Technical Regulation on Electrical Vehicle Safety (GTR-EVS) specifies at least a 5 pre-warning time [24].
2. Materials and Methods
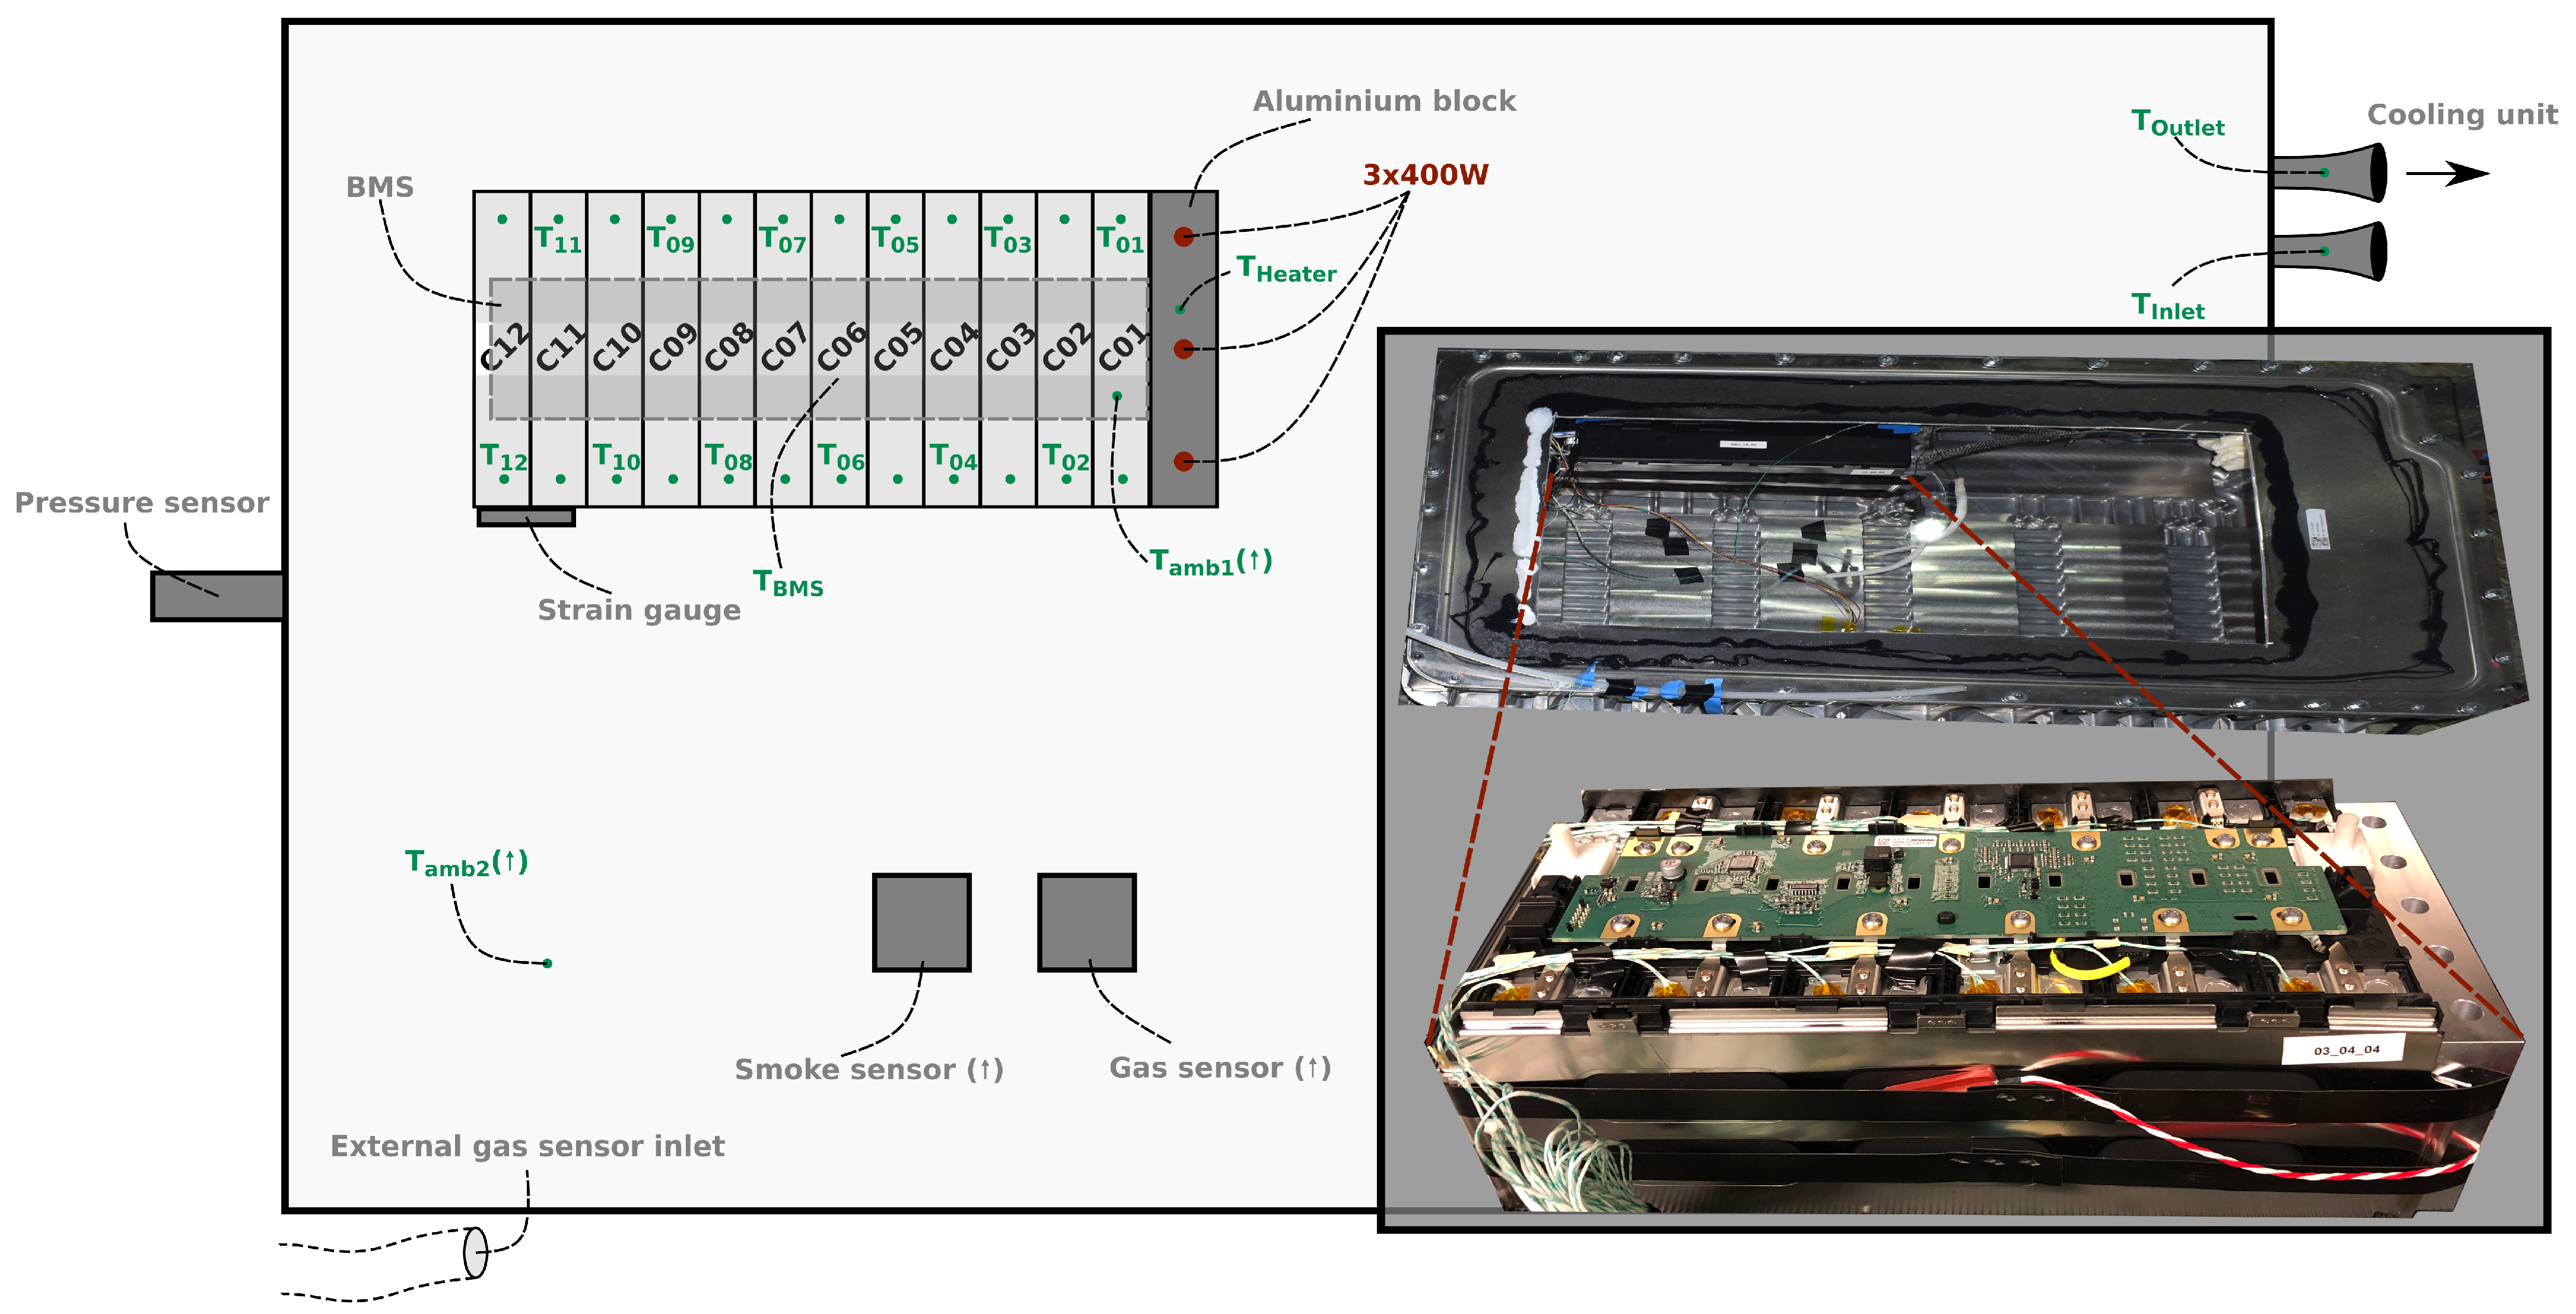
2.1. Material
2.1.1. Device under Test
2.1.2. Sensors
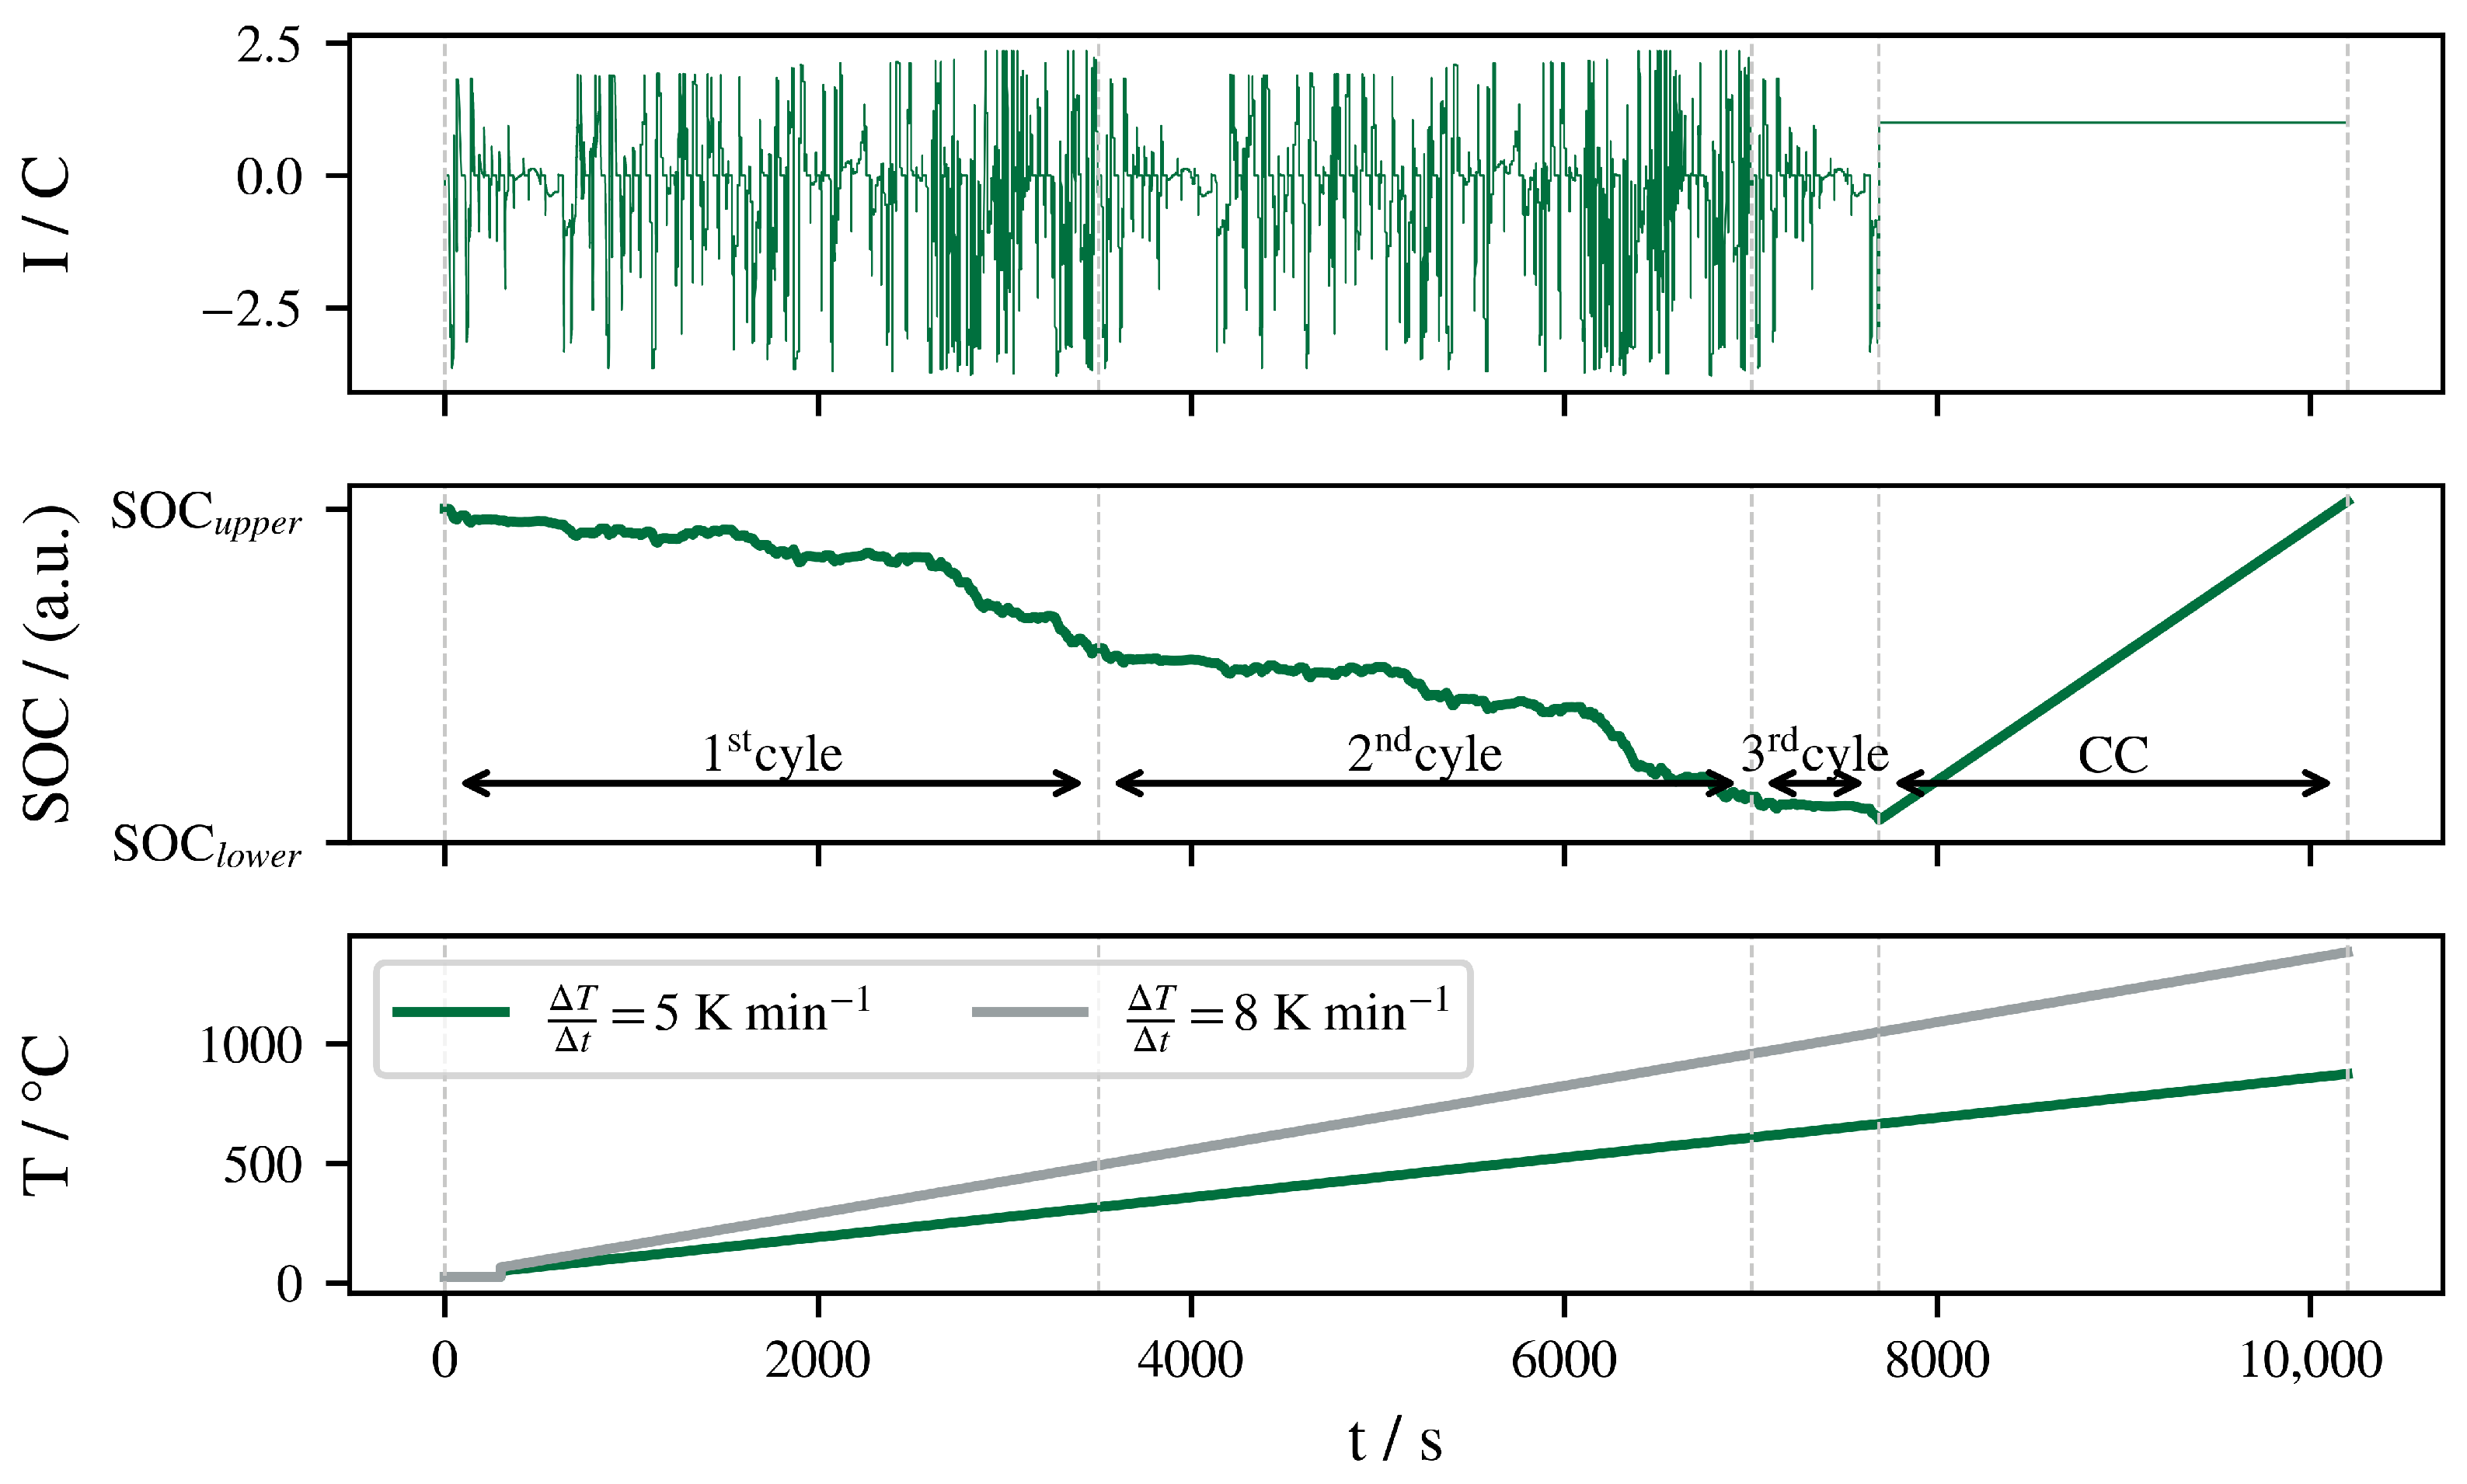
2.1.3. Load
2.2. Method
2.2.1. Experimental
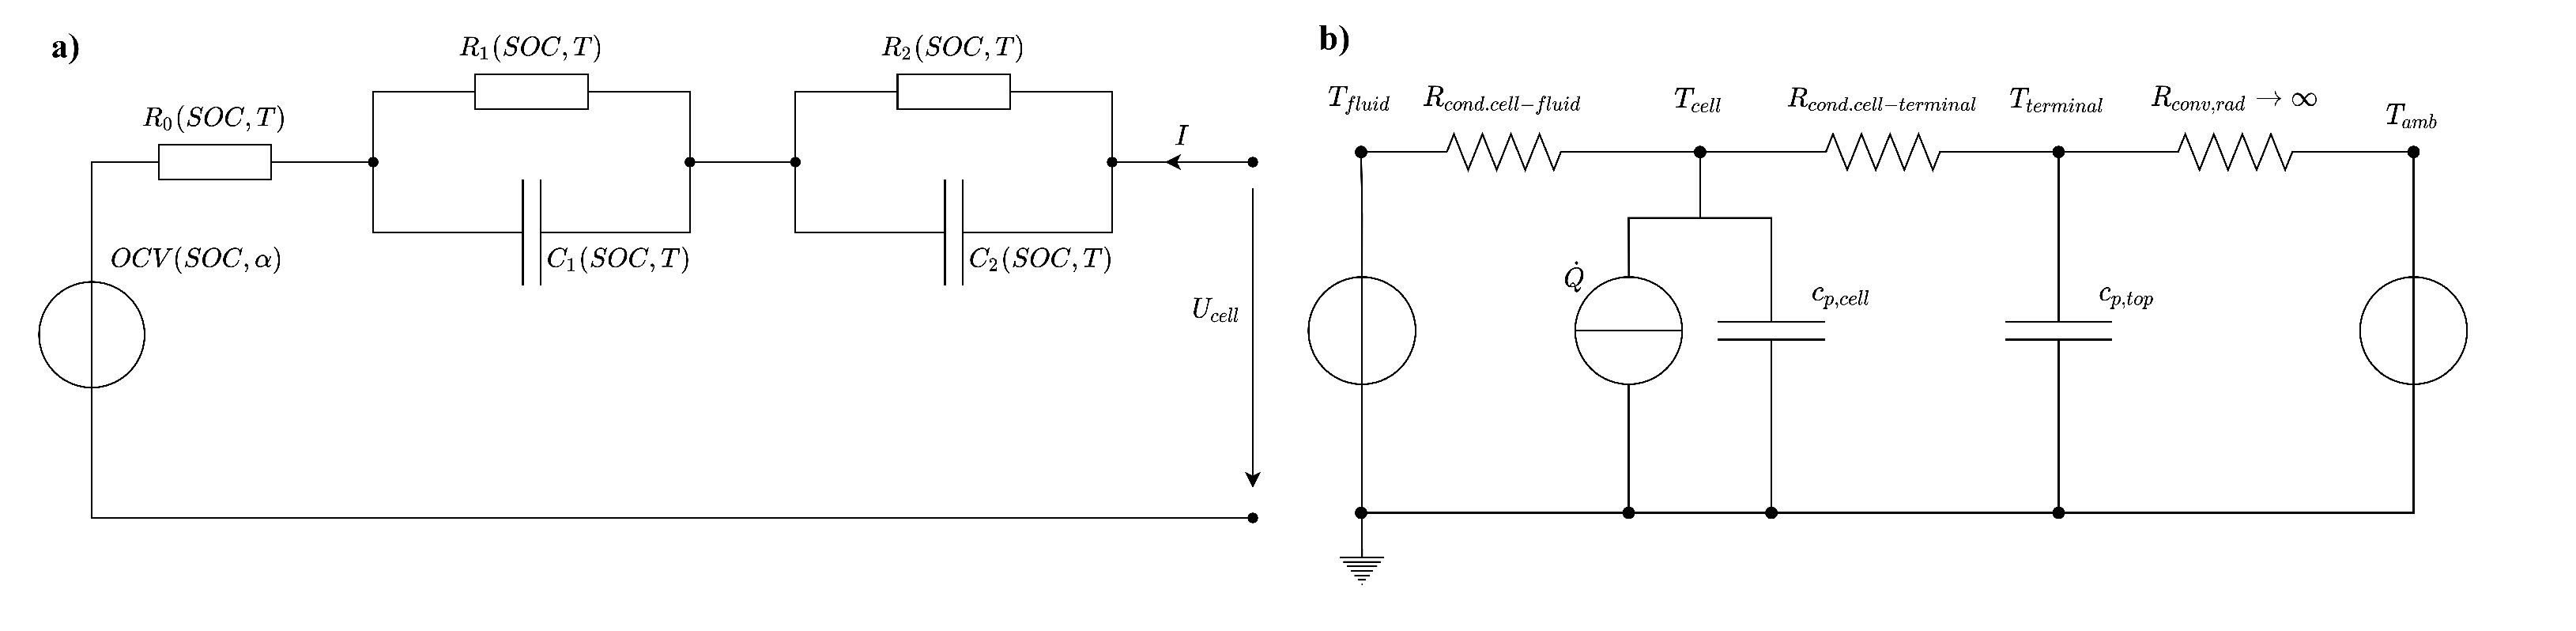
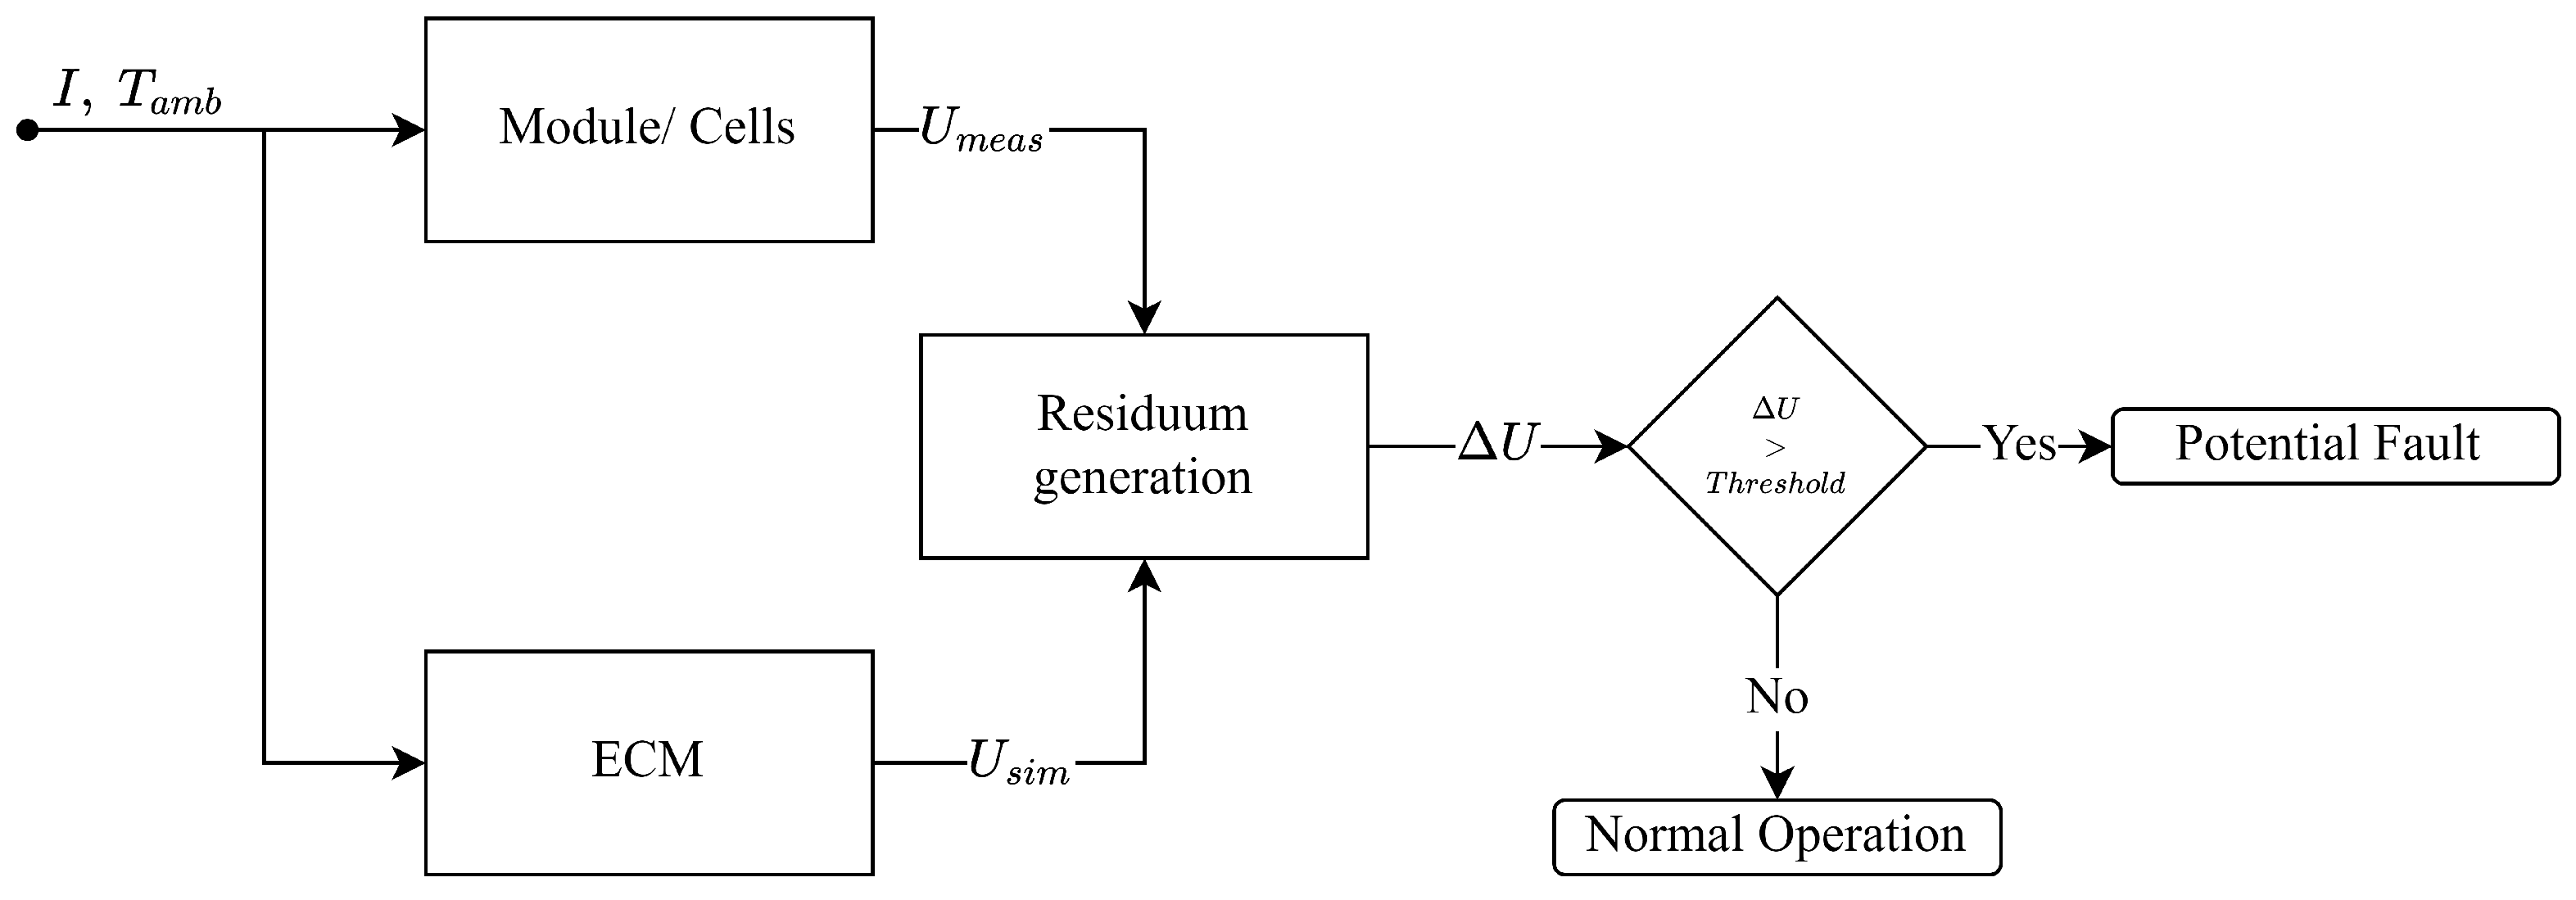
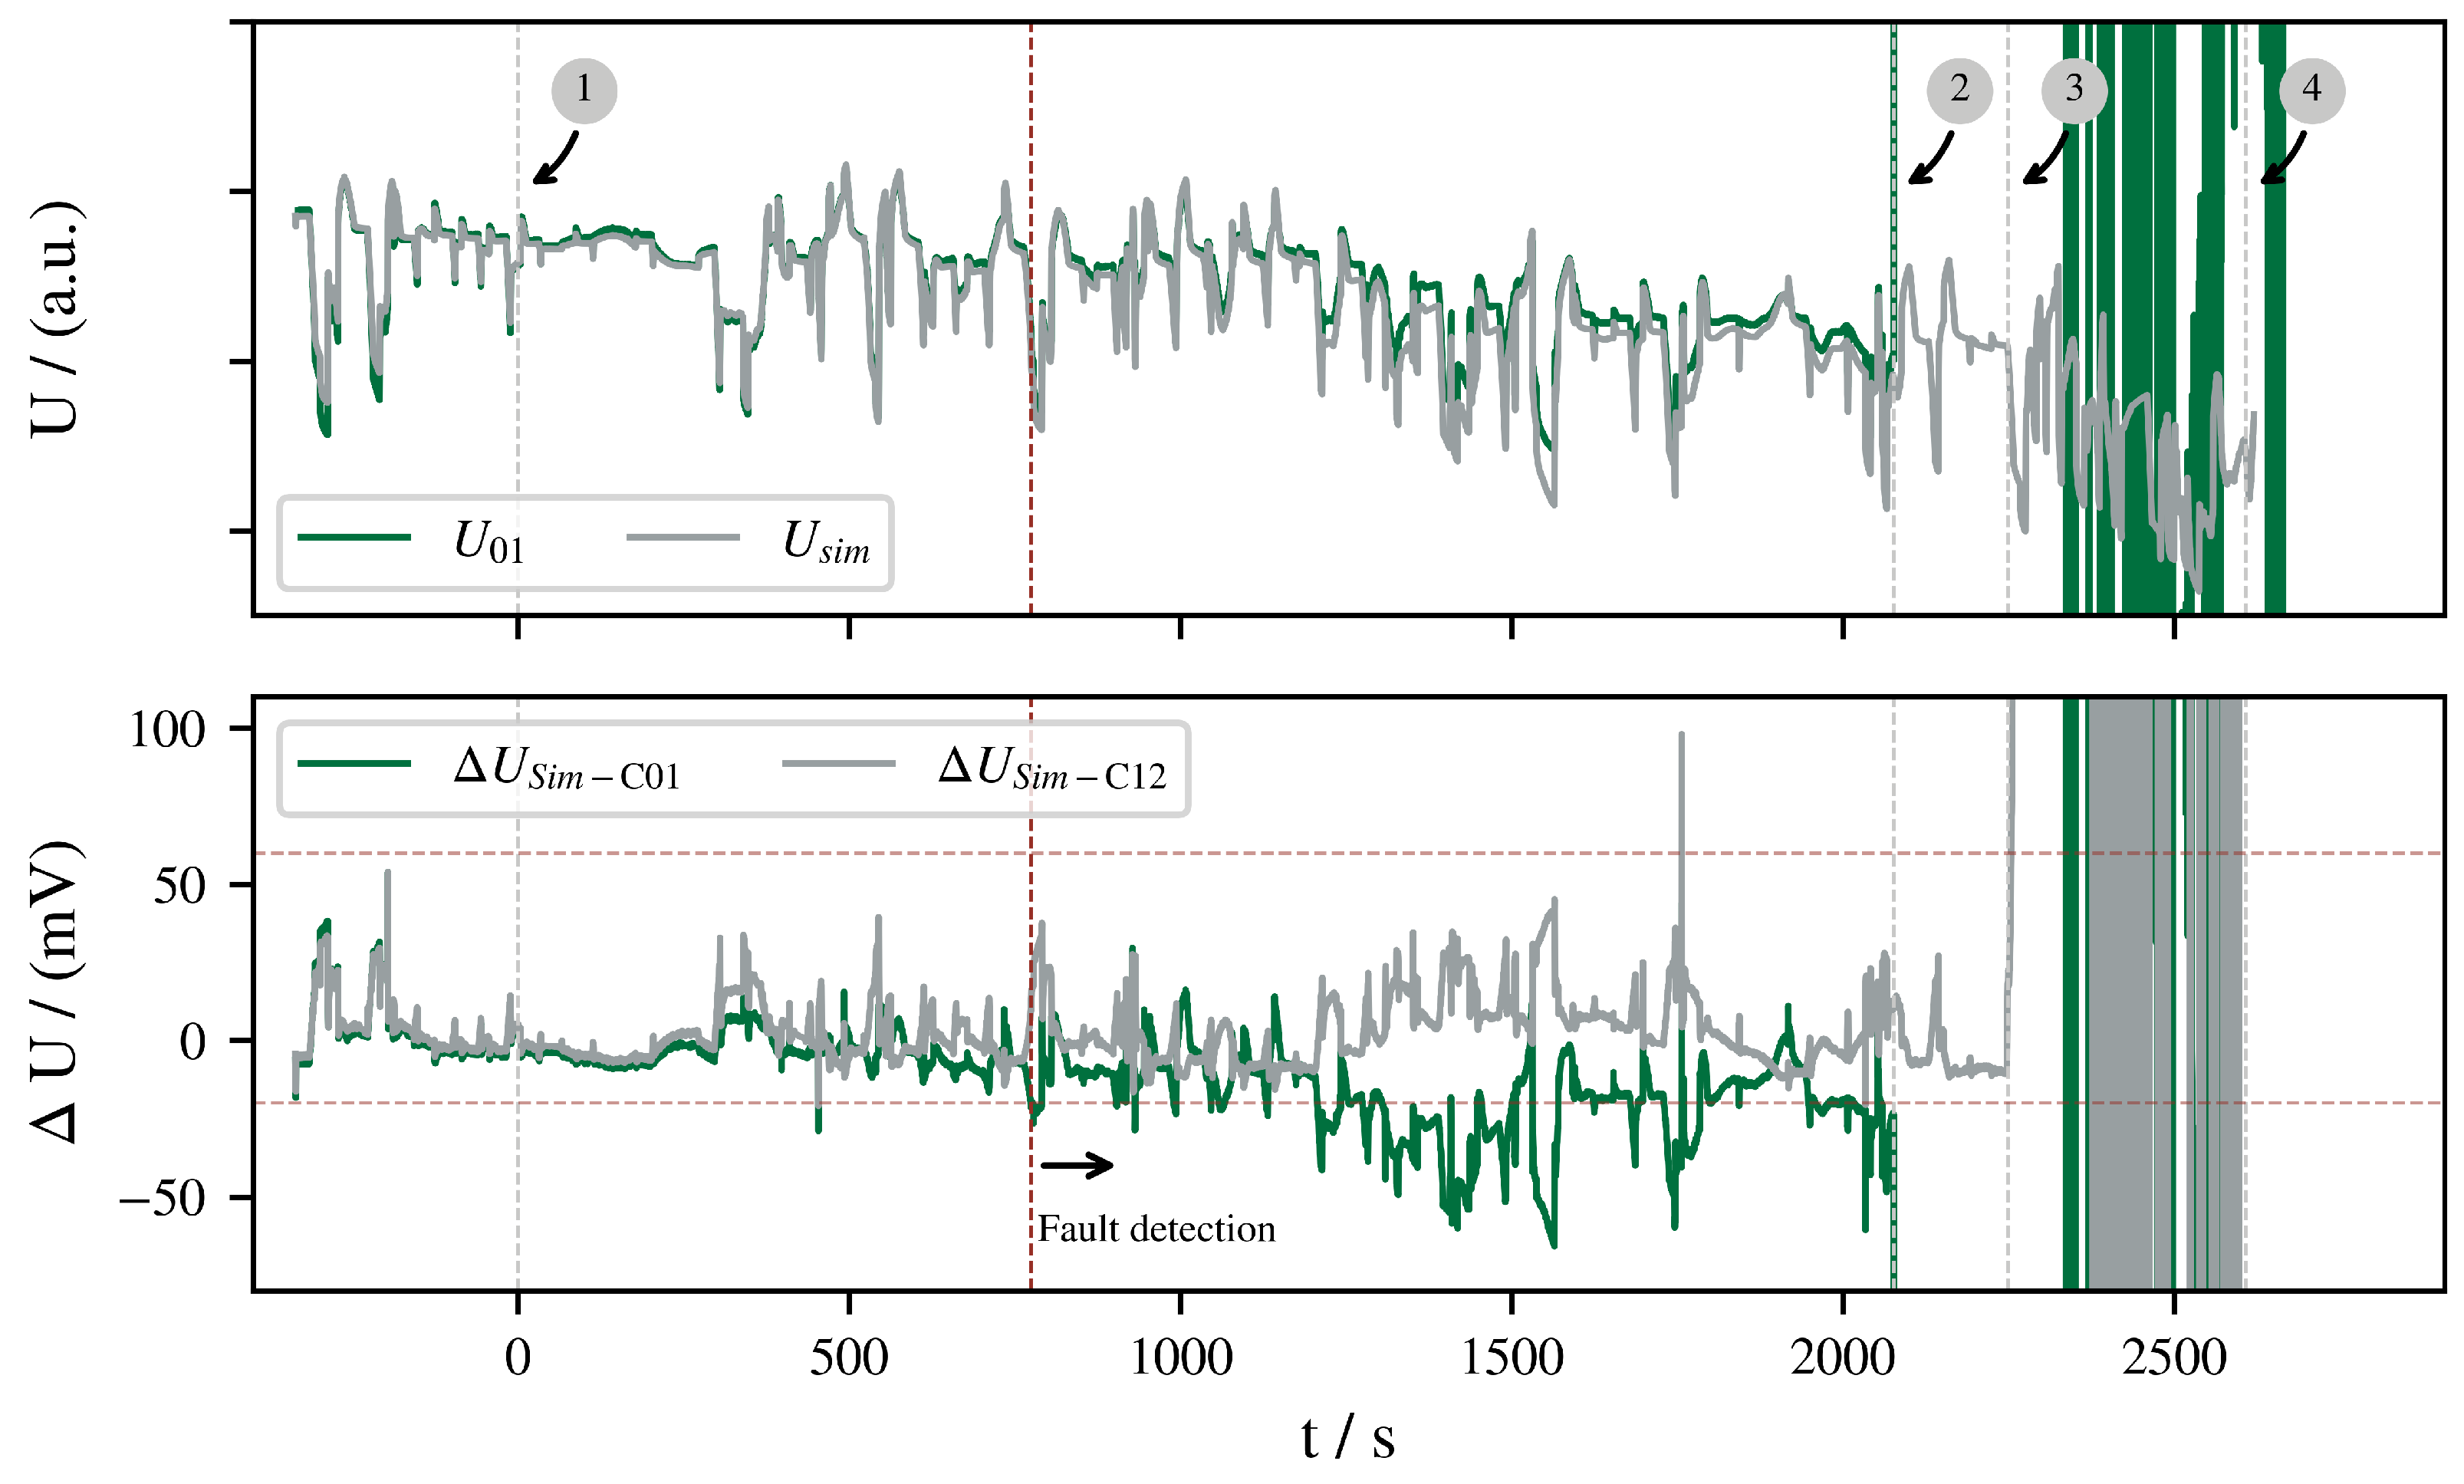
2.2.2. Model-Based Fault Detection
3. Results and Discussion
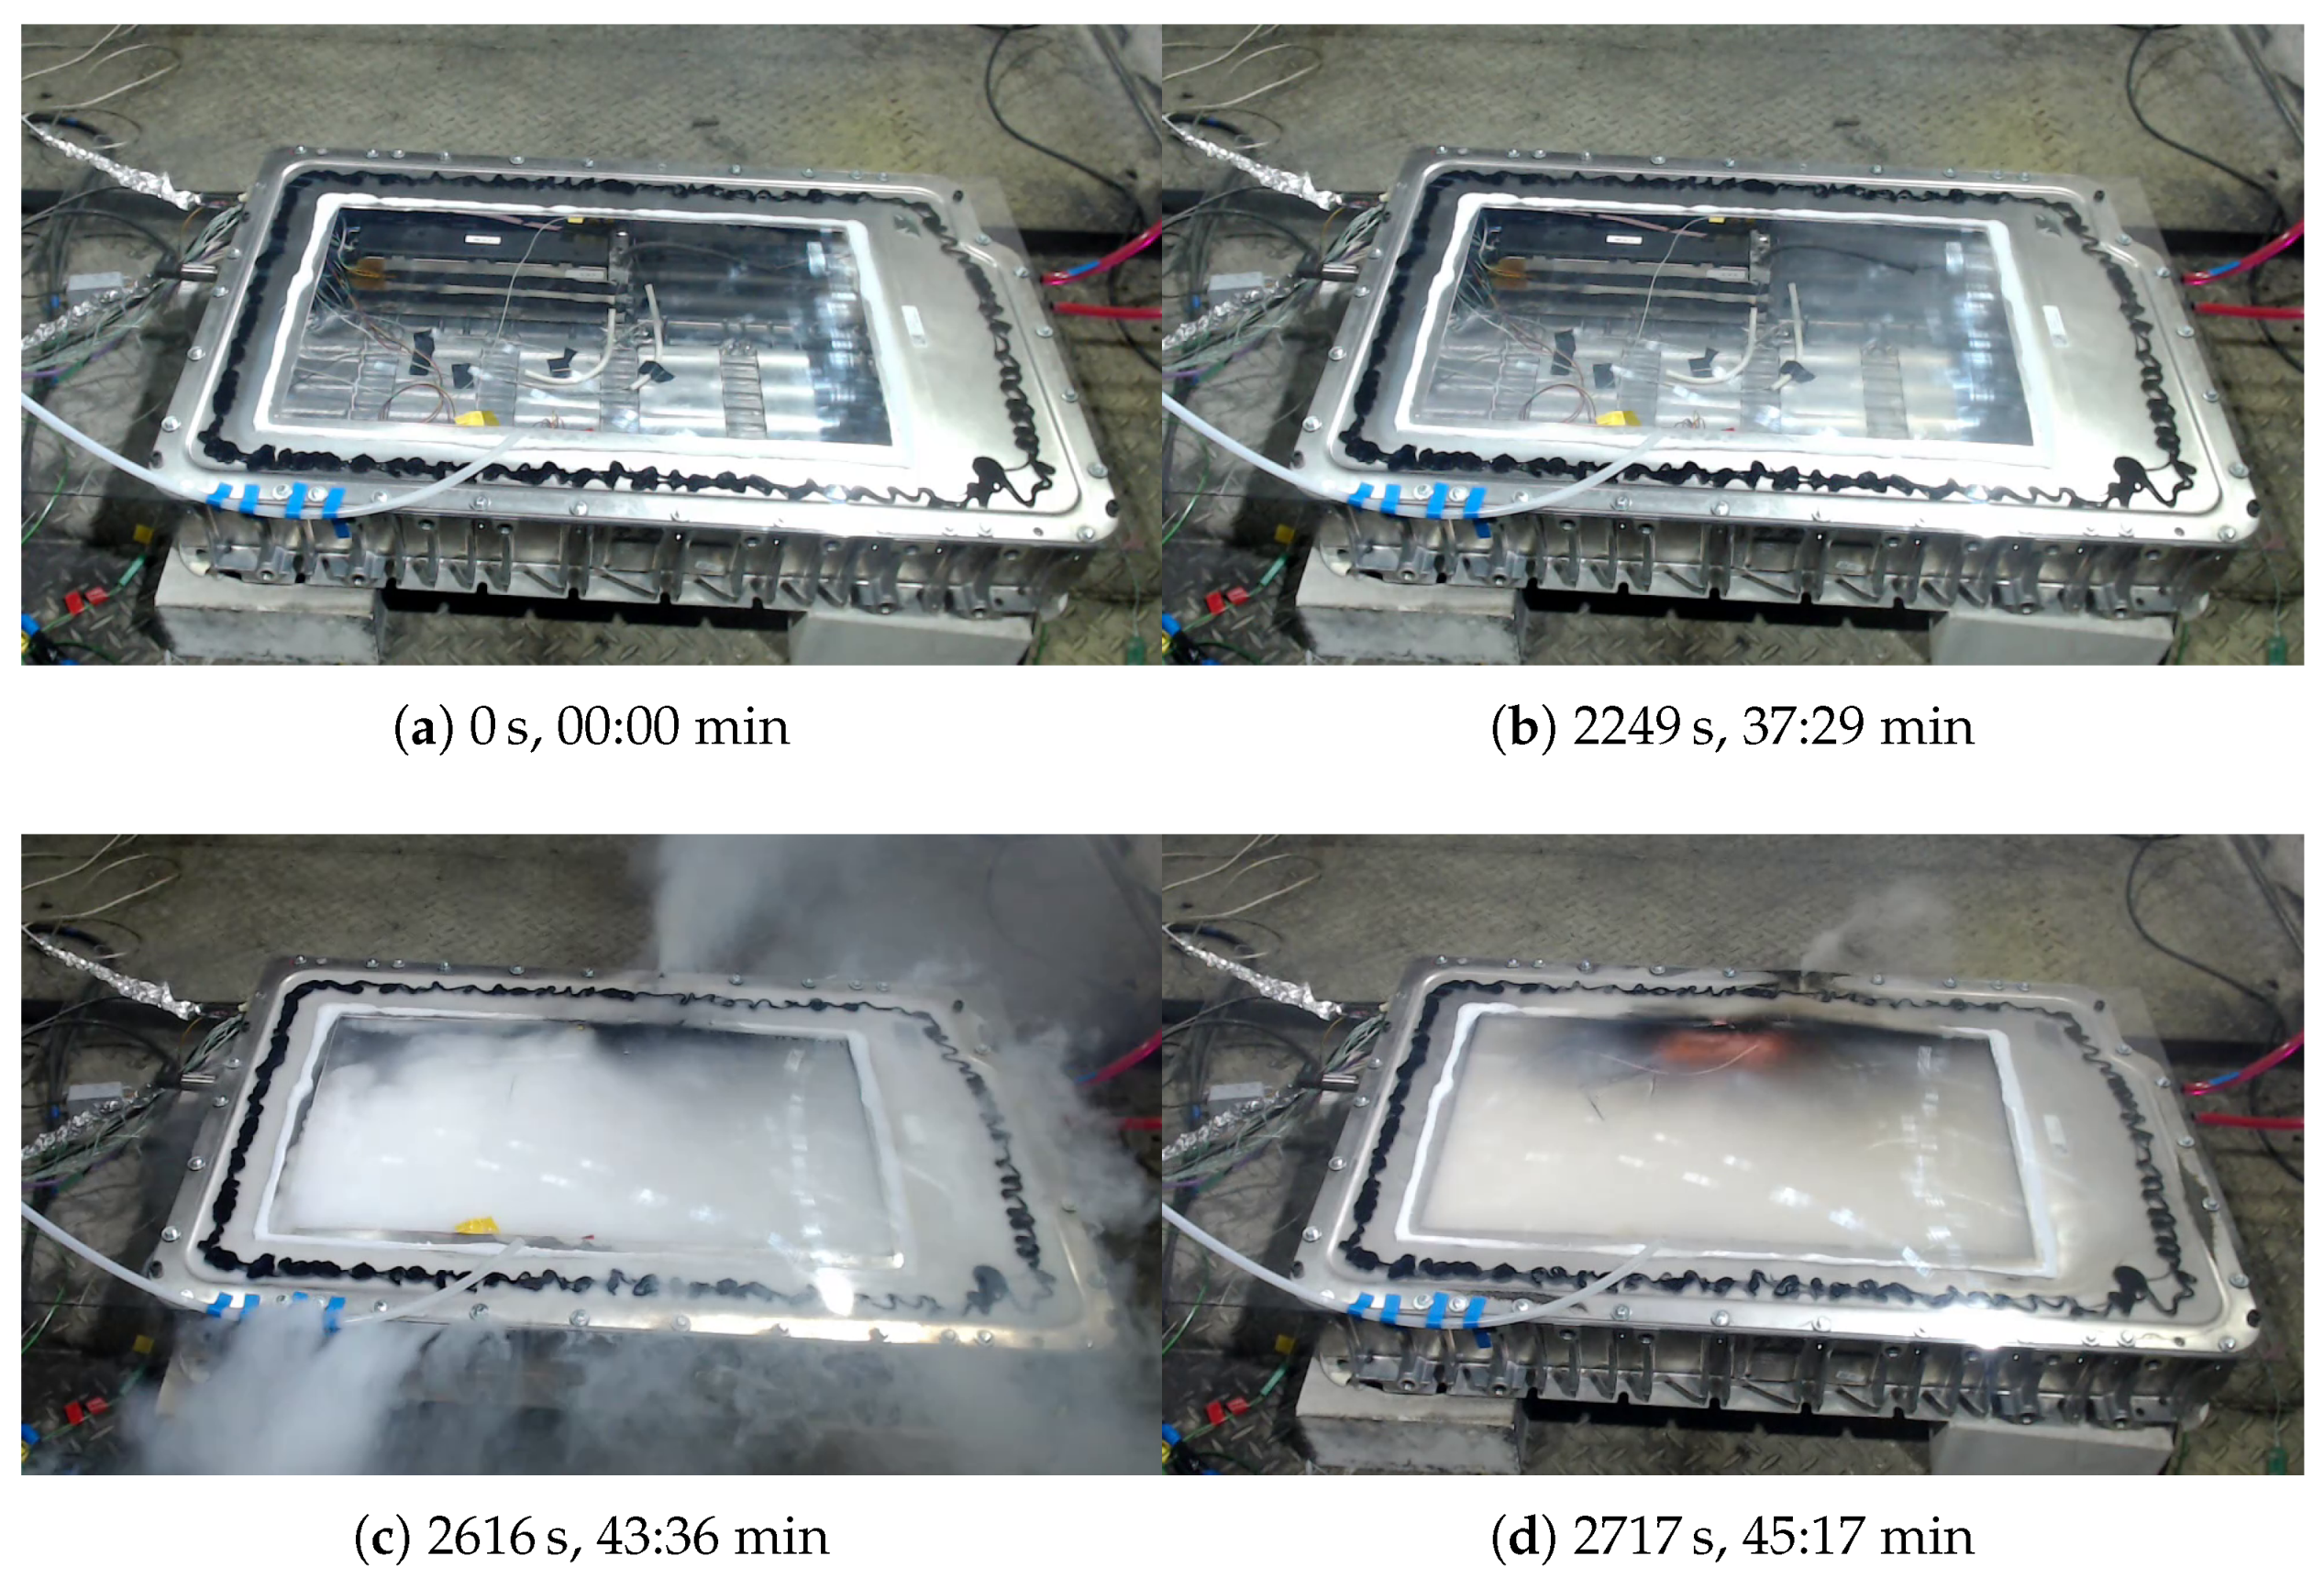
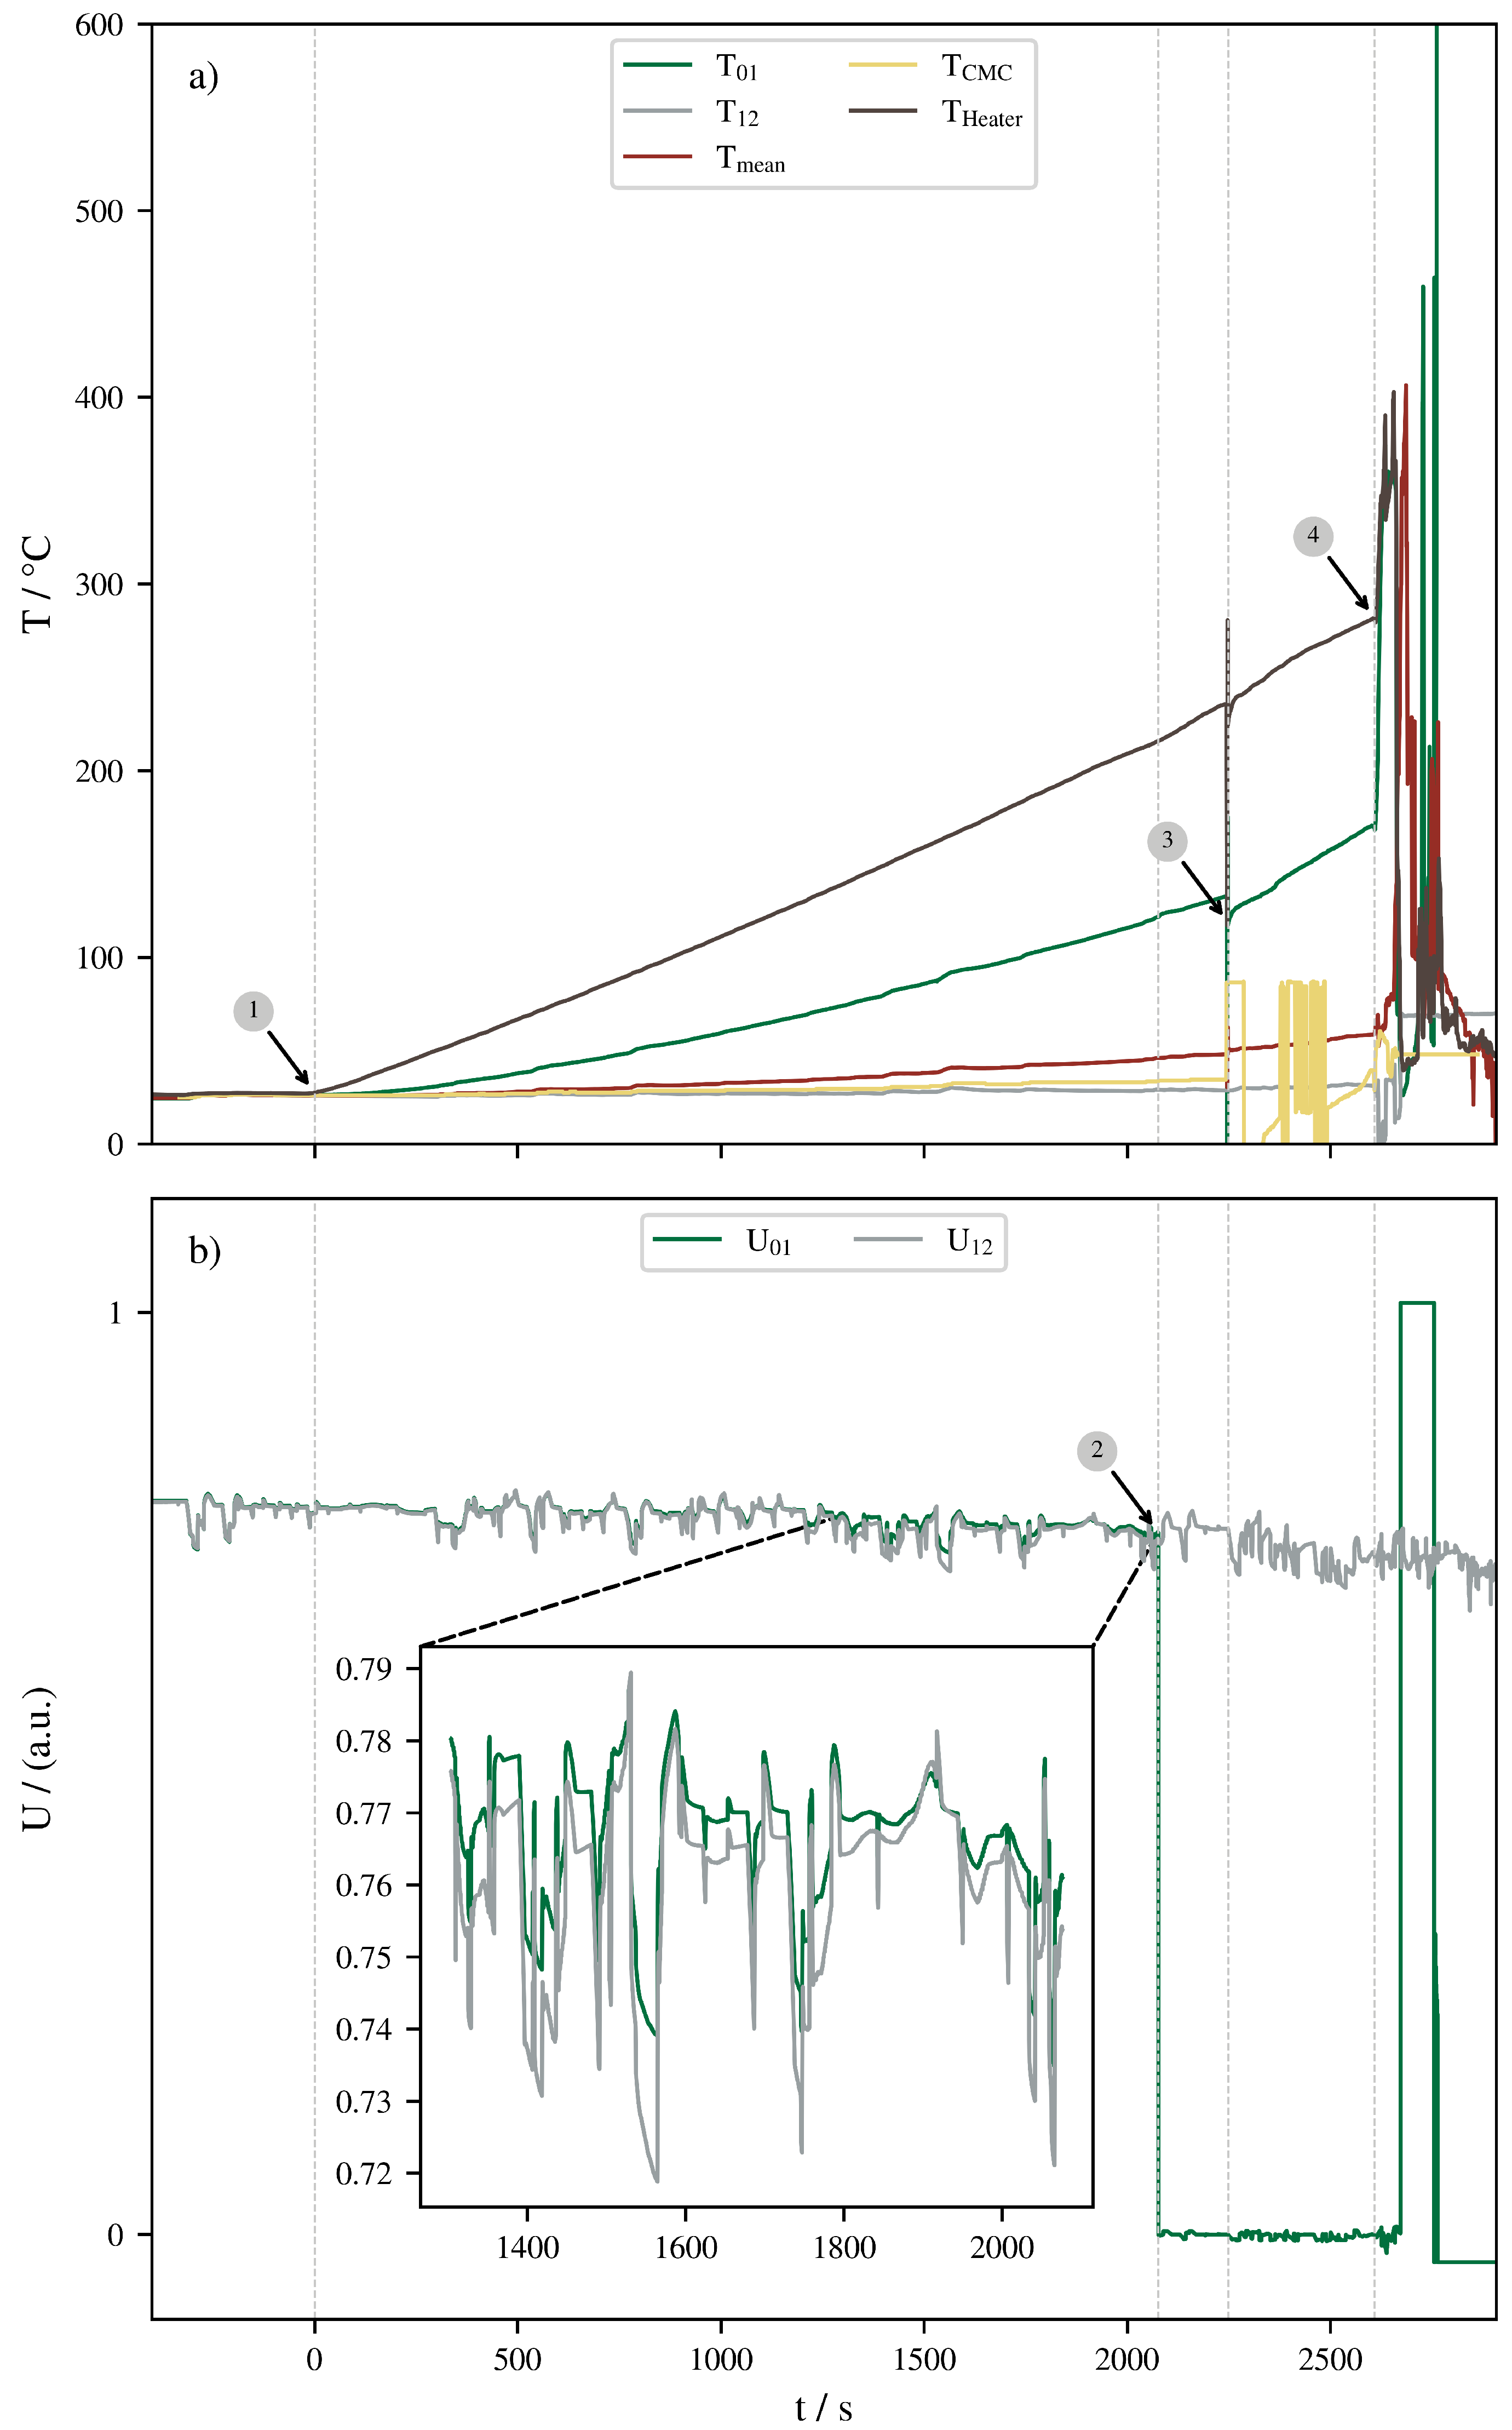
3.1. Development of Thermal Runaway
- ①
- Begin of heating. Defined by temperature .
- ②
- Activation of OSD-device. Defined by sudden loss of readings.
- ③
- Rupture of burst-disc. Defined by pressure measurement, visually validated.
- ④
- Thermal Runaway. Defined by a sudden increase in temperature and , visually validated.
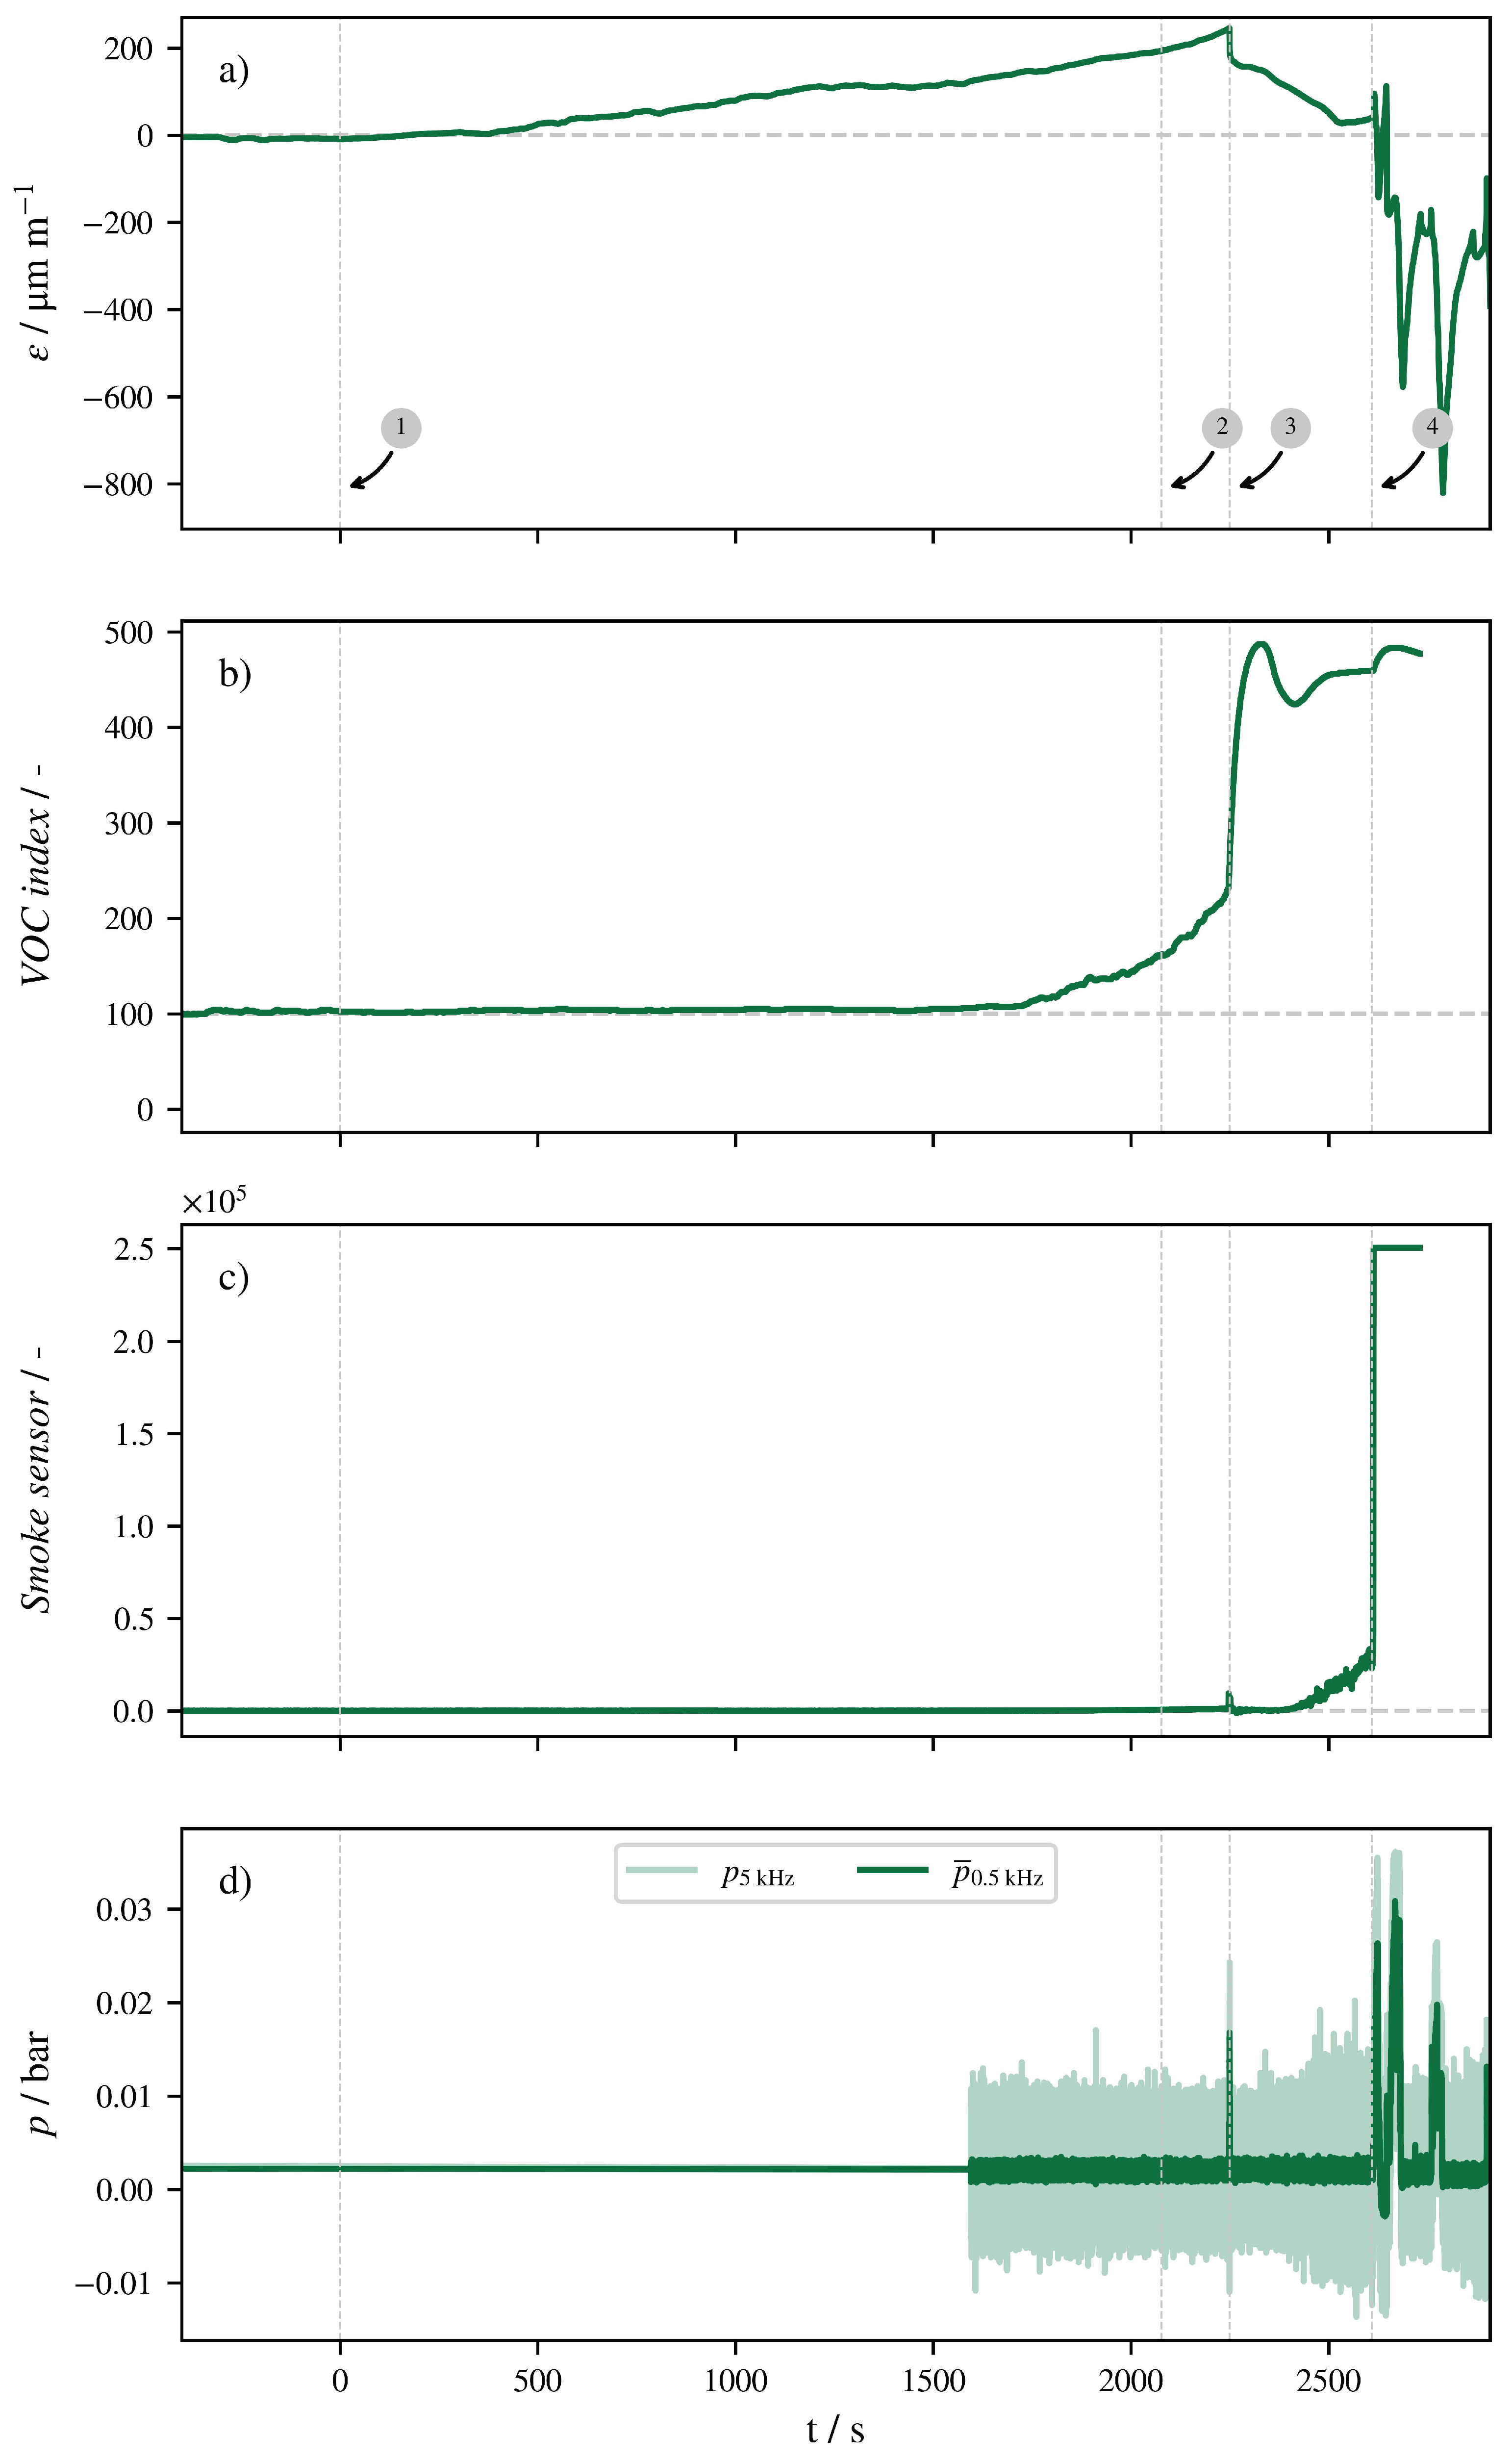
3.2. Sensor Readings
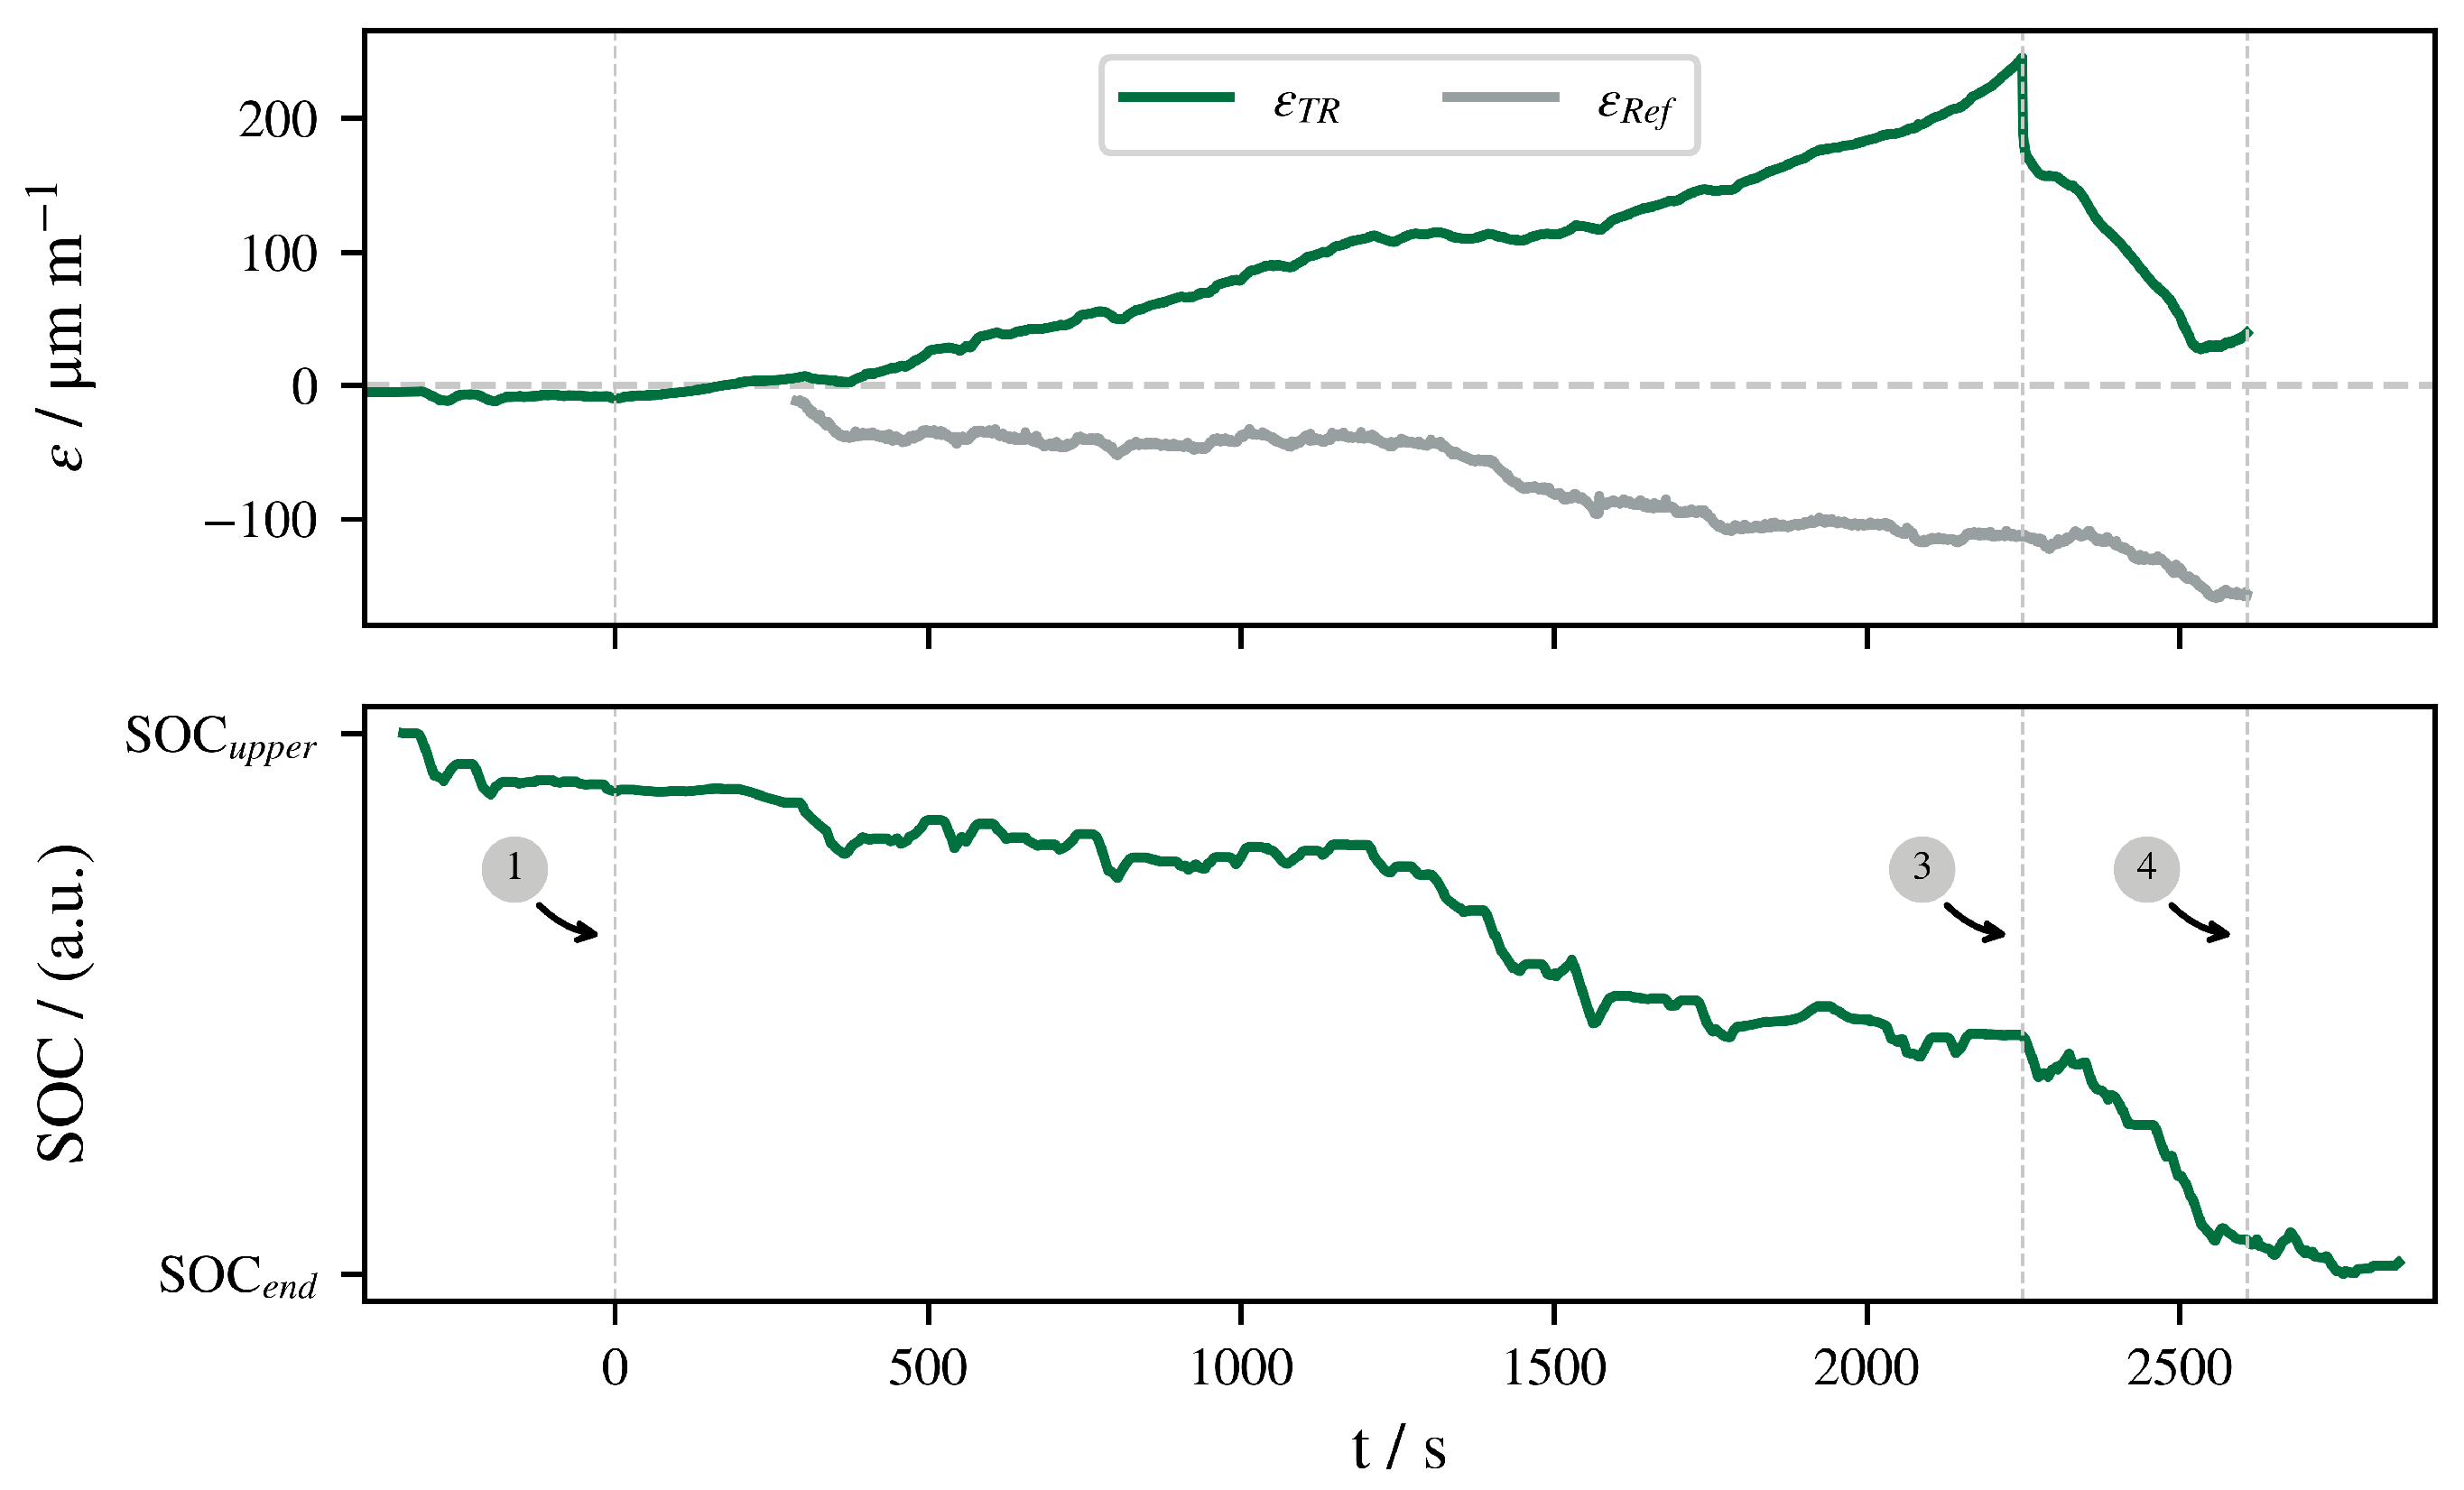
3.2.1. Strain Sensor
3.2.2. VOC Sensor
3.2.3. Smoke Sensor
3.2.4. Pressure Sensor
- Reduction in the pressure by the dead volume within the mainly empty battery case.
- Leaks in the sealing of lid and cable bushings.
3.3. Approaches for Early Fault Detection
4. Conclusions
Author Contributions
Funding
Institutional Review Board Statement
Informed Consent Statement
Data Availability Statement
Acknowledgments
Conflicts of Interest
Abbreviations
| BEV | Battery Electric Vehicle |
| BMS | Battery Management System |
| CC | Constant Current |
| CID | Current Interrupt Device |
| CMC | Cell Management Controller |
| CV | Constant Voltage |
| DUT | Device Under Test |
| GTR-(EVS) | Global Technical Regulation (on Electrical Vehicle Safety) |
| IR | Infra Red |
| LFP | Lithium-Iron-Phosphate |
| LTO | Lithium-Titanium-Oxide |
| NMC | Nickel-Manganese-Cobalt |
| OCV | Open Circuit Voltage |
| OEM | Original Equipment Manufacturer |
| OSD | Over-charge Safety Device |
| PHEV | Plug-In Hybrid Electric Vehicle |
| PID | Proportional-Integral-Derivative Controller |
| SEI | Solid Electrolyte Interface |
| SOC | State of Charge |
| SOH | State of Health |
| VOC | Volatile Organic Compound |
| WHVC | World Harmonised Vehicle Cycle |
Appendix A
Appendix A.1. Model-Based Fault Detection
Appendix A.2. Results

| A | B | C | D | ||
|---|---|---|---|---|---|
| I | t | ||||
| II | t | ||||
| III | t | ||||
| IV | t | ||||
| V | t | ||||
References
- Yu, A.; Sumangil, M. Top Electric Vehicle Markets Dominate Lithium-Ion Battery Capacity Growth. Available online: https://www.spglobal.com/marketintelligence/en/news-insights/blog/top-electric-vehicle-markets-dominate-lithium-ion-battery-capacity-growth (accessed on 10 January 2022).
- Bodine, R.; Brennan, R. Gas vs. Electric Car Fires: 2021 Findings. Available online: https://www.autoinsuranceez.com/gas-vs-electric-car-fires/ (accessed on 8 February 2022).
- National Transportation Safety Board. Aircraft Incident Report: Auxiliary Power Unit Battery Fire; National Transportation Safety Board: Washington DC, USA, 2014.
- Koh, D.J. Samsung Announces Cause of Galaxy Note7 Incidents in Press Conference. 2017. Available online: https://news.samsung.com/us/Samsung-Electronics-Announces-Cause-of-Galaxy-Note7-Incidents-in-Press-Conference (accessed on 10 January 2022).
- Meza, E. Several German Cities Halt Use of e-Buses Following Series of Unresolved Cases of Fire. Available online: https://www.cleanenergywire.org/news/several-german-cities-halt-use-e-buses-following-series-unresolved-cases-fire (accessed on 10 January 2022).
- Naughton, K.; Yang, Y. GM Recalls All Bolt EVs on Fire Risk; Sees $1 Billion Cost, 2021. Available online: https://www.bloomberg.com/news/articles/2021-08-20/gm-to-spend-1-billion-to-recall-all-bolt-evs-due-to-fire-risk (accessed on 8 February 2022).
- Liaw, B.Y.; Wang, F.; Wei, Y.; Brandt, K.; Schultheiß, J.; Schweizer-Berberich, M.; Dandl, S.; Wöhrle, T.; Lamp, P.; Jeevarajan, A.J.; et al. Managing Safety Risk by Manufacturers. In Li-Battery Safety; Garche, J., Brandt, K., Eds.; Electrochemical Power Sources; Elsevier: San Diego, CA, USA, 2019; pp. 267–378. [Google Scholar] [CrossRef]
- Pfrang, A. JRC Exploratory Research: Safer Li-Ion Batteries by Preventing Thermal Propagation; European Commission: Luxembourg, 2018. [Google Scholar]
- Feng, X.; Zheng, S.; Ren, D.; He, X.; Wang, L.; Cui, H.; Liu, X.; Jin, C.; Zhang, F.; Xu, C.; et al. Investigating the thermal runaway mechanisms of lithium-ion batteries based on thermal analysis database. Appl. Energy 2019, 246, 53–64. [Google Scholar] [CrossRef]
- Wang, Q.; Ping, P.; Zhao, X.; Chu, G.; Sun, J.; Chen, C. Thermal runaway caused fire and explosion of lithium ion battery. J. Power Sources 2012, 208, 210–224. [Google Scholar] [CrossRef]
- Börger, A.; Mertens, J.; Wenzl, H. Thermal runaway and thermal runaway propagation in batteries: What do we talk about? J. Energy Storage 2019, 24, 100649. [Google Scholar] [CrossRef]
- Jens, T.; Karsten, P.; Christopher, E.H.; Daphne, A.F.; Harry, D.; Jürgen, G.; Verena, L.; Xuning, F.; Minggao, O.; Languang, L.; et al. Li-Secondary Battery. In Li-Battery Safety; Garche, J., Brandt, K., Eds.; Electrochemical Power Sources; Elsevier: San Diego, CA, USA, 2019; pp. 507–629. [Google Scholar] [CrossRef]
- Li, X.; Wang, Z. A novel fault diagnosis method for lithium-Ion battery packs of electric vehicles. Measurement 2018, 116, 402–411. [Google Scholar] [CrossRef]
- Gao, S.; Feng, X.; Lu, L.; Ouyang, M.; Ren, D. A Test Approach for Evaluating the Safety Considering Thermal Runaway Propagation within the Battery Pack. ECS Trans. 2017, 77, 225–236. [Google Scholar] [CrossRef]
- Brodd, R.J. Batteries for Sustainability; Springer: New York, NY, USA, 2013. [Google Scholar] [CrossRef]
- Tidblad, A.A.; Edström, K.; Hernández, G.; de Meatza, I.; Landa-Medrano, I.; Jacas Biendicho, J.; Trilla, L.; Buysse, M.; Ierides, M.; Horno, B.P.; et al. Future Material Developments for Electric Vehicle Battery Cells Answering Growing Demands from an End-User Perspective. Energies 2021, 14, 4223. [Google Scholar] [CrossRef]
- Liu, B.; Jia, Y.; Li, J.; Yin, S.; Yuan, C.; Hu, Z.; Wang, L.; Li, Y.; Xu, J. Safety issues caused by internal short circuits in lithium-ion batteries. J. Mater. Chem. A 2018, 6, 21475–21484. [Google Scholar] [CrossRef]
- Lopez, C.F.; Jeevarajan, J.A.; Mukherjee, P.P. Experimental Analysis of Thermal Runaway and Propagation in Lithium-Ion Battery Modules. J. Electrochem. Soc. 2015, 162, A1905–A1915. [Google Scholar] [CrossRef]
- Zhong, G.; Li, H.; Wang, C.; Xu, K.; Wang, Q. Experimental Analysis of Thermal Runaway Propagation Risk within 18650 Lithium-Ion Battery Modules. J. Electrochem. Soc. 2018, 165, A1925–A1934. [Google Scholar] [CrossRef]
- Chen, F.; Huang, R.; Wang, C.; Yu, X.; Liu, H.; Wu, Q.; Qian, K.; Bhagat, R. Air and PCM cooling for battery thermal management considering battery cycle life. Appl. Therm. Eng. 2020, 173. [Google Scholar] [CrossRef]
- Kim, G.-H.; Pesaran, A. Presented at the Analysis of Heat Dissipation in Li-Ion Cells & Modules for Modeling of Thermal Runaway (Presentation), Long Beach, CA, USA, 15 May 2007.
- Darcy, E. Presented at the Driving Factors for Mitigating Cell Thermal Runaway Propagation and Arresting Flames in High Performing Li-Ion Battery Designs (Presentaion), Santa Rosa, CA, USA, 1 May 2015.
- Doughty, D.H.; Pesaran, A.A. Vehicle Battery Safety Roadmap Guidance; National Renewable Energy Lab. (NREL): Golden, CO, USA, 2012. [CrossRef]
- UN Global Technical Regulation. Global Technical Regulation No. 20: Global Technical Regulation on the Electrical Vehicle Safety (EVS). Available online: https://unece.org/fileadmin/DAM/trans/main/wp29/wp29wgs/wp29gen/wp29registry/ECE-TRANS-180a20app1e.pdf (accessed on 10 January 2022).
- Yuan, L.; Dubaniewicz, T.; Zlochower, I.; Thomas, R.; Rayyan, N. Experimental study on thermal runaway and vented gases of lithium-ion cells. Process Saf. Environ. Prot. 2020, 144, 186–192. [Google Scholar] [CrossRef]
- Essl, C.; Golubkov, A.W.; Gasser, E.; Nachtnebel, M.; Zankel, A.; Ewert, E.; Fuchs, A. Comprehensive Hazard Analysis of Failing Automotive Lithium-Ion Batteries in Overtemperature Experiments. Batteries 2020, 6, 30. [Google Scholar] [CrossRef]
- Golubkov, A.W.; Scheikl, S.; Planteu, R.; Voitic, G.; Wiltsche, H.; Stangl, C.; Fauler, G.; Thaler, A.; Hacker, V. Thermal runaway of commercial 18650 Li-ion batteries with LFP and NCA cathodes—Impact of state of charge and overcharge. RSC Adv. 2015, 5, 57171–57186. [Google Scholar] [CrossRef] [Green Version]
- Hewson, J.C. Understanding the Limits of the Thermal Runaway in Lithium-Ion-Batteries. Sandia National Laboratories. 2016. Available online: https://www.osti.gov/servlets/purl/1420927 (accessed on 19 December 2020).
- Diaz, F.; Wang, Y.; Weyhe, R.; Friedrich, B. Gas-generation measurement and evaluation during mechanical processing and thermal treatment of spent Li-ion batteries. Waste Manag. 2019, 84, 102–111. [Google Scholar] [CrossRef]
- Essl, C.; Golubkov, A.W.; Fuchs, A. Comparing Different Thermal Runaway Triggers for Two Automotive Lithium-Ion Battery Cell Types. J. Electrochem. Soc. 2020, 167, 130542. [Google Scholar] [CrossRef]
- Schmidt, J.P.; Arnold, S.; Loges, A.; Werner, D.; Wetzel, T.; Ivers-Tiffée, E. Measurement of the internal cell temperature via impedance: Evaluation and application of a new method. J. Power Sources 2013, 243, 110–117. [Google Scholar] [CrossRef]
- Zhao, R.; Liu, J.; Gu, J. A comprehensive study on Li-ion battery nail penetrations and the possible solutions. Energy 2017, 123, 392–401. [Google Scholar] [CrossRef]
- Feng, X.; Sun, J.; Ouyang, M.; He, X.; Lu, L.; Han, X.; Fang, M.; Peng, H. Characterization of large format lithium ion battery exposed to extremely high temperature. J. Power Sources 2014, 272, 457–467. [Google Scholar] [CrossRef]
- Stephens, D.; Shawcross, P.; Stout, G.; Sullivan, E.; Saunders, J.; Risser, S. Assessment of Potential Lithium-Ion Battery Safety Issues for Electric and Plug-in Hybrid Vehicles: Report No. DOT HS 812 418; National Highway Traffic Safety Administration: Washington, DC, USA, 2017.
- Sidhu, A.; Izadian, A.; Anwar, S. Adaptive Nonlinear Model-Based Fault Diagnosis of Li-Ion Batteries. IEEE Trans. Ind. Electron. 2015, 62, 1002–1011. [Google Scholar] [CrossRef] [Green Version]
- Srinivasan, R.; Demirev, P.A.; Carkhuff, B.G. Rapid monitoring of impedance phase shifts in lithium-ion batteries for hazard prevention. J. Power Sources 2018, 405, 30–36. [Google Scholar] [CrossRef]
- Käbitz, S. Untersuchung der Alterung von Lithium-Ionen-Batterien Mittels Elektroanalytik und Elektrochemischer Impedanzspektroskopie. Ph.D. Thesis, RWTH Aachen, Aachen, Germany, 2016. [Google Scholar]
- Feng, X.; Zheng, S.; He, X.; Wang, L.; Wang, Y.; Ren, D.; Ouyang, M. Time Sequence Map for Interpreting the Thermal Runaway Mechanism of Lithium-Ion Batteries With LiNixCoyMnzO2 Cathode. Front. Energy Res. 2018, 6, 264. [Google Scholar] [CrossRef] [Green Version]
- Cai, T.; Stefanopoulou, A.G.; Siegel, J.B. Modeling Li-Ion Battery Temperature and Expansion Force during the Early Stages of Thermal Runaway Triggered by Internal Shorts. J. Electrochem. Soc. 2019, 166, A2431–A2443. [Google Scholar] [CrossRef]
- Wang, Q.; Mao, B.; Stoliarov, S.I.; Sun, J. A review of lithium ion battery failure mechanisms and fire prevention strategies. Prog. Energy Combust. Sci. 2019, 73, 95–131. [Google Scholar] [CrossRef]
- Spotnitz, R.; Franklin, J. Abuse behavior of high-power, lithium-ion cells. J. Power Sources 2003, 113, 81–100. [Google Scholar] [CrossRef]
- Zhang, Y.; Wang, H.; Wang, Y.; Li, C.; Liu, Y.; Ouyang, M. Thermal abusive experimental research on the large-format lithium-ion battery using a buried dual-sensor. J. Energy Storage 2021, 33, 102156. [Google Scholar] [CrossRef]
- Mier, F.A. Measurement of 18650 Format Lithium Ion Battery Vent Mechanism Flow Parameters; Masterarbeit; New Mexico Institute of Mining and Technology: Socorro, NM, USA, 2018. [Google Scholar]
- Nascimento, M.; Novais, S.; Ding, M.S.; Ferreira, M.S.; Koch, S.; Passerini, S.; Pinto, J.L. Internal strain and temperature discrimination with optical fiber hybrid sensors in Li-ion batteries. J. Power Sources 2019, 410–411, 1–9. [Google Scholar] [CrossRef]
- Lei, B.; Zhao, W.; Ziebert, C.; Uhlmann, N.; Rohde, M.; Seifert, H. Experimental Analysis of Thermal Runaway in 18650 Cylindrical Li-Ion Cells Using an Accelerating Rate Calorimeter. Batteries 2017, 3, 14. [Google Scholar] [CrossRef] [Green Version]
- Chen, M.; Liu, J.; He, Y.; Yuen, R.; Wang, J. Study of the fire hazards of lithium-ion batteries at different pressures. Appl. Therm. Eng. 2017, 125, 1061–1074. [Google Scholar] [CrossRef]
- Feng, X.; Ren, D.; He, X.; Ouyang, M. Mitigating Thermal Runaway of Lithium-Ion Batteries. Joule 2020, 4, 743–770. [Google Scholar] [CrossRef]
- Bandhauer, T.M.; Garimella, S.; Fuller, T.F. A Critical Review of Thermal Issues in Lithium-Ion Batteries. J. Electrochem. Soc. 2011, 158, R1. [Google Scholar] [CrossRef]
- Rao, Z.; Wang, S. A review of power battery thermal energy management. Renew. Sustain. Energy Rev. 2011, 15, 4554–4571. [Google Scholar] [CrossRef]
- Thakur, A.K.; Prabakaran, R.; Elkadeem, M.R.; Sharshir, S.W.; Arıcı, M.; Wang, C.; Zhao, W.; Hwang, J.Y.; Saidur, R. A state of art review and future viewpoint on advance cooling techniques for Lithium–ion battery system of electric vehicles. J. Energy Storage 2020, 32, 101771. [Google Scholar] [CrossRef]
- Madani, S.; Schaltz, E.; Knudsen Kær, S. An Electrical Equivalent Circuit Model of a Lithium Titanate Oxide Battery. Batteries 2019, 5, 31. [Google Scholar] [CrossRef] [Green Version]
- Zhang, S.S. A review on the separators of liquid electrolyte Li-ion batteries. J. Power Sources 2007, 164, 351–364. [Google Scholar] [CrossRef]
- Hu, X.; Zhang, K.; Liu, K.; Lin, X.; Dey, S.; Onori, S. Advanced Fault Diagnosis for Lithium-Ion Battery Systems: A Review of Fault Mechanisms, Fault Features, and Diagnosis Procedures. IEEE Ind. Electron. Mag. 2020, 14, 65–91. [Google Scholar] [CrossRef]
- Chen, Z.; Xu, K.; Wei, J.; Dong, G. Voltage fault detection for lithium-ion battery pack using local outlier factor. Measurement 2019, 146, 544–556. [Google Scholar] [CrossRef]
- Yao, L.; Xiao, Y.; Gong, X.; Hou, J.; Chen, X. A novel intelligent method for fault diagnosis of electric vehicle battery system based on wavelet neural network. J. Power Sources 2020, 453, 227870. [Google Scholar] [CrossRef]
- Chen, Z.; Xiong, R.; Tian, J.; Shang, X.; Lu, J. Model-based fault diagnosis approach on external short circuit of lithium-ion battery used in electric vehicles. Appl. Energy 2016, 184, 365–374. [Google Scholar] [CrossRef]
- Zhu, S.; Han, J.; An, H.Y.; Pan, T.S.; Wei, Y.M.; Song, W.L.; Chen, H.S.; Fang, D. A novel embedded method for in situ measuring internal multi-point temperatures of lithium ion batteries. J. Power Sources 2020, 456, 227981. [Google Scholar] [CrossRef]
- Wang, Z.R.; Yang, Y.; Tong, X. Lithium-Ion Battery Pack Thermal Runaway Automatic Alarming Apparatus Based on Gas Monitoring and Monitoring Method. Chinese Patent 108008083A, 8 May 2018. [Google Scholar]
- Finegan, D.P.; Darcy, E.; Keyser, M.; Tjaden, B.; Heenan, T.M.M.; Jervis, R.; Bailey, J.J.; Malik, R.; Vo, N.T.; Magdysyuk, O.V.; et al. Characterising thermal runaway within lithium-ion cells by inducing and monitoring internal short circuits. Energy Environ. Sci. 2017, 10, 1377–1388. [Google Scholar] [CrossRef] [Green Version]
- Finegan, D.P.; Darst, J.; Walker, W.; Li, Q.; Yang, C.; Jervis, R.; Heenan, T.M.; Hack, J.; Thomas, J.C.; Rack, A.; et al. Modelling and experiments to identify high-risk failure scenarios for testing the safety of lithium-ion cells. J. Power Sources 2019, 417, 29–41. [Google Scholar] [CrossRef]
- Dey, S.; Perez, H.E.; Moura, S.J. Thermal fault diagnostics in Lithium-ion batteries based on a distributed parameter thermal model. In Proceedings of the 2017 American Control Conference (ACC), Seattle, WA, USA, 24–26 May 2017; pp. 68–73. [Google Scholar]
- Hong, J.; Wang, Z.; Liu, P. Big-Data-Based Thermal Runaway Prognosis of Battery Systems for Electric Vehicles. Energies 2017, 10, 919. [Google Scholar] [CrossRef] [Green Version]
- Jiang, L.; Deng, Z.; Tang, X.; Hu, L.; Lin, X.; Hu, X. Data-driven fault diagnosis and thermal runaway warning for battery packs using real-world vehicle data. Energy 2021, 234, 1–11. [Google Scholar] [CrossRef]
- Wang, Z.; Hong, J.; Liu, P.; Zhang, L. Voltage fault diagnosis and prognosis of battery systems based on entropy and Z-score for electric vehicles. Appl. Energy 2017, 196, 289–302. [Google Scholar] [CrossRef]
- Li, X.; Dai, K.; Wang, Z.; Han, W. Lithium-ion batteries fault diagnostic for electric vehicles using sample entropy analysis method. J. Energy Storage 2020, 27, 1–11. [Google Scholar] [CrossRef]
- Liu, P.; Sun, Z.; Wang, Z.; Zhang, J. Entropy-Based Voltage Fault Diagnosis of Battery Systems for Electric Vehicles. Energies 2018, 11, 136. [Google Scholar] [CrossRef] [Green Version]
- Koch, S.; Birke, K.; Kuhn, R. Fast Thermal Runaway Detection for Lithium-Ion Cells in Large Scale Traction Batteries. Batteries 2018, 4, 16. [Google Scholar] [CrossRef] [Green Version]
- Klink, J.; Grabow, J.; Orazov, N.; Benger, R.; Börger, A.; Ahlberg Tidblad, A.; Wenzl, H.; Beck, H.P. Thermal fault detection by changes in electrical behaviour in lithium-ion cells. J. Power Sources 2021, 490, 229572. [Google Scholar] [CrossRef]
- German Institute for Standardization. Electrically Propelled Road Vehicles—Battery Systems—Design Specifications for Lithium-Ion Battery Cells; German Institute for Standardization: Berlin, Germany, 2016. [Google Scholar]
- Kohlberg, M. Safety Element for Battery Cell. US Patent US 10.026.948 B2, 10 March 2014. [Google Scholar]
- Spies, P. Flexible Battery Management System with Active Cell Balancing (FlexBMS): Preliminary, 2015. Available online: https://www.mikroelektronik.fraunhofer.de/content/dam/mikroelektronik/Datenbltter/IIS_Batteriemanagement_DB.pdf (accessed on 17 January 2022).
- UN Global Technical Regulation. Proposal for Amendment 4 to UN GTR No. 4 (WHDC), Genf, CH, 2021. Available online: https://unece.org/sites/default/files/2021-06/ECE_TRANS_WP.29_2021_79E.pdf (accessed on 8 February 2022).
- Ruiz, V.; Pfrang, A.; Kriston, A.; Omar, N.; van den Bossche, P.; Boon-Brett, L. A review of international abuse testing standards and regulations for lithium ion batteries in electric and hybrid electric vehicles. Renew. Sustain. Energy Rev. 2018, 81, 1427–1452. [Google Scholar] [CrossRef]
- Melcher, A.; Ziebert, C.; Rohde, M.; Seifert, H. Modeling and Simulation of the Thermal Runaway Behavior of Cylindrical Li-Ion Cells—Computing of Critical Parameters. Energies 2016, 9, 292. [Google Scholar] [CrossRef] [Green Version]
- MathWorks. Matlab/Simulink, MathWorks Inc. 2019. Available online: https://de.mathworks.com/products/new_products/release2019a.html (accessed on 8 February 2022).
- Zhang, H.; Chow, M.Y. Comprehensive dynamic battery modeling for PHEV applications. In Proceedings of the IEEE PES General Meeting, Minneapolis, MN, USA, 25–29 July 2010; pp. 1–6. [Google Scholar] [CrossRef]
- Roscher, M.A.; Sauer, D.U. Dynamic electric behavior and open-circuit-voltage modeling of LiFePO4-based lithium ion secondary batteries. J. Power Sources 2011, 196, 331–336. [Google Scholar] [CrossRef]
- Qin, P.; Sun, J.; Wang, Q. A new method to explore thermal and venting behavior of lithium-ion battery thermal runaway. J. Power Sources 2021, 486, 229357. [Google Scholar] [CrossRef]
- Dey, S.; Perez, H.E.; Moura, S.J. Model-Based Battery Thermal Fault Diagnostics: Algorithms, Analysis, and Experiments. IEEE Trans. Control. Syst. Technol. 2019, 27, 576–587. [Google Scholar] [CrossRef]
- Tran, M.K.; Fowler, M. A Review of Lithium-Ion Battery Fault Diagnostic Algorithms: Current Progress and Future Challenges. Algorithms 2020, 13, 62. [Google Scholar] [CrossRef] [Green Version]
- Challa, V. How to Prevent Li-Ion Battery Failures, Beltsville, MD, 2018. Available online: https://www.dfrsolutions.com/hubfs/2018%20DfR%20Conference%20Presentations/Tutorial%204How%20to%20Qualify%20Your%20Batteries%20to%20Prevent%20Failures%20and%20Thermal%20Events.pdf (accessed on 4 January 2020).
- Chen, Y.; Kang, Y.; Zhao, Y.; Wang, L.; Liu, J.; Li, Y.; Liang, Z.; He, X.; Li, X.; Tavajohi, N.; et al. A review of lithium-ion battery safety concerns: The issues, strategies, and testing standards. J. Energy Chem. 2021, 59, 83–99. [Google Scholar] [CrossRef]
- Feng, X.; Ouyang, M.; Liu, X.; Lu, L.; Xia, Y.; He, X. Thermal runaway mechanism of lithium ion battery for electric vehicles: A review. Energy Storage Mater. 2018, 10, 246–267. [Google Scholar] [CrossRef]
- Zhang, M.; Liu, L.; Stefanopoulou, A.G.; Siegel, J.; Lu, L.; He, X.; Ouyang, M. Fusing Phenomenon of Lithium-Ion Battery Internal Short Circuit. J. Electrochem. Soc. 2017, 164, A2738–A2745. [Google Scholar] [CrossRef] [Green Version]
- Liu, B.; Jia, Y.; Yuan, C.; Wang, L.; Gao, X.; Yin, S.; Xu, J. Safety issues and mechanisms of lithium-ion battery cell upon mechanical abusive loading: A review. Energy Storage Mater. 2020, 24, 85–112. [Google Scholar] [CrossRef]
- Liu, L.; Feng, X.; Zhang, M.; Lu, L.; Han, X.; He, X.; Ouyang, M. Comparative study on substitute triggering approaches for internal short circuit in lithium-ion batteries. Appl. Energy 2020, 259. [Google Scholar] [CrossRef]
- Essl, C.; Seifert, L.; Rabe, M.; Fuchs, A. Early Detection of Failing Automotive Batteries Using Gas Sensors. Batteries 2021, 7, 25. [Google Scholar] [CrossRef]
- Liao, Z.; Zhang, S.; Li, K.; Zhang, G.; Habetler, T.G. A survey of methods for monitoring and detecting thermal runaway of lithium-ion batteries. J. Power Sources 2019, 436, 226879. [Google Scholar] [CrossRef]
- Popp, H.; Koller, M.; Jahn, M.; Bergmann, A. Mechanical methods for state determination of Lithium-Ion secondary batteries: A review. J. Energy Storage 2020, 32, 101859. [Google Scholar] [CrossRef]
- Alavi, S.M.M.; Fekriasl, S.; Niyakan, S.N.; Saif, M. Fault detection and isolation in batteries power electronics and chargers. J. Energy Storage 2019, 25, 100807. [Google Scholar] [CrossRef]
- Feng, X.; Weng, C.; Ouyang, M.; Sun, J. Online internal short circuit detection for a large format lithium ion battery. Appl. Energy 2016, 161, 168–180. [Google Scholar] [CrossRef] [Green Version]
- Kang, Y.; Duan, B.; Zhou, Z.; Shang, Y.; Zhang, C. A multi-fault diagnostic method based on an interleaved voltage measurement topology for series connected battery packs. J. Power Sources 2019, 417, 132–144. [Google Scholar] [CrossRef]
- Cheng, Z.; Walid, A.; Quang, D.; Pedro, A.; James, M. Online estimation of battery equivalent circuit model parameters and state of charge using decoupled least squares technique. Energy 2018, 142, 678–688. [Google Scholar] [CrossRef]

| Process Variable | Dependency of Thermal Runaway Processes | Other Dependencies |
|---|---|---|
| Gases | After cell rupture: Electrolyte vaporisation and gas producing reactions (see internal pressure) Gas released approx. 0.9 L/Ah–3.5 L/Ah [25] at 25 °C, 1 bar | Pre-cell rupture: Electrolyte leakage [26] SOC and chemistry [27] Ageing (at different conditions) [28] Atmosphere and oxygen availability [29] Type of trigger [30] |
| Impedance | Increasing temperature by exothermic reactions cause decreasing impedance and change of phase [31]; inverse behaviour for high temperatures [32] Safety Device Shutdown-separator cause of 1300% [33] usually at 120 °C to 150 °C [34] | SOC [31,35] Temperature of operation Cyclic Ageing [36,37] Calendrical Ageing [7] |
| Internal pressure/strain | Thermal expansion Electrolyte evaporation and gas producing reactions[38]: – by SEI decomposition [39] at 90 °C to 120 °C [40] – by SEI-reformation [41] at 120 °C to 218 °C [34] Safety device: burst-disc rupture approx. at 10 bar to 12 bar for prismatic cells [42]; deviation with 18650 cells [43] | SOC and load [44,45] Ambient pressure [46] Temperature of operation Gas formation during ageing [7] |
| Smoke/particles | After cell rupture: Vaporisation (White smoke [47]) and combustion of cell components (Black smoke) [38]. Ejection of internal cell components (Black smoke) [15,47] | Ambient atmosphere |
| Temperature | Increasing internal temperature due to exothermic reactions | Load [48] and cooling situation [49,50] Temperature of operation |
| Voltage | Increasing temperature as [51] Melting of separator: – PE = 120 °C to 135 °C, PP = 150 °C to 166 °C [34,40,52] Safety Device: CID, OSD, Shutdown-separator 120 °C to 150 °C [34] | SOC Over-voltages during load |
| Quantity | Sensor/ Logger | Sample Rate | Location |
|---|---|---|---|
| Voltage | Gantner Q.station XB | 10 | Cell-level |
| CMC | 10 | Cell-level | |
| EA Power Supply PSI 10000 | 10 | Module-level | |
| Current | Fluke i400s, Gantner Q.station XB | 10 | Module-level |
| EA Power Supply PSI 10000 | 10 | Module-level | |
| Temperature | CMC | 10 | |
| Pico TC-08 | 1 | 12× cell-level | |
| 1× heating device | |||
| 2× ambient battery case | |||
| 1× inlet and outlet of cooling fluid | |||
| Vapour/particles | MaximIntegrated MAX30101 | ≈4 | System case |
| Gases | Sensirion SGP40 | ≈1 | System case |
| Dräger X-am 8000 | 1 | System environment | |
| Pressure | RS Pro IPS (7975043) | 5 | System case |
| Strain | Micro-Measurement 500UW | 1.25 | Module-level |
| A | B | C | D | |
|---|---|---|---|---|
| Heating rate | 5 K min−1 | 5 K min−1 | 8 K min−1 | 8 K min−1 |
| A | B | C | D | ||
|---|---|---|---|---|---|
| ① | t | s | s | s | s |
| °C | °C | °C | °C | ||
| °C | °C | °C | °C | ||
| °C | °C | °C | °C | ||
| °C | °C | °C | °C | ||
| ② | t | s | s | s | s |
| °C | °C | °C | °C | ||
| °C | °C | °C | °C | ||
| °C | °C | °C | °C | ||
| °C | °C | °C | °C | ||
| ③ | t | s | s | s | s |
| °C | °C | °C | °C | ||
| °C | °C | °C | °C | ||
| °C | °C | °C | °C | ||
| °C | °C | °C | °C | ||
| ④ | t | s | s | s | s |
| °C | °C | °C | °C | ||
| °C | °C | °C | °C | ||
| °C | °C | °C | °C | ||
| °C | °C | °C | °C |
| A | B | C | D | |
|---|---|---|---|---|
| 255.16 μm m−1 | 215.91 μm m−1 | 259.33 μm m−1 | 66.85 μm m−1 |
| Index | Quantity | Evaluation |
|---|---|---|
| I | Voltage | |
| II | Voltage | Model residuum (see Section 2.2.2) |
| III | Gas | |
| IV | Smoke | |
| V | Pressure | bar |
| Method | Certainty | Localisation | Monitoring | Complexity | Integration | Scalabilty | Transferability | |
|---|---|---|---|---|---|---|---|---|
| Voltage threshold | - | + | + | + | + | + | o | o |
| Model-based | + | +/- | + | + | - | + | + | + |
| Cell temperature 1 | + | - | - | + | - | + | - | + |
| Strain 2 | +/o | o | o | o | + | o/- | o/- | + |
| Gas | o | + | o | - | + | o | + | + |
| Smoke | o | + | o | - | + | o | + | + |
| Pressure | - | + | - | - | o | - | + | + |
Publisher’s Note: MDPI stays neutral with regard to jurisdictional claims in published maps and institutional affiliations. |
© 2022 by the authors. Licensee MDPI, Basel, Switzerland. This article is an open access article distributed under the terms and conditions of the Creative Commons Attribution (CC BY) license (https://creativecommons.org/licenses/by/4.0/).
Share and Cite
Klink, J.; Hebenbrock, A.; Grabow, J.; Orazov, N.; Nylén, U.; Benger, R.; Beck, H.-P. Comparison of Model-Based and Sensor-Based Detection of Thermal Runaway in Li-Ion Battery Modules for Automotive Application. Batteries 2022, 8, 34. https://doi.org/10.3390/batteries8040034
Klink J, Hebenbrock A, Grabow J, Orazov N, Nylén U, Benger R, Beck H-P. Comparison of Model-Based and Sensor-Based Detection of Thermal Runaway in Li-Ion Battery Modules for Automotive Application. Batteries. 2022; 8(4):34. https://doi.org/10.3390/batteries8040034
Chicago/Turabian StyleKlink, Jacob, André Hebenbrock, Jens Grabow, Nury Orazov, Ulf Nylén, Ralf Benger, and Hans-Peter Beck. 2022. "Comparison of Model-Based and Sensor-Based Detection of Thermal Runaway in Li-Ion Battery Modules for Automotive Application" Batteries 8, no. 4: 34. https://doi.org/10.3390/batteries8040034
APA StyleKlink, J., Hebenbrock, A., Grabow, J., Orazov, N., Nylén, U., Benger, R., & Beck, H.-P. (2022). Comparison of Model-Based and Sensor-Based Detection of Thermal Runaway in Li-Ion Battery Modules for Automotive Application. Batteries, 8(4), 34. https://doi.org/10.3390/batteries8040034