Article

Method for In-Operando Contamination of Lithium Ion Batteries for Prediction of Impurity-Induced Non-Obvious Cell Damage

Vehicle Safety Institute, Graz University of Technology, Inffeldgasse 23/1, 8010 Graz, Austria
*
Author to whom correspondence should be addressed.
Batteries 2022, 8(4), 35; https://doi.org/10.3390/batteries8040035
Submission received: 2 March 2022 / Revised: 7 April 2022 / Accepted: 11 April 2022 / Published: 14 April 2022
(This article belongs to the Special Issue Lithium-Ion Batteries Aging Mechanisms, 2nd Edition)

Abstract

:
The safety of lithium-ion batteries within electrified vehicles plays an important role. Hazards can arise from contaminated batteries resulting from non-obvious damages or insufficient production processes. A systematic examination requires experimental methods to provoke a defined contamination. Two prerequisites were required: First, the extent and type of contamination should be determinable to exclude randomness. Second, specimens should work properly before the contamination, enabling realistic behavior. In this study, two experimental methods were developed to allow for the first time a controlled and reproducible application of water or oxygen into 11 single-layer full cells (Li4Ti5O12/LiCoO2) used as specimens during electrical cycling. Electrochemical impedance spectroscopy was used to continuously monitor the specimens and to fit the parameters of an equivalent circuit model (ECM). For the first time, these parameters were used to calibrate a machine-learning algorithm which was able to predict the contamination state. A decision tree was calibrated with the ECM parameters of eight specimens (training data) and was validated by predicting the contamination state of the three remaining specimens (test data). The prediction quality proved the usability of classification algorithms to monitor for contaminations or non-obvious battery damage after manufacturing and during use. It can be an integral part of battery management systems that increases vehicle safety.

1. Introduction

As we face the challenges of global warming, a significant reduction in greenhouse gas emissions will be an necessary step. Power train electrification is one way to lower the carbon intensity of transportation [1]. Lithium-ion (Li-Ion) batteries are widely used for power train electrification due to their advantageous characteristics compared to other battery technologies (i.e., high energy and power density [2,3]). The increased application of Li-Ion technology as storage for vehicle propulsion energy is bringing battery safety into focus [4,5,6,7] as it comes with a number of downsides. Damage to a Li-Ion battery may lead to severe reactions (i.e., smoke, fire, explosion) [8]. The causes and failure mechanisms for this [9,10,11,12], together with the consequences of battery damage [12,13,14,15,16,17,18,19,20,21,22,23] have been extensively discussed in the literature. In addition to other failure causation, adverse processes due to the contamination of the electrode material [24,25] may not be obvious in the first place and can lead to catastrophic reactions such as thermal runaway. Contamination (i.e., water, oxygen) may be introduced to the cell, i.e., during manufacturing due to the insufficient drying of materials [26,27], the aging of the cell housing [25], or due to defects of the cell housing that may result from mechanical loads on the battery. Moisture attributes in the decomposition of organic electrolytes promote further side reactions and degradation and have been investigated by several authors [26,27,28,29,30,31,32]. Different studies have revealed that moisture has a negative impact on battery performance and lifetime [27,33,34,35,36]. Furthermore, oxygen can affect battery performance as degradation reactions occur with the electrolyte and other components [37,38]. The described degradation mechanisms lead to the aging of battery cell components. Subsequently, aging has an impact on the mechanical and crash behavior of a battery cell, which affects the battery cell safety [39]. As the described degradation mechanisms can be safety-relevant, a determination of the contamination state in advance is of interest. For research purposes, a systematic examination must be enabled in the form of an intentional and reproducible contamination. A contamination must be repeatedly applied in adjustable quantities and should not affect the battery cell during normal operation prior to contamination. Methods to provoke, monitor and examine damage, i.e., the internal short circuit (ISC) of lithium ion cells, have been presented in the literature [40,41,42]. ISCs were intentionally produced by the manipulation of battery cells during production, i.e., an ISC trigger by means of implanted phase change materials [43,44,45], perforated separator [46,47], or shape memory alloys [48]. Battery cells were contaminated with metal particles during production to provoke ISC by dendrite growth promotion [40,49]. Volck et al. [50] and Santhanagopalan et al. [51] triggered an ISC by applying an external load on a battery cell manipulated with metal particles (i.e., copper or nickel). A main drawback of the mentioned methods which introduce particles is that cell contamination is already present at specimen assembly. The proper principal functionality of the specimen cannot be guaranteed by this. Contamination by battery cell damage will occur during usage. An experimental method should therefore guarantee a trigger during electric cycling without affecting the electrochemical behavior of the battery cell. A method meeting this requirement for in operando contamination with water and oxygen has not been reported in the literature to date. In different studies, measurements were performed to monitor battery cell parameters. Electrochemical impedance spectroscopy (EIS) is a common tool to measure the electrical properties of battery cells, i.e., the state of charge (SOC), state of health (SOH) or fault detection [52,53,54]. EIS can be used to fit equivalent circuit models (ECMs) which represent the electrochemical behavior of the cell. Different frequency ranges of the measured impedance are attributed to specific circuit elements and chemical processes. The measured battery cell impedance and derived equivalent circuit elements can be processed by machine-learning (ML) algorithms. In the literature, ML has been used to estimate, predict and monitor different battery parameters [55,56,57,58,59,60], i.e., for SOC estimation, SOH estimation, fault diagnostic and ISC detection.
In this paper, a non-destructive method is presented to determine whether a cell is affected by the contamination of the electrode material. As no experimental method fulfilling the requirements (reproducibility, adjustable contaminant quantity, minor effect on electrochemical properties) was found in the literature, we present novel experimental methods for the reproducible application of contaminants (i.e., water, oxygen) during electrochemical cycling. Machine-learning algorithms (i.e., decision tree) were used in the literature to recognize battery degradation. However, the evaluation of a contamination state as such has never previously been conducted with the help of machine-learning algorithms and will be shown within this manuscript. Therefore, two research questions will be answered within this manuscript:
  • How can contamination be intentionally introduced and reproducible in a battery cell without affecting its electrochemical behavior beforehand?
  • How can a water or oxygen contamination of a battery cell be predicted?
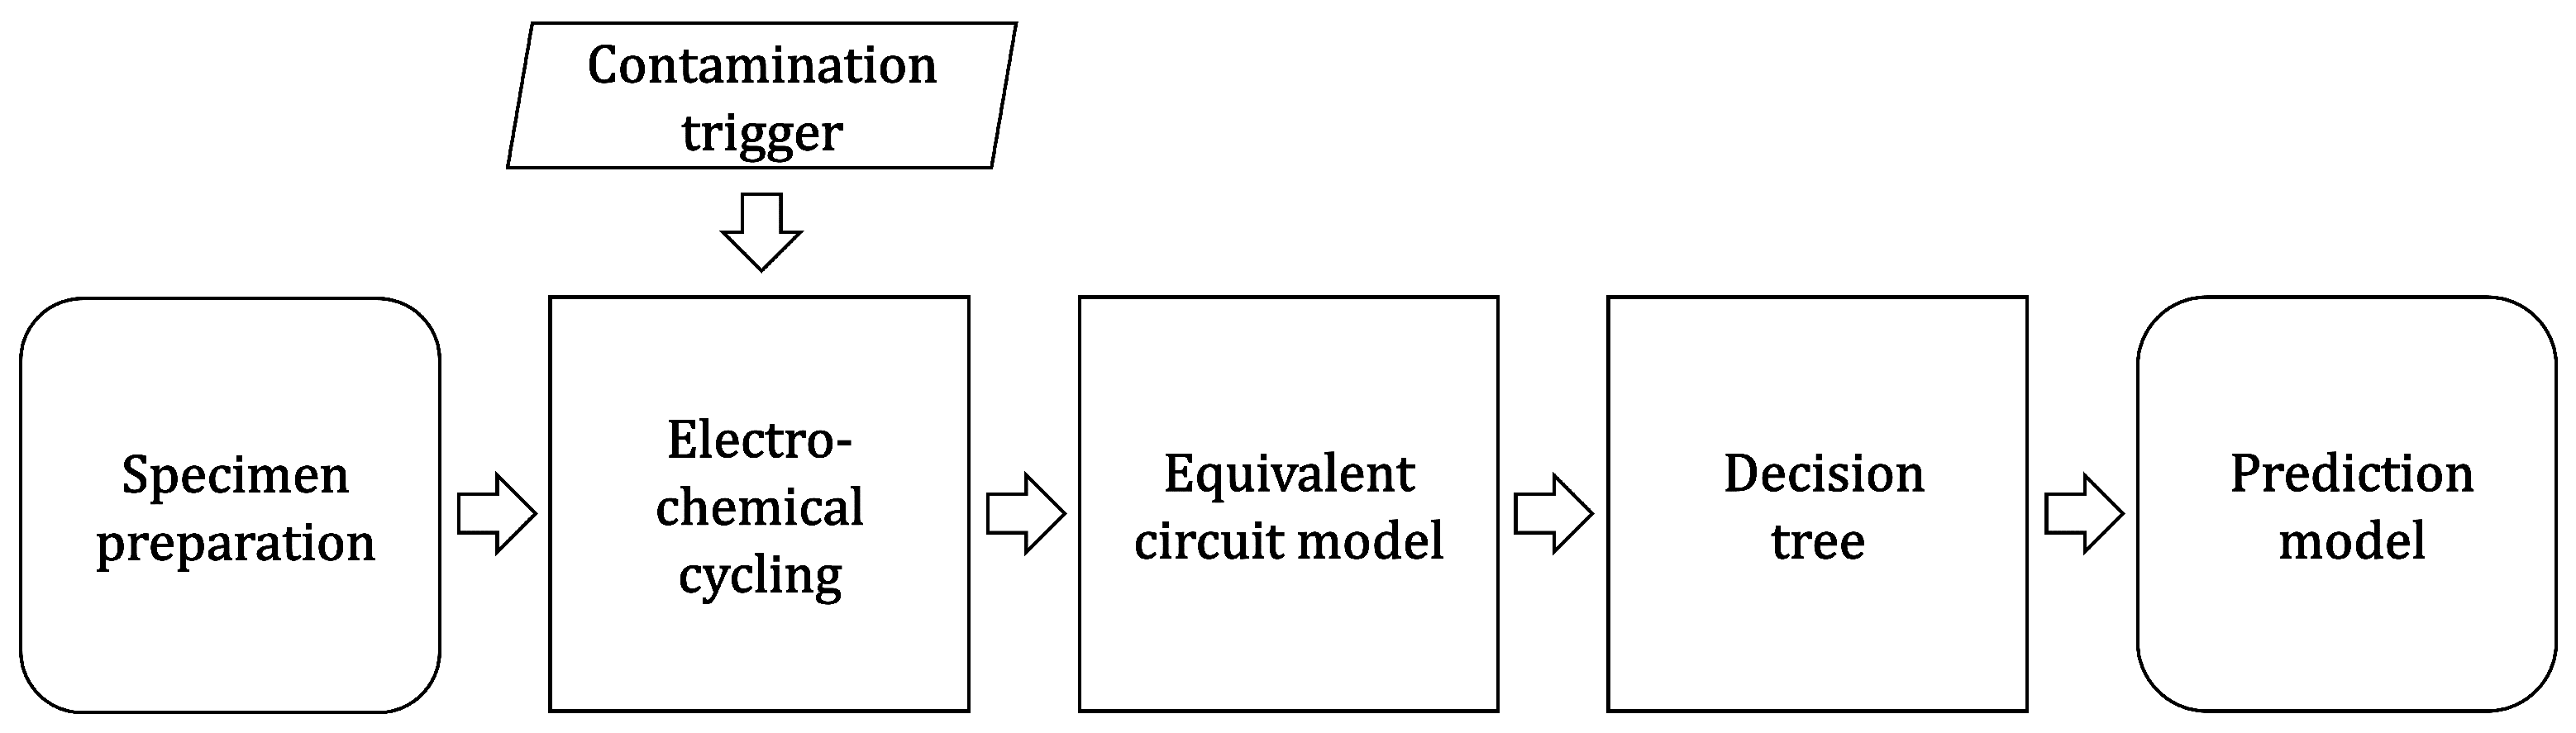
2. Method

The effects of different types of contamination (water and oxygen) were examined in a series of novel experiments. Eleven single-layer full battery cells were built and equipped with a contamination trigger. During electrochemical cycling, contamination in the form of water or oxygen was introduced into the specimens. EIS was conducted to evaluate the impedance of the specimen. Additionally, voltage, transferred charge and Coulombic efficiency was continuously tracked. A set of specimens without contamination was subjected to the same procedure as a reference. Parameters for an ECM were derived from the measurement data. These parameters were used to calibrate a decision tree algorithm able to predict the contamination state of the specimen. The eligibility of the decision tree algorithm to predict specimen contamination and to distinguish between different types of contamination was proofed by a set of validation data. Figure 1 illustrates the approach and was described in detail hereafter.

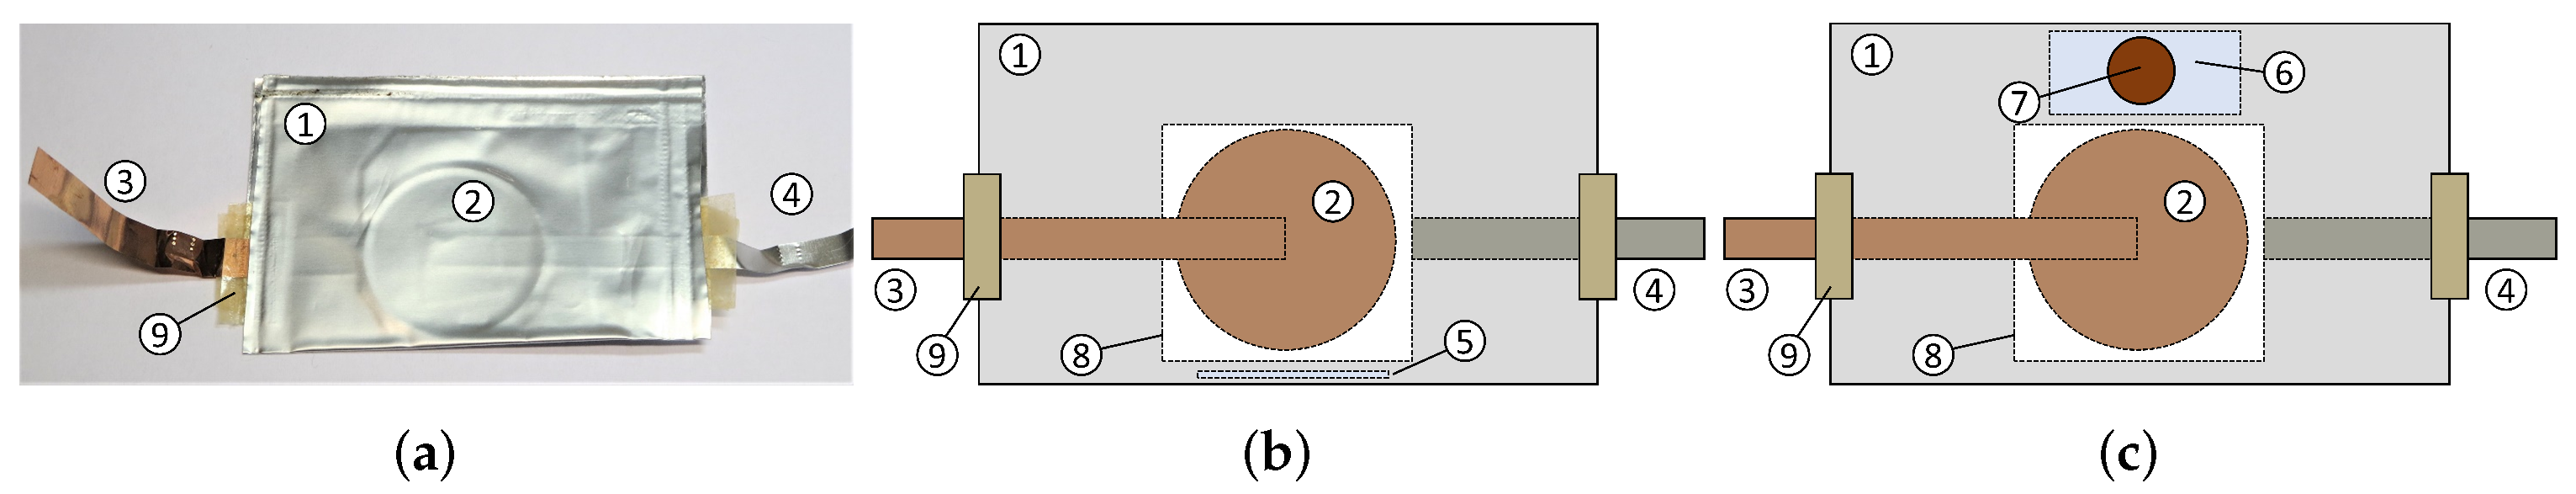
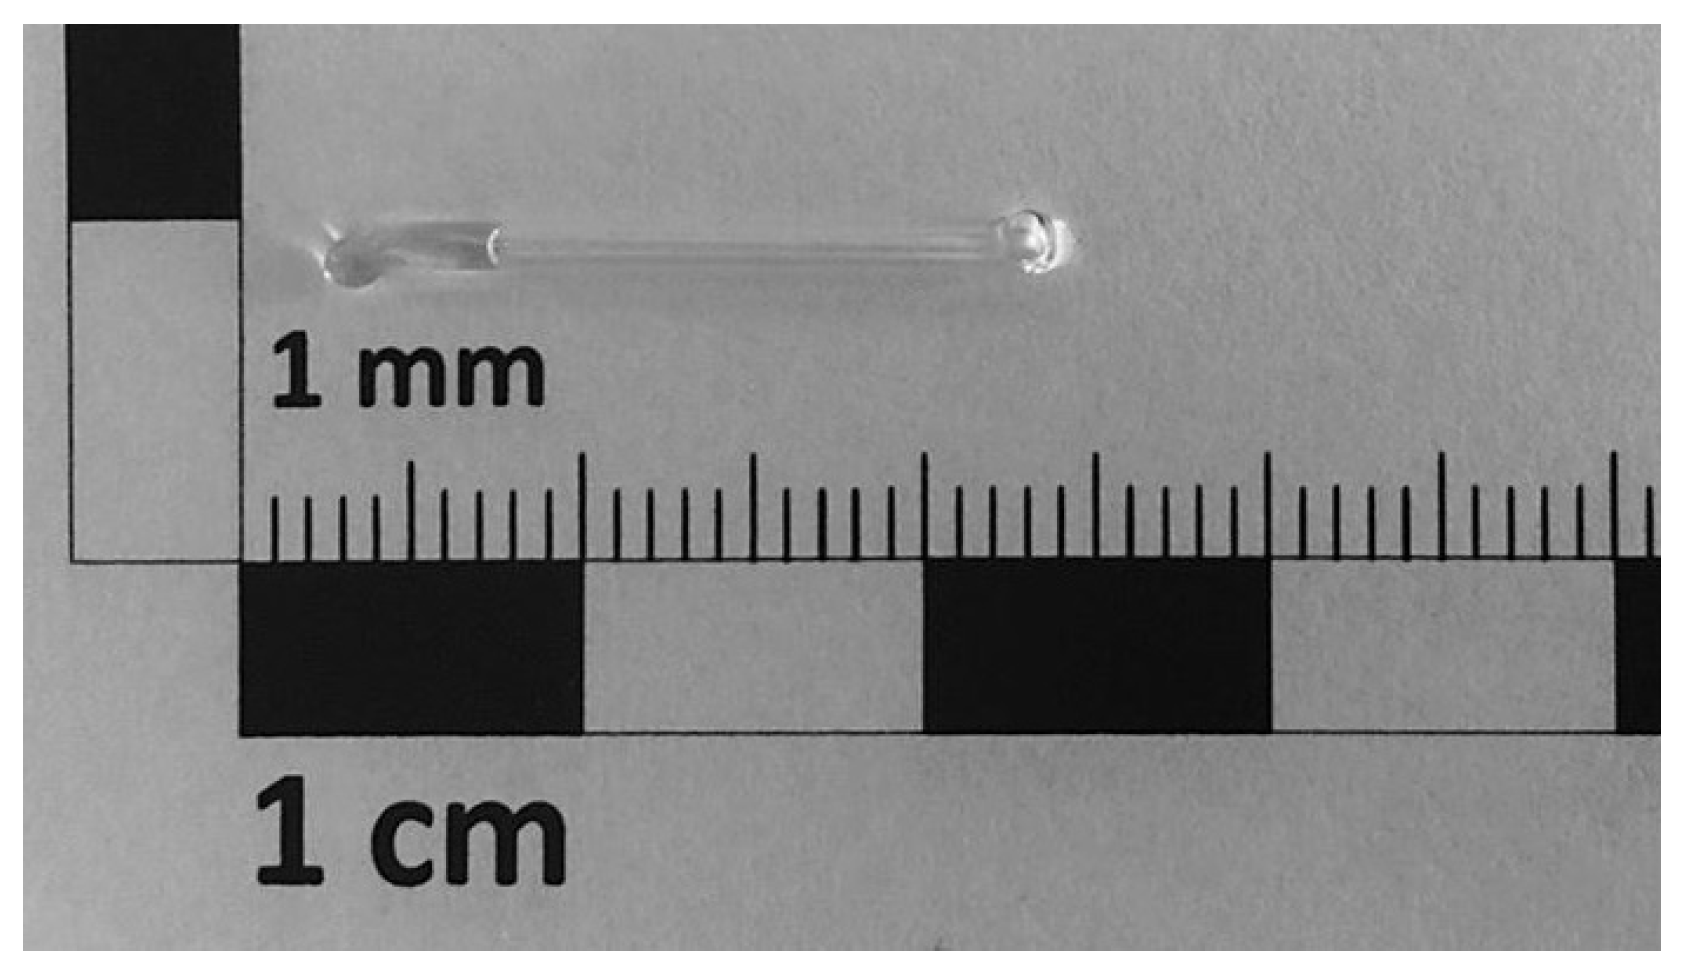
2.1. Specimen Preparation

Eleven single-layer full battery cells were manually produced to implement a contamination trigger into the battery cells. Lithium titanate oxide Li4Ti5O12 (LTO) was chosen for the negative active material. Lithium–cobalt(III)–oxide LiCoO2 (LCO) was chosen for the positive active material. The LTO showed negligible cycle aging [61,62]. At 1.55 V vs. Li + /Li the LTO operating potential is well within the electrochemical stability window of the electrolyte. Consequently, no solid electrolyte interphase (SEI) forms at the LTO electrode and the cell operates within the thermodynamically stable domain. By ruling out the aging effects caused by electrochemical cycling, changes in the electrochemical behavior were explicitly correlated with the effects from contamination (i.e., the degradation of active materials).
Conductive carbon black (TIMCAL SUPER C65) was added to the active material slurry for both electrodes as a conductive additive. An electrode binder (Arkema Kynar® 2801) was used to dissolute active material components. N-Methyl-2-pyrrolidone (NMP) was used as a solvent for electrode preparation. The ratio of 1:1 and 1:3 between the solid electrode components (active material, conductive carbon black and electrode binder) and the NMP was used for the cathode and anode, respectively. A ball mill homogenized the slurry components. The anode slurry was mixed with 3 zirconium dioxide (ZrO2) balls. The mixing procedure consisted of 3 repetitions over a period of 5 min at a speed of 300 min−1 and a break of 5 min between the repetitions. The cathode slurry was mixed with 3 ZrO2 balls. The cathode slurry was milled with three repetitions each 15 min at a speed of 300 min−1 and a 5 min break between the repetitions.
The active material of the cathode was applied on an aluminum foil with a layer thickness of 50 μ m . The active material of the anode was applied on a copper foil with a layer thickness of 200 μ m . The capacity was limited by the cathode to avoid lithium plating by balancing the electrode masses, accordingly. The coated foils were dried for 12 h at 100 °C in a drying oven. Discs of 28 mm in diameter were punched out of the electrode material. Table 1 lists the contents and layer thickness of the active materials used in this study.
The specimens were assembled in an inert argon atmosphere. All components were first dried to avoid prior moisture contamination. To establish a robust external electrical contact, copper or aluminum stripes were fixed on the electrodes with adhesive tape. A separator (Freudenberg 2226) with a thickness of 0.18 mm and a pore volume of 68% was drenched with 120 μ L of electrolyte (1 mol LiPF6 in EC/DMC 1:1 wt.%) (BASF SelectiLyte™LP30). The separator was placed between the positive and negative electrodes. A pouch foil with 100 μ m thickness was wrapped around the electrode stack and welded. A hot melt adhesive guaranteed proper tightness in the tab area. Outside the inert atmosphere, the pouch was welded a second time with a vacuum welding machine to guarantee an airtight assembly. Figure 2a shows an assembled and sealed specimen.

2.2. Contamination Trigger

Some specimens were modified to investigate the different contamination triggers as a means of finding novel in operando trigger methods for water or oxygen contamination. A contamination trigger method should provide a repeatable application of different quantities of contaminant with only a minor effect on the battery cell during normal operation.
The precise application of water contamination was realized by applying the desired water quantity to a glass container, as can be seen in Figure 3. A glass container with an open-end was filled with 2 μ L of water by a high-precision syringe. The glass container was closed by melting the open end by locally heating with a punctual flame. The glass container was placed within the specimen before welding the pouch foil. During the experiment, contamination with water was triggered by breaking the glass container. The principal assembly of the specimens equipped with a glass container for contamination with water can be taken from Figure 2b.
The precise application of contamination with oxygen was realized by external application using a syringe. A ZrO2 plate was placed inside the specimen next to the electrode stack before the pouch foil was welded. A self-healing injection port (i.e., septum) was glued on the pouch foil in the area of the ceramic plate. By inserting the cannula of the syringe, high-purity oxygen (99.999%) was injected into the cell to trigger contamination. The self-healing injection port prevented further contamination with the environmental atmosphere by closing itself after removing the cannula. The ZrO2 plate prevented the penetration of the pouch foil on the opposite side. The principal assembly of the specimens equipped with the ZrO2 plate and the self-healing injection port for contamination with oxygen can be taken from Figure 2c.
In sum, four specimens (No. 01–04) were used as a reference. Specimens No. 03 and No. 04 were equipped with a ZrO2 plate to investigate its influence on the electrochemical behavior. Four specimens (No. 05–08) were equipped with a glass container for water contamination. Three specimens (No. 09–11) were equipped with a ZrO2 plate and a self-healing injection port for contamination with oxygen, as can be seen in Table 2.

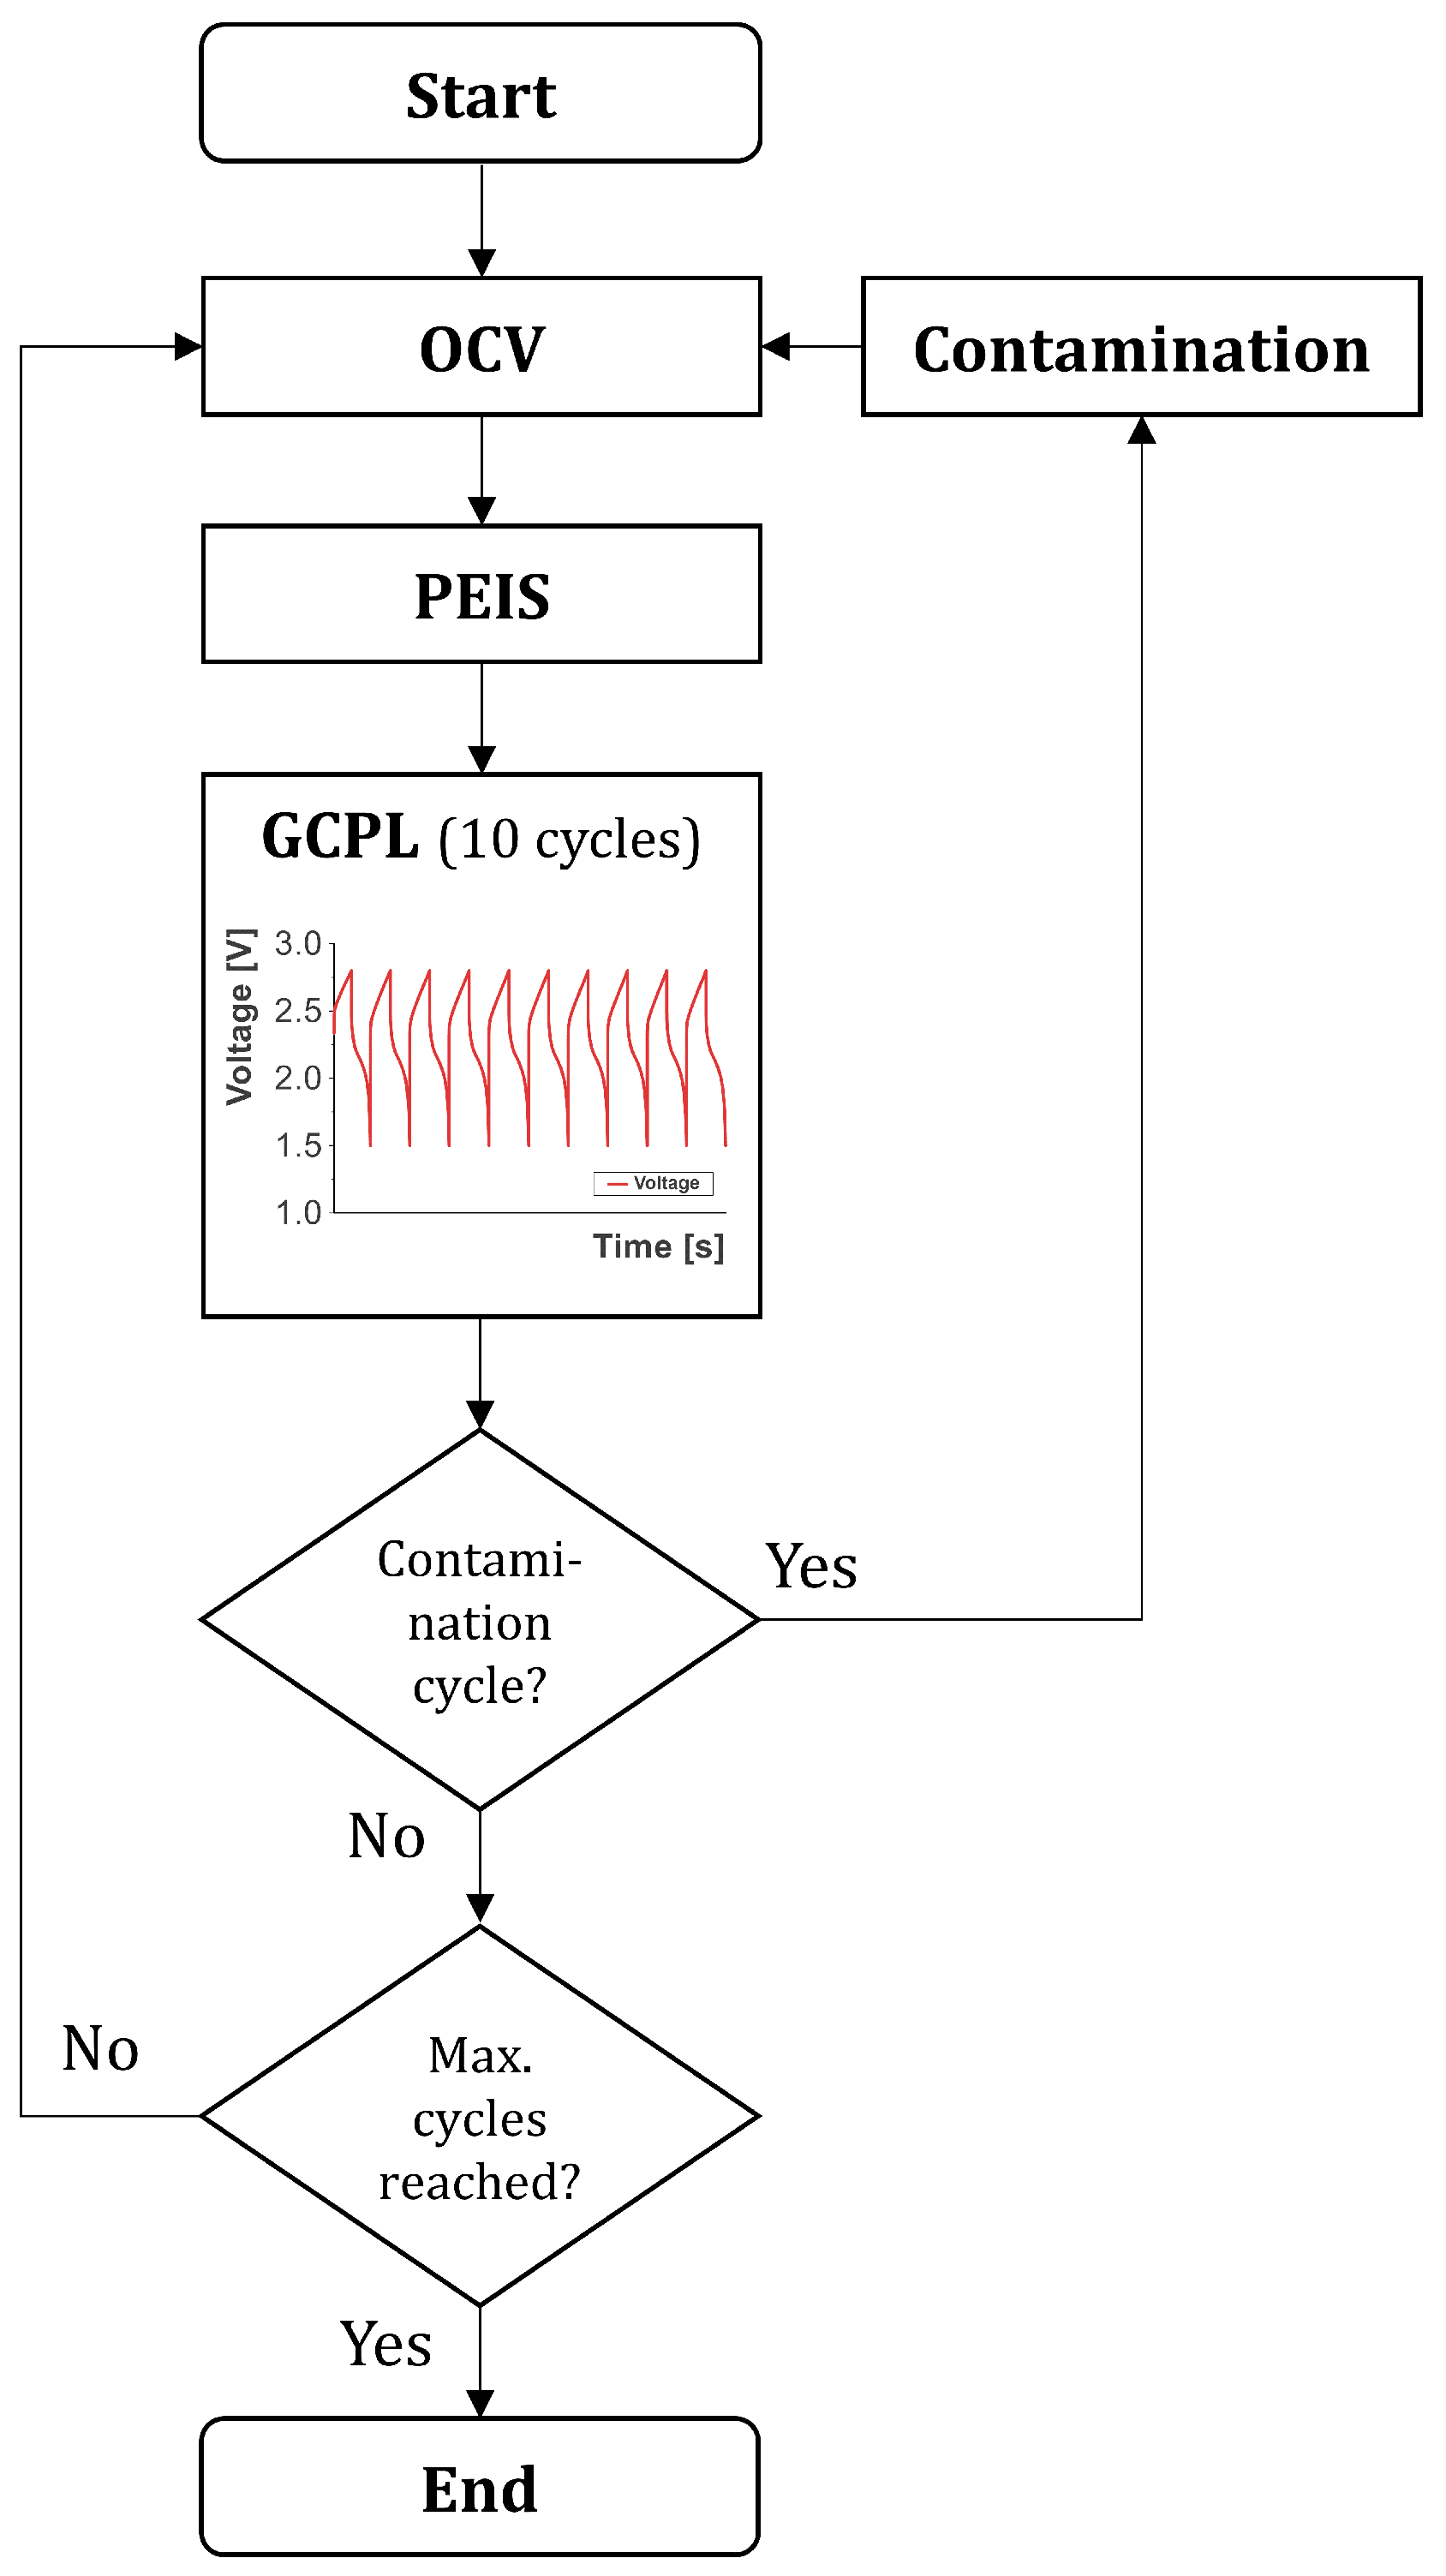
2.3. Electrochemical Cycling

The specimens were electrochemically cycled by a multichannel electrochemical workstation (Biologic VMP3). The test procedure can be taken from Figure 4. At the beginning, the specimens were in an open circuit voltage (OCV) phase for 12 h. Subsequently, potentio electrochemical impedance spectroscopy (PEIS) with 10 points per decade at a logarithmic spacing was performed within a frequency of 10 mHz–2 MHz. A sinusoidal voltage signal with an amplitude of 10 mV represented the excitation. At each frequency, an average of four measurement values was used to obtain the impedance. The impedance measurements were performed in the discharged state (0% SOC) of the specimens. Subsequently, 10 cycles of galvanostatic cycling with potential limitation (GPCL) between 1.5 V and 2.8 V were conducted with a current of 1.0 C. The theoretical capacity of each cell was determined with the electrode masses and was used to estimate the charging current of 1.0 C. The estimated charge and discharge rate of 1.0 C was maintained through all cycles. The measured initial capacity in Table 2 was the cell capacity after the formation procedure (after loop 0). The SOH was determined after each cycle of the GPCL by dividing the current capacity by the capacity after formation (first cycle). The Coulombic efficiency for each cycle of the GPCL was determined by dividing the delithiation capacity by the lithiation capacity of the corresponding cycle. After the GPCL phase, the procedure started anew with the OCV phase and the cycle program ended after a certain number of loops (1 loop included 10 GPCL cycles, as can be seen in Figure 4). Loop 0 was not considered in the following analyses, as cell formation took place here.
The total number of loops (column “loops” in Table 2) for each specimen and the cycle in which contamination was introduced (column “Contamination cycle” in Table 2) were both varied in the experiment.

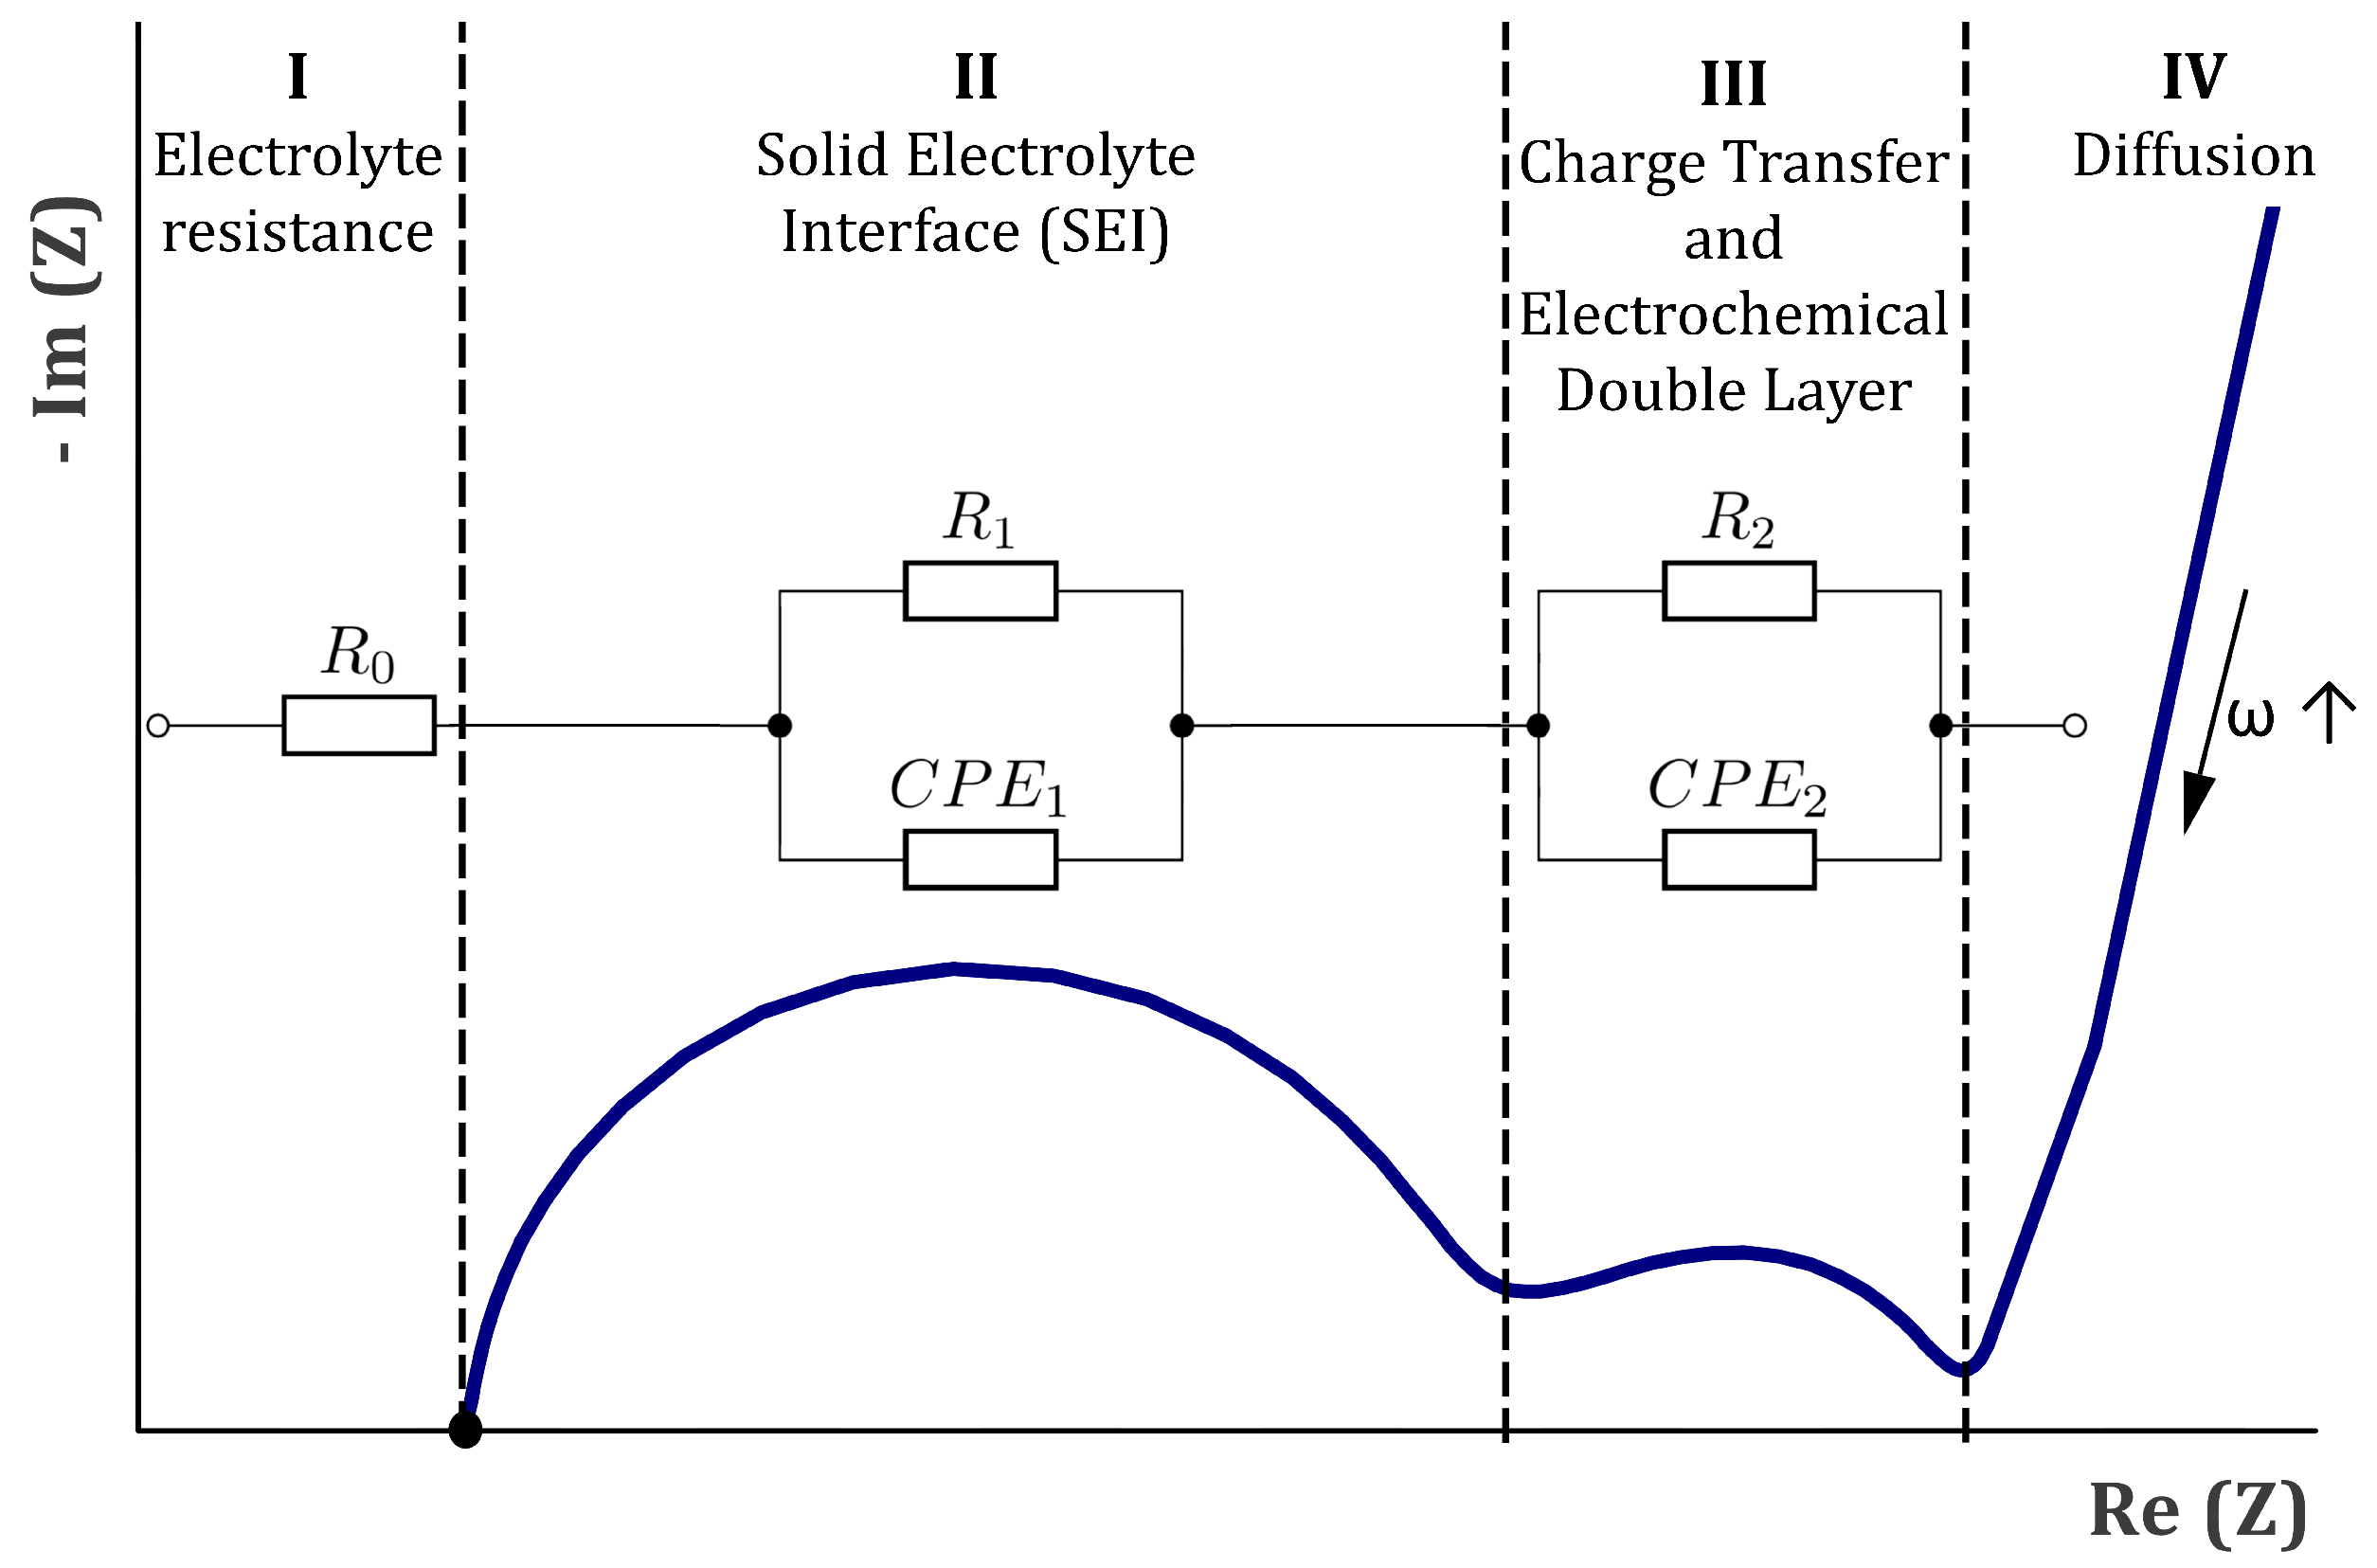
2.4. Equivalent Circuit Model

The electrical behavior of a system (i.e., Li-Ion battery) can be simulated using equivalent-circuit models (ECMs). ECMs represent an electrical network consisting of several resistance, capacitance and inductance phase elements which allow an approximation of the electrochemical behavior of battery cells. Further information on ECMs can be found in the literatures [63,64,65,66,67,68]. The model parameters (i.e., the characteristics of the electrical components) were obtained by calibrating the ECM parameters according to impedance spectra from the measurements. A least square fitting procedure was applied for each specimen and each measurement loop by using the software ZView® [69]. In this study, an ECM consisting of a resistance R 0 and two parallel circuits with a resistance and constant phase element (CPE) ( R 1 , C P E 1 and R 2 , C P E 2 ), were used, as can be seen in Figure 5. Each component in the ECM reproduces a certain area in the corresponding impedance spectrum of a specimen and can be attributed to certain physical phenomena in the specimen. R 0 defined the position of the spectrum on the abscissa and represents the ohmic resistance of the electrolyte (see “I” in Figure 5). The parallel circuits consisting of a resistance and constant phase element were used to model the semicircular segments in the impedance spectrum. The constant phase element represents a non-ideal capacitor and included two parameters, a linear factor T and an exponential factor P [70]:
Z C P E = 1 T ( j ω ) P
with j and ω as the imaginary number and angular frequency, respectively. The first parallel circuit with resistance R 1 and constant phase element C P E 1 was correlated with the solid electrolyte interface (SEI) in the literatures [53,63,68,71,72] (see “II” in Figure 5). The second parallel circuit with resistance R 2 and the constant phase element C P E 2 is correlated with the charge transfer resistance and the double-layer capacity in the literature [53,63,68,71,72] (as can be seen in “III” in Figure 5). Inductive or diffusive behavior of the specimens were not taken into account.

2.5. Decision Tree

The recorded impedance every 10 cycles allowed for an examination of the contamination influence. A classification algorithm was used to predict the effect of contamination on the specimens’ behavior. A decision tree was used as the classifier to identify sensitive ECM parameters and to derive threshold values for the ECM parameters. A decision tree algorithm is favorable as the results are simple to interpret and the performance works well with large data sets. An important characteristic of decision trees is that their depth represents the number of branches split off the tree’s root. The less branches are needed to derive a statement, then the more robust its results are. More branches allow more detailed decisions, but specialization reduces universal validity. To find an optimal balance, the smallest tree, which gives reliable results, is preferable, meaning that the tree depth should be kept as low as possible. To support this decision, the contribution of each element of the tree (i.e., the model input parameter) to the final result is expressed as a “feature importance” (FI) value. To set up a decision tree data structure, a special software package (scitkit-learn for the Python programming language) was used.
The measurement data sets of the eleven specimens were randomly separated into eight cases (specimens No. 01, No. 03, No. 05, No. 06, No. 08–No.11), that were used to train the decision tree classifier and three cases (specimens No. 02, No. 04 and No. 07) which were used to verify the results, as can be seen in Table 2. The values of the ECM elements were normalized by dividing each of them by its respective value at loop 1 as can be seen in Equation (2).
R 1 , n o r m a l i z e d i = R 1 i R 1 1
with i indicating the loop index.
A two-stage approach was chosen to find a prediction model. In the first step, the tree depth for decision making was unlimited in order to find the relevant ECM parameters. The input parameters with the greatest sensitivity were chosen according to the feature importance (FI) obtained by the decision tree. In a second step, ECM parameters allowing a distinction between the types of contamination (i.e., contamination with oxygen or water) were obtained. To unveil the sensitivity of the model parameters for this distinction, the depth of the decision tree was adapted accordingly.

3. Results

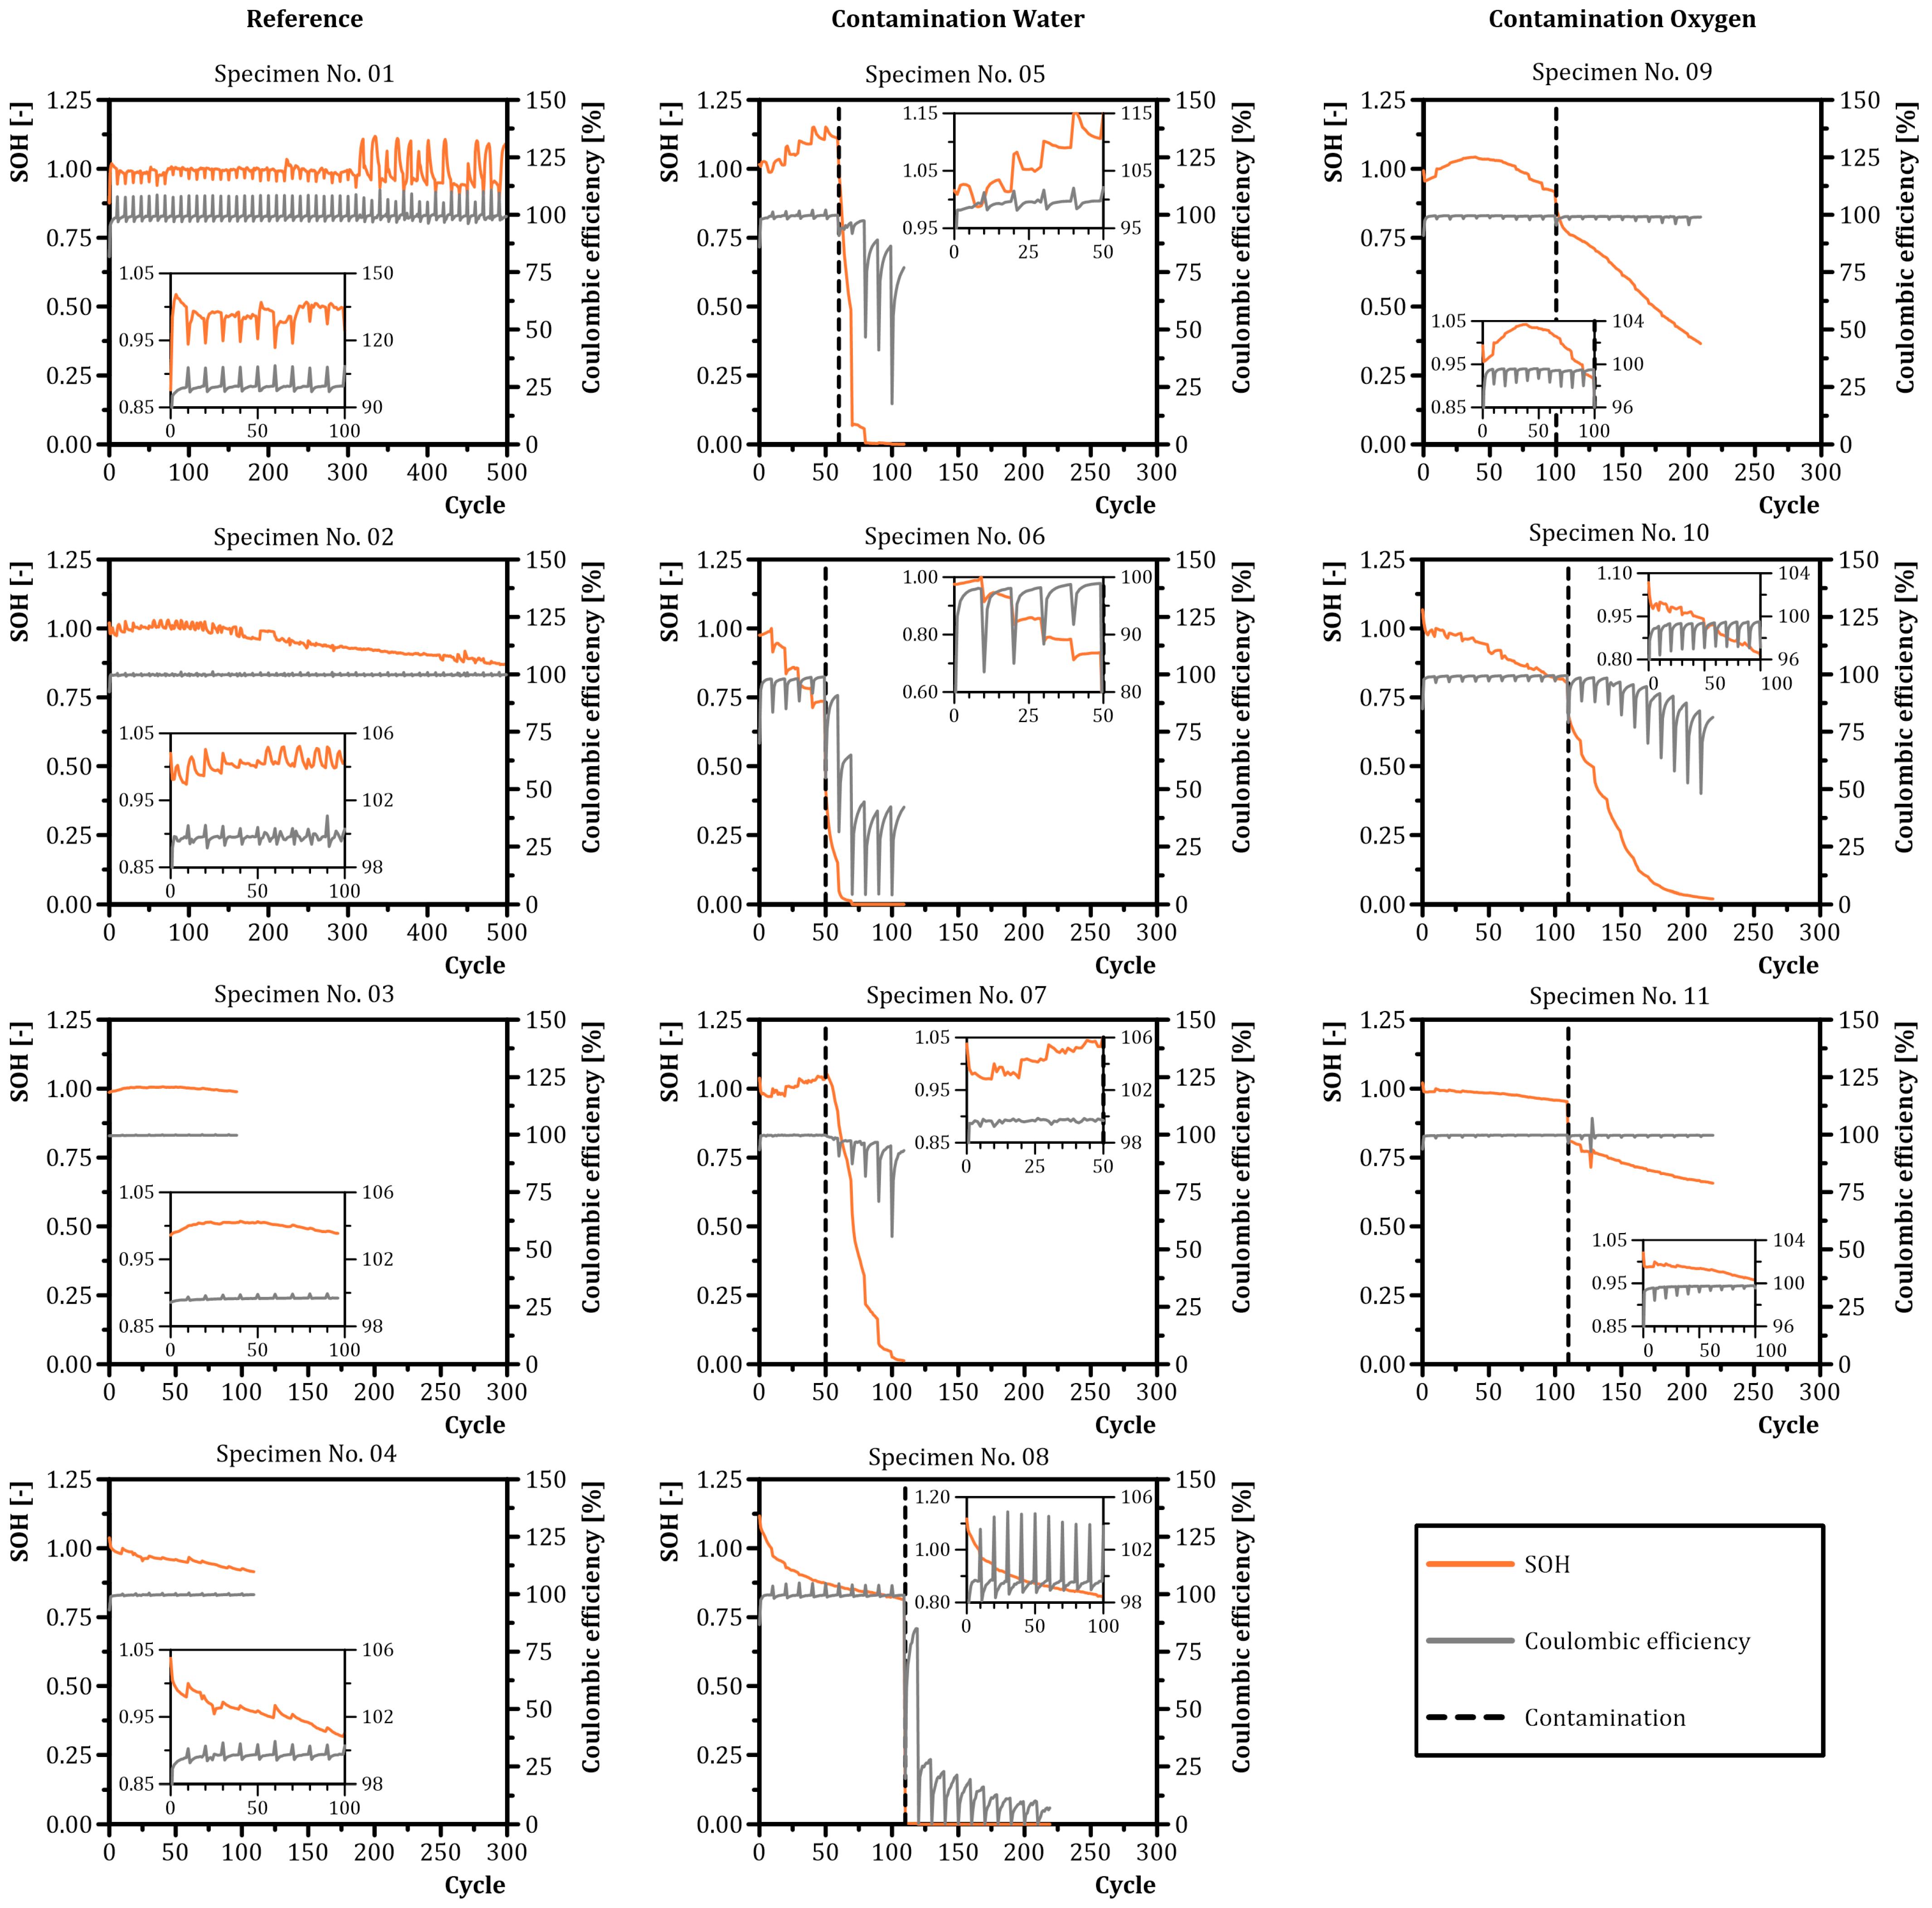
3.1. Electrochemical Cycling

Figure 6 illustrates the SOH and Coulombic efficiency during cycling for different contamination types. Reference specimens No. 01 and No. 02 were subjected to 500 cycles to investigate the aging effects during cycling. Specimen No. 01 indicated peaks in the Coulombic efficiency and drops in the SOH each 10 cycles. A similar behavior was observed for reference specimen No. 02. Reference specimen No. 03 showed no relevant changes in electrochemical behavior in terms of SOH and Coulombic efficiency for 97 cycles. After 97 cycles, specimen No. 03 indicated faulty measurement values with a Coulombic efficiency exceeding 100%. These data were excluded in further analysis. The SOH of reference specimen No. 04 linearly decreased at a consistent Coulombic efficiency of approximately 100%. After contamination with water, a fast drop in the SOH of specimens No. 05 to No. 08 was observed. The Coulombic efficiency showed an erratic course for specimens No. 05, No. 06 and No. 08. Specimen No. 07 had a smooth Coulombic efficiency course before water contamination, changing to an erratic course after contamination with sharp drops each 10 cycles. The Coulombic efficiency dropped for specimens No. 06 and No. 08 after water contamination. Specimens No. 05 and No. 07 reached a Coulombic efficiency of almost 100% even for the electrochemical cycles after contamination. Specimens No. 05, No. 06 and No. 07 showed an erratic course of SOH before contamination with peaks or drops each 10 cycles. The SOH of specimen No. 08 constantly decreased before contamination. After contamination with oxygen, a sharp drop in SOH of specimens No. 09 to No. 11 was observed, followed by a constant decrease in SOH. Specimens No. 10 and No. 11 showed a similar effect as specimen No. 04 (reference specimen equipped with ZrO2 plate) with a linear decrease in SOH before contamination at a consistent Coulombic efficiency. Specimen No. 09 showed a raising capacity until a peak was reached after 39 cycles and decreased for further cycles before contamination. The Coulombic efficiency stayed almost constant for specimen No. 09–No. 11. After contamination, the Coulombic efficiency of specimen No. 10 started to decrease with sharp drops each 10 cycles.
The EIS measurements revealed further information about the effect of contamination and the influence of a contamination on the electrochemical properties of specimens. Except from specimens No. 05, No. 06 and No. 10, all specimens showed two semicircles in the impedance spectrum of the corresponding impedance measurement, as can be seen in Figure 7. The second semicircle degenerated to an almost linear section for specimens No. 03, No. 09 and No. 11.
The reference specimens No. 01–No. 03 indicated minor changes during cycling. Minor changes of the intercept with the abscissa were observed during cycling. Specimen No. 04 showed increased semicircle diameters after 20 cycles (loop 2) with minor changes during further cycling. Noise was observed for specimens No. 01 and No. 04 at low frequencies indicated by a zig zag curve. Specimens contaminated with water (No. 05–No. 08) showed an increase in diameter of the second semicircle after contamination. Specimens No. 05 and No. 06 indicated changes in the intersection with the abscissa. Specimen No. 05 indicated a shift of the intersection with the abscissa towards higher values. Specimen No. 06 had a shift towards lower values after contamination increasing afterwards (loop 9). Additionally, reduced slopes of the linear part of the impedance spectra in the low frequency range were observed after contamination. Specimens No. 07 and No. 08 indicated minor changes of the intersection with the abscissa. Specimens No. 09–No. 11 contaminated with oxygen showed slighter changes in electrochemical behavior compared to the specimens contaminated with water. The intersection with the abscissa did not change to a relevant extent after contamination. The intersection with the abscissa shifted towards higher values for specimen No. 11 at 10 cycles after contamination (loop 11) that faded after 20 further cycles (loop 13). The diameter of the first semicircle slightly increased before contamination and significantly afterwards for specimens No. 09–No. 11. The degenerated second semicircle of specimens No. 09 and No. 11 flattened after contamination. The slope of the linear part of the impedance spectra in the low frequency range decreased for specimens No. 09–No. 11.
In summary, the reference specimens showed no qualitative change (i.e., change in curve shape) in the electrochemical impedance spectra during electrochemical cycling. A continuous shift of the curves during electrochemical cycling towards higher impedance values was observed. The water-contaminated specimens indicated the fast degeneration of the electrochemical impedance spectra after contamination, seen as large changes in the semicircle’s diameters and change in curve shapes. A similar behavior was observed for specimens contaminated with oxygen. The semicircle’s diameters increased subsequently after contamination but not to the same extent as water-contaminated specimens.

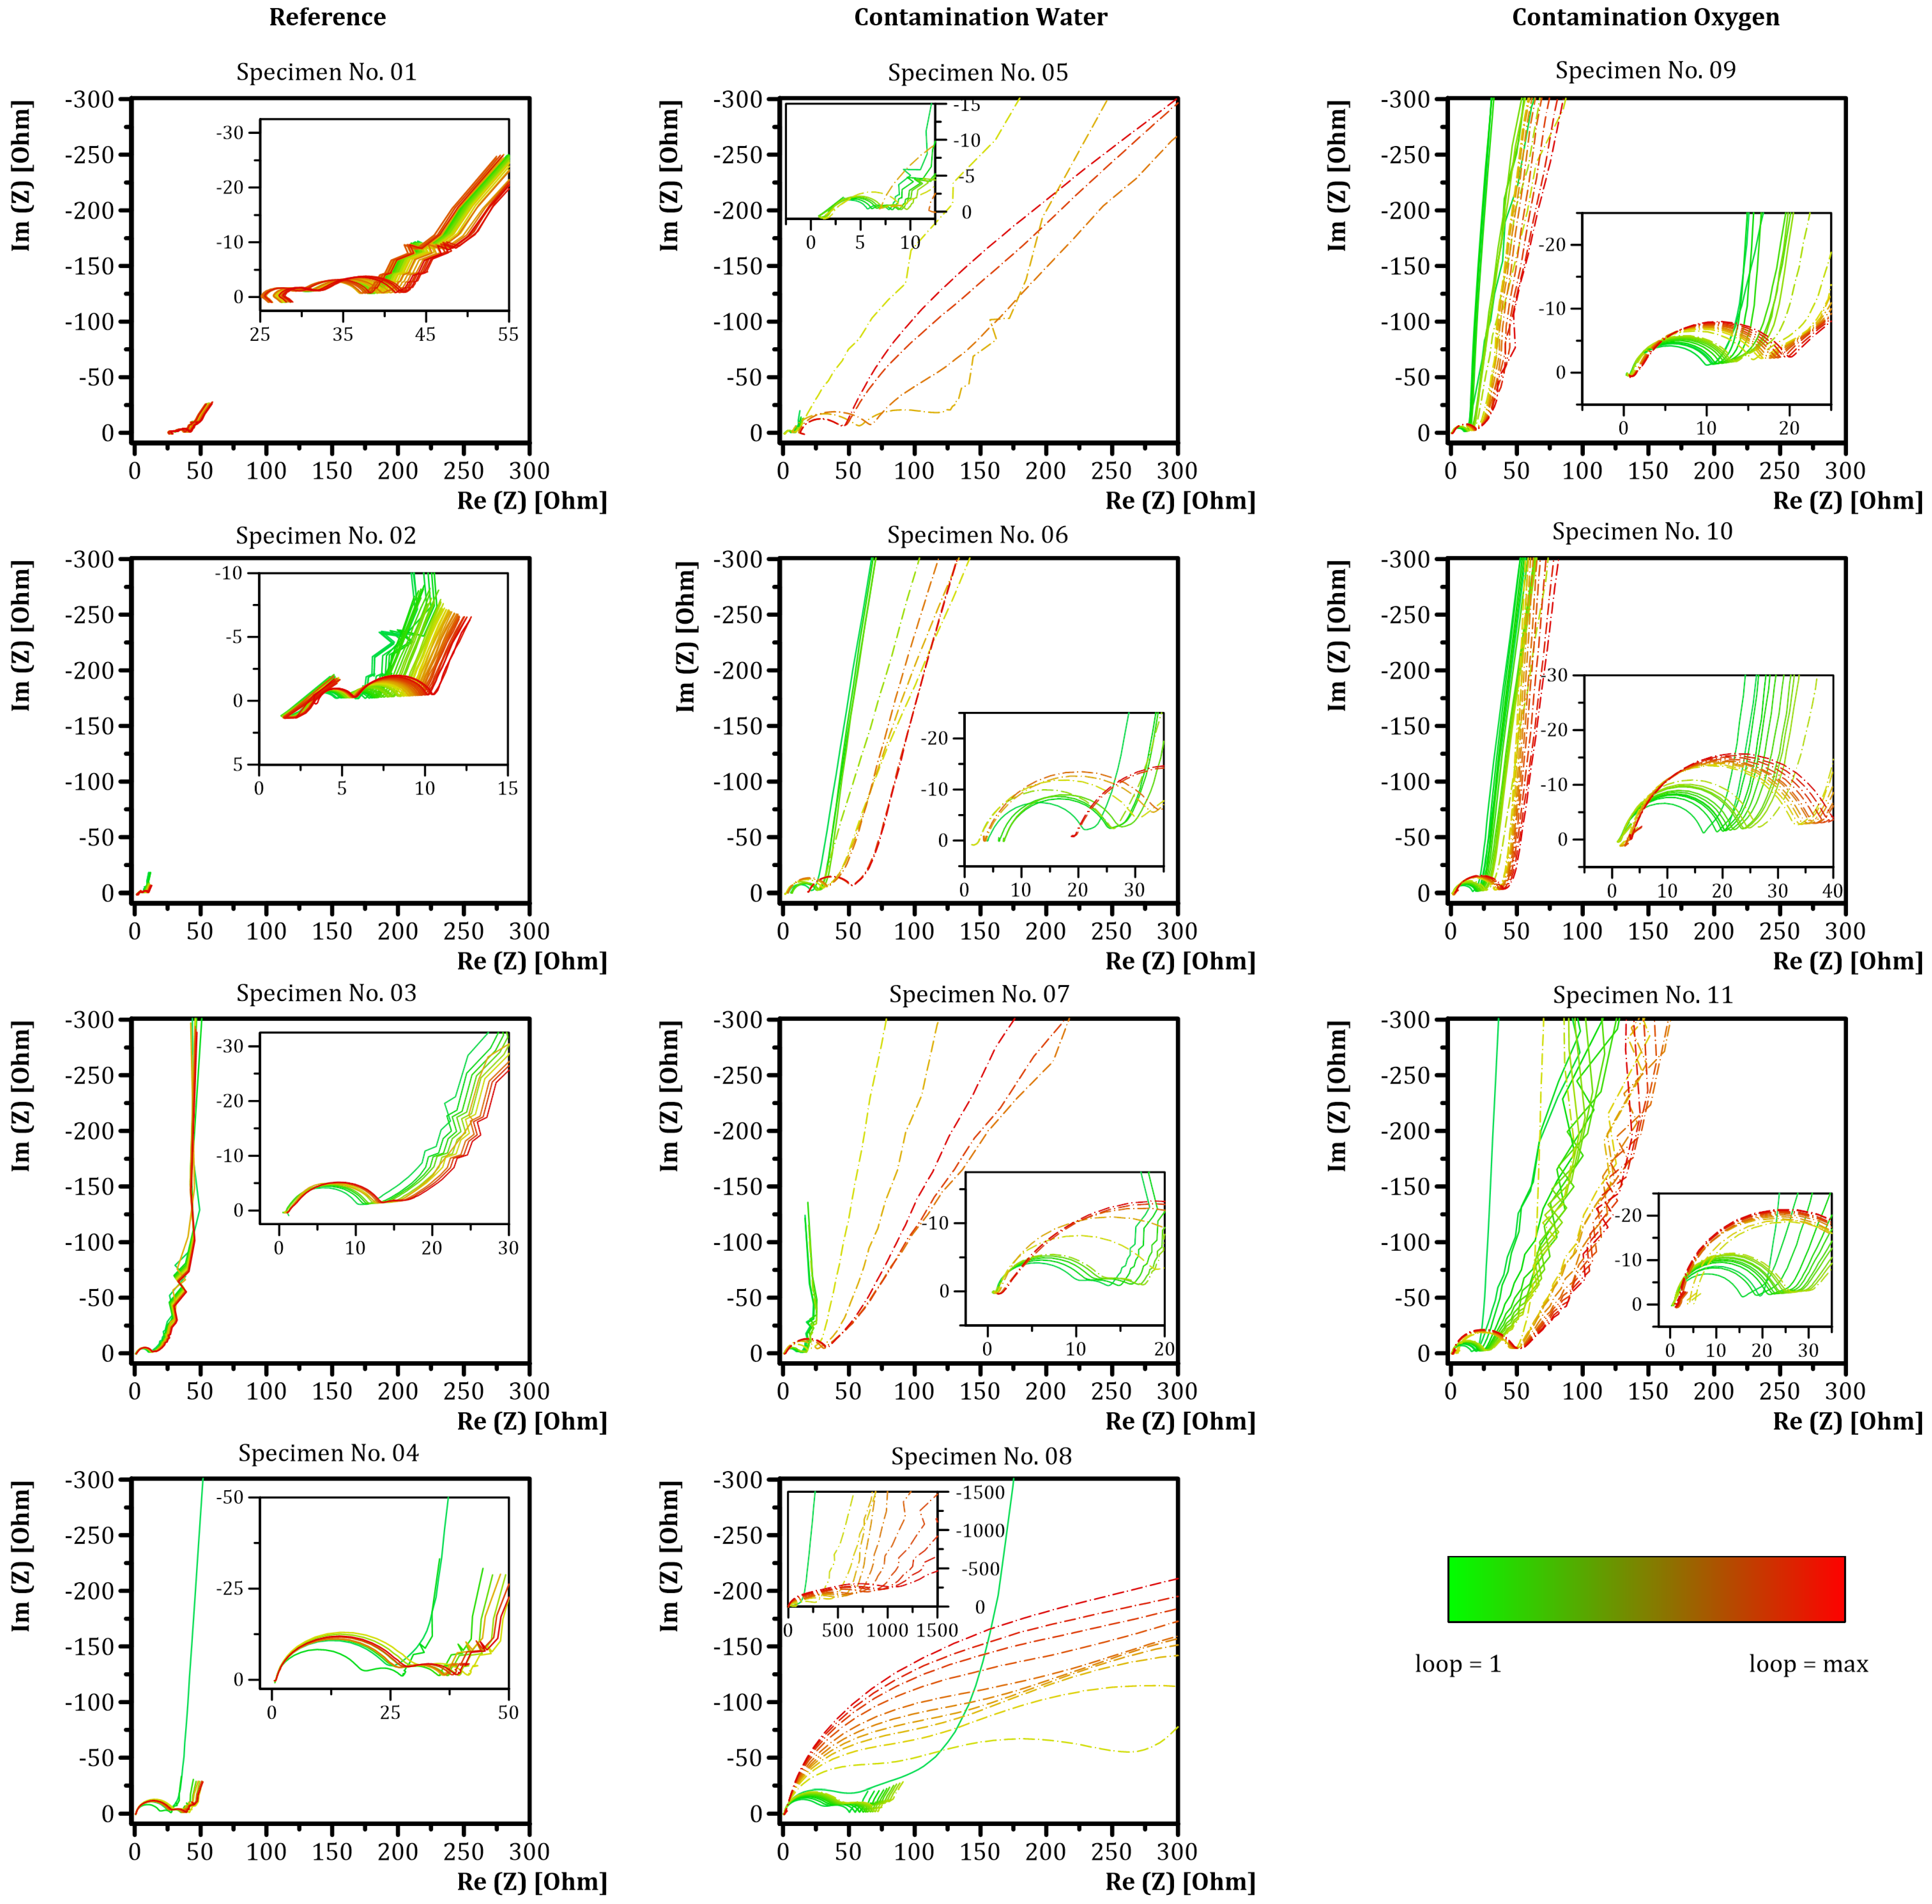
3.2. Equivalent Circuit Model
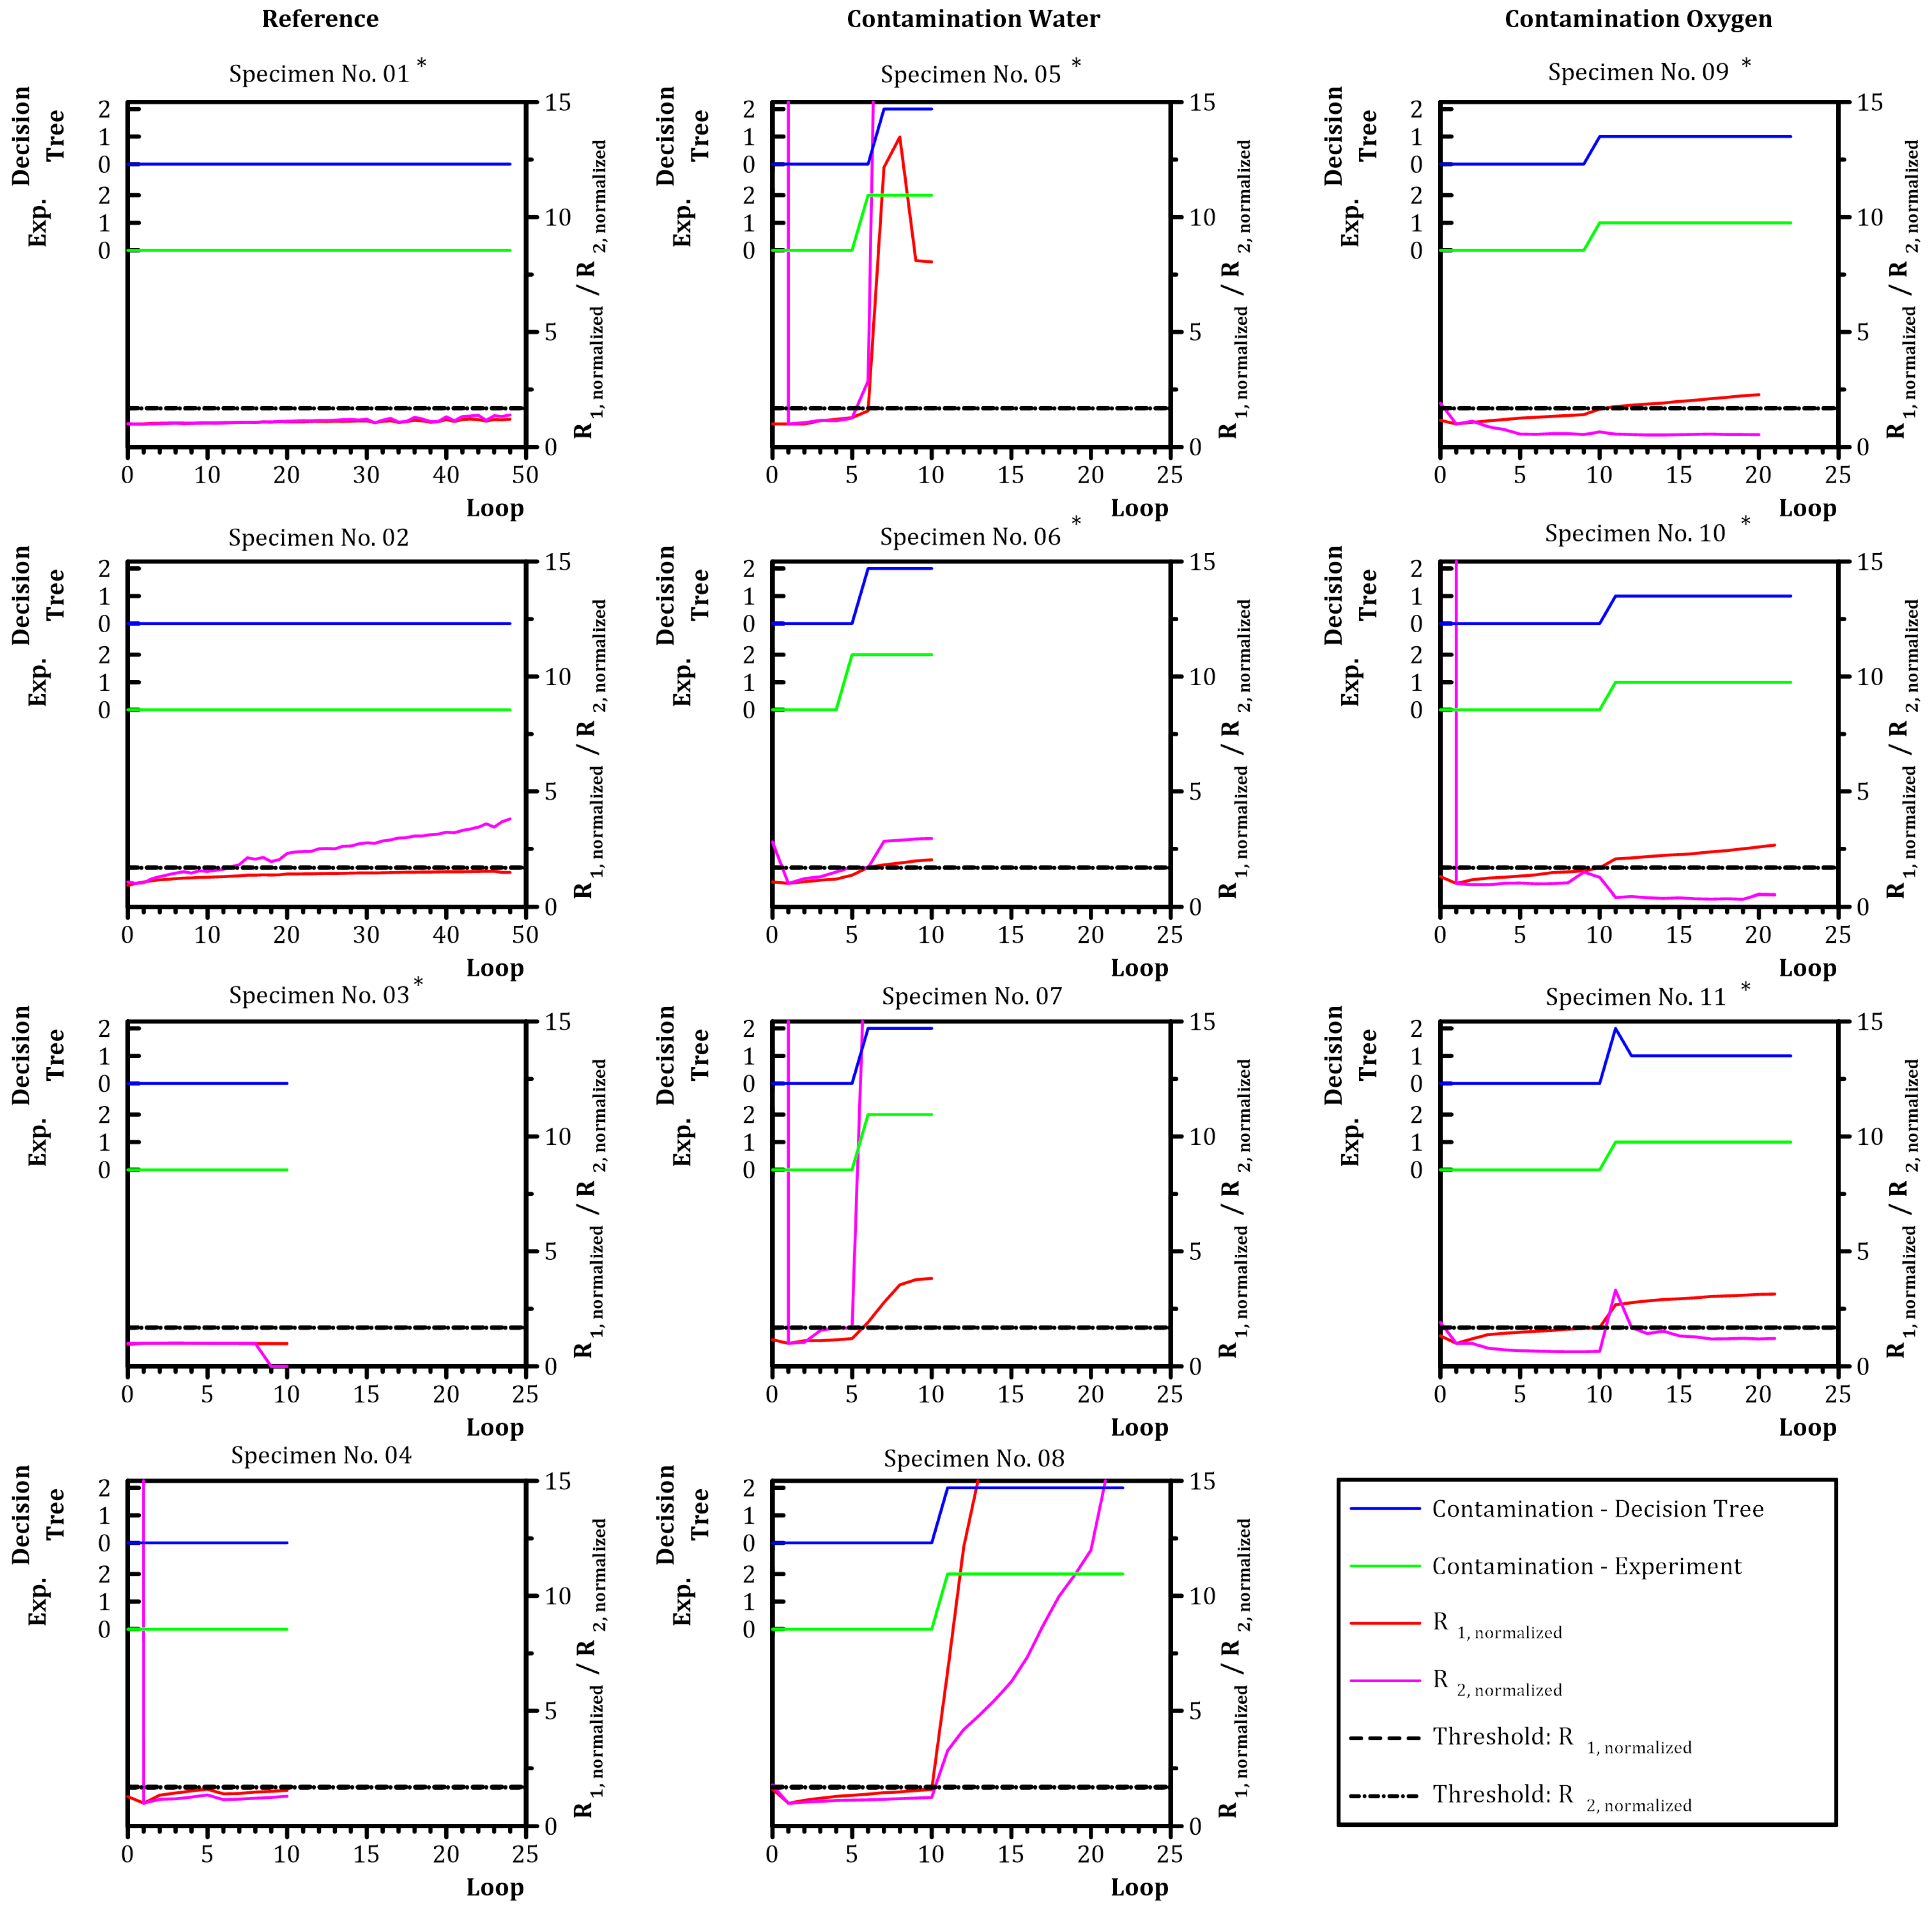
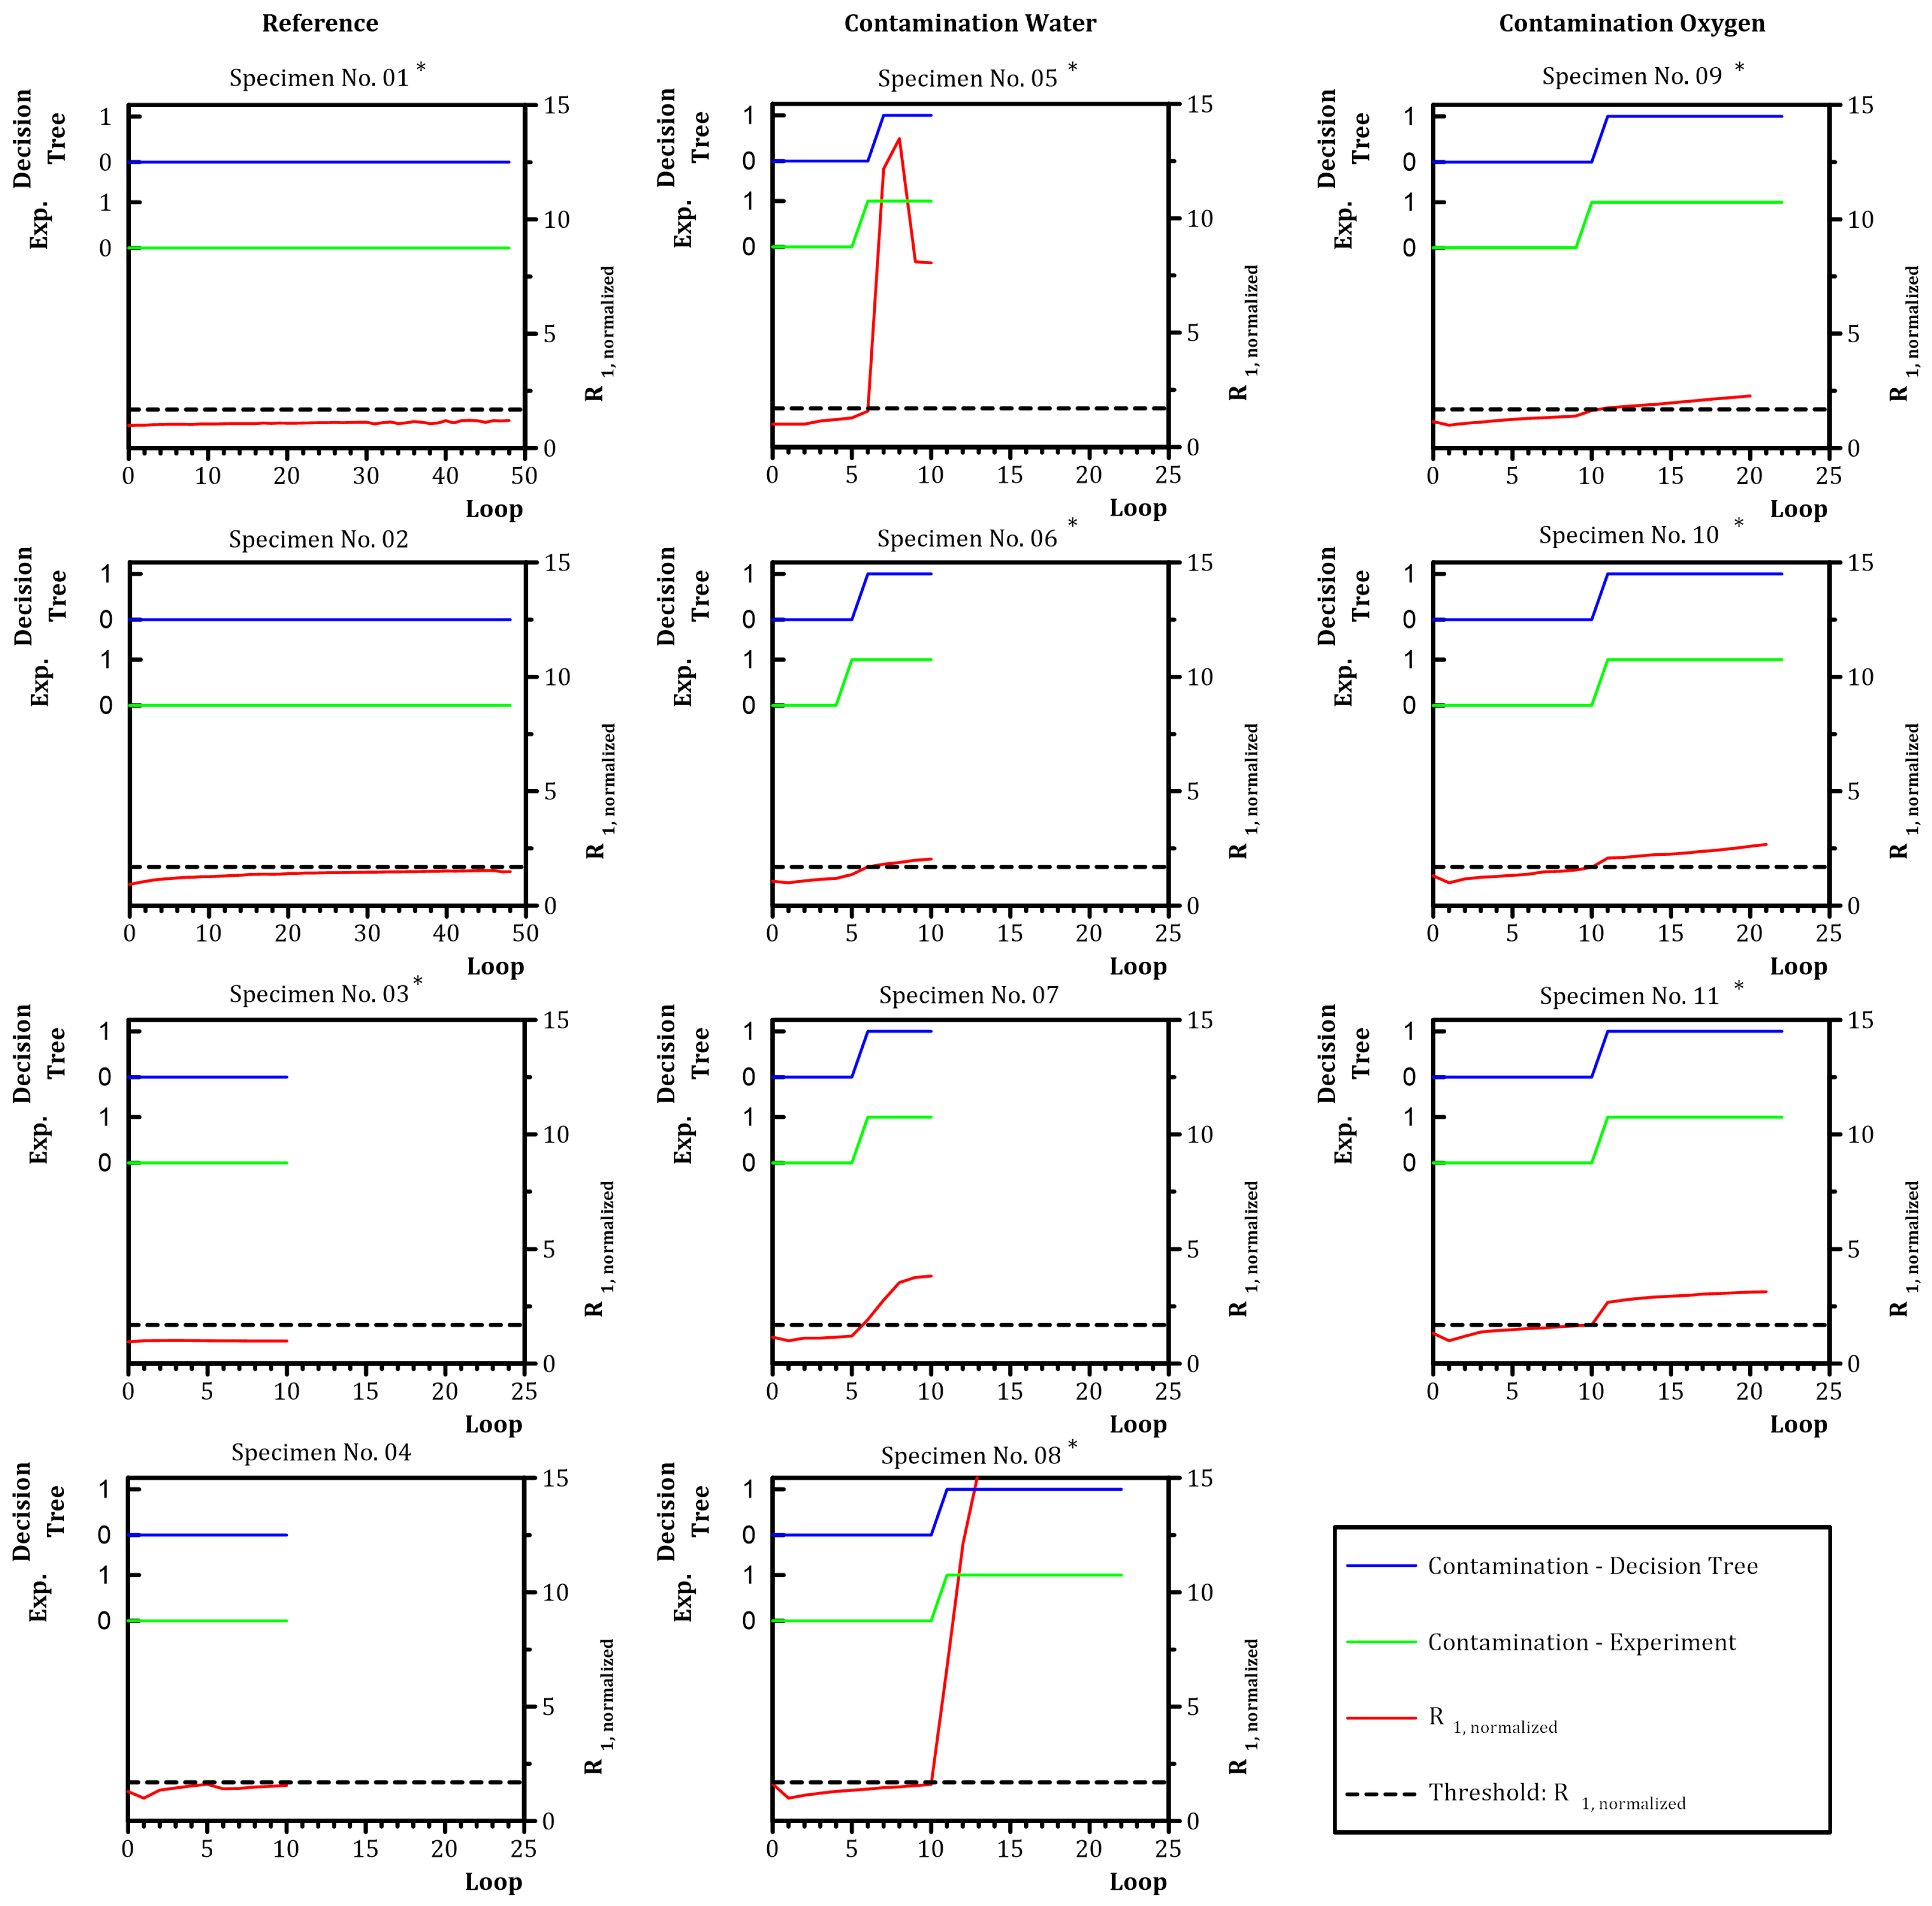
The obtained EIS measurements were fitted with the ECM parameters shown in Figure 5. The numerical values of the ECM parameters of each specimen can be taken from the Supplementary Material. Average χ 2 , describes the goodness of fit, was within the guideline of a value below 6 × 10⁻³ for good fit except from the fitting results of specimens No. 07, No. 08 and No. 10 before contamination, as can be seen in Table 3. For specimen No. 10, doubtful fitting results of the EIS measurements were obtained before contamination. After contamination, a χ 2 of 2.24 × 10⁻³ represented good fit.

3.3. Decision Tree

Two variants for contamination prediction were investigated: In the first, two classes “no contamination” (0) and “contamination” (1) were distinguished. In the second, three classes “no contamination” (0), “contamination—oxygen” (1) and “contamination—water” (2) were distinguished. For each variant, the feature importance ( F I ) of the model input parameters was examined in first place, as can also be seen in Appendix A.

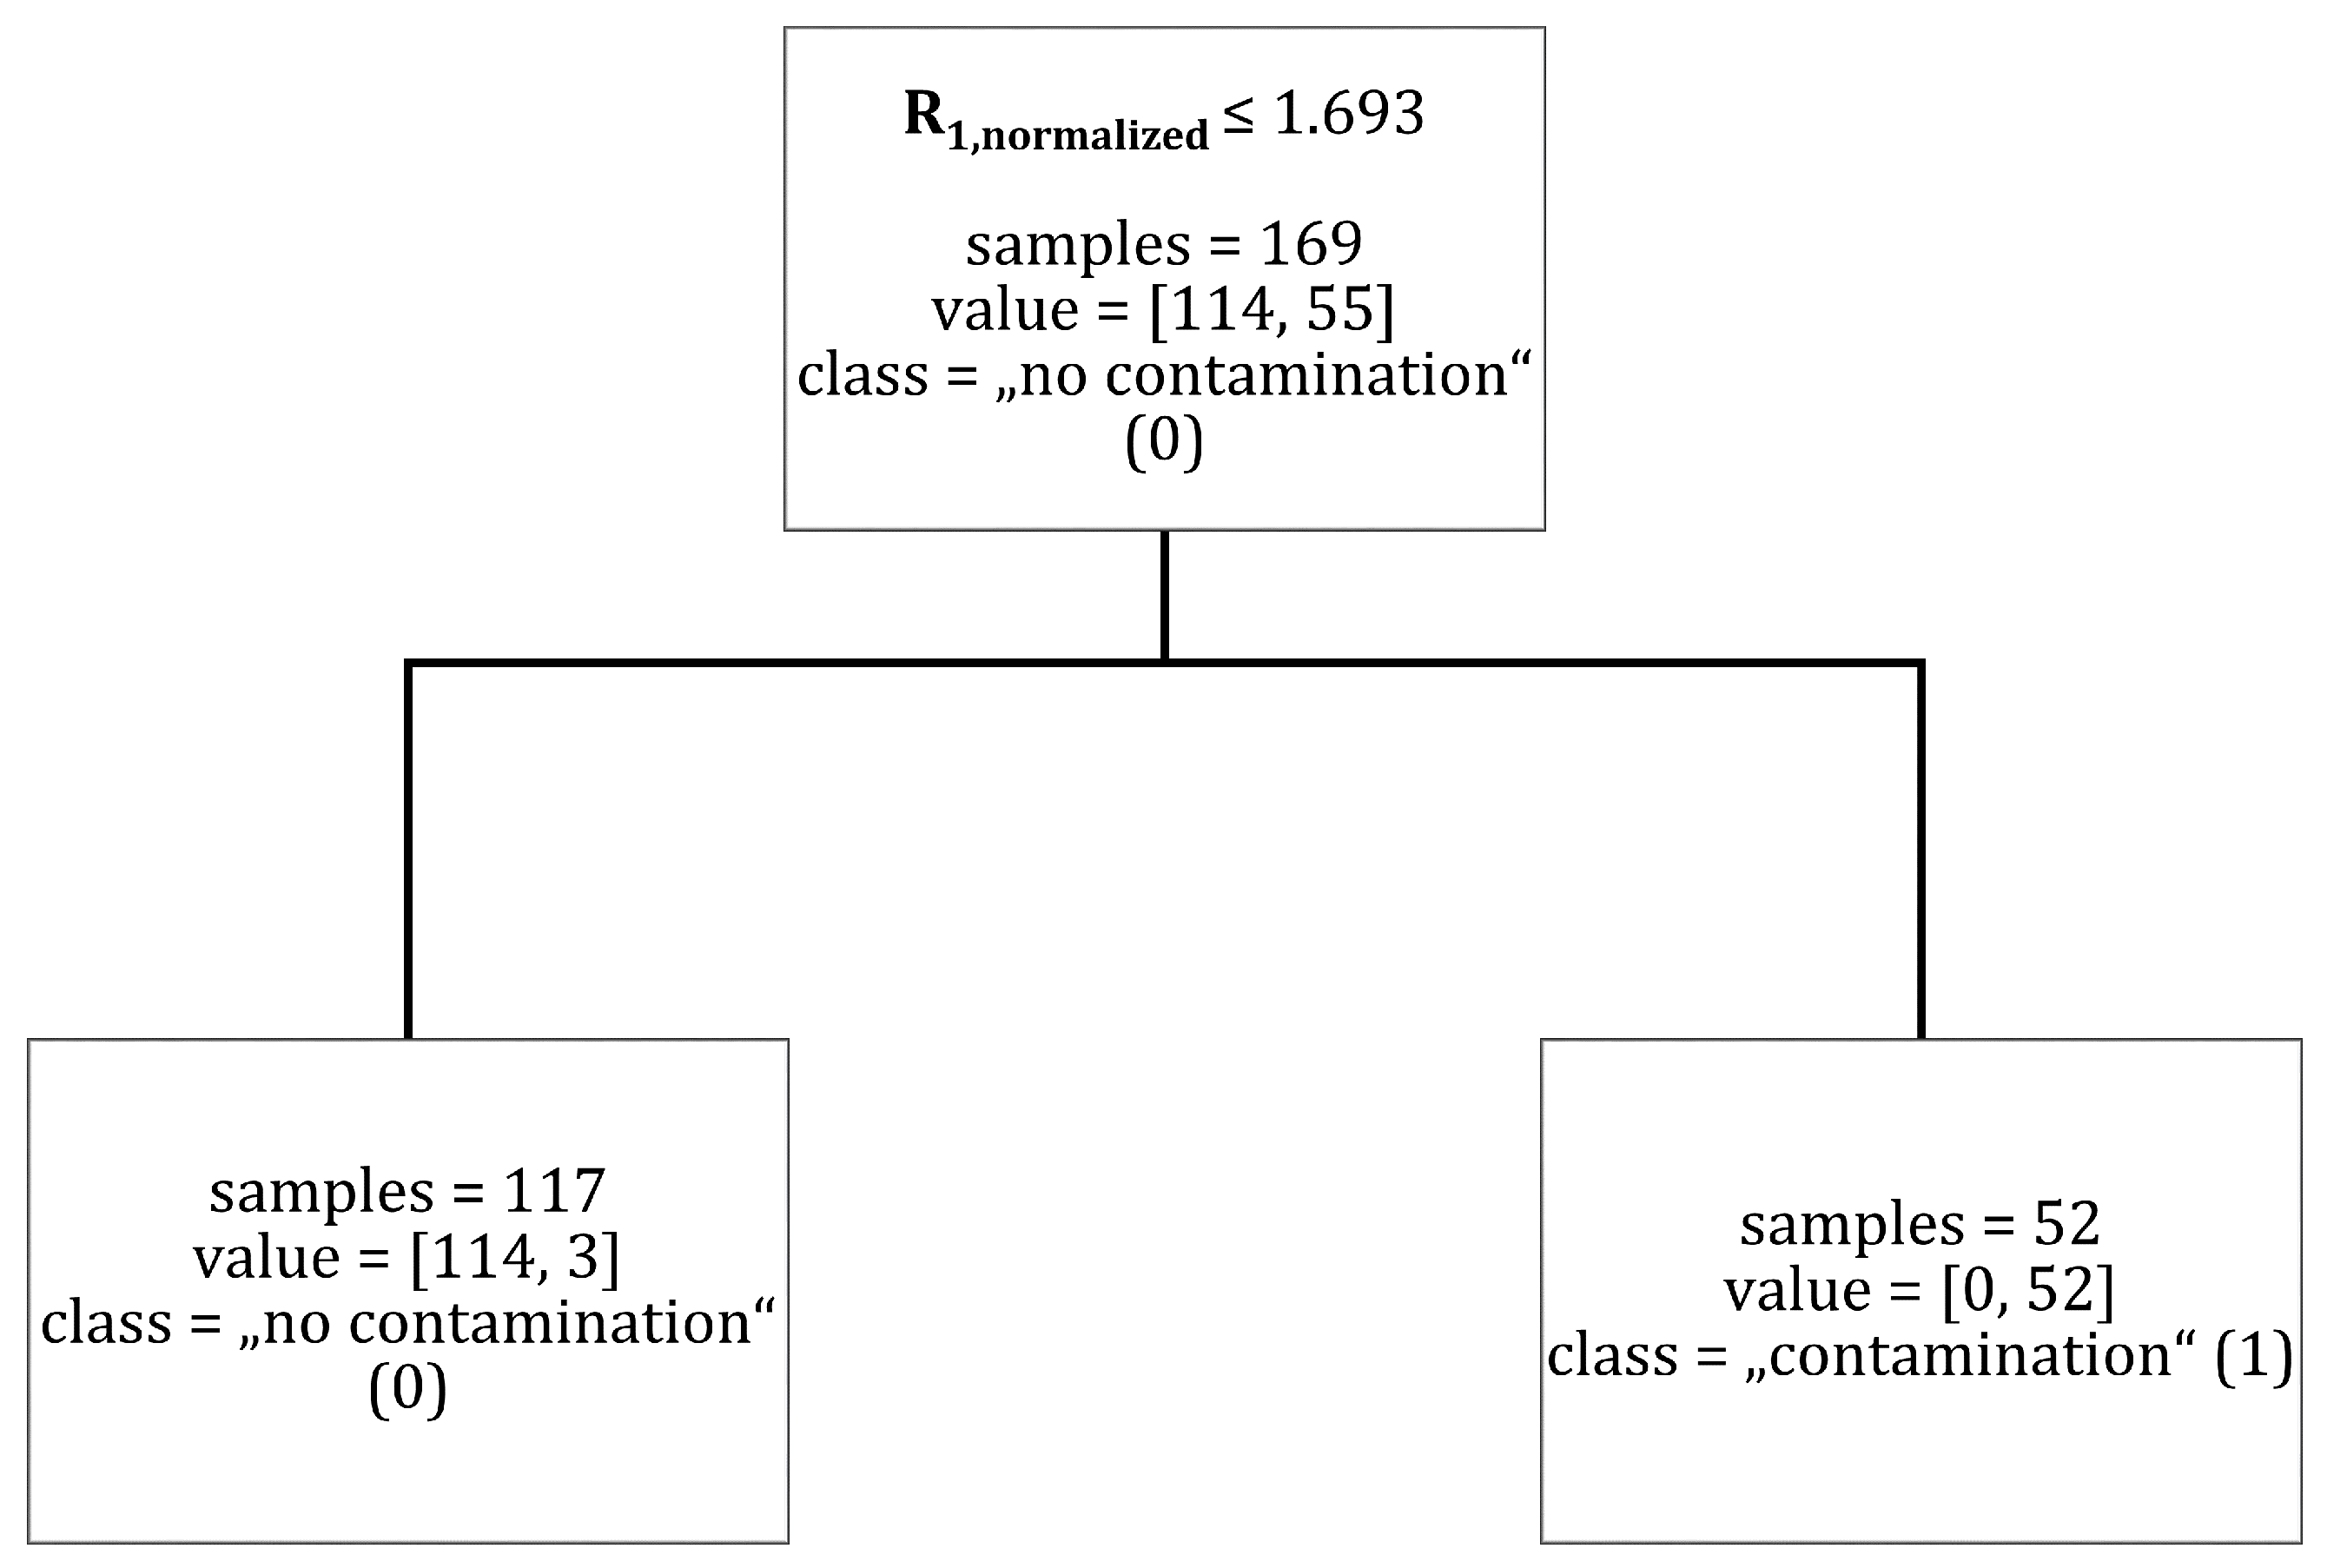
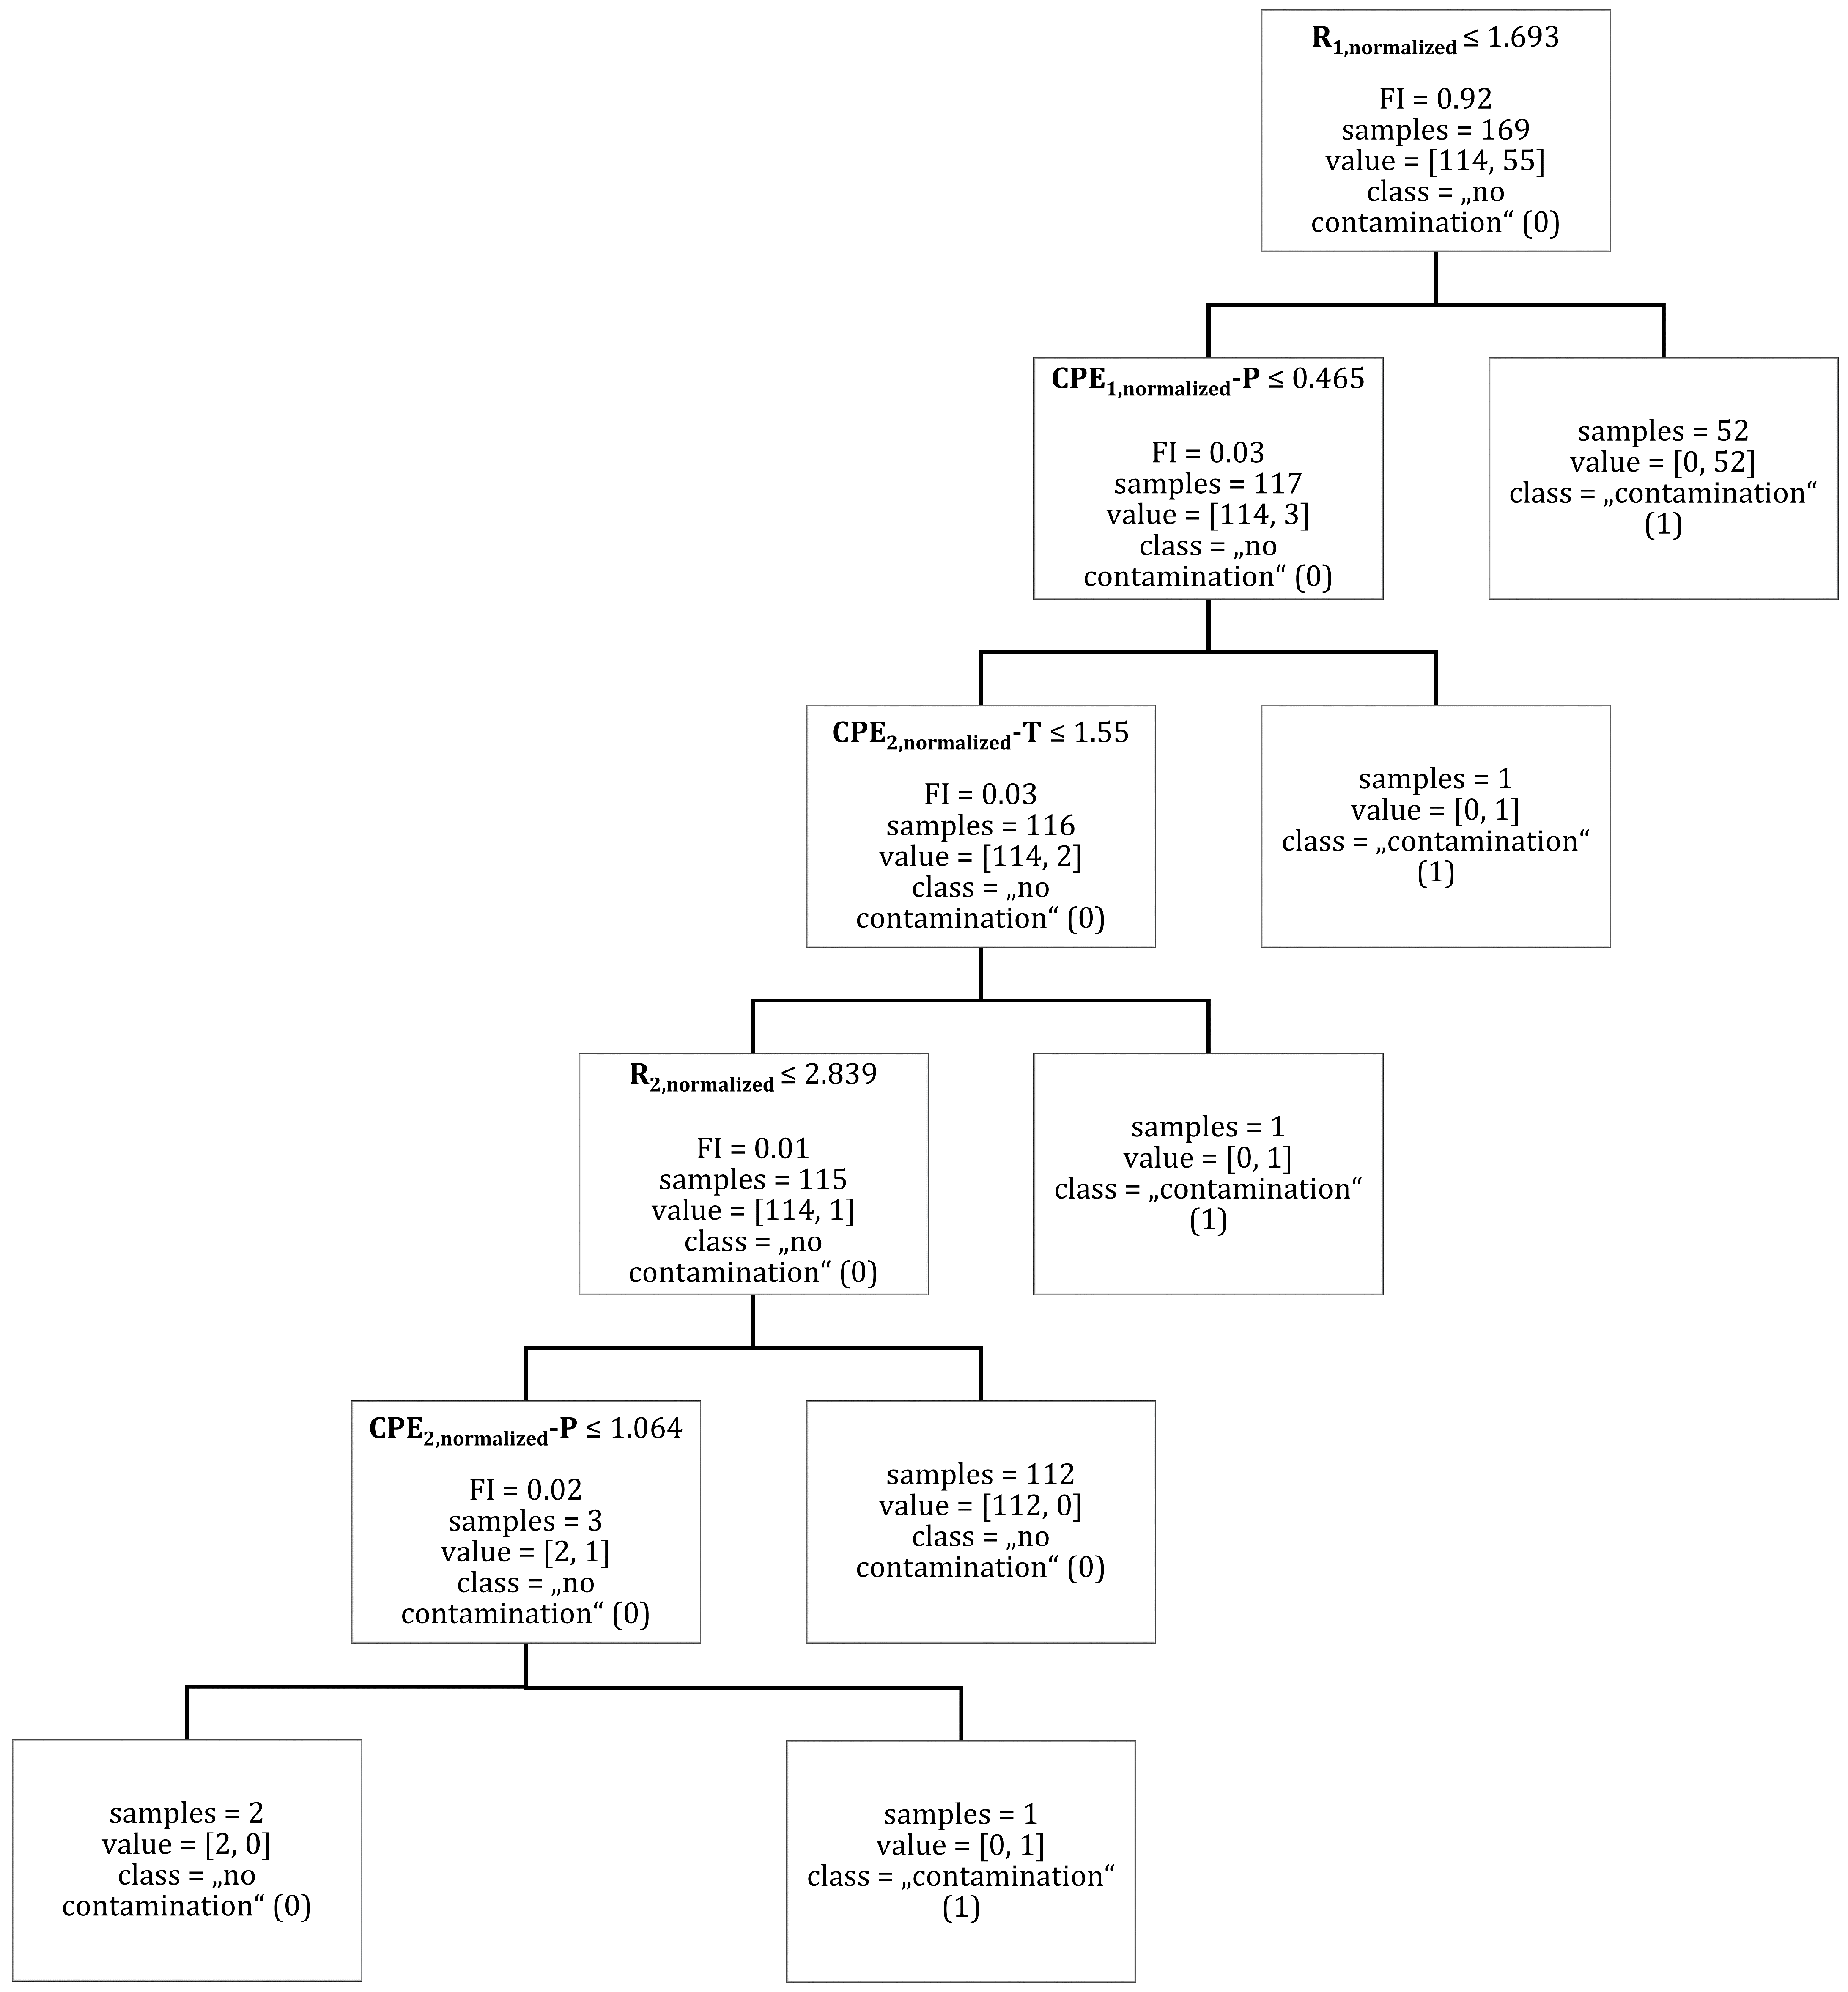
3.3.1. Contamination Recognition (Tree Depth = 1)

Without tree depth limitation R 1 , n o r m a l i z e d achieved the highest feature importance F I = 0.92 for a classification between “no contamination” (0) and “contamination” (1), as can be seen in Figure A1. The parameter with the second highest feature importance was C P E 1 , n o r m a l i z e d P with F I = 0.03 . In order to predict the classes “no contamination” (0) and “contamination” (1), the maximum depth of the decision tree classifier was set to one with R 1 , n o r m a l i z e d as the main criterion. This led to the prediction of “no contamination” (0) as long as R 1 , n o r m a l i z e d 1.693 is true. Figure A2 shows the decision tree for this variant. Three data points out of 169 were falsely classified in this configuration.
Figure 8 shows the evolution of criterion R 1 , n o r m a l i z e d (red line) over all measurement data sets. The threshold for R 1 , n o r m a l i z e d for a class split in the decision tree is symbolized by “Threshold R1, normalized” (black-dashed line). The activation of the contamination in the experiment was marked as “contamination–target” (green line). The prediction of contamination from the decision tree algorithm is marked as “contamination–prediction” (blue line).
The left column “Reference” in Figure 8 shows the data for specimens without contamination (specimens No. 01–04). R 1 , n o r m a l i z e d showed a reasonably constant course over cycling. The contamination indicator “Contamination–Experiment” and the decision tree classification “Contamination–Decision Tree” both stayed at “no contamination” (0). The algorithm correctly assigned the contamination state for specimens No. 01 and No. 03 and performed a correct prediction for specimens No. 02 and No. 04. The middle column “Contamination Water” in Figure 8 shows the data for specimens with water contamination (specimens No. 05–08). Contamination was activated at loop 5 for specimens No. 05, No. 06 and No. 07 and at loop 11 for specimen No. 08, indicated by the green line switching to “contamination” (1). The contamination of specimens No. 05 and No. 06 was assigned with a delay of one loop by the algorithm. The contamination assignment of specimen No. 08 was accurate. The contamination of specimen No. 07 was correctly predicted. The right column “contamination oxygen” in Figure 8 shows the data for specimens with oxygen contamination (specimens No. 09–11). Contamination was activated at loop 10 for specimen No. 09 and at loop 11 for specimens No. 10 and No. 11. The assignment of the contamination of specimen No. 09 was delayed by one loop. The assignment of the algorithm for specimens No. 10 and No. 11 was correct.

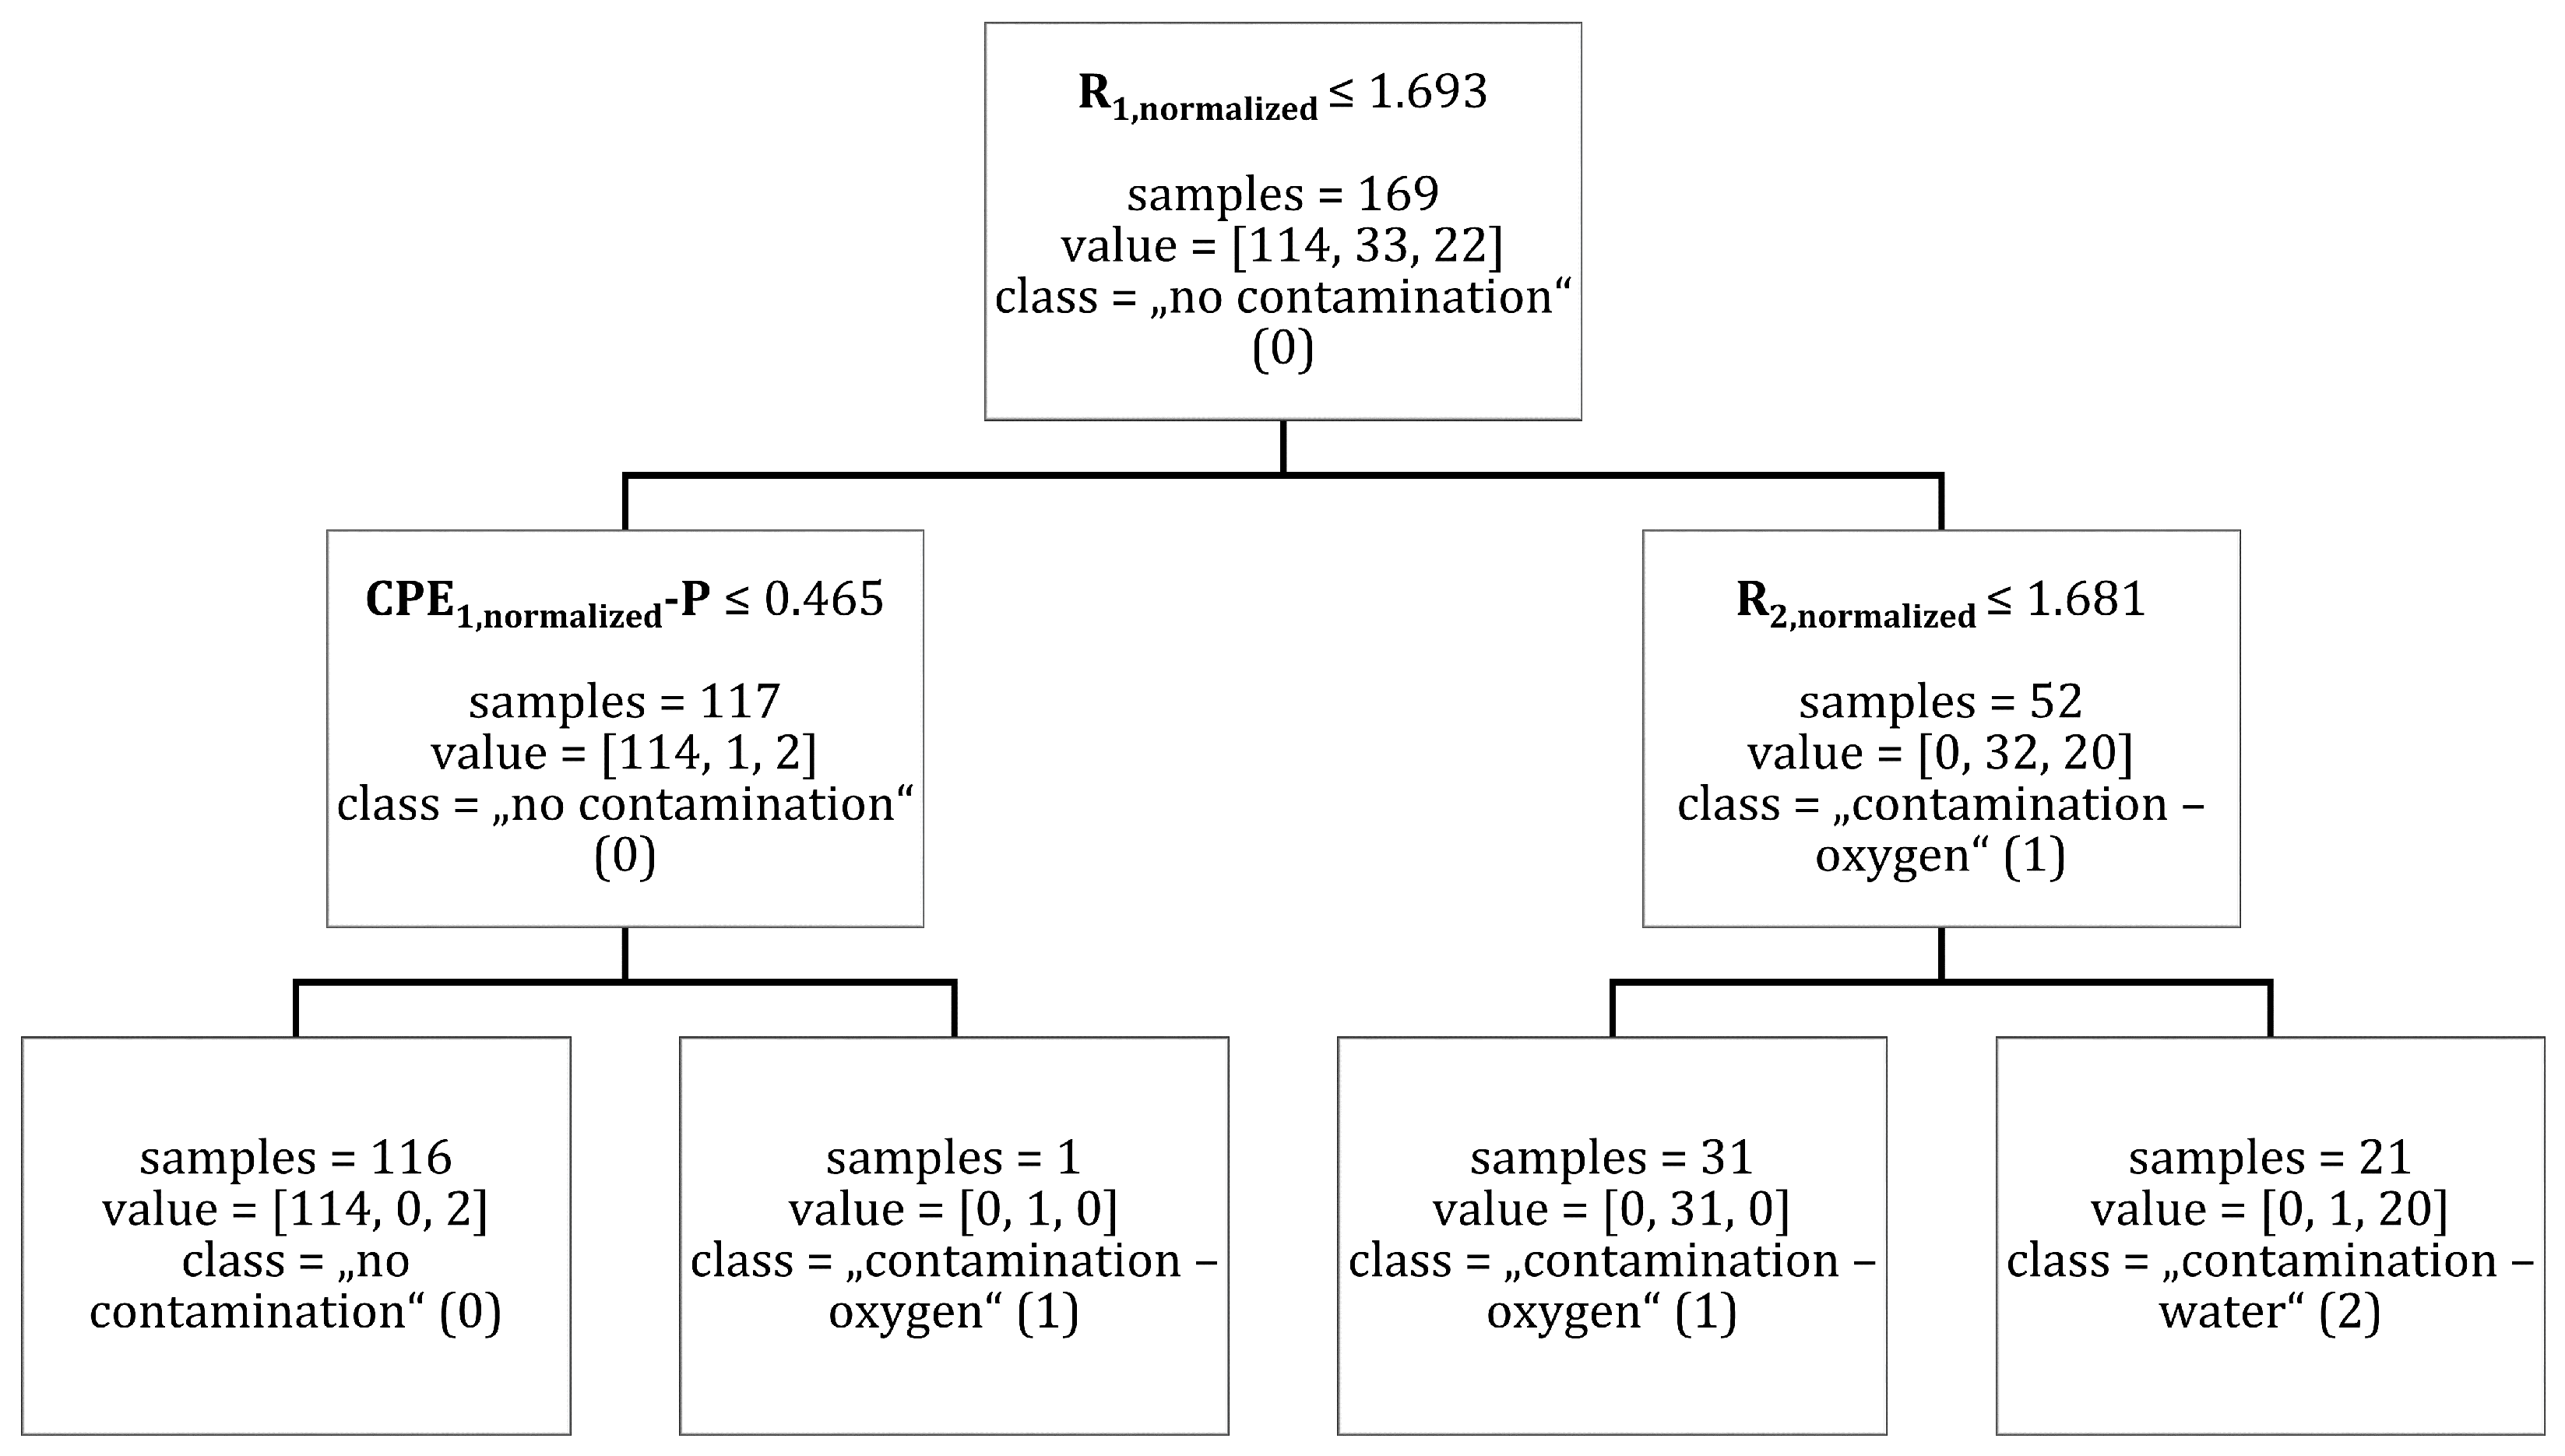
3.3.2. Contamination Type Differentiation (Tree Depth = 2)

As R 1 , n o r m a l i z e d was identified as the most relevant model parameter to recognize contamination. A further criterion was needed to distinguish different types of contamination. The data sets, which were classified as “contamination” (1) in the step before, were now separated into the classes “contamination—oxygen" (1) and “contamination—water” (2). Therefore, the maximum depth of the decision tree was set to two.
In the next step, R 2 , n o r m a l i z e d and C P E 1 , n o r m a l i z e d P were found to distinguish between the classes “contamination—oxygen” (1) and “contamination—water” (2). C P E 1 , n o r m a l i z e d P was able to classify one data point into the class “contamination—oxygen” with a threshold of 0.465 , see Figure A3. R 2 , n o r m a l i z e d was able to distinguish between the classes “contamination—oxygen” (1) and “contamination—water” (2) with one false classification. The threshold value for R 2 , n o r m a l i z e d was 1.681 . The threshold value for R 1 , n o r m a l i z e d was 1.693 as before. The decision tree calculated for this variant is shown in Figure A3. Figure 9 shows the evolution of criteria R 1 , n o r m a l i z e d (red line) and R 2 , n o r m a l i z e d (magenta line) over all measurement data sets. The threshold for R 1 , n o r m a l i z e d is symbolized by “Threshold R1, normalized” (black dashed line) while threshold for R 2 , n o r m a l i z e d is symbolized by “Threshold R2, normalized” (black dotted-dashed line). As before, the activation of the contamination in the experiment was marked as “Contamination—Experiment” (green line). The decision tree classification is indicated by “Contamination—Decision Tree” (blue line).
The left column “Reference” in Figure 9 shows the data for specimens without contamination (specimens No. 01–04). Specimen No. 04 revealed a high R 2 , n o r m a l i z e d value for loop 0 changing to R 2 , n o r m a l i z e d = 1 for loop 1 as loop 1 was used for normalization. The contamination status was assigned correct for every value by the decision tree.
The middle column “Contamination Water” in Figure 9 shows the data for specimens with water contamination (specimens No. 05–08). The contamination of specimens No. 05 and No. 06 was assigned by the algorithm with a delay of one loop. The contamination assignment of specimen No. 08 was accurate. A contamination of specimen No. 07 was correctly predicted.
The right column “Contamination Oxygen” in Figure 9 shows the data for specimens with oxygen contamination (specimens No. 09–11). The algorithm falsely assigned a contamination with water for specimen No. 11, but changed to the correct value, indicating a contamination with oxygen one loop later. The assignment of the algorithm for specimens No. 09 and No. 10 was correct.

4. Discussion

Novel methods for in situ contamination with different contaminants were presented within this study. Eleven single-layer full battery cells were produced in a glove box and monitored with electrochemical impedance spectroscopy during cycling. Seven of these specimens were contaminated with water or oxygen during cycling. In this investigation, aging was excluded as far as possible by choosing LTO/LCO as the active material. The impedance data obtained were fitted with equivalent circuit elements and used in a normalized form to train a decision tree for contamination classification and prediction. Water contamination was achieved by breaking a water-filled glass container placed within the specimen before sealing. Oxygen contamination was achieved by application via a syringe. A self-healing injection port glued to the specimen guaranteed further contamination by closing itself after removing the syringe. A ZrO2 plate prevented the penetration of the pouch foil with the syringe.

4.1. Limitations

Manually produced single-layer full battery cells were used in this study for flexibility in terms of chemistry and to avoid the safety risks of high-energy battery cells. The necessary adaptions on the specimen to implement the contamination trigger were large in terms of size. It is expected that the electrochemical behavior of commercial battery cells will not be affected by these adaptions in the same magnitude as was observed in this study. The chemistry used (Li4Ti5O12/LiCoO2) was chosen to exclude the aging effects. The presented classification algorithm has to be validated when aging is overlaid with contamination. Additionally, a small number of specimens did not allow statistical statements to be made. In the case of more data being available and with the spread of electrochemical parameters being lower between the specimens, more sophisticated methods would be available, i.e., a recurrent neural network. Additionally, the effect of the contaminant quantity was not observed within this study. The water quantity used for contamination was unlikely to be found in a realistic scenario. A relatively high amount of water was used in this study to maximize the effects of the water contamination. The contamination prediction quality for smaller water quantities should be evaluated in further studies.

4.2. Contamination Trigger

The electrochemical properties were sensitive to the necessary adaptions (glass container or ZrO2 plate) and refer to the possible chemical side reactions and disturbances. The glass container seemed to affect the electrochemical properties of the specimens with water contamination (specimens No. 05–08) before contamination by affecting the SOH during cycling. The observed sensitivity of the specimens’ electrochemical behavior on the glass container is considered small compared to the changes by the contamination itself, as can be seen in Figure 6. The ZrO2 plate was also observed to affect the electrochemical cycling behavior and SOH of the specimens before contamination. While ZrO2 is often used as a surface coating material for cathode electrodes and is reported to be stable and relatively inert, it is still able to react with lithium ions and form a Li2ZrO3 phase, resulting in capacity fade [73]. The defined requirements for the contamination trigger method (the application of different contamination quantities, repeatability, simple release and minor effect on the battery cell during normal operation) were met except for the minor effect on the battery cell during normal operation. For commercial battery cells, it is expected that the effect of the contamination trigger method itself is minor as the size of the disturbance is small compared to the battery cell size.

4.3. Electrochemical Cycling

As was intended by the choice of the active material, the minor aging of the reference specimens (No. 01–04) was indicated by minor changes in the SOH and Coulombic efficiency during cycling. Additionally, minor changes of the intercept with the abscissa of the impedance spectrum corresponded to a low change in electrolyte resistance during cycling. The Coulombic efficiency showed a rather erratic course for every specimen. Drops or peaks were observed every 10 cycles, correlating with the OCV phase with a relaxation time of 12 h after the galvanostatic cycling with potential limitation (GCPL). The relaxation time led to an increased capacity for one subsequent cycle possibly explaining the drops and peaks. Specimens contaminated with water (No. 05–08) showed clearly electrochemical behavior changes in terms of SOH, Coulombic efficiency and impedance. The impedance spectra of the water-contaminated specimens had a growing second semicircle, indicating a growing charge transfer resistance. Water ingress and oxygen ingress in pouch cells are known to significantly deteriorate cell performance and lead to a degradation of SOH [27]. In the environment of the Li-Ion cell, water is thermodynamically unstable. The electrochemical stability window of water is only 1.23 V , which is significantly narrower than the voltage of Li-Ion batteries and the voltage of the tested specimens. While hydrogen and oxygen may be generated in the process, when water and oxygen are in trace quantities, complex electrode reactions occur at the electrodes which involve solvents and salt. In addition to electrochemical decomposition, water may spontaneously react with several components of the cell. For instance, traces of water will result in the hydrolysis of the hexafluorophosphate (PF6) ion with the formation of hydrofluoric acid (HF) [31,36,74]. HF is a highly corrosive gas that will react with both active materials and current collectors. While the electrochemical decomposition of water is a relatively fast process, the formation of HF through PF6 hydrolysis is a slow process. Specimens contaminated with oxygen showed slower degradation compared to the specimens contaminated with water. In the impedance, the first semicircle’s diameter slightly increased before contamination, but subsequently, the increase was significant, indicating a growing SEI on the cathodic electrode (cathodic SEI) or the formation of additional passivation layers. This can be attributed to oxidative reactions of the current collectors, electrolyte and active material (cathode). Additionally, diffusion decreased after contamination, considering the slope at a low frequency range of the EIS measurements. Indeed, the oxygen reduction reaction is known (from fuel-cells research) to proceed at notoriously slow rates in the absence of suitable catalysts. Thus, it is not surprising that water contamination shows a pronounced and immediate effect, while oxygen contamination leads to a slower response, simply because it is very likely that the oxygen reduction reaction has sluggish kinetics under experimental conditions. In general, a faulty battery cell within a battery module might lead to safety-relevant changes in the system behavior. The continuously dropping capacity of a contaminated battery cell leads to an unbalance in the battery module, promoting the further accelerated aging of the other included battery cells. The complete failure of individual battery cells should be avoided to guarantee the safe operation of a battery system. State-of-the-art monitoring methods (i.e., internal resistance monitoring, voltage monitoring) might not be applicable to the detection of contaminated battery cells (i.e., no change of internal resistance was observed after contamination).

4.4. Decision Tree

The specimens had a wide dispersion in terms of electrochemical properties. This made the normalization of ECM parameters necessary. This issue can be attributed to the manual manufacturing process of specimens. The chemical side reactions include SEI growth and oxidative reactions leading to the growth of the first semicircle which is represented by R 1 and C P E 1 . The ECM parameter R 1 was therefore expected to be the most sensitive model parameter. C P E 1 , n o r m a l i z e d P was only able to classify one data point into the class “contamination–oxygen” (1). C P E 1 P was also obtained by the shape of the first semicircle which was also affected by R 1 . By including R 1 in the decision, the relevant information about the first semicircle was already available, leading to no more additional information by including C P E 1 P . R 2 correlated with the second semicircle and provided further information about the impedance spectrum and was therefore usable to distinguish the type of contamination. The classification showed an offset in some cases that may result from the fact that, every 10 cycles, an impedance spectrum was measured. The changes in the electrochemical behavior were thus not tracked for 10 electrochemical cycles. A more frequent impedance measurement would result in the continuous tracking of the effect of contamination on the electrochemical behavior of a specimen and gain more insights into the involved degradation mechanisms.

5. Conclusions

The methods described and demonstrated in this work are suitable for an in operando contamination of commercial battery cells, allowing for the repeatable application of contaminants of different quantities with only a minor impact on the battery cell operation. The quantification of the observed changes in the impedance spectrum with the ECM parameters and corresponding thresholds proved eligible for monitoring the contamination status. In the following, the conclusions drawn from the presented study are listed.
  • Novel methods were found to apply different contaminants (i.e., water, oxygen) in operando with minor effects on battery performance.
  • The chemical kinetics of the oxygen contamination were slow compared to the water contamination.
  • The first semicircle’s diameter in the Nyquist plot increased after contamination, indicating the growing SEI or formation of additional passivation layers.
  • A decision tree based on ECM parameters from EIS measurements was able to detect the contamination of a specimen.
  • The ECM parameter R 1 in the normalized form ( R 1 , n o r m a l i z e d ) was identified as the most sensitive model parameter for contamination recognition.
  • The ECM parameter R 2 in the normalized form ( R 2 , n o r m a l i z e d ) was able to distinguish the contamination type (oxygen or water).
Combination with other advanced monitoring and evaluation tools such as the density of relaxation times (DRT) may improve prediction quality and allow for a reduction in the frequency range needed to be tested by EIS. The definition of single frequencies or small frequency ranges for contamination determination would enable the continuous tracking of the contamination state. In future research, the influence of cell chemistry on the contamination behavior and changes in ECM elements should be investigated. The prediction capability of the described method for overlaid aging and degradation mechanisms still has to be validated. Industrially produced battery cells only show a narrow spread and should be used for the further testing and validation of the contamination classification method. By applying the results of this paper on commercial Li-Ion cells, a method for real-time monitoring could be established which will increase the safety of battery modules.

Supplementary Materials

Author Contributions

Conceptualization, P.H., S.F.H., C.E. and W.S.; methodology, P.H., S.F.H. and C.E.; formal analysis, P.H. and B.S.; investigation, P.H.; writing—original draft preparation, P.H.; writing—review and editing, P.H., S.F.H., W.S. and C.E.; visualization, P.H.; supervision, C.E. and W.S.; project administration, S.F.H. and C.E.; funding acquisition, C.E. and W.S. All authors have read and agreed to the published version of the manuscript.

Funding

The presented work was conducted within the scope of PERFORM and SafeLIB. PERFORM has received funding from AVL List GmbH, Graz and the Austrian Research Promotion Agency (FFG) (Grant agreement No. 858566). The COMET Project SafeLIB was funded within the framework of COMET—Competence Centers for Excellent Technologies (Grant agreement No. 882506) by BMK, BMDW, the Province of Upper Austria, the province of Styria as well as SFG. The COMET Program is managed by FFG. The authors thank the consortium members of the SafeLIB project for supporting this work. Supported by the TU Graz Open Access Publishing Fund.

Data Availability Statement

The data presented in this study are available as supplementary material.

Acknowledgments

The authors are grateful for insightful discussions about the approach and results with Martin Wilkening and Lie Hanzu of the Institute for Chemistry and Technology of Materials at the Graz University of Technology. The authors thank Veronika Pregartner for help while performing the experiments. Open Access Funding by Graz University of Technology.

Conflicts of Interest

The authors declare no conflict of interest.

Abbreviations

The following abbreviations are used in this manuscript:
CC-rate
CPEConstant phase element
DRTDistribution of relaxation times
ECMEquivalent circuit model
EISElectrochemical impedance spectroscopy
FIFeature importance
GCPLGalvanostatic cycling with potential limitation
HFHydrofluoric acid
ISCInternal short circuit
LCOLithium–cobalt(III)–oxide (LiCoO2)
Li-IonLithium ion
LiPF6Lithium hexafluorophosphate
LTOLithium titanate oxide (Li4Ti5O12)
MLMachine-learning
NMPN-Methyl-2-pyrrolidone
OCVOpen circuit voltage
PF6Hexafluorophosphate
PEISPotentio electrochemical impedance spectroscopy
SEISolid electrolyte interphase
SOCState of charge
SOHState of health
ZrO2Zirconium dioxide

Appendix A

In the following, the results of a decision tree algorithm with the ECM parameters are illustrated. Different tree depths allow for an examination of the parameter and feature importance for contamination prediction. Figure A1 illustrates the classification results of a decision tree without tree depth limitation.
Figure A1. Feature importance (FI) and the classification of data points into the classes “no contamination” (0) and “contamination” (1) for a decision tree without depth limitation. Brackets indicate (“no contamination” (0) and “contamination” (1)).
Batteries 08 00035 g0a1
The results of a decision tree classifier with a tree depth limitation of one can be taken from Figure A2.
Figure A2. Classification of data points into the classes “no contamination” (0) and “contamination” (1) for a decision tree with tree depth = 1. Brackets indicate (“no contamination” (0), “contamination” (1)).
Batteries 08 00035 g0a2
The results of a decision tree classifier with a tree depth limitation of two can be taken from Figure A3.
Figure A3. The classification of data points into the classes “no contamination”, “contamination—oxygen” and “contamination—water” for a decision tree of depth = 2. Brackets indicate (“no contamination” (0), “contamination—oxygen” (1), “contamination—water” (2)).
Batteries 08 00035 g0a3

References

  1. Shukla, P.; Skea, J.; Slade, R.; Al Khourdajie, A.; van Diemen, R.; McCollum, D.; Pathak, M.; Some, S.; Vyas, P.; Fradera, R.; et al. Climate Change 2022: Mitigation of Climate Change. Contribution of Working Group III to the Sixth Assessment Report of the Intergovernmental Panel on Climate Change; IPPC: Rome, Italy, 2021. [Google Scholar] [CrossRef]
  2. Budde-Meiwes, H.; Drillkens, J.; Lunz, B.; Muennix, J.; Rothgang, S.; Kowal, J.; Sauer, D.U. A review of current automotive battery technology and future prospects. J. Automob. Eng. 2013, 227, 761–776. [Google Scholar] [CrossRef]
  3. Masias, A.; Marcicki, J.; Paxton, W.A. Opportunities and Challenges of Lithium Ion Batteries in Automotive Applications. ACS Energy Lett. 2021, 6, 621–630. [Google Scholar] [CrossRef]
  4. Lu, L.; Han, X.; Li, J.; Hua, J.; Ouyang, M. A review on the key issues for lithium-ion battery management in electric vehicles. J. Power Source 2013, 226, 272–288. [Google Scholar] [CrossRef]
  5. Nishizawa, A.; Kallo, J.; Garrot, O.; Weiss-Ungethüm, J. Fuel cell and Li-ion battery direct hybridization system for aircraft applications. J. Power Source 2013, 222, 294–300. [Google Scholar] [CrossRef]
  6. International Energy Agency. Global EV Outlook 2018. 2018. Available online: https://www.iea.org/reports/global-ev-outlook-2018 (accessed on 4 February 2022).
  7. Chen, Y.; Kang, Y.; Zhao, Y.; Wang, L.; Liu, J.; Li, Y.; Liang, Z.; He, X.; Li, X.; Tavajohi, N.; et al. A review of lithium-ion battery safety concerns: The issues, strategies, and testing standards. J. Energy Chem. 2021, 59, 83–99. [Google Scholar] [CrossRef]
  8. Liu, C.; Xu, D.; Weng, J.; Zhou, S.; Li, W.; Wan, Y.; Jiang, S.; Zhou, D.; Wang, J.; Huang, Q. Phase Change Materials Application in Battery Thermal Management System: A Review. Materials 2020, 13, 4622. [Google Scholar] [CrossRef]
  9. Ouyang, D.; Liu, J.; Chen, M.; Wang, J. Investigation into the Fire Hazards of Lithium-Ion Batteries under Overcharging. Appl. Sci. 2017, 7, 1314. [Google Scholar] [CrossRef] [Green Version]
  10. Abada, S.; Petit, M.; Lecocq, A.; Marlair, G.; Sauvant-Moynot, V.; Huet, F. Combined experimental and modeling approaches of the thermal runaway of fresh and aged lithium-ion batteries. J. Power Source 2018, 399, 264–273. [Google Scholar] [CrossRef] [Green Version]
  11. Feng, X.; Ouyang, M.; Liu, X.; Lu, L.; Xia, Y.; He, X. Thermal runaway mechanism of lithium ion battery for electric vehicles: A review. Energy Storage Mater. 2018, 10, 246–267. [Google Scholar] [CrossRef]
  12. Kaliaperumal, M.; Dharanendrakumar, M.S.; Prasanna, S.; Abhishek, K.V.; Chidambaram, R.K.; Adams, S.; Zaghib, K.; Reddy, M.V. Cause and Mitigation of Lithium-Ion Battery Failure—A Review. Materials 2021, 14, 5676. [Google Scholar] [CrossRef]
  13. Sinz, W.; Feist, F.; Gstrein, G.; Gugler, J.; Tomasch, E.; Breitfuss, C.; Luttenberger, P.; Steffan, H.; Gollob, P.; Hennige, V. Concepts for mechanical abuse testing of high-voltage batteries. In Proceedings of the SAE 2012 World Congress and Exhibition, Detroit, MI, USA, 24–26 April 2012. [Google Scholar] [CrossRef]
  14. Doughty, D.H.; Roth, E.P. A General Discussion of Li Ion Battery Safety. Electrochem. Soc. Interface 2012, 21, 37–44. [Google Scholar] [CrossRef] [Green Version]
  15. Golubkov, A.W.; Fuchs, D.; Wagner, J.; Wiltsche, H.; Stangl, C.; Fauler, G.; Voitic, G.; Thaler, A.; Hacker, V. Thermal-runaway experiments on consumer Li-ion batteries with metal-oxide and olivin-type cathodes. RSC Adv. 2014, 4, 3633–3642. [Google Scholar] [CrossRef] [Green Version]
  16. Hess, S.; Wohlfahrt-Mehrens, M.; Wachtler, M. Flammability of Li-Ion Battery Electrolytes: Flash Point and Self-Extinguishing Time Measurements. J. Electrochem. Soc. 2015, 162, A3084–A3097. [Google Scholar] [CrossRef]
  17. Hendricks, C.; Williard, N.; Mathew, S.; Pecht, M. A failure modes, mechanisms, and effects analysis (FMMEA) of lithium-ion batteries. J. Power Source 2015, 297, 113–120. [Google Scholar] [CrossRef] [Green Version]
  18. Finegan, D.P.; Scheel, M.; Robinson, J.B.; Tjaden, B.; Hunt, I.A.; Mason, T.J.; Millichamp, J.; Di Michiel, M.; Offer, G.J.; Hinds, G.; et al. In-operando high-speed tomography of lithium-ion batteries during thermal runaway. Nat. Commun. 2015, 6, 6924. [Google Scholar] [CrossRef]
  19. Larsson, F.; Andersson, P.; Blomqvist, P.; Lorén, A.; Mellander, B.E. Characteristics of lithium-ion batteries during fire tests. J. Power Source 2014, 271, 414–420. [Google Scholar] [CrossRef]
  20. Larsson, F.; Mellander, B.E. Abuse by External Heating, Overcharge and Short Circuiting of Commercial Lithium-Ion Battery Cells. J. Electrochem. Soc. 2014, 161, A1611–A1617. [Google Scholar] [CrossRef]
  21. Said, A.O.; Lee, C.; Liu, X.; Wu, Z.; Stoliarov, S.I. Simultaneous measurement of multiple thermal hazards associated with a failure of prismatic lithium ion battery. Proc. Combust. Inst. 2019, 37, 4173–4180. [Google Scholar] [CrossRef]
  22. Bugryniec, P.J.; Davidson, J.N.; Cumming, D.J.; Brown, S.F. Pursuing safer batteries: Thermal abuse of LiFePO4 cells. J. Power Source 2019, 414, 557–568. [Google Scholar] [CrossRef] [Green Version]
  23. Sturm, P.; Fössleitner, P.; Fruhwirt, D.; Schirmer, A.; Reinwald, B.; Kühbacher, M.; Wenighofer, R.; Heindl, S.; Nöst, T.; Leonhardt, P.; et al. Brandversuch mit E-Fahrzeugen in Tunnelanlagen. BHM Berg Hüttenmännische Monatshefte 2020, 165, 651–657. [Google Scholar] [CrossRef]
  24. Ardia, P.; Stallone, S.; Cericola, D. A quantification method for Fe based particle contaminants in high purity materials for lithium-ion batteries. Talanta 2021, 224, 121827. [Google Scholar] [CrossRef] [PubMed]
  25. Park, B.K.; Jeong, Y.K.; Yang, S.Y.; Kwon, S.; Yang, J.H.; Kim, Y.M.; Kim, K.J. Deterioration behavior of aluminum pouch film used as packaging materials for pouch-type lithium-ion batteries. J. Power Source 2021, 506, 230222. [Google Scholar] [CrossRef]
  26. Aurbach, D.; Weissman, I.; Zaban, A.; Dan, P. On the role of water contamination in rechargeable Li batteries. Electrochim. Acta 1999, 45, 1135–1140. [Google Scholar] [CrossRef]
  27. Stich, M.; Pandey, N.; Bund, A. Drying and moisture resorption behaviour of various electrode materials and separators for lithium-ion batteries. J. Power Source 2017, 364, 84–91. [Google Scholar] [CrossRef]
  28. Plakhotnyk, A.V.; Ernst, L.; Schmutzler, R. Hydrolysis in the system LiPF6—Propylene carbonate—Dimethyl carbonate—H2O. J. Fluor. Chem. 2005, 126, 27–31. [Google Scholar] [CrossRef]
  29. Wang, H.; Yoshio, M. Effect of water contamination in the organic electrolyte on the performance of activated carbon/graphite capacitors. J. Power Source 2010, 195, 389–392. [Google Scholar] [CrossRef]
  30. Terborg, L.; Nowak, S.; Passerini, S.; Winter, M.; Karst, U.; Haddad, P.R.; Nesterenko, P.N. Ion chromatographic determination of hydrolysis products of hexafluorophosphate salts in aqueous solution. Anal. Chim. Acta 2012, 714, 121–126. [Google Scholar] [CrossRef]
  31. Lux, S.F.; Lucas, I.T.; Pollak, E.; Passerini, S.; Winter, M.; Kostecki, R. The mechanism of HF formation in LiPF6 based organic carbonate electrolytes. Electrochem. Commun. 2012, 14, 47–50. [Google Scholar] [CrossRef] [Green Version]
  32. Fang, Z.; Confer, M.P.; Wang, Y.; Wang, Q.; Kunz, M.R.; Dufek, E.J.; Liaw, B.; Klein, T.M.; Dixon, D.A.; Fushimi, R. Formation of Surface Impurities on Lithium-Nickel-Manganese-Cobalt Oxides in the Presence of CO2 and H2O. J. Am. Chem. Soc. 2021, 143, 10261–10274. [Google Scholar] [CrossRef]
  33. Zaghib, K.; Dontigny, M.; Charest, P.; Labrecque, J.F.; Guerfi, A.; Kopec, M.; Mauger, A.; Gendron, F.; Julien, C.M. Aging of LiFePO4 upon exposure to H2O. J. Power Source 2008, 185, 698–710. [Google Scholar] [CrossRef]
  34. Cho, M.H.; Trottier, J.; Gagnon, C.; Hovington, P.; Clément, D.; Vijh, A.; Kim, C.S.; Guerfi, A.; Black, R.; Nazar, L.; et al. The effects of moisture contamination in the Li-O2 battery. J. Power Source 2014, 268, 565–574. [Google Scholar] [CrossRef]
  35. Zheng, L.Q.; Li, S.J.; Lin, H.J.; Miao, Y.Y.; Zhu, L.; Zhang, Z.J. Effects of water contamination on the electrical properties of 18650 lithium-ion batteries. Russ. J. Electrochem. 2014, 50, 904–907. [Google Scholar] [CrossRef]
  36. Kitz, P.G.; Novák, P.; Berg, E.J. Influence of Water Contamination on the SEI Formation in Li-Ion Cells: An Operando EQCM-D Study. ACS Appl. Mater. Interfaces 2020, 12, 15934–15942. [Google Scholar] [CrossRef] [PubMed]
  37. Jung, R.; Metzger, M.; Maglia, F.; Stinner, C.; Gasteiger, H.A. Oxygen Release and Its Effect on the Cycling Stability of LiNixMnyCozO2 (NMC) Cathode Materials for Li-Ion Batteries. J. Electrochem. Soc. 2017, 164, A1361–A1377. [Google Scholar] [CrossRef]
  38. Zhang, S.S.; Tran, D.T. Pyrite FeS2 as an in situ oxygen remover for rechargeable batteries with layered cathode materials. J. Power Source 2018, 403, 167–172. [Google Scholar] [CrossRef]
  39. Kovachev, G.; Ellersdorfer, C.; Gstrein, G.; Hanzu, I.; Wilkening, H.M.R.; Werling, T.; Schauwecker, F.; Sinz, W. Safety assessment of electrically cycled cells at high temperatures under mechanical crush loads. eTransportation 2020, 6, 100087. [Google Scholar] [CrossRef]
  40. Liu, L.; Feng, X.; Zhang, M.; Lu, L.; Han, X.; He, X.; Ouyang, M. Comparative study on substitute triggering approaches for internal short circuit in lithium-ion batteries. Appl. Energy 2020, 259, 114143. [Google Scholar] [CrossRef]
  41. Huang, L.; Liu, L.; Lu, L.; Feng, X.; Han, X.; Li, W.; Zhang, M.; Li, D.; Liu, X.; Sauer, D.U.; et al. A review of the internal short circuit mechanism in lithium–ion batteries: Inducement, detection and prevention. Int. J. Energy Res. 2021, 45, 15797–15831. [Google Scholar] [CrossRef]
  42. Lai, X.; Jin, C.; Yi, W.; Han, X.; Feng, X.; Zheng, Y.; Ouyang, M. Mechanism, modeling, detection, and prevention of the internal short circuit in lithium-ion batteries: Recent advances and perspectives. Energy Storage Mater. 2021, 35, 470–499. [Google Scholar] [CrossRef]
  43. Orendorff, C.J.; Roth, E.P.; Nagasubramanian, G. Experimental triggers for internal short circuits in lithium-ion cells. J. Power Source 2011, 196, 6554–6558. [Google Scholar] [CrossRef]
  44. Coman, P.T.; Darcy, E.C.; Veje, C.T.; White, R.E. Modelling Li-Ion Cell Thermal Runaway Triggered by an Internal Short Circuit Device Using an Efficiency Factor and Arrhenius Formulations. J. Electrochem. Soc. 2017, 164, A587–A593. [Google Scholar] [CrossRef] [Green Version]
  45. Finegan, D.P.; Darcy, E.; Keyser, M.; Tjaden, B.; Heenan, T.M.M.; Jervis, R.; Bailey, J.J.; Malik, R.; Vo, N.T.; Magdysyuk, O.V.; et al. Characterising thermal runaway within lithium-ion cells by inducing and monitoring internal short circuits. Energy Environ. Sci. 2017, 10, 1377–1388. [Google Scholar] [CrossRef] [Green Version]
  46. Fang, W.; Ramadass, P.; Zhang, Z. Study of internal short in a Li-ion cell—II. Numerical investigation using a 3D electrochemical-thermal model. J. Power Source 2014, 248, 1090–1098. [Google Scholar] [CrossRef]
  47. Ramadass, P.; Fang, W.; Zhang, Z. Study of internal short in a Li-ion cell I. Test method development using infra-red imaging technique. J. Power Source 2014, 248, 769–776. [Google Scholar] [CrossRef]
  48. Zhang, M.; Du, J.; Liu, L.; Stefanopoulou, A.; Siegel, J.; Lu, L.; He, X.; Xie, X.; Ouyang, M. Internal Short Circuit Trigger Method for Lithium-Ion Battery Based on Shape Memory Alloy. J. Electrochem. Soc. 2017, 164, A3038–A3044. [Google Scholar] [CrossRef] [Green Version]
  49. Wang, X.; Yasukawa, E.; Mori, S. Inhibition of anodic corrosion of aluminum cathode current collector on recharging in lithium imide electrolytes. Electrochim. Acta 2000, 45, 2677–2684. [Google Scholar] [CrossRef]
  50. Volck, T.; Sinz, W.; Gstrein, G.; Breitfuss, C.; Heindl, S.F.; Steffan, H.; Freunberger, S.A.; Wilkening, M.; Uitz, M.; Fink, C.; et al. Method for Determination of the Internal Short Resistance and Heat Evolution at Different Mechanical Loads of a Lithium Ion Battery Cell Based on Dummy Pouch Cells. Batteries 2016, 2, 8. [Google Scholar] [CrossRef]
  51. Santhanagopalan, S.; Ramadass, P.; Zhang, J. Analysis of internal short-circuit in a lithium ion cell. J. Power Source 2009, 194, 550–557. [Google Scholar] [CrossRef]
  52. Meddings, N.; Heinrich, M.; Overney, F.; Lee, J.S.; Ruiz, V.; Napolitano, E.; Seitz, S.; Hinds, G.; Raccichini, R.; Gaberšček, M.; et al. Application of electrochemical impedance spectroscopy to commercial Li-ion cells: A review. J. Power Source 2020, 480, 228742. [Google Scholar] [CrossRef]
  53. Mc Carthy, K.; Gullapalli, H.; Ryan, K.M.; Kennedy, T. Review—Use of Impedance Spectroscopy for the Estimation of Li-ion Battery State of Charge, State of Health and Internal Temperature. J. Electrochem. Soc. 2021, 168, 080517. [Google Scholar] [CrossRef]
  54. Wang, X.; Wei, X.; Zhu, J.; Dai, H.; Zheng, Y.; Xu, X.; Chen, Q. A review of modeling, acquisition, and application of lithium-ion battery impedance for onboard battery management. eTransportation 2021, 7, 100093. [Google Scholar] [CrossRef]
  55. Hu, X.; Zhang, K.; Liu, K.; Lin, X.; Dey, S.; Onori, S. Advanced Fault Diagnosis for Lithium-Ion Battery Systems: A Review of Fault Mechanisms, Fault Features, and Diagnosis Procedures. IEEE Ind. Electron. Mag. 2020, 14, 65–91. [Google Scholar] [CrossRef]
  56. Naha, A.; Khandelwal, A.; Agarwal, S.; Tagade, P.; Hariharan, K.S.; Kaushik, A.; Yadu, A.; Kolake, S.M.; Han, S.; Oh, B. Internal short circuit detection in Li-ion batteries using supervised machine learning. Sci. Rep. 2020, 10, 1301. [Google Scholar] [CrossRef] [PubMed]
  57. Zhang, Y.; Tang, Q.; Zhang, Y.; Wang, J.; Stimming, U.; Lee, A.A. Identifying degradation patterns of lithium ion batteries from impedance spectroscopy using machine learning. Nat. Commun. 2020, 11, 1706. [Google Scholar] [CrossRef]
  58. Vidal, C.; Malysz, P.; Kollmeyer, P.; Emadi, A. Machine Learning Applied to Electrified Vehicle Battery State of Charge and State of Health Estimation: State-of-the-Art. IEEE Access 2020, 8, 52796–52814. [Google Scholar] [CrossRef]
  59. Lombardo, T.; Duquesnoy, M.; El-Bouysidy, H.; Årén, F.; Gallo-Bueno, A.; Jørgensen, P.B.; Bhowmik, A.; Demortière, A.; Ayerbe, E.; Alcaide, F.; et al. Artificial Intelligence Applied to Battery Research: Hype or Reality? Chem. Rev. 2021. [Google Scholar] [CrossRef]
  60. Samanta, A.; Chowdhuri, S.; Williamson, S.S. Machine Learning-Based Data-Driven Fault Detection/Diagnosis of Lithium-Ion Battery: A Critical Review. Electronics 2021, 10, 1309. [Google Scholar] [CrossRef]
  61. Nemeth, T.; Schröer, P.; Kuipers, M.; Sauer, D.U. Lithium titanate oxide battery cells for high-power automotive applications—Electro-thermal properties, aging behavior and cost considerations. J. Energy Storage 2020, 31, 101656. [Google Scholar] [CrossRef]
  62. Han, X.; Ouyang, M.; Lu, L.; Li, J. Cycle Life of Commercial Lithium-Ion Batteries with Lithium Titanium Oxide Anodes in Electric Vehicles. Energies 2014, 7, 4895–4909. [Google Scholar] [CrossRef] [Green Version]
  63. Hu, X.; Li, S.; Peng, H. A comparative study of equivalent circuit models for Li-ion batteries. J. Power Source 2012, 198, 359–367. [Google Scholar] [CrossRef]
  64. Wang, Q.; Jiang, B.; Li, B.; Yan, Y. A critical review of thermal management models and solutions of lithium-ion batteries for the development of pure electric vehicles. Renew. Sustain. Energy Rev. 2016, 64, 106–128. [Google Scholar] [CrossRef]
  65. Plett, G.L. Battery Modeling; Battery Management Systems; Artech House: Norwood, MA, USA, 2015; Volume I. [Google Scholar]
  66. Plett, G.L. Equivalent-Circuit Methods. Battery Management Systems; Artech House: Norwood, MA, USA, 2016; Volume II. [Google Scholar]
  67. Liu, H.; Wei, Z.; He, W.; Zhao, J. Thermal issues about Li-ion batteries and recent progress in battery thermal management systems: A review. Energy Convers. Manag. 2017, 150, 304–330. [Google Scholar] [CrossRef]
  68. Tran, M.K.; DaCosta, A.; Mevawalla, A.; Panchal, S.; Fowler, M. Comparative Study of Equivalent Circuit Models Performance in Four Common Lithium-Ion Batteries: LFP, NMC, LMO, NCA. Batteries 2021, 7, 51. [Google Scholar] [CrossRef]
  69. Scribner Associates. ZView® for Windows—Scribner Associates. Available online: https://www.scribner.com/software/68-general-electrochemistr376-zview-for-windows/ (accessed on 20 October 2021).
  70. Lasia, A. The Origin of the Constant Phase Element. J. Phys. Chem. Lett. 2022, 13, 580–589. [Google Scholar] [CrossRef] [PubMed]
  71. Andre, D.; Meiler, M.; Steiner, K.; Wimmer, C.; Soczka-Guth, T.; Sauer, D.U. Characterization of high-power lithium-ion batteries by electrochemical impedance spectroscopy. I. Experimental investigation. J. Power Source 2011, 196, 5334–5341. [Google Scholar] [CrossRef]
  72. Fernández Pulido, Y.; Blanco, C.; Anseán, D.; García, V.M.; Ferrero, F.; Valledor, M. Determination of suitable parameters for battery analysis by Electrochemical Impedance Spectroscopy. Measurement 2017, 106, 1–11. [Google Scholar] [CrossRef] [Green Version]
  73. Nisar, U.; Muralidharan, N.; Essehli, R.; Amin, R.; Belharouak, I. Valuation of Surface Coatings in High-Energy Density Lithium-ion Battery Cathode Materials. Energy Storage Mater. 2021, 38, 309–328. [Google Scholar] [CrossRef]
  74. Wiemers-Meyer, S.; Jeremias, S.; Winter, M.; Nowak, S. Influence of Battery Cell Components and Water on the Thermal and Chemical Stability of LiPF6 Based Lithium Ion Battery Electrolytes. Electrochim. Acta 2016, 222, 1267–1271. [Google Scholar] [CrossRef]
Figure 1. Solving the approach to approve the feasibility of the novel contamination trigger and the ability of a decision tree algorithm to predict a contamination.
Batteries 08 00035 g001
Figure 2. Assembled specimen (a) and principle sketches of specimen prepared for contamination with water (b) and oxygen (c). 1—pouch; 2—electrode stack; 3—negative copper tab; 4—positive aluminum tab; 5—glass container; 6—ZrO2 plate; 7—self-healing injection port; 8—separator; 9—hot melt adhesive. (a) Specimen. (b) Water contamination. (c) Oxygen contamination.
Batteries 08 00035 g002
Figure 3. Glass container filled with 2 μ L of water for assembly inside the specimen.
Batteries 08 00035 g003
Figure 4. Test procedure for the specimen. OCV—open circuit voltage; PEIS—potentio electrochemical impedance spectroscopy; GCPL—galvanostatic cycling with potential limitation between 1.5 V and 2.8 V consisting of 10 charge and discharge cycles (= 1 loop).
Batteries 08 00035 g004
Figure 5. Schematic illustration of an impedance spectrum in a Nyquist plot and the equivalent circuit model (ECM) used in this study with its correlating impedance segments.
Batteries 08 00035 g005
Figure 6. State of health (SOH) and Coulombic efficiency over the number of cycles for different contamination types. First column—reference specimens. Second column—specimens with water contamination. Third column—specimens with oxygen contamination. Dashed vertical lines indicate the contamination initiation cycle.
Batteries 08 00035 g006
Figure 7. Electrochemical impedance spectra for specimens during cycling. First column—reference specimens. Second column—specimens with water contamination. Third column—specimens with oxygen contamination. A lower limit was indicated by the first loop. The upper limit can be taken from Table 2. The dashed line represents specimens after contamination.
Batteries 08 00035 g007
Figure 8. Prediction of classes “no contamination” (0) and “contamination” (1) with a decision tree of depth = 1 based on R 1 , n o r m a l i z e d . Blue—decision tree; green—experiment. * Training data—data set was used as training data for the decision tree.
Batteries 08 00035 g008
Figure 9. Prediction of classes “no contamination” (0), “contamination—oxygen” (1) and “contamination—water” (2) with a decision tree of a depth of two based on R 1 , n o r m a l i z e d , C P E 1 , n o r m a l i z e d P and R 2 , n o r m a l i z e d . Blue—decision tree. Green—experiment. * Training data—data set was used as training data for the decision tree.
Batteries 08 00035 g009
Table 1. Chemical composition of the electrode slurry and the applied layer thickness.
LCO
wt%
LTO
wt%
Super C65
wt%
Electrode Binder
wt%
Layer Thickness
μ m
Cathode88.3-6.35.450
Anode-80.013.07.0200
wt%—weight percentage.
Table 2. Test matrix consisting of specimens with corresponding capacity after formation (10 cycles), contamination type and contamination cycle.
Specimen No.Capacity after Formation
mAh
LoopsContaminationContamination Cycle
01 *0.750Reference-
02 2.450Reference-
03 *2.611Reference-
04 2.211Reference-
05 *1.811Water60
06 *1.111Water50
07 2.611Water50
08 *1.822Water110
09 *2.221Oxygen100
10 *1.822Oxygen110
11 *2.522Oxygen110
* Training data—data set was used as training data for the decision tree, as can be seen in Section 2.5.
Table 3. Average goodness of fit expressed in terms of χ 2 for the fitted EIS measurements with the equivalent circuit with the ECM parameters R 0 , R 1 , R 2 , C P E 1 and C P E 2 .
Specimen No.ContaminationAverage χ 2
before Contamination
Average χ 2
after Contamination
01Reference1.06 × 10−4-
02Reference5.90 × 10−4-
03Reference1.93 × 10−3-
04Reference6.49 × 10−4-
05Water1.46 × 10−32.20 × 10⁻⁴
06Water1.79 × 10−42.09 × 10⁻⁴
07Water6.99 × 10−31.56 × 10⁻³
08Water8.03 × 10−34.04 × 10⁻³
09Oxygen2.58 × 10−32.37 × 10⁻³
10Oxygen1.17 × 10−22.24 × 10⁻³
11Oxygen7.94 × 10−43.10 × 10⁻⁴
Publisher’s Note: MDPI stays neutral with regard to jurisdictional claims in published maps and institutional affiliations.

