Article

A Method for Detecting the Existence of an Over-Discharged Cell in a Lithium-Ion Battery Pack via Measuring Total Harmonic Distortion

Department of Energy and Automation Technology, Electrical Energy Storage Technology, Technical University of Berlin, Einsteinufer 11, 10587 Berlin, Germany
*
Author to whom correspondence should be addressed.
Batteries 2022, 8(3), 26; https://doi.org/10.3390/batteries8030026
Submission received: 11 February 2022 / Revised: 14 March 2022 / Accepted: 17 March 2022 / Published: 21 March 2022

Abstract

:
This paper deals with a method to detect the existence of an over-discharged cell in a lithium-ion battery (LIB) pack by measuring the total harmonic distortion (THD) rate in the voltage response. Over-discharge of the LIB cell reduces the available capacity by irreversible chemical reactions, resulting in serious safety risks such as explosions. Even if only one over-discharged cell exists in the battery pack, it accelerates the decomposition of other cells. In general, the measurement of each cell voltage in a battery pack is required to detect one over-discharged cell. This is because if only the voltage of the battery pack is measured, it cannot be distinguished whether the voltage of each cell is uniformly low or one specific weak cell is over-discharged. The proposed method measures the frequency response through the voltage at only two terminals of the battery pack to detect the presence of one over-discharged cell. When the battery cell is discharged beyond a certain level, the system nonlinearity of the battery pack increases, and it can be detected from the increased THD rate of the battery pack. The proposed method is verified by simulation and measurement.

1. Introduction

Interest in eco-friendly energy sources is increasing around the world. The reason for this may be that rapid industrialization and the use of fossil fuel resources accelerate climate change, such as greenhouse effects caused by carbon dioxide. Secondary batteries are considered eco-friendly because they can be recharged, unlike primary batteries, which cannot be reused after a complete discharge. The use of a secondary battery not only reduces the consumption of resources required for making additional cells but also reduces the generation of environmental substances in the disposal process. Lithium secondary batteries use lithium ions as charging carriers in electrodes and electrolytes. They are widely used in a variety of applications [1,2,3] because they not only have a high energy density, but also show little self-discharge and memory effects and have a stable performance and long cycle life. However, batteries with high energy have a high safety risk against battery failure [4,5], thus there is a growing demand to improve battery management system (BMS) technology.
Lithium-ion battery (LIB) cells are connected as a battery pack or module. They are connected in series to reach the required voltage level and in parallel to reach a sufficient capacity. When the battery pack is used, the probability of failure is higher than when a single battery cell is used, and the probability of failure of a battery pack to which n cells are connected exceeds n times that of the single-cell failure. Moreover, the management of battery packs in which cells are connected in series is particularly important, since each cell connected in series suffers a different load even if the same current flows, resulting in a voltage deviation, while battery cells connected in parallel always have the same voltage.
Factors affecting cell imbalance are divided into intrinsic factors and extrinsic factors [6,7]. Intrinsic factors are related to the manufacturing process, such as capacity, impedance, amount of active material, and self-discharge rate, while extrinsic factors are related to the cell connection method, charge/discharge current, and heat dispersion. A temperature deviation of cells in the battery pack affects cell characteristics, including the self-discharge speed, resulting in performance deviation, and an external circuit connected to the cells for management also exacerbates the cell imbalance. The series-connected cells in the battery pack are charged and discharged at different rates, and the deviation of individual cells gradually increases, making them vulnerable to being overcharged or over-discharged [8,9,10]. Consequently, the capacity of the battery cell is gradually lost, the cycle life is shortened [11,12,13], and fatal failures may occur [14,15]. Even though one cell in the battery pack is over-discharged or over-charged, the degradation of connected cells is sequentially accelerated due to the imbalance [12,16,17].
In general, the BMS monitors whether each cell voltage in the LIB pack is within a safe range. This is because the battery pack voltage may still remain in the normal range while one weak cell is being over-discharged. This can be explained by Figure 1.
Suppose that the total voltages of the connected cells in Figure 1a,b are the same. It is ideal if the voltages of the cells connected in series are uniform as illustrated in Figure 1a, but in real applications, the voltage deviation of each cell gradually increases as illustrated in Figure 1b, i.e., from the measured voltage of the battery pack, it may be considered that cells could be further discharged as illustrated in Figure 1a, but some cells may be in danger of being over-discharged as illustrated in Figure 1b. However, measuring the voltage of each cell in a battery pack/module with hundreds to thousands of cells connected increases the complexity of the circuit.
This paper aims to detect the over-discharge of a weak cell in a battery pack in advance without measuring the voltage of each cell. The presence of a cell facing the risk of over-discharge can be detected by measuring the total harmonic distortion (THD) of the battery pack because cells increase the nonlinearity of the battery system at a low state of charge (SoC).
THD analysis belongs to a non-invasive method that uses frequency responses for system analysis. An understanding of electrochemical and physical processes is required to obtain a better performance and safer operation of LIBs, and electrochemical impedance spectroscopy (EIS) is well known as a non-destructive measurement technique used for this purpose [18,19]. EIS is used to determine the dynamic behavior of electrochemical systems [20,21] by obtaining a characteristic impedance spectrum at a wide range of frequencies from several mHz to several kHz [22,23,24,25]. Because a specific characteristic frequency range is related to each specific process [18], a model structure can be used to measure the parameters of a battery cell, in which the model structure is determined by the cell SoC, state of health (SoH), aging, temperature, internal defect, etc. [26,27,28]. With the improvement of the EIS analysis technique, the impedance during the operation of the LIB cell is measured to monitor cell states such as SoH and SoC [29,30,31,32,33,34]. However, since EIS analysis is only valid in linear systems, the pseudo-linearity of electrochemical systems must be premised. The operation of LIBs belonging to electrochemical battery cells involves nonlinear processes, thus EIS is not suitable for the analysis of such dynamic information.
Behavior due to nonlinear dynamics of LIBs can be measured through THD analysis. THD is defined as the ratio of the total power of all harmonic components to the power of fundamental frequencies, also known as a distortion factor. When ω is input as a fundamental frequency into a nonlinear system, additional nω components, which are multiples of the fundamental frequency, appear in the frequency response. These additional components are called harmonics. THD represents the ratio of the harmonics to the fundamental frequency, indicating the degree of nonlinearity of the system. In particular, the THD used in this paper is THD + N, which is the addition of noise to THD to make it more suitable for use in devices and is expressed by Equation (1).
THD + N   = V n 2 + Noise 2 V 1 2 × 100   %
where Vn is the RMS of the n-th harmonic components and V1 is the RMS of the fundamental component.
THD is one of the nonlinearity analysis methods applied to various research fields. In general, it is used in acoustic research for noise detection [35], and it can be applied as a quality standard for linearity evaluation and is used to measure nonlinearity that reduces the reliability of EIS measurements [36,37]. Additionally, it is used to characterize the electrode material and electrochemical reaction of the redox systems [38,39,40,41]. When THD is used for methanol oxidation kinetics and methanol concentration analysis in direct methanol fuel cells, it shows better results than when EIS is used [42,43], and THD is also used to estimate the SoC of the lead-acid battery [44]. Harting et al. [45] analyzed the aging of lithium-ion battery cells by applying the nonlinear frequency response analysis (NFRA). According to this study, harmonics due to nonlinearity are measured as larger at lower frequencies and are not well revealed at frequencies higher than 200 Hz.
In this paper, a 1 Hz frequency is used as the fundamental frequency, i.e., the over-discharge of a cell in the battery pack can be monitored every 1 s. The higher the test frequency, the smaller the magnitude of the harmonics becomes, which causes a problem in the signal-to-noise ratio (SNR) and thus makes it difficult to measure THD. Conversely, the use of lower test frequencies increases the magnitude of harmonics, which can benefit from the SNR, but increases the interval for monitoring.

1.1. Definition of Key Terms

1.1.1. Definition of SoC

In this paper, the SoC of the battery cell is defined as the ratio of the capacity when fully charged under the appropriate charging conditions proposed by the manufacturer to the residual capacity of the cell. This is expressed by Equation (2).
SoC = C residual / C full × 100   %
where C residual is the residual cell capacity, and C full is the cell capacity when fully charged.
In contrast, the depth of discharge (DoD) is defined as (100%–SoC), i.e., a cell of 60% SoC has the same meaning as a cell of 40% DoD.

1.1.2. Definition of SoH

The battery cycle life refers to the total number of full charge/discharge cycles that can be achieved, and in this paper, SoH is defined as the ratio of the nominal capacity of the cell to the maximum available capacity in the present cell state. This is expressed by Equation (3).
SoH % = Q present Q nominal × 100   %
where Q present is the maximum available cell capacity of the present condition and Q nominal is the nominal capacity.

2. Simulation and Measurement

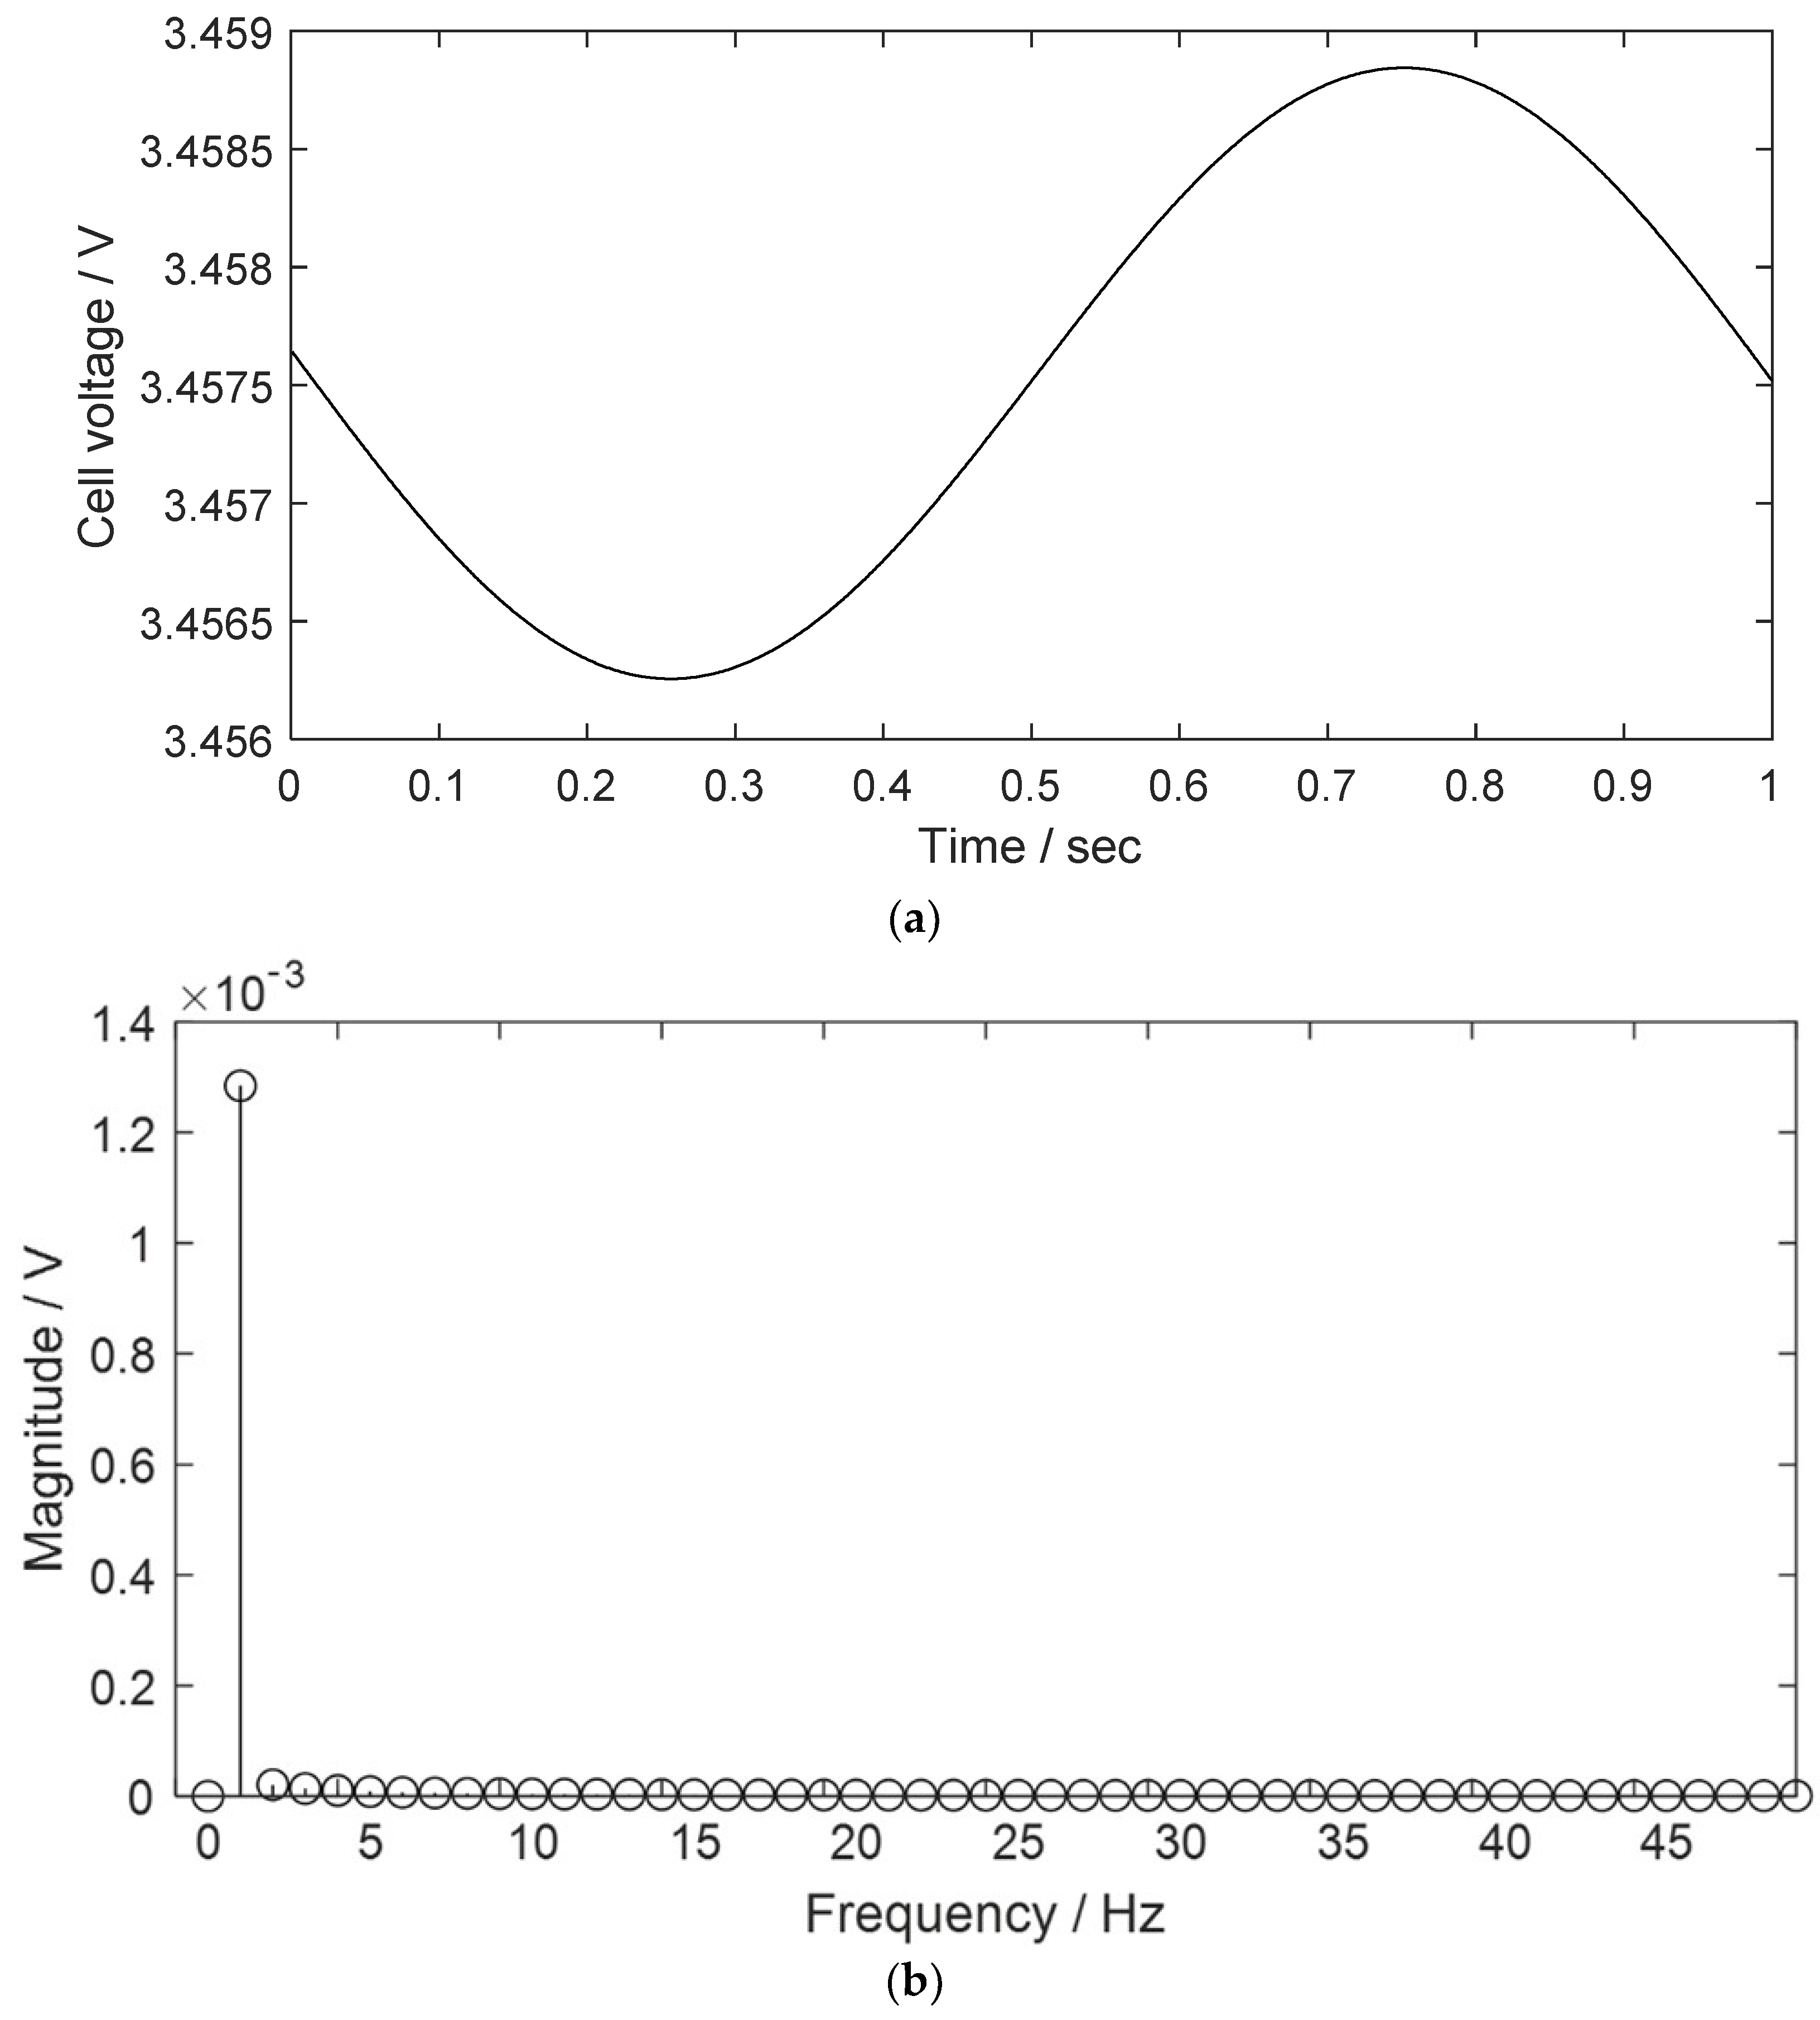
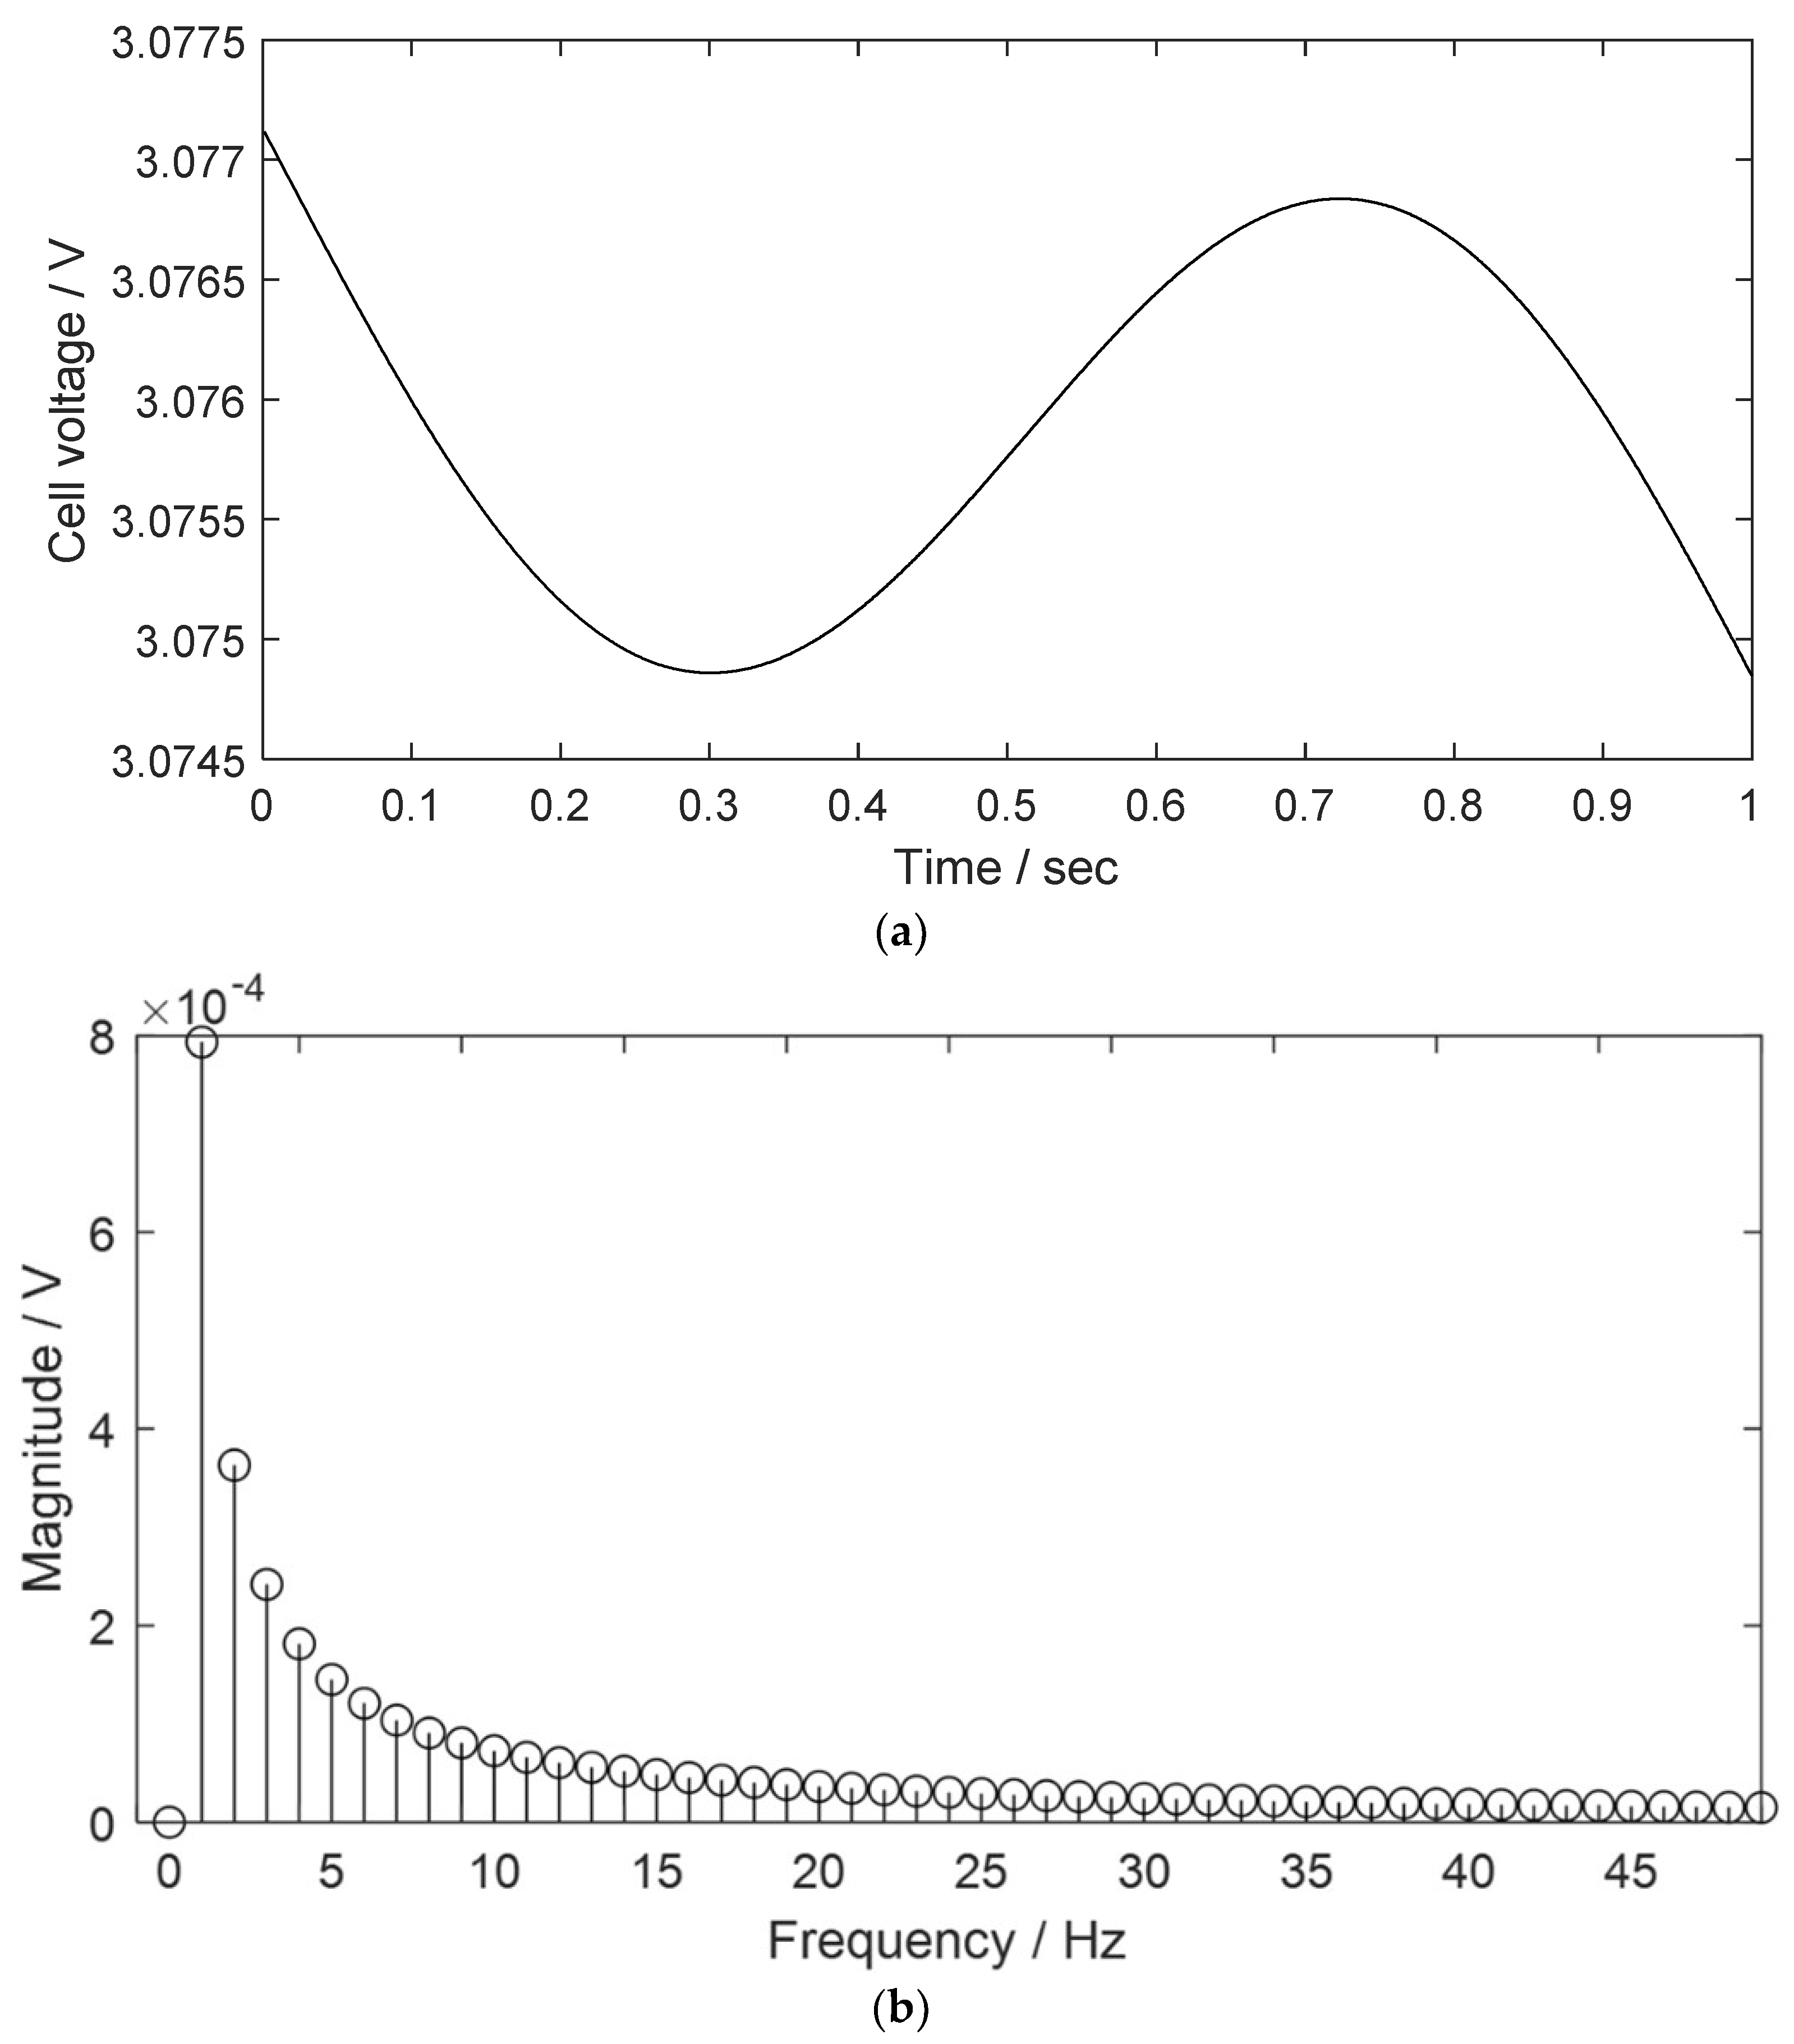
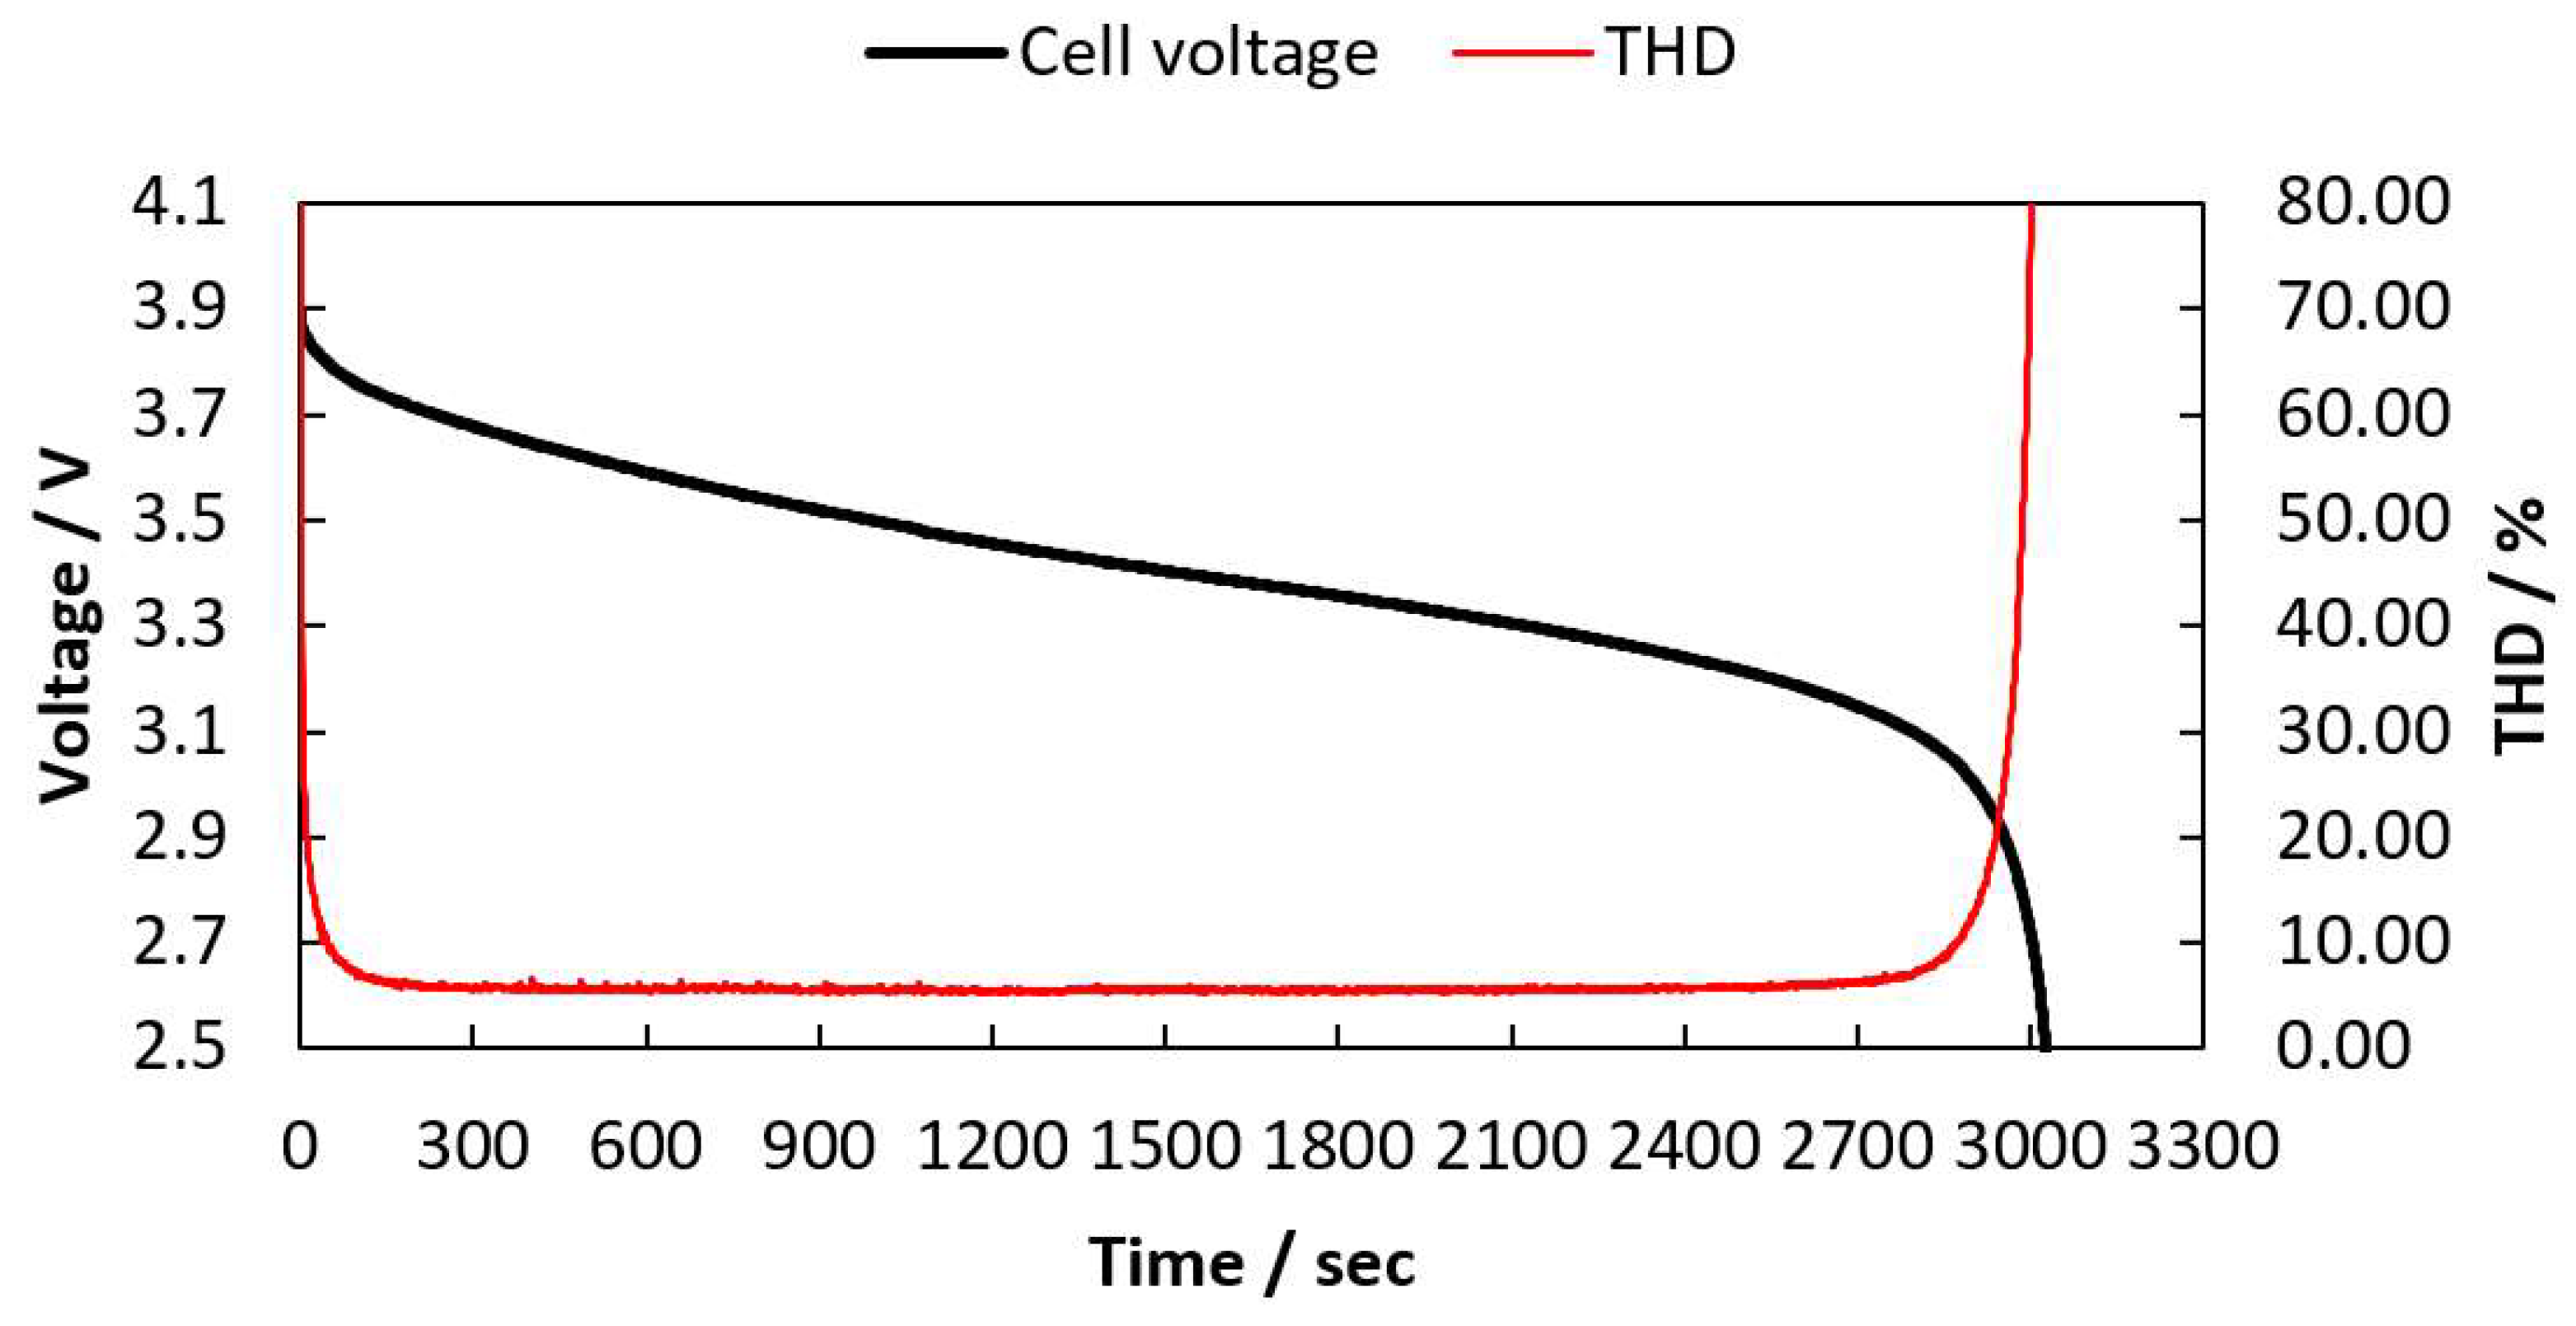
2.1. THD Simulation of a LIB Cell Being Discharged

The LIB cell simulation model of reference [30] is used to verify the proposed method. This model is an electrical equivalent circuit model of an LIB developed to simulate the frequency response of LIB cells during discharge. Three parallel RC networks are used in this model, and cell SoC, SoH, temperature, and operating current are considered for voltage response simulation.
Figure 2 shows the voltage, 1 Hz impedance, and THD of the cell simulated during the discharge. Table 1 shows the simulation conditions.
In Figure 2, the cell voltage, 1 Hz impedance, and THD are continuously calculated every second while the battery cell is discharged. It is shown that a 1 Hz impedance cannot be obtained properly at the beginning of the cell discharge and at the deep DoD. These two ranges are indicated in gray. The reason impedance cannot be correctly obtained in these two areas is not a problem with the simulation model, but because of the nonlinearity in the cell voltage output. The method of measuring cell impedance using the frequency response can only be obtained correctly when the linearity condition is satisfied [41]. Even if the battery cell is discharged with a constant current, the cell voltage shows nonlinearity due to activation polarization and concentration polarization [46]. In these areas, the THD increases due to the occurrence of harmonics because of the system nonlinearity.
Figure 3 and Figure 4 show the cell voltages for 1 s simulated at 50% and 2% cell SoCs, respectively, in the time domain and frequency domain.
In Figure 3, THD simulated at cell SoC of 50% is 2.59%. Figure 3a shows insignificant distortion in the form of a 1 Hz sine wave in the time domain, and components other than the fundamental frequency 1 Hz are rarely shown in Figure 3b.
In Figure 4, the THD simulated at a cell SoC of 2% is 73.49%. Figure 4a shows a noticeably distorted 1 Hz sine wave in the time domain, and components other than the fundamental frequency 1 Hz are shown in the frequency domain in Figure 4b.

2.2. THD Measurement of a LIB Cell Being Discharged

In this section, the cell voltage and THD are measured while one LIB cell is discharged. The measurement system and the lithium cobalt oxide (LCO) battery cell in reference [29] are used to measure the frequency response of the cell during discharge.
In this paper, the connection device shown in Figure 5 is used in addition to the measurement system. Three cells of the same type are connected to this device. The joints of the battery sockets are in the form of pins, which reduces the contact resistance and allows them to have consistent contact resistance by having a consistent contact area.
V 1 , V 2 , and V 3 are used to measure each cell voltage, and V 4 is used to measure the voltage of the total cell. C out is used to control the current flowing through battery cells using electronic loads.
Figure 6 shows the cell voltage as well as THD while the cell is discharged. The recommended lower cut-off voltage from the cell manufacturer is 2.8 V, but the cell is discharged to 2.5 V for measurement while the cell is being over-discharged. A cell with a 90% SoH is used for the measurement, and other experimental conditions are the same as those in Table 1.
Figure 6 shows that THD is measured as higher at the beginning and end of the cell discharge. THDs measured at different cell voltages are listed in Table 2.
An increase in THD when the cell is over-discharged below 2.8 V is especially remarkable, and it is shown that the THD of the cell increases even before the cell over-discharge starts.

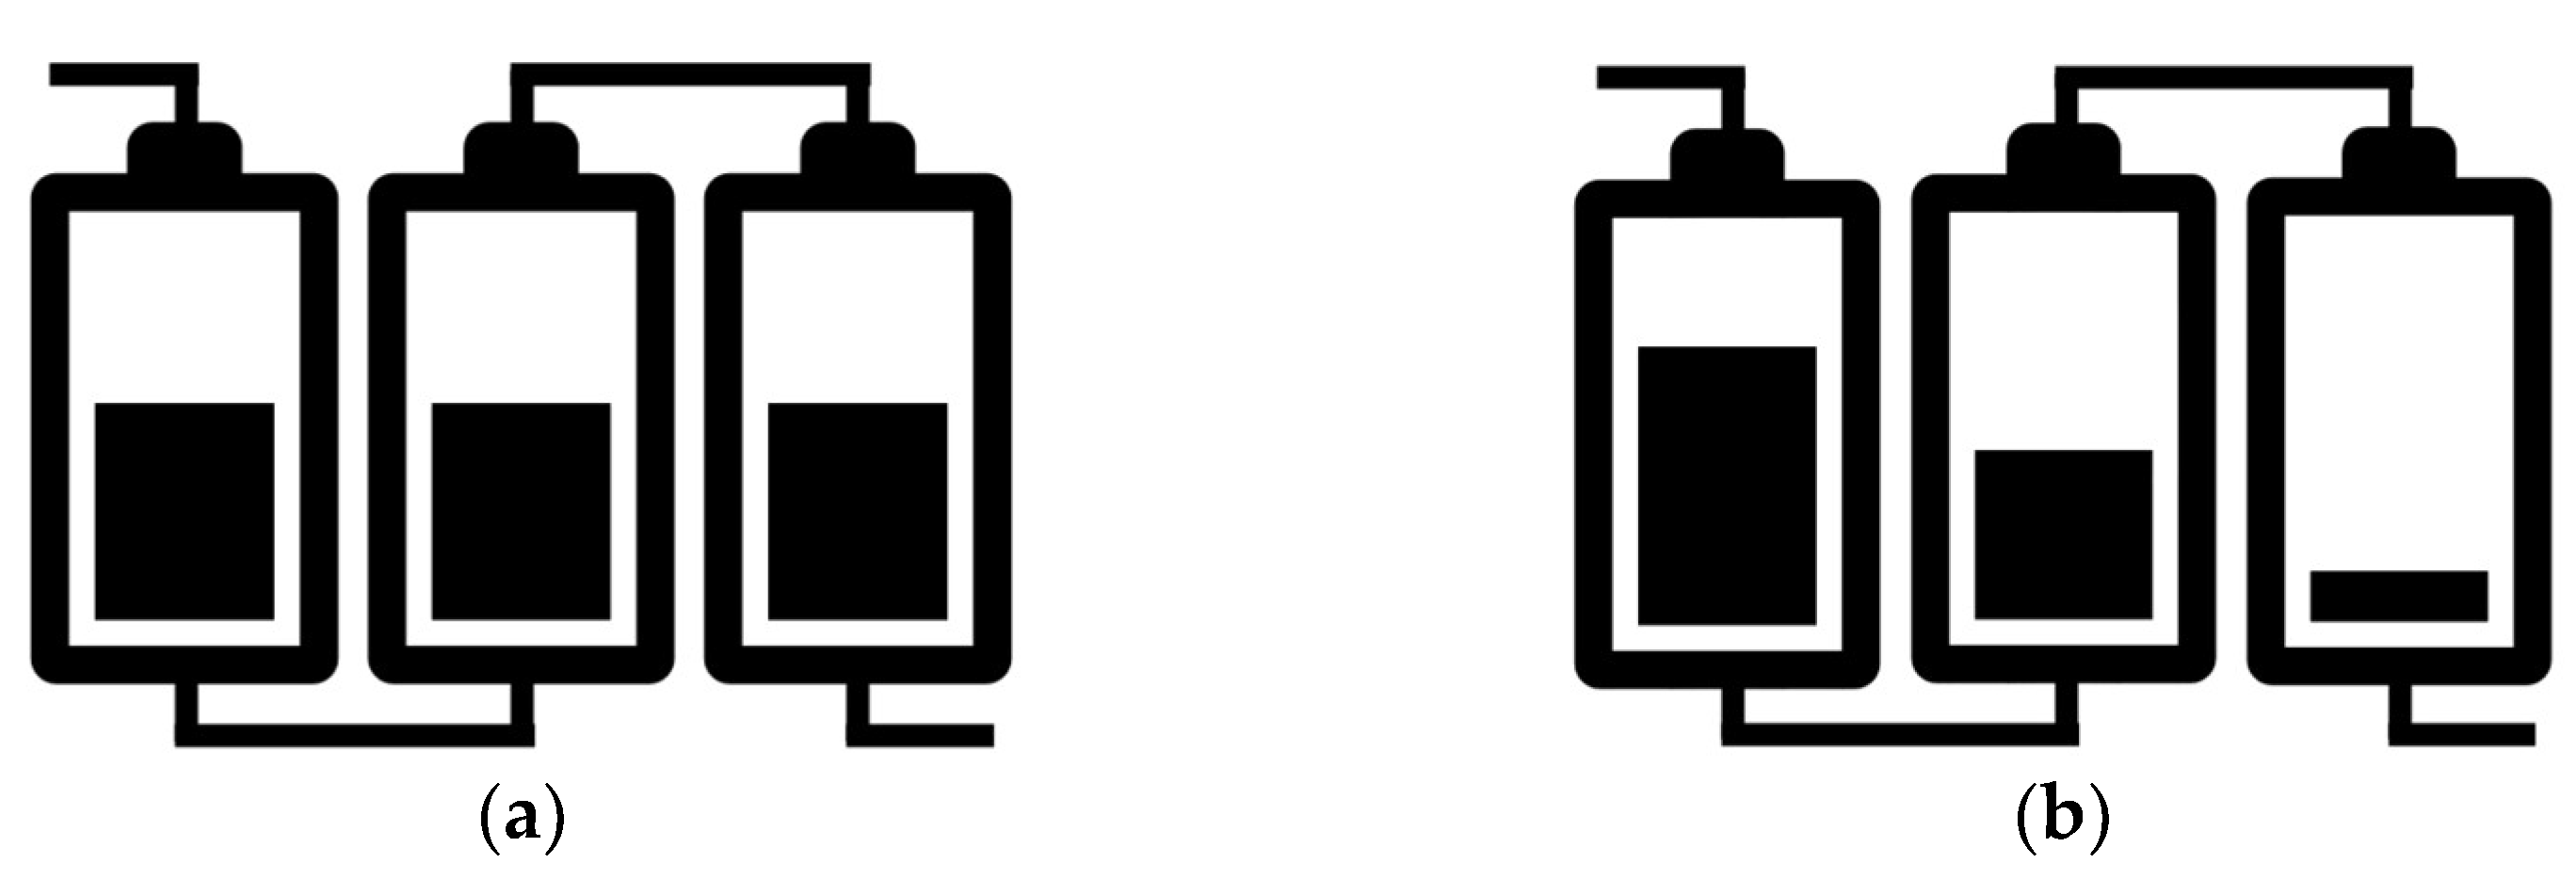
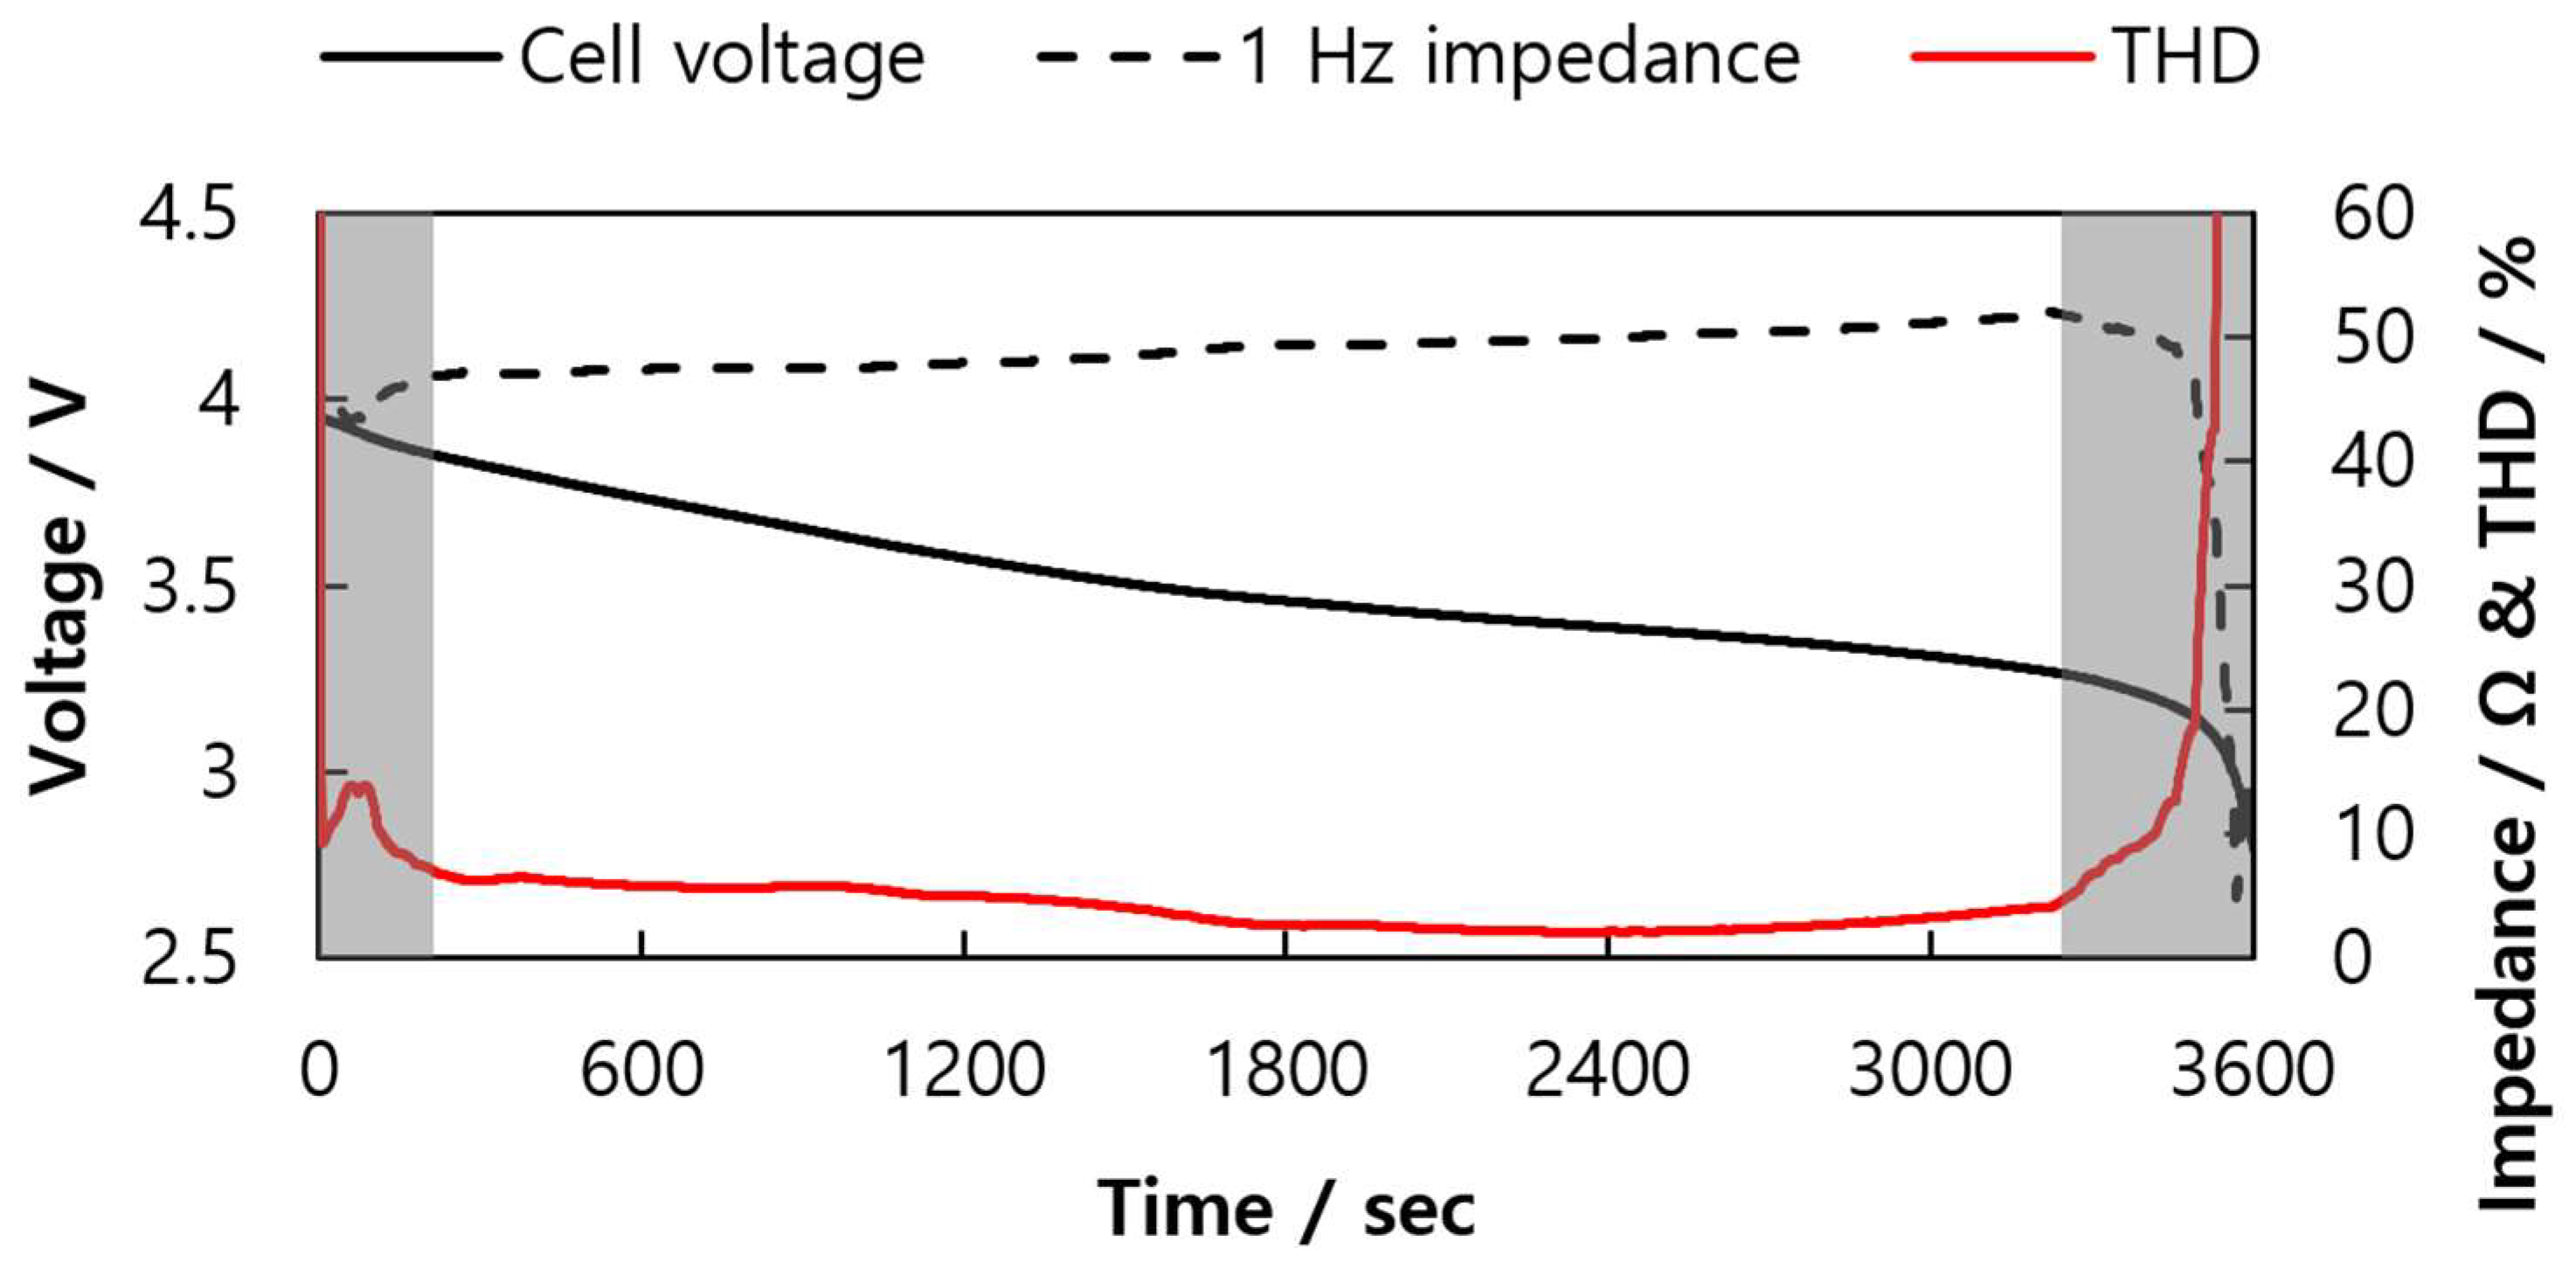
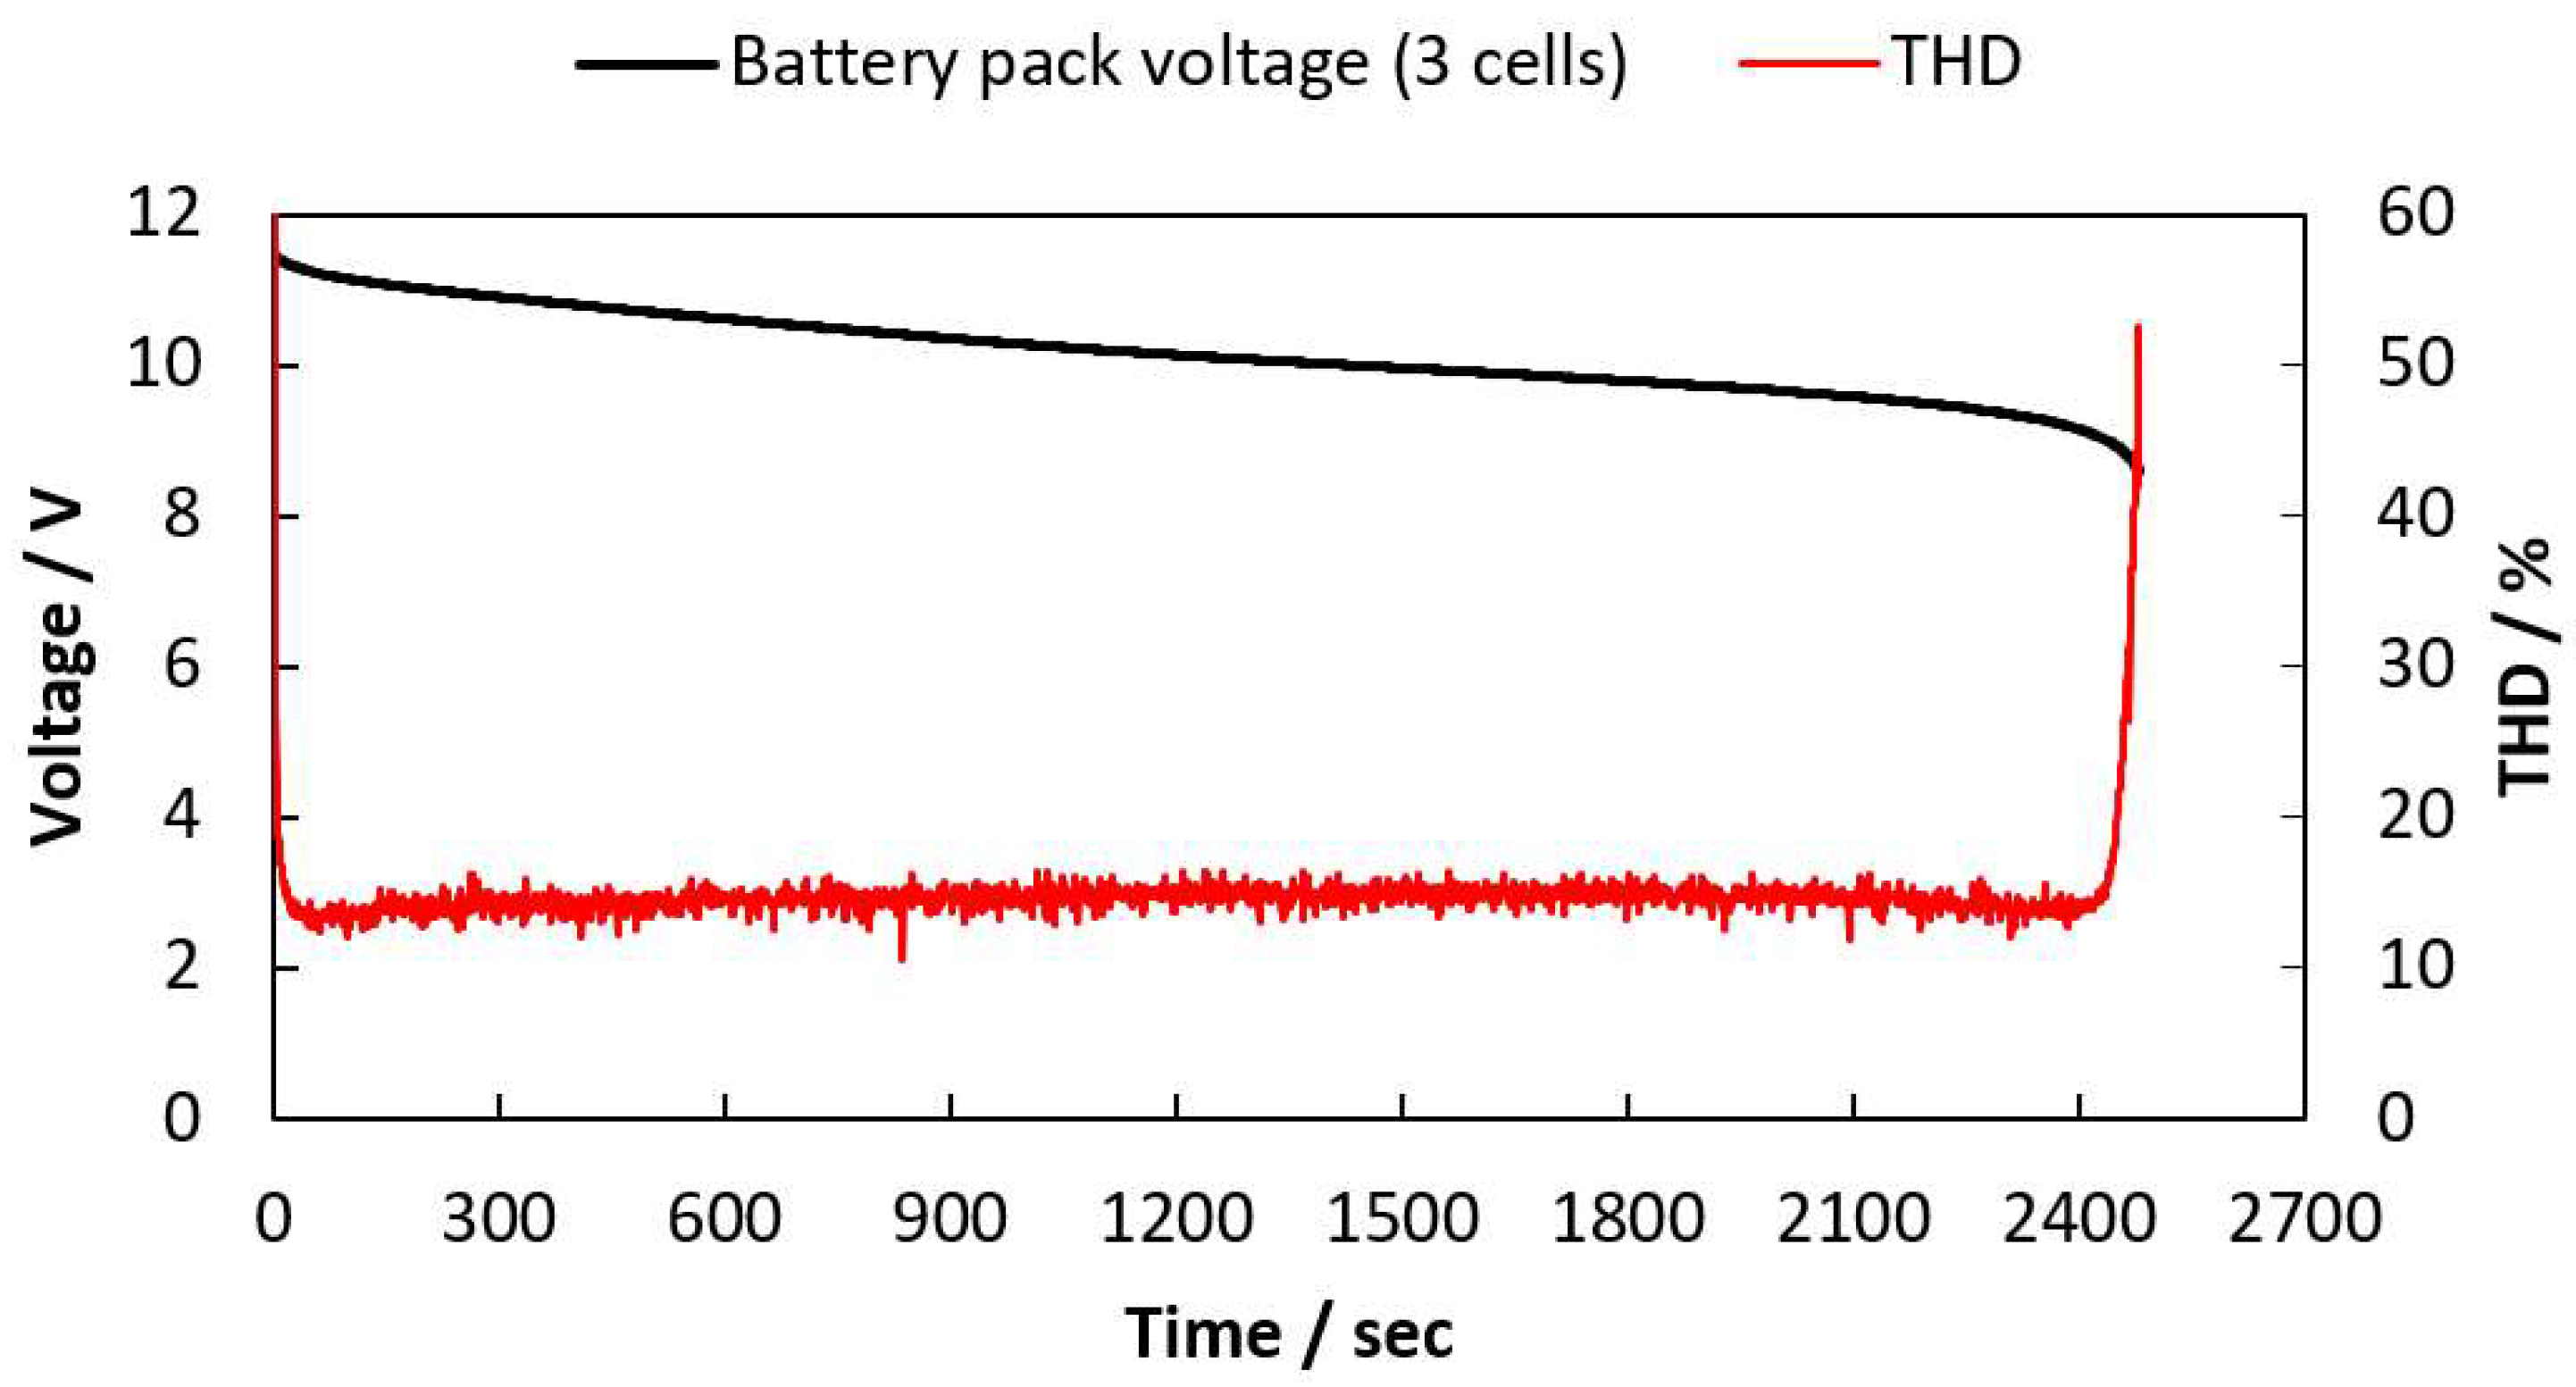
2.3. THD Measurement of a LIB Pack Being Discharged

In this section, THD is measured while a battery pack in which three cells are connected in series is discharged. Each of the three cells has a different SoH (90%, 85%, and 70%) and other experimental conditions are the same as in Table 1. The battery pack is discharged until the voltage of any cell reaches 2.5 V, and THD is measured not from the cell, but from the voltage response of the battery pack.
Figure 7 shows the battery pack voltage as well as THD while the battery pack is discharged.
Since the low cutoff voltage of one cell is 2.8 V, the lower limit voltage of three cells could be considered 8.4 V; however, as shown in Figure 6, the voltage of the battery pack is 8.62 V even when the measurement is completed, i.e., if only the battery pack voltage is measured, it cannot be detected whether one cell is over-discharged. Nevertheless, when the frequency response is measured from the battery pack voltage, it is revealed that the over-discharge of one cell can be detected from the significantly increasing THD.
Figure 8 shows the THD of the battery pack and the voltage of each cell.
Figure 8 illustrates that the THD of the battery pack noticeably increases due to one over-discharged cell while the voltages of the other cells remain in the normal range.
Table 3 shows the THDs of the battery pack at different cell voltages of the 70% SoH cell.
As the cell with 70% SoH is over-discharged, the THD increases remarkably, and it is shown that THD can be used to detect one over-discharged cell in the battery pack. However, while one cell is over-discharged, Table 3 shows lower THDs at the same voltage than THDs in Table 3, i.e., in a battery pack in which healthy cells are connected, the rate of increase of THD due to the one over-discharged cell is lower.

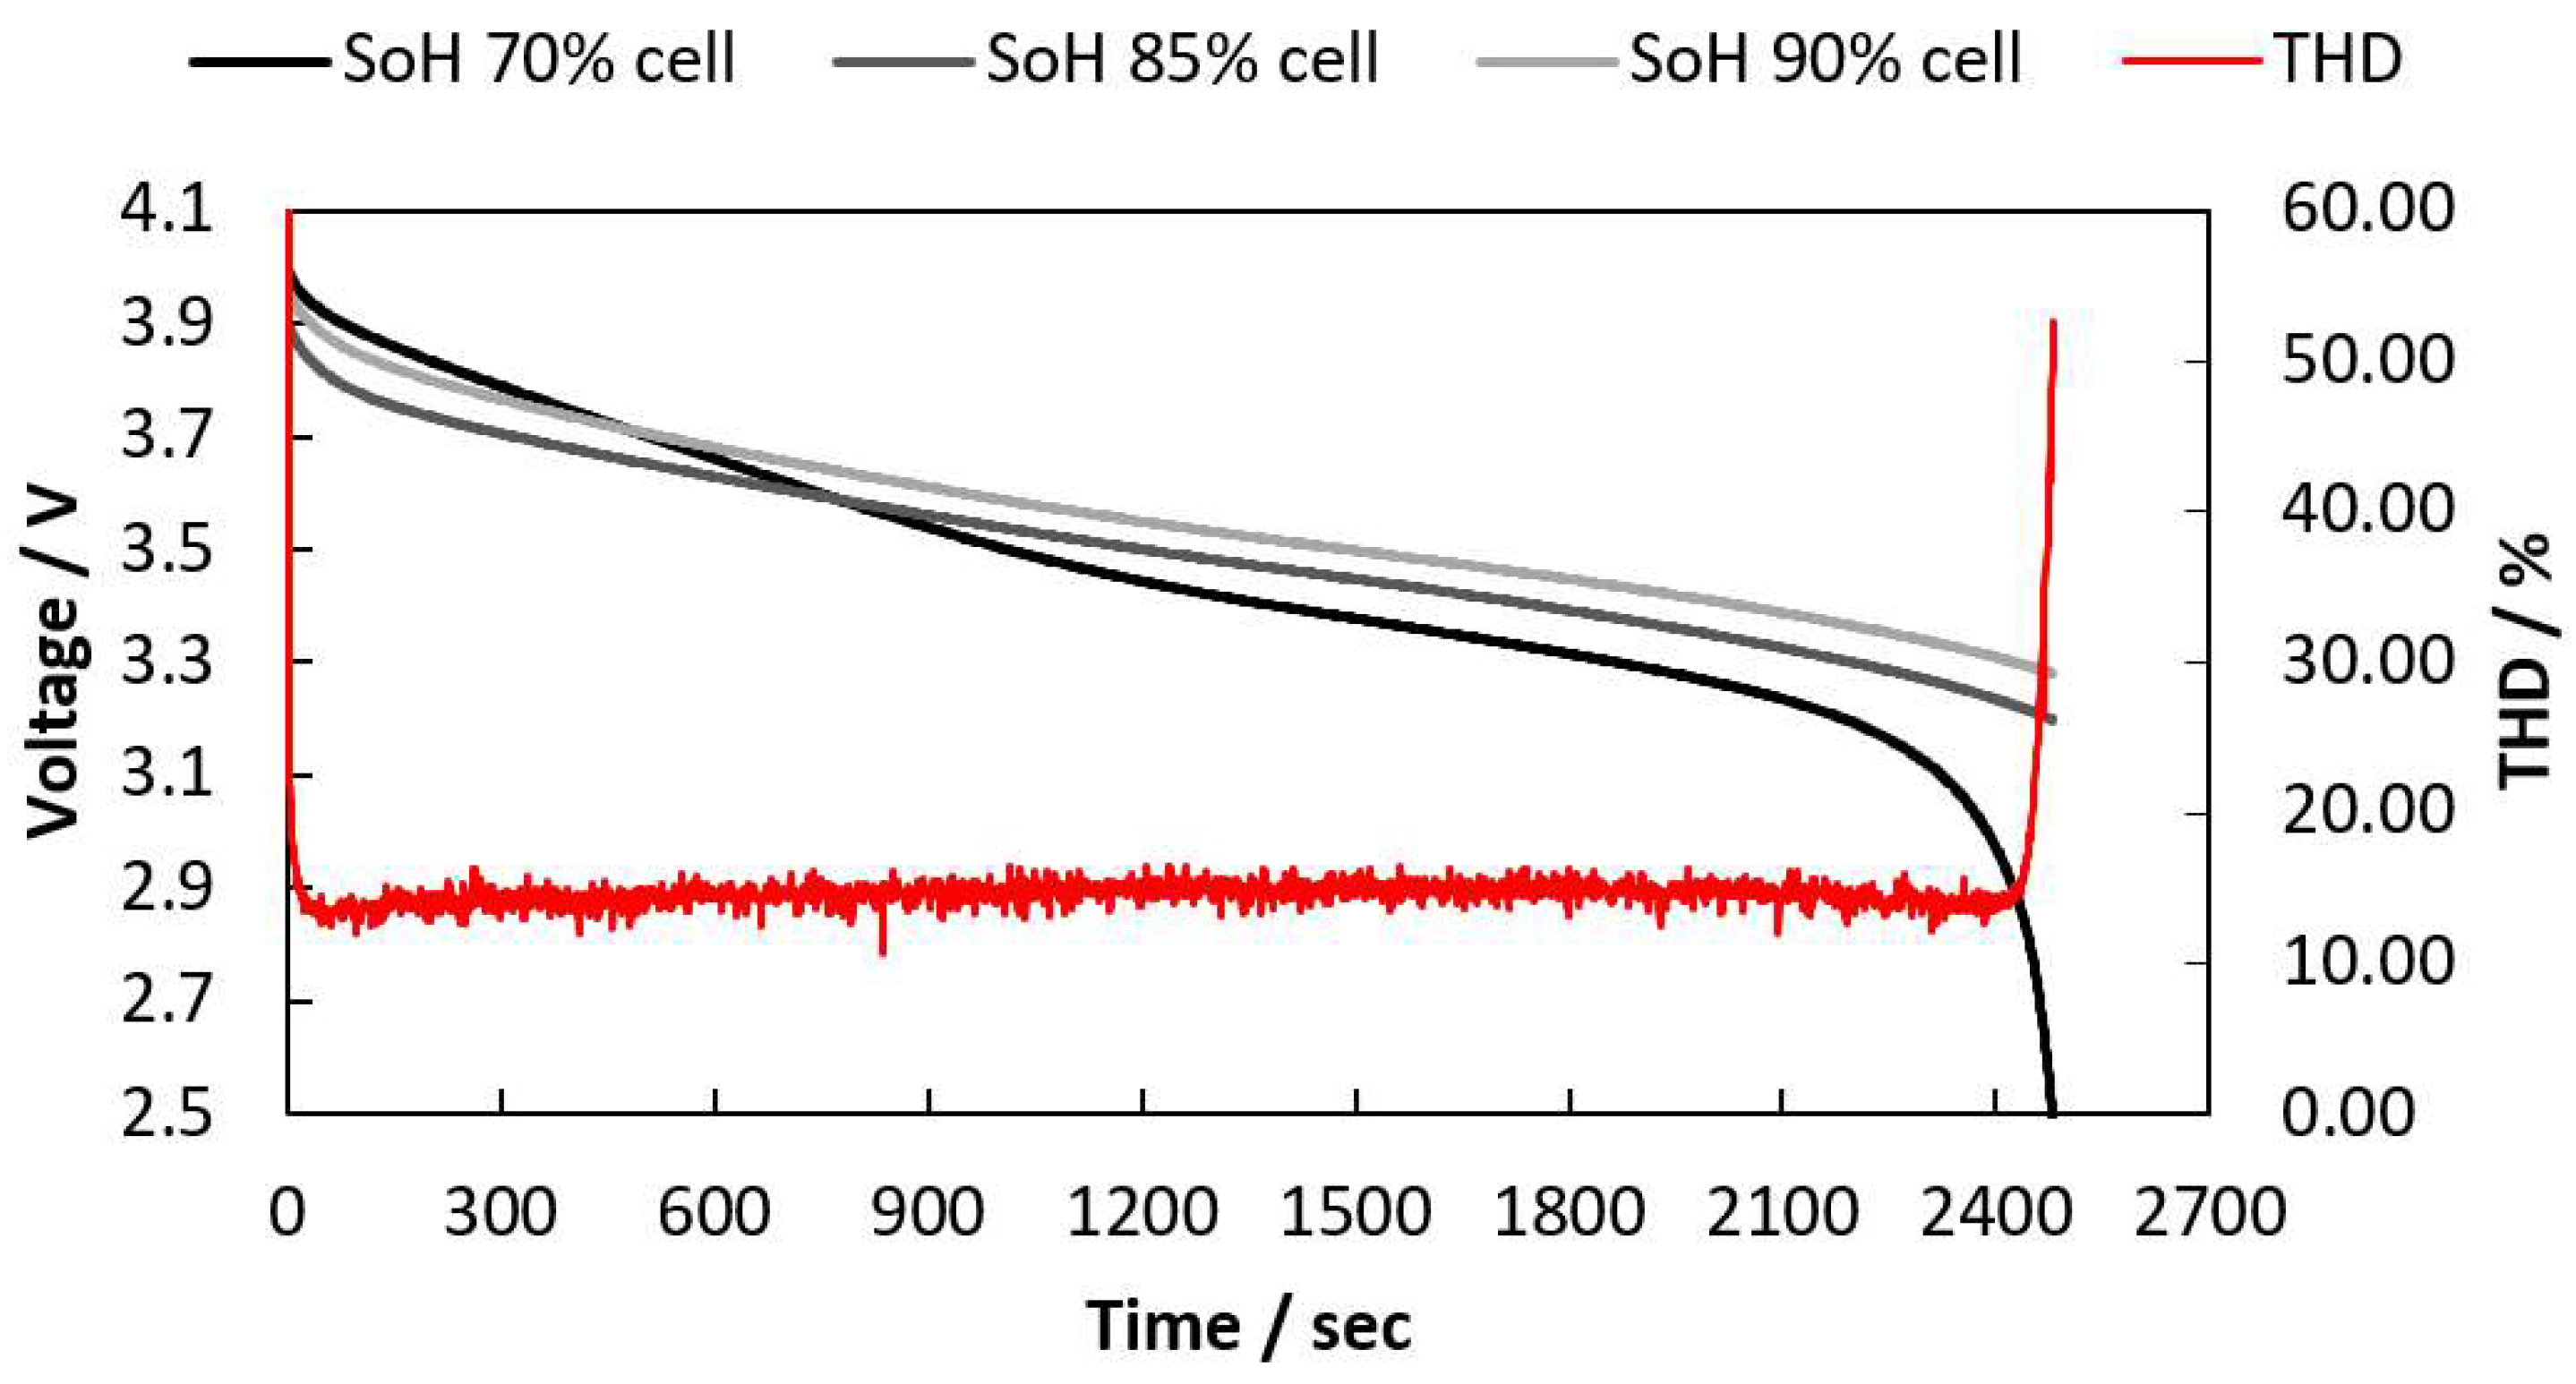
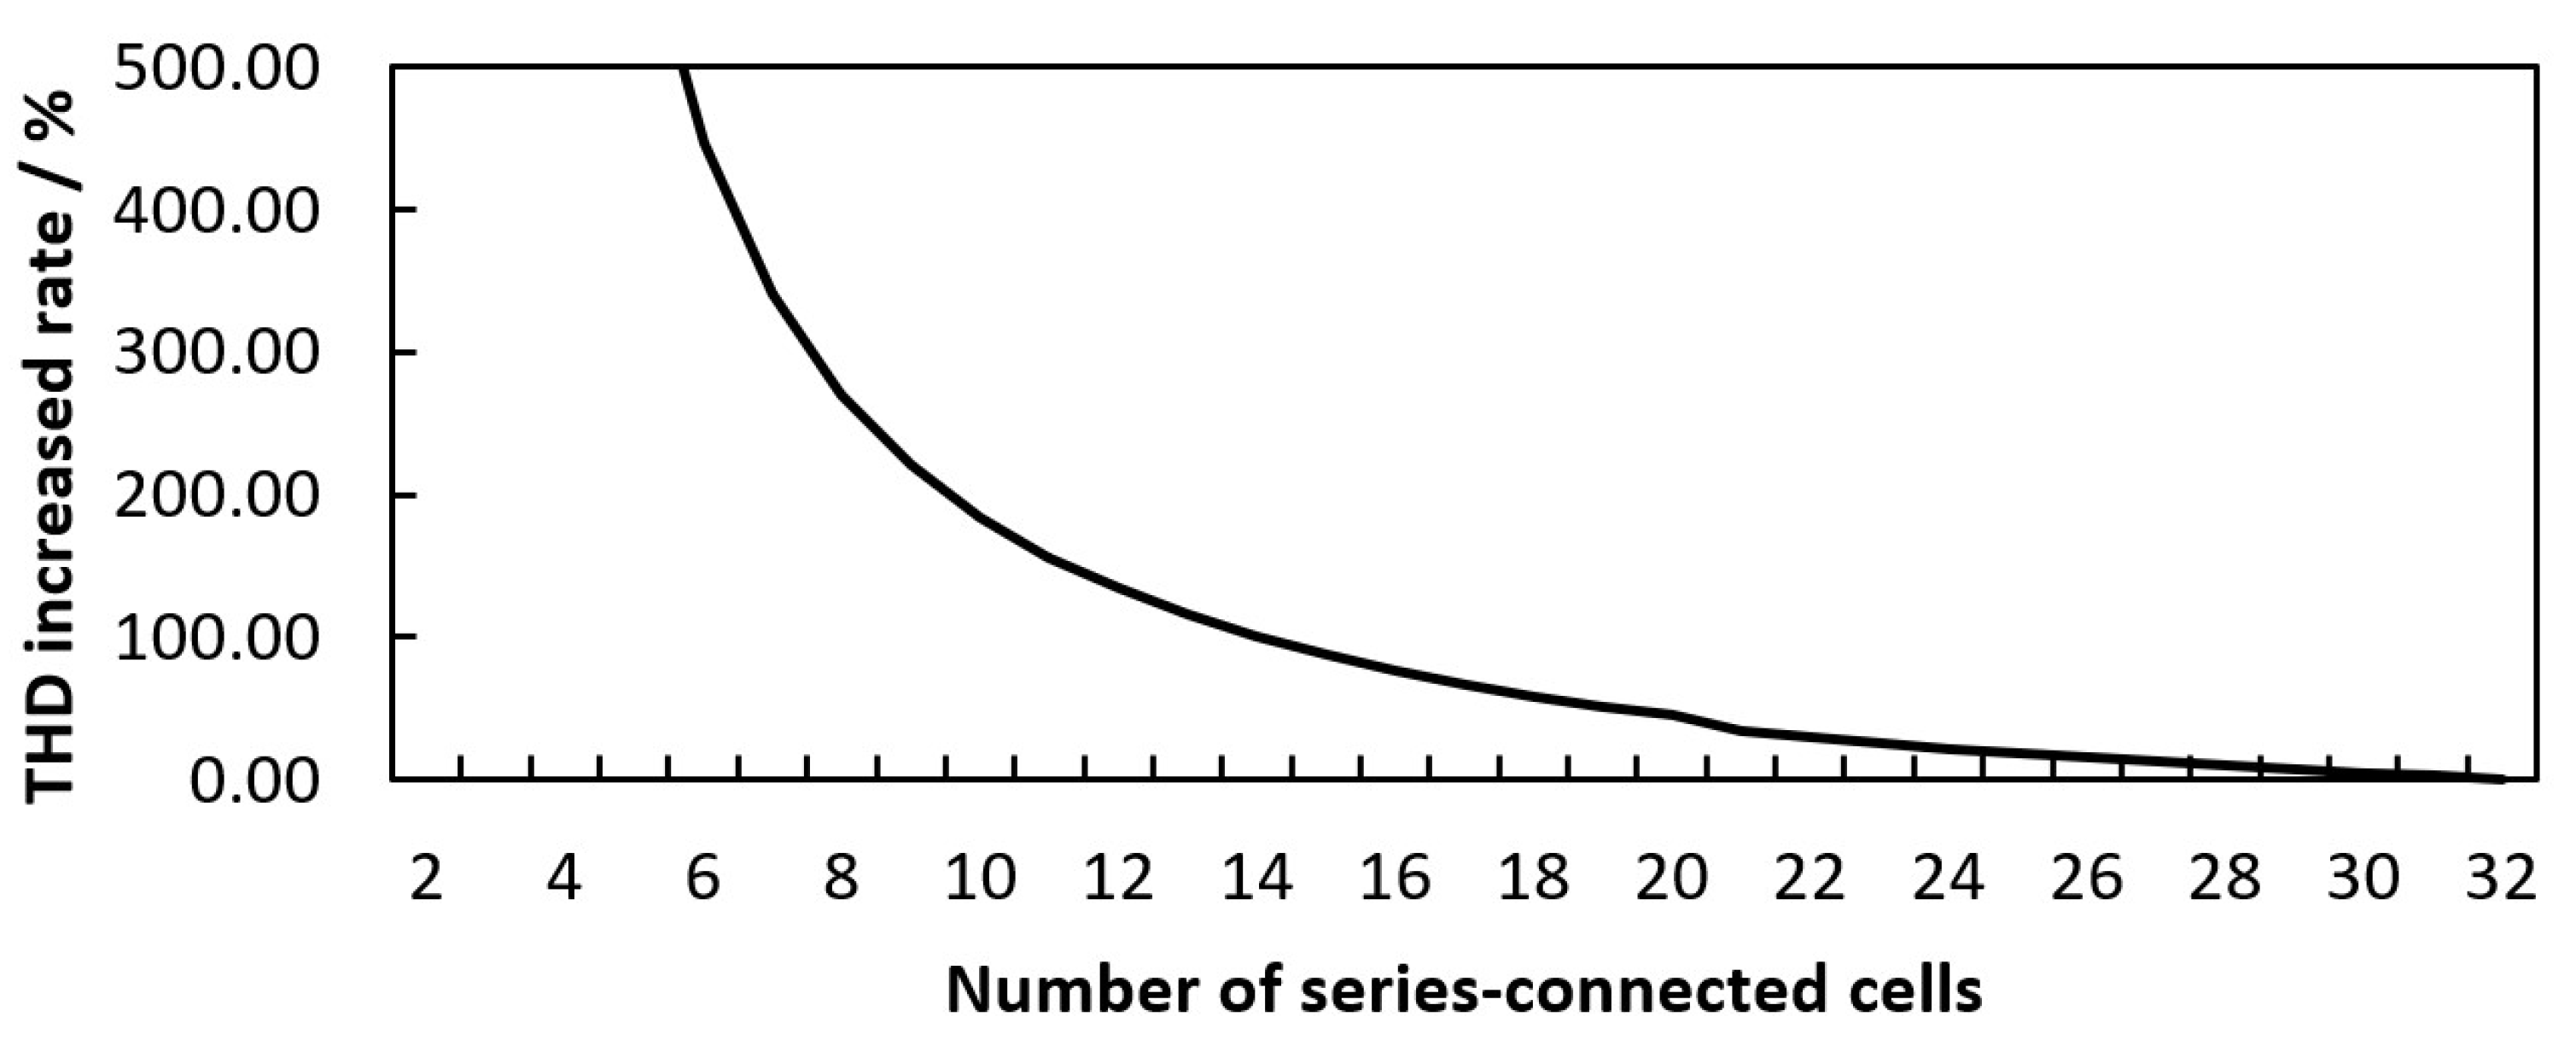
2.4. THD Simulation of LIB Packs with Different Numbers of Cells Are Connected

In this section, THDs during the discharge of battery packs with a different number of cells are compared by a simulation to verify that the higher the number of connected cells, the lower the THD due to the one over-discharged cell. When other cells are discharged at an initial SoC of 100%, one cell, which is designated as a weak cell, starts to discharge at an initial SoC of 50%, thus this weak cell consequently reaches the end of discharge (EoD) earlier than the other cells. The number of cells connected in series is 2 to 32, and other experimental conditions are the same as in Table 1.
Figure 9 shows the simulation result of voltage and THD while a battery pack with 15 cells connected in series is discharged as an example. The battery pack is discharged until one cell reaches EoD.
In Figure 9, a black solid line represents the voltage of a battery pack to which 15 cells are connected in series, and the left Y-axis represents the voltage of the battery pack. The solid red line indicates the weak cell voltage, and the cell voltage is indicated on the right Y-axis. Lastly, the solid blue line represents the voltage of one normal cell.
Figure 10 illustrates the simulated THDs while battery packs to which 2 to 32 cells are connected are discharged. The x-axis represents the voltage of the weak cell, and the y-axis represents the THD of the battery pack. As the color of the line becomes darker, the number of cells connected to the battery pack increases. According to Figure 9, the lower the voltage of the cell weaker than ca. 3.25 V, the higher the THD of the battery pack and the lower the THD as the number of connected cells increases.
Figure 11 shows the increased rate of THD compared to the values when the weak cell voltages are 2.8 V and 3.4 V.
As the voltage of one weak cell reaches a nonlinear range, the THD of the battery pack increases. However, as the number of other cells remaining in a linear range increases, the contribution of nonlinearity due to the weak cell decreases, resulting in a decrease in the THD of the battery pack. While one weak cell reaches EoD, the more cells that are connected to the battery pack, the lower the increased rate of THD.

3. Conclusions and Discussion

This paper introduces a method for detecting the presence of an LIB cell at risk of over-discharge by measuring the frequency response of the battery pack to which cells are connected in series. When the DoD of an LIB cell is deeper than a specific level, nonlinearity in the voltage response of the battery pack is remarkably increased, and thus the presence of a weak cell in the battery pack can be detected even when each cell voltage is not measured. Here, the test frequency is not limited to 1 Hz and is used as an example. The most appropriate test frequency may vary depending, not only on cell characteristics, but also on system requirements.
It is verified through simulation and measurement that the THD of the battery pack can be used as an effective factor for preventing over-discharge as it increases even before the cell is over-discharged. However, as the number of connected cells increases, the increase rate of THD decreases. The simulation results show the THD of the battery pack when one cell reaches EoD early when up to 32 cells are connected in series. However, one should note that in the development of the battery model used, the operation of a cell’s over-discharge of less than 0% SoC has not been considered, and thus the voltage response during over-discharge cannot be simulated. The measurement results in Figure 6 and Figure 7 show that the THD of the battery pack increases significantly more than the simulation results when the cell is over-discharged beyond its EoD. Due to the limitation of the maximum input voltage range of the used measurement system, THD measurement results at the connection of more than three cells are not shown in this paper. As shown by simulation, it should be verified by experiments in future work as to how many cells this method can be applied to.
This method can be used to improve the existing BMS or as an auxiliary method to ensure battery safety. In addition, in a system that monitors the state of a battery by measuring the battery impedance during operation, the proposed method can be applied without additional devices. To prevent the risk due to the cell imbalance of a battery pack/module in which cells must be connected in series to achieve the voltage required in the target application, the voltage of each cell must be measured, which not only leads to circuit complexity but also makes it vulnerable to disconnection due to vibration or impact applied to the application system. When the proposed method is applied to a BMS, even when every cell voltage is not measured, the over-discharge of one cell can be detected in advance through frequency response measurement from the battery pack voltage.
Note that the proposed method is not a method of determining which cells are over-discharged in a battery pack but is rather a method of detecting the presence of an over-discharged cell. If one weak cell in the battery pack is over-discharged, the degradation of other cells is accelerated, which could lead to fatal problems. However, if the possibility of over-discharge of one cell is detected in advance, the BMS may disconnect the battery from the load to extend the battery life. Even if BMS cannot identify which cell is the weak cell vulnerable to suffering over-discharge, it is enough to be examined by experts in laboratories or repair centers, i.e., the proposed method allows users to visit the repair center at the right time, and by allowing experts to find weak cells and handle them properly, enables efficient and safe battery utilization.
In this paper, only LCO type cells are used among the types of lithium-ion battery cells, but the proposed method is expected to be applicable to electrochemical cells with a concentration polarization in which nonlinearity is prominent at the end-of-discharge curve, hence will be verified with other types of battery cells in future work.
The THD of the battery pack is measured as remarkably high, not only at the EoD but also at the beginning of the discharge. This is due to nonlinearity known as activation polarization in the discharge curve of electrochemical battery cells. Since it is only measured at the beginning of the discharge, it does not need to be considered for the detection of the cell’s over-discharge.
Unlike the method used during battery pack discharge, there is a limitation in detecting the cell’s overcharge during battery pack charging. In general, a constant current (CC)–constant voltage (CV) method is used for battery charging, and the offset current continuously changes during CV charging, which causes distortion in the frequency response even if the system is linear. This distortion is caused by a violation of stability, one of the conditions for accurate frequency response measurements, i.e., in order for this method to be used while charging the battery pack, it has a limitation that it can only be used during CC charging, and this limitation reduces the necessity of this method to be used during charging.

Author Contributions

Conceptualization, J.K. (Jonghyeon Kim); data curation, J.K. (Jonghyeon Kim); formal analysis, J.K. (Jonghyeon Kim); funding acquisition, J.K. (Jonghyeon Kim); investigation, J.K. (Jonghyeon Kim); methodology, J.K. (Jonghyeon Kim); project administration, J.K. (Julia Kowal); resources, J.K. (Julia Kowal); software, J.K. (Jonghyeon Kim); supervision, J.K. (Julia Kowal); validation, J.K. (Jonghyeon Kim); visualization, J.K. (Jonghyeon Kim); writing—original draft, J.K. (Jonghyeon Kim); writing—review and editing, J.K. (Julia Kowal). All authors have read and agreed to the published version of the manuscript.

Funding

This research was funded by DAAD (German Academic Exchange Service), Research Grants—Doctoral Programmes in Germany (57299294).

Institutional Review Board Statement

Not applicable.

Informed Consent Statement

Not applicable.

Data Availability Statement

Not applicable.

Conflicts of Interest

The authors declare no conflict of interest. The funders had no role in the design of the study; in the collection, analyses, or interpretation of data; in the writing of the manuscript, or in the decision to publish the results.

References

  1. Goodenough, J.B.; Kim, Y. Challenges for rechargeable batteries. J. Power Sources 2011, 196, 6688–6694. [Google Scholar] [CrossRef]
  2. Mousavi, G.S.M. An autonomous hybrid energy system of wind/tidal/microturbine/battery storage. Int. J. Electr. Power Energy Syst. 2012, 43, 1144–1154. [Google Scholar] [CrossRef]
  3. Zhou, Z.; Benbouzid, M.; Frédéric Charpentier, J.; Scuiller, F.; Tang, T. A review of energy storage technologies for marine current energy systems. Renew. Sustain. Energy Rev. 2013, 18, 390–400. [Google Scholar] [CrossRef] [Green Version]
  4. Wang, Q.; Mao, B.; Stoliarov, S.I.; Sun, J. A review of lithium ion battery failure mechanisms and fire prevention strategies. Prog. Energy Combust. Sci. 2019, 73, 95–131. [Google Scholar] [CrossRef]
  5. Chen, Y.; Kang, Y.; Zhao, Y.; Wang, L.; Liu, J.; Li, Y.; Liang, Z.; He, X.; Li, X.; Tavajohi, N.; et al. A review of lithium-ion battery safety concerns: The issues, strategies, and testing standards. J. Energy Chem. 2021, 59, 83–99. [Google Scholar] [CrossRef]
  6. Dubarry, M.; Devie, A.; Liaw, B.Y. Cell-balancing currents in parallel strings of a battery system. J. Power Sources 2016, 321, 36–46. [Google Scholar] [CrossRef] [Green Version]
  7. Qi, G.; Li, X.; Yang, D. A Control Strategy for Dynamic Balancing of Lithium Iron Phosphate Battery Based on the Performance of Cell Voltage. In Proceedings of the 2014 IEEE Conference and Expo Transportation Electrification Asia-Pacific (ITEC Asia-Pacific), Beijing, China, 31 August–3 September 2014; pp. 1–5, ISBN 978-1-4799-4239-8. [Google Scholar]
  8. Bruen, T.; Marco, J.; Gama, M. Model Based Design of Balancing Systems for Electric Vehicle Battery Packs. IFAC-PapersOnLine 2015, 48, 395–402. [Google Scholar] [CrossRef]
  9. Lin, J.-C. Development of a New Battery Management System with an Independent Balance Module for Electrical Motorcycles. Energies 2017, 10, 1289. [Google Scholar] [CrossRef] [Green Version]
  10. Yusof, M.S.; Toha, S.F.; Kamisan, N.; Hashim, N.; Abdullah, M.A. Battery Cell Balancing Optimisation for Battery Management System. IOP Conf. Ser. Mater. Sci. Eng. 2017, 184, 12021. [Google Scholar] [CrossRef]
  11. Gallardo-Lozano, J.; Romero-Cadaval, E.; Milanes-Montero, M.I.; Guerrero-Martinez, M.A. Battery equalization active methods. J. Power Sources 2014, 246, 934–949. [Google Scholar] [CrossRef]
  12. Gallardo-Lozano, J.; Romero-Cadaval, E.; Milanes-Montero, M.I.; Guerrero-Martinez, M.A. A novel active battery equalization control with on-line unhealthy cell detection and cell change decision. J. Power Sources 2015, 299, 356–370. [Google Scholar] [CrossRef]
  13. Bouchhima, N.; Schnierle, M.; Schulte, S.; Birke, K.P. Active model-based balancing strategy for self-reconfigurable batteries. J. Power Sources 2016, 322, 129–137. [Google Scholar] [CrossRef]
  14. Williard, N.; He, W.; Hendricks, C.; Pecht, M. Lessons Learned from the 787 Dreamliner Issue on Lithium-Ion Battery Reliability. Energies 2013, 6, 4682–4695. [Google Scholar] [CrossRef] [Green Version]
  15. Orcioni, S.; Ricci, A.; Buccolini, L.; Scavongelli, C.; Conti, M. Effects of variability of the characteristics of single cell on the performance of a lithium-ion battery pack. In Proceedings of the 2017 13th Workshop on Intelligent Solutions in Embedded Systems (WISES), Hamburg, Germany, 12–13 June 2017; pp. 15–21, ISBN 978-1-5386-1157-9. [Google Scholar]
  16. Hoque, M.M.; Hannan, M.A.; Mohamed, A. Voltage equalization control algorithm for monitoring and balancing of series connected lithium-ion battery. J. Renew. Sustain. Energy 2016, 8, 25703. [Google Scholar] [CrossRef]
  17. Han, W.; Zhang, L. Mathematical analysis and coordinated current allocation control in battery power module systems. J. Power Sources 2017, 372, 166–179. [Google Scholar] [CrossRef]
  18. Andre, D.; Meiler, M.; Steiner, K.; Wimmer, C.; Soczka-Guth, T.; Sauer, D.U. Characterization of high-power lithium-ion batteries by electrochemical impedance spectroscopy. I. Experimental investigation. J. Power Sources 2011, 196, 5334–5341. [Google Scholar] [CrossRef]
  19. Gao, F.; Tang, Z. Kinetic behavior of LiFePO4/C cathode material for lithium-ion batteries. Electrochim. Acta 2008, 53, 5071–5075. [Google Scholar] [CrossRef]
  20. Hung, M.-H.; Lin, C.-H.; Lee, L.-C.; Wang, C.-M. State-of-charge and state-of-health estimation for lithium-ion batteries based on dynamic impedance technique. J. Power Sources 2014, 268, 861–873. [Google Scholar] [CrossRef]
  21. Galeotti, M.; Cinà, L.; Giammanco, C.; Cordiner, S.; Di Carlo, A. Performance analysis and SOH (state of health) evaluation of lithium polymer batteries through electrochemical impedance spectroscopy. Energy 2015, 89, 678–686. [Google Scholar] [CrossRef]
  22. Momma, T.; Matsunaga, M.; Mukoyama, D.; Osaka, T. Ac impedance analysis of lithium ion battery under temperature control. J. Power Sources 2012, 216, 304–307. [Google Scholar] [CrossRef]
  23. Tröltzsch, U.; Kanoun, O.; Tränkler, H.-R. Characterizing aging effects of lithium ion batteries by impedance spectroscopy. Electrochim. Acta 2006, 51, 1664–1672. [Google Scholar] [CrossRef]
  24. Buller, S.; Thele, M.; Karden, E.; de Doncker, R.W. Impedance-based non-linear dynamic battery modeling for automotive applications. J. Power Sources 2003, 113, 422–430. [Google Scholar] [CrossRef]
  25. Osaka, T.; Mukoyama, D.; Nara, H. Review—Development of Diagnostic Process for Commercially Available Batteries, Especially Lithium Ion Battery, by Electrochemical Impedance Spectroscopy. J. Electrochem. Soc. 2015, 162, A2529–A2537. [Google Scholar] [CrossRef]
  26. Gao, P.; Zhang, C.; Wen, G. Equivalent circuit model analysis on electrochemical impedance spectroscopy of lithium metal batteries. J. Power Sources 2015, 294, 67–74. [Google Scholar] [CrossRef]
  27. Mingant, R.; Bernard, J.; Sauvant Moynot, V.; Delaille, A.; Mailley, S.; Hognon, J.-L.; Huet, F. EIS Measurements for Determining the SoC and SoH of Li-Ion Batteries. ECS Trans. 2011, 33, 41–53. [Google Scholar] [CrossRef]
  28. Howey, D.A.; Yufit, V.; Mitcheson, P.D.; Offer, G.J.; Brandon, N.P. Impedance measurement for advanced battery management systems. In Proceedings of the 2013 World Electric Vehicle Symposium and Exhibition (EVS27), Barcelona, Spain, 17–20 November 2013; pp. 1–7, ISBN 978-1-4799-3832-2. [Google Scholar]
  29. Kim, J.; Krüger, L.; Kowal, J. On-line state-of-health estimation of Lithium-ion battery cells using frequency excitation. J. Energy Storage 2020, 32, 101841. [Google Scholar] [CrossRef]
  30. Kim, J.; Kowal, J. Development of a Matlab/Simulink Model for Monitoring Cell State-of-Health and State-of-Charge via Impedance of Lithium-Ion Battery Cells. Batteries 2022, 8, 8. [Google Scholar] [CrossRef]
  31. Abu Qahouq, J.A. Online battery impedance spectrum measurement method. In Proceedings of the 2016 IEEE Applied Power Electronics Conference and Exposition (APEC), Long Beach, CA, USA, 20–24 March 2016; pp. 3611–3615, ISBN 978-1-4673-8393-6. [Google Scholar]
  32. Waag, W.; Fleischer, C.; Sauer, D.U. On-line estimation of lithium-ion battery impedance parameters using a novel varied-parameters approach. J. Power Sources 2013, 237, 260–269. [Google Scholar] [CrossRef]
  33. Huang, W.; Qahouq, J.A. An Online Battery Impedance Measurement Method Using DC–DC Power Converter Control. IEEE Trans. Ind. Electron. 2014, 61, 5987–5995. [Google Scholar] [CrossRef]
  34. Howey, D.A.; Mitcheson, P.D.; Yufit, V.; Offer, G.J.; Brandon, N.P. Online Measurement of Battery Impedance Using Motor Controller Excitation. IEEE Trans. Veh. Technol. 2014, 63, 2557–2566. [Google Scholar] [CrossRef]
  35. Mog, G.E.; Ribeiro, E.P. Total harmonic distortion calculation by filtering for power quality monitoring. In Proceedings of the 2004 IEEE/PES Transmission and Distribution Conference and Exposition: Latin America (IEEE Cat. No. 04EX956), Sao Paulo, Brazil, 8–11 November 2004; pp. 629–632, ISBN 0-7803-8775-9. [Google Scholar]
  36. Giner-Sanz, J.J.; Ortega, E.M.; Pérez-Herranz, V. Total harmonic distortion based method for linearity assessment in electrochemical systems in the context of EIS. Electrochim. Acta 2015, 186, 598–612. [Google Scholar] [CrossRef] [Green Version]
  37. Kiel, M.; Bohlen, O.; Sauer, D.U. Harmonic analysis for identification of nonlinearities in impedance spectroscopy. Electrochim. Acta 2008, 53, 7367–7374. [Google Scholar] [CrossRef]
  38. Mao, Q.; Krewer, U. Total harmonic distortion analysis of oxygen reduction reaction in proton exchange membrane fuel cells. Electrochim. Acta 2013, 103, 188–198. [Google Scholar] [CrossRef]
  39. Ramschak, E.; Peinecke, V.; Prenninger, P.; Schaffer, T.; Baumgartner, W.; Hacker, V. Online stack monitoring tool for dynamically and stationary operated fuel cell systems. Fuel Cells Bull. 2006, 2006, 12–15. [Google Scholar] [CrossRef]
  40. Kadyk, T.; Hanke-Rauschenbach, R.; Sundmacher, K. Nonlinear frequency response analysis of PEM fuel cells for diagnosis of dehydration, flooding and CO-poisoning. J. Electroanal. Chem. 2009, 630, 19–27. [Google Scholar] [CrossRef]
  41. Wong, D.K.Y.; MacFarlane, D.R. Harmonic impedance spectroscopy. Theory and experimental results for reversible and quasi-reversible redox systems. J. Phys. Chem. 1995, 99, 2134–2142. [Google Scholar] [CrossRef]
  42. Mao, Q.; Krewer, U. Sensing methanol concentration in direct methanol fuel cell with total harmonic distortion: Theory and application. Electrochim. Acta 2012, 68, 60–68. [Google Scholar] [CrossRef]
  43. Mao, Q.; Krewer, U.; Hanke-Rauschenbach, R. Total harmonic distortion analysis for direct methanol fuel cell anode. Electrochem. Commun. 2010, 12, 1517–1519. [Google Scholar] [CrossRef]
  44. Okazaki, S.; Higuchi, S.; Takahashi, S. Second-Order Harmonic in the Current Response to Sinusoidal Perturbation Voltage for Lead-Acid Battery: An Application to a State-of-Charge Indicator. J. Electrochem. Soc. 1985, 132, 1516–1520. [Google Scholar] [CrossRef]
  45. Harting, N.; Wolff, N.; Röder, F.; Krewer, U. Nonlinear Frequency Response Analysis (NFRA) of Lithium-Ion Batteries. Electrochim. Acta 2017, 248, 133–139. [Google Scholar] [CrossRef]
  46. Bagotsky, V.S. Fundamentals of Electrochemistry, 2nd ed.; Wiley: Hoboken, NJ, USA, 2006; ISBN 978-0-471-70058-6. [Google Scholar]
Figure 1. (a) Battery cells having a uniform voltage; (b) battery cells having a non-uniform voltage.
Batteries 08 00026 g001
Figure 2. Simulation result of cell voltage, 1 Hz impedance, and THD while one LIB cell is discharged.
Batteries 08 00026 g002
Figure 3. Voltage response simulated for 1 s at a cell SoC of 50% (a) in a time domain and (b) in a frequency domain.
Batteries 08 00026 g003
Figure 4. Voltage response simulated for 1 s at a cell SoC of 2% (a) in a time domain and (b) in a frequency domain.
Batteries 08 00026 g004
Figure 5. A photo of a device for series connection of three cells.
Batteries 08 00026 g005
Figure 6. Measured cell voltage, 1 Hz impedance, and THD while one LIB cell is discharged.
Batteries 08 00026 g006
Figure 7. Battery pack voltage and THD measured during discharge.
Batteries 08 00026 g007
Figure 8. Voltage of each cell and THD measured during the discharge of the battery pack.
Batteries 08 00026 g008
Figure 9. Voltage of the battery pack to which 15 cells are connected (left Y-axis), voltage of one normal cell (right Y-axis), and voltage of the weak cell (right Y-axis) discharged until reaching EoD.
Batteries 08 00026 g009
Figure 10. Simulated THDs while battery packs with 2 to 32 cells connected are discharged.
Batteries 08 00026 g010
Figure 11. The increased rates of THDs of battery packs with different numbers of cells.
Batteries 08 00026 g011
Table 1. Conditions for THD simulation of a LIB cell being discharged.
ParameterDescription
Test frequency1 Hz
Initial SoC100%
Cell state of health (SoH)100%
DC bias2.6 A (1 C)
Sampling rate1024 Hz
Amplitude26 mA
Lower cut-off voltage2.8 V
Table 2. THDs measured at different cell voltages.
Cell Voltage (V)THD (%)
3.013.29
2.925.50
2.846.31
2.786.87
2.6311.74
2.5538.78
Table 3. THDs of the LIB pack at different cell voltages of the 70% SoH cell.
Voltage of the Cell with 70% SoH (V)THD (%)
3.014.37
2.914.70
2.818.57
2.727.14
2.636.62
2.549.72
Publisher’s Note: MDPI stays neutral with regard to jurisdictional claims in published maps and institutional affiliations.

