
The Impact of an Overlaid Ripple Current on Battery Aging: The Development of the SiCWell Dataset

 , , , , and
Abstract
:1. Introduction
2. Theory
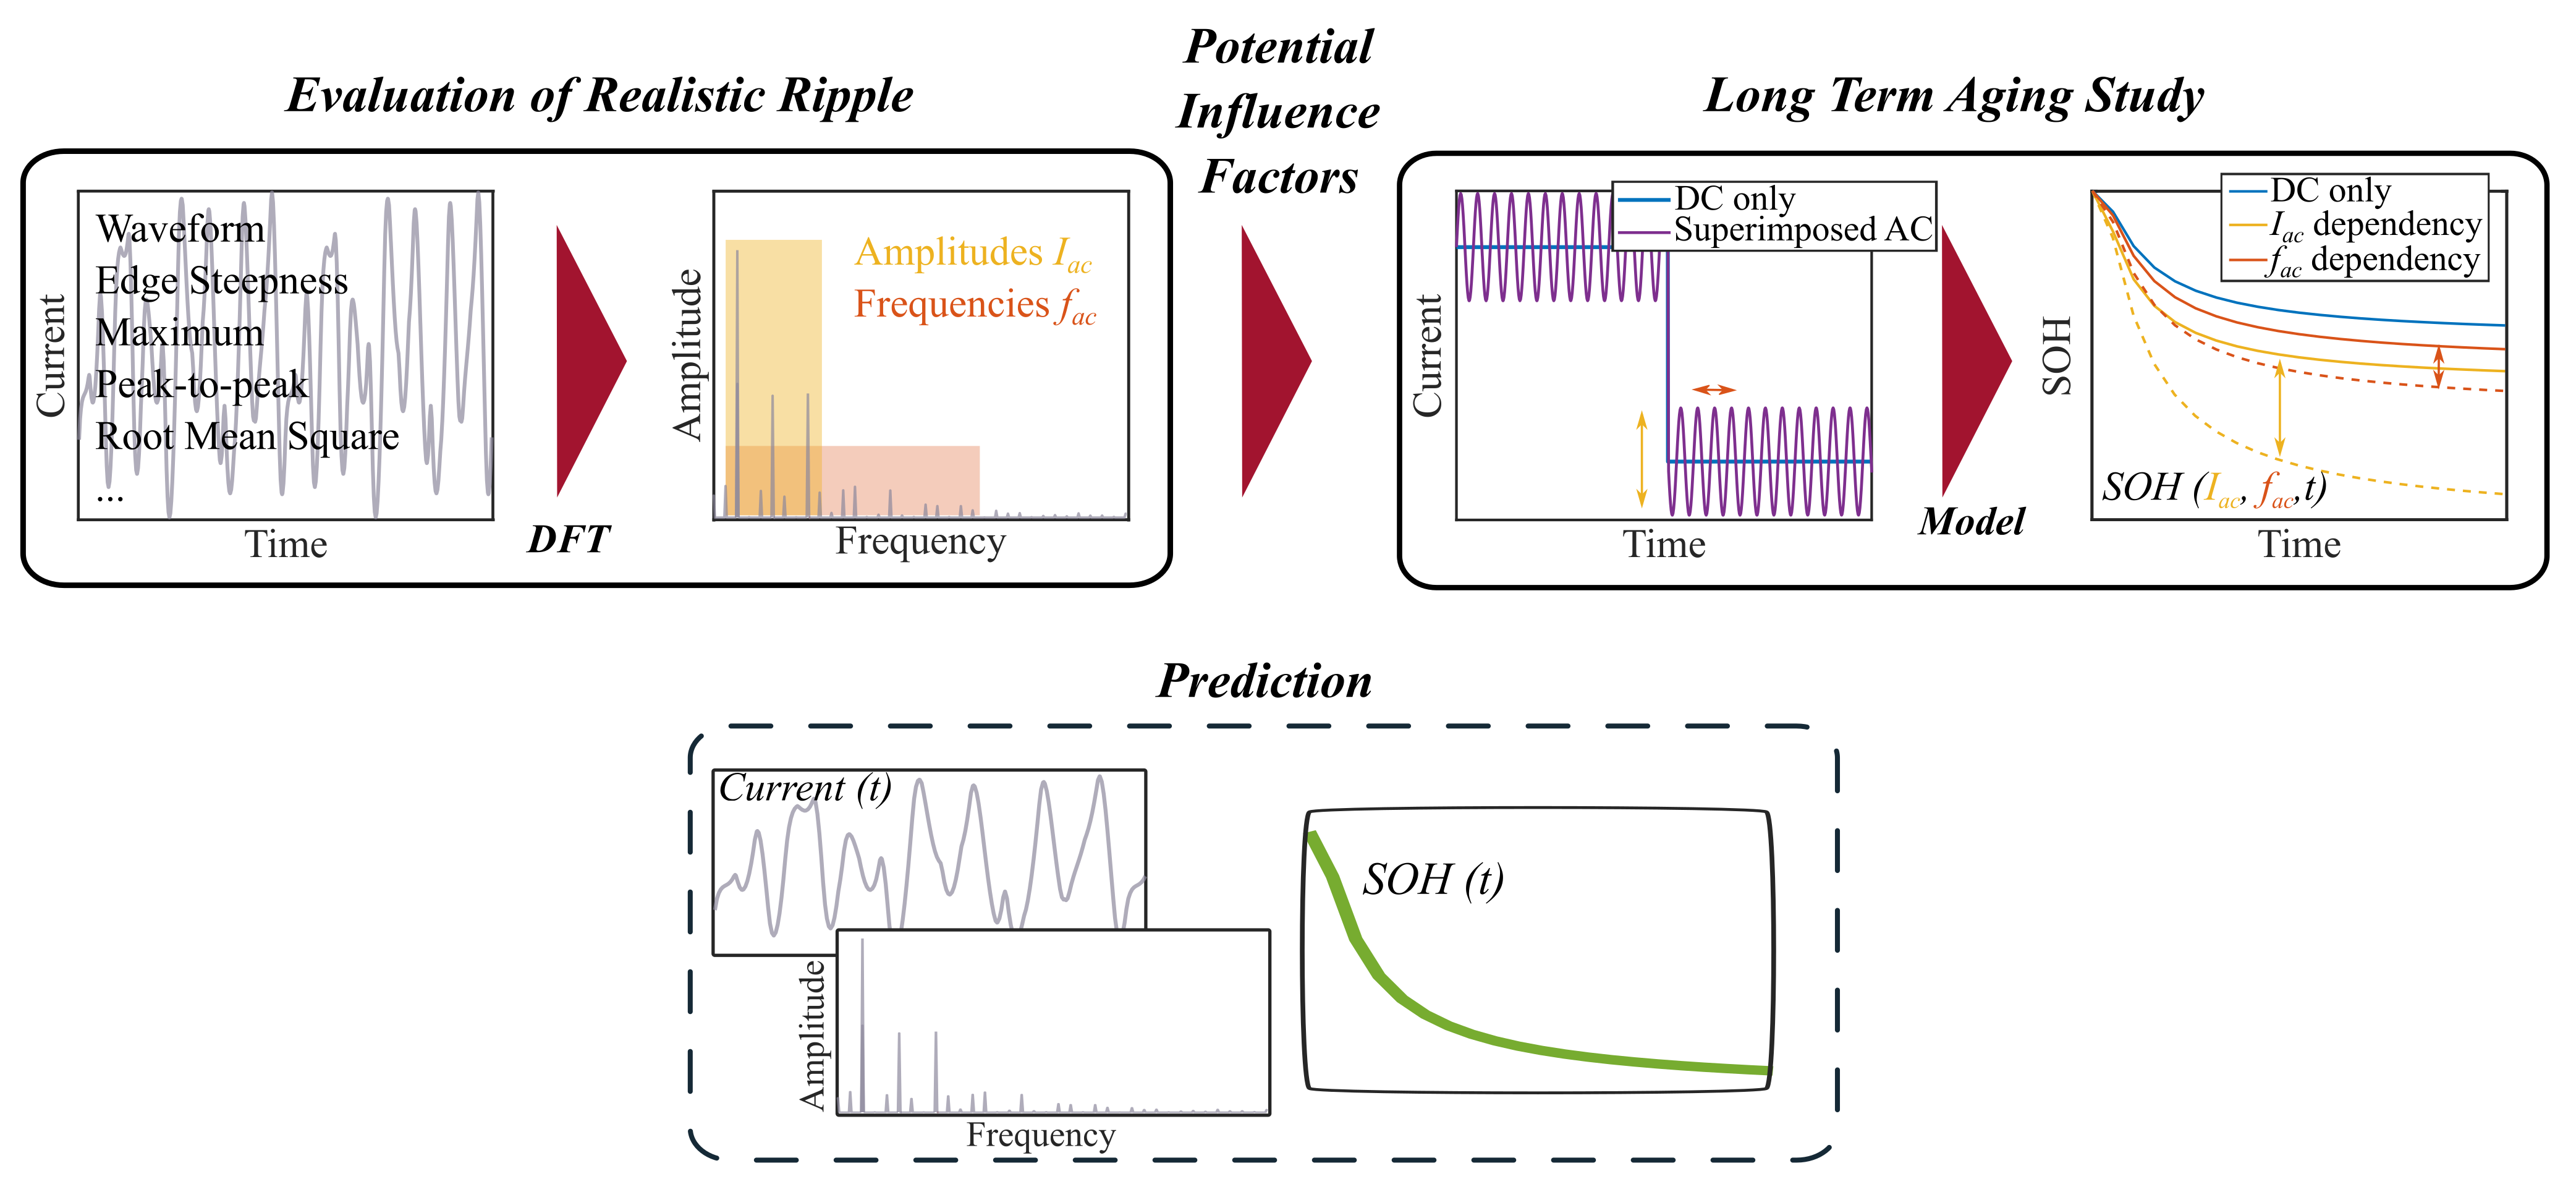
2.1. Ripple Current
2.2. Long-Term Aging Study
3. Experimental Design
3.1. Modeling of the Ripple Current
3.2. Long-Term Aging Study
3.2.1. Sinusoidal and DC Reference Tests
3.2.2. Calendar Tests
3.2.3. Artificial Ripple Tests
3.2.4. Realistic Ripple Tests
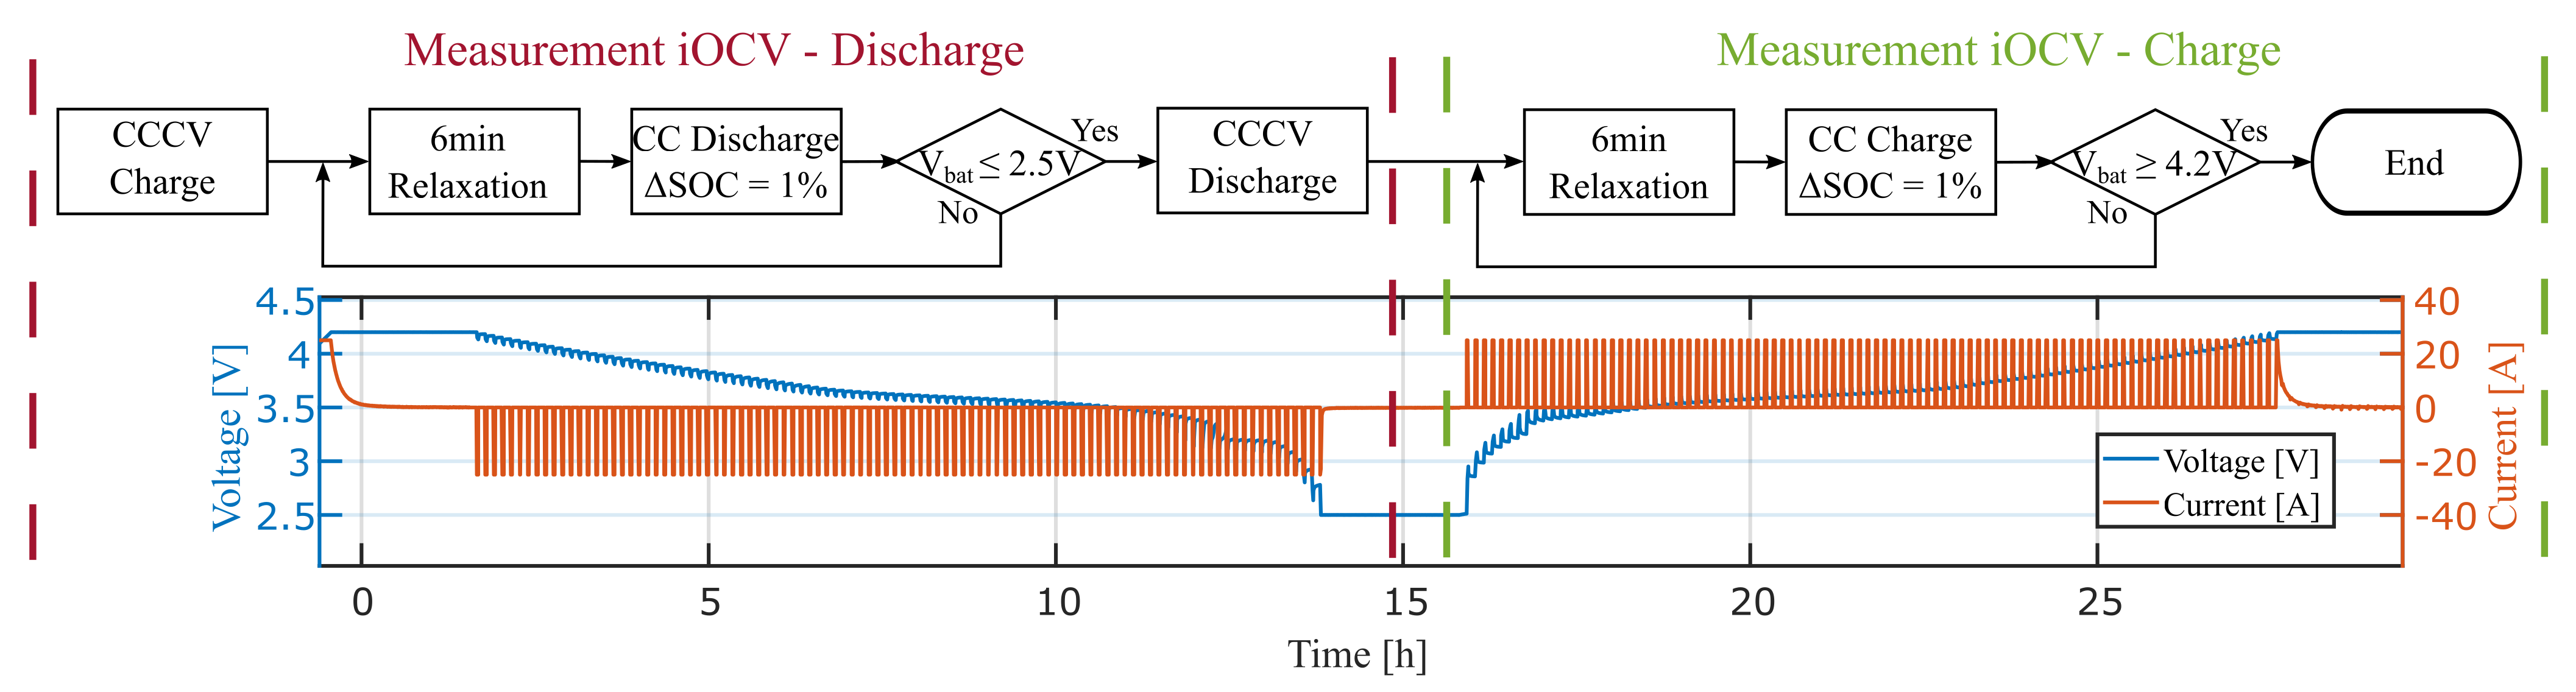
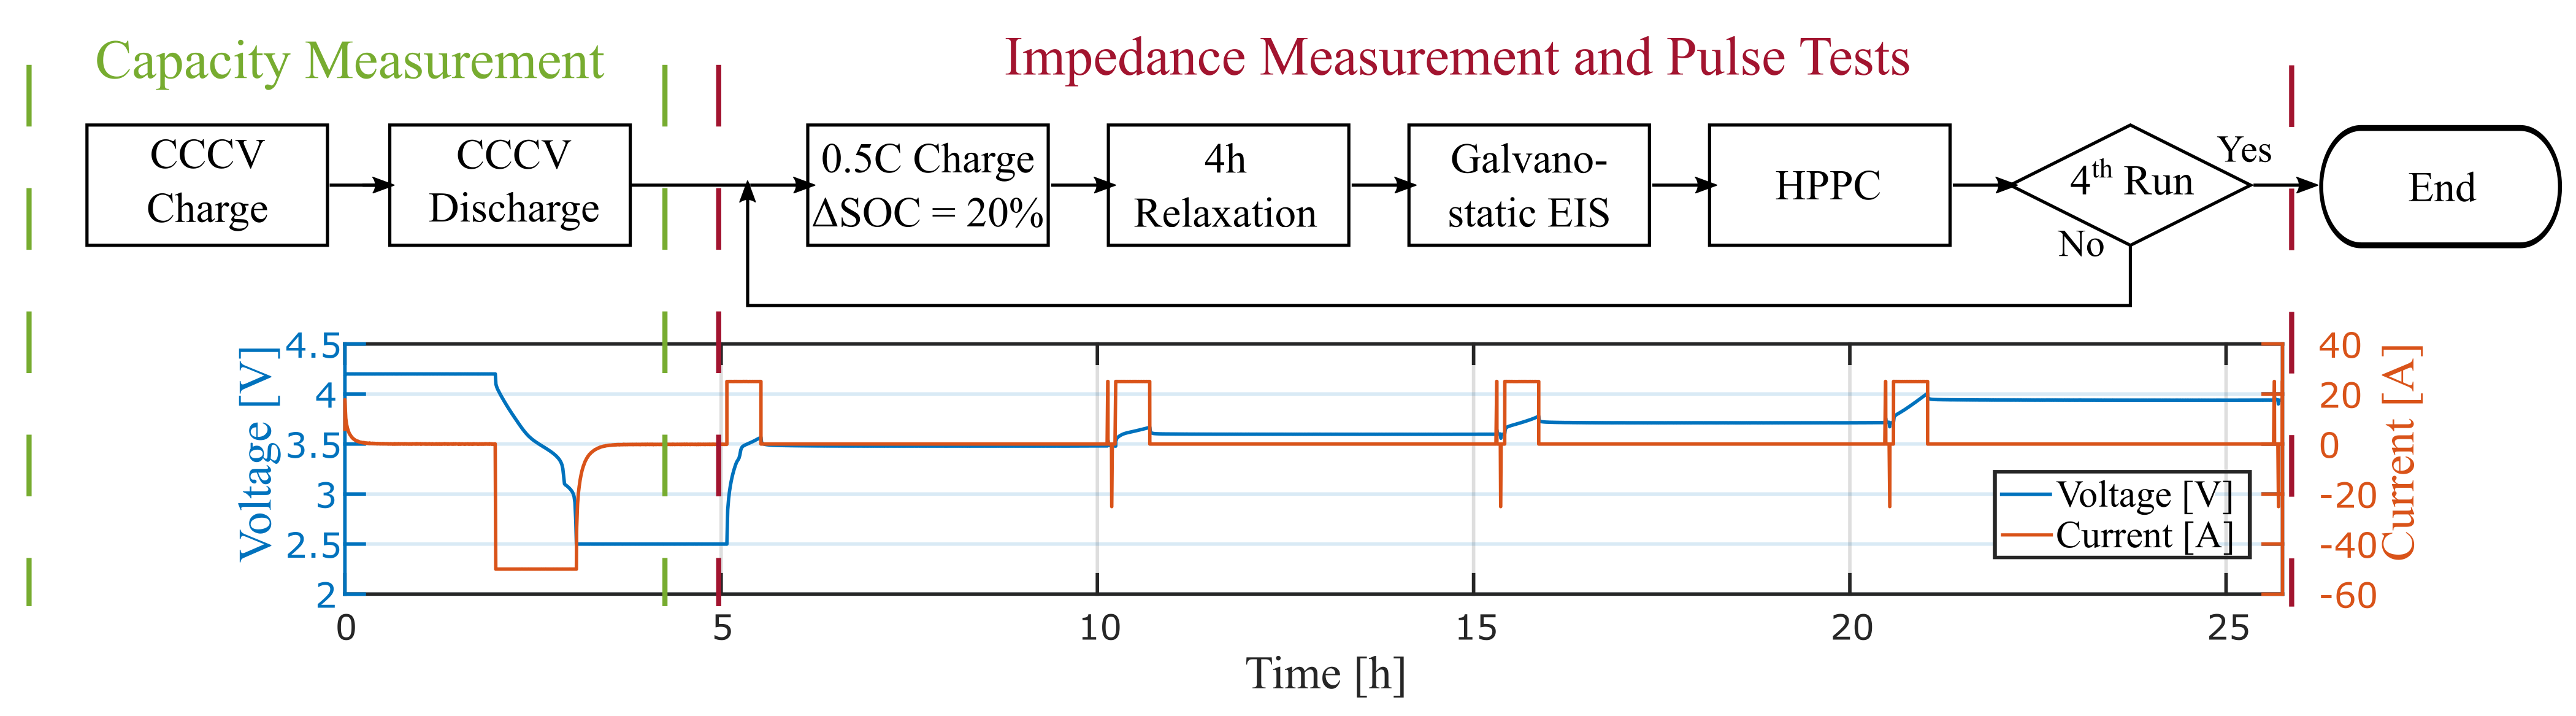
3.2.5. Checkups
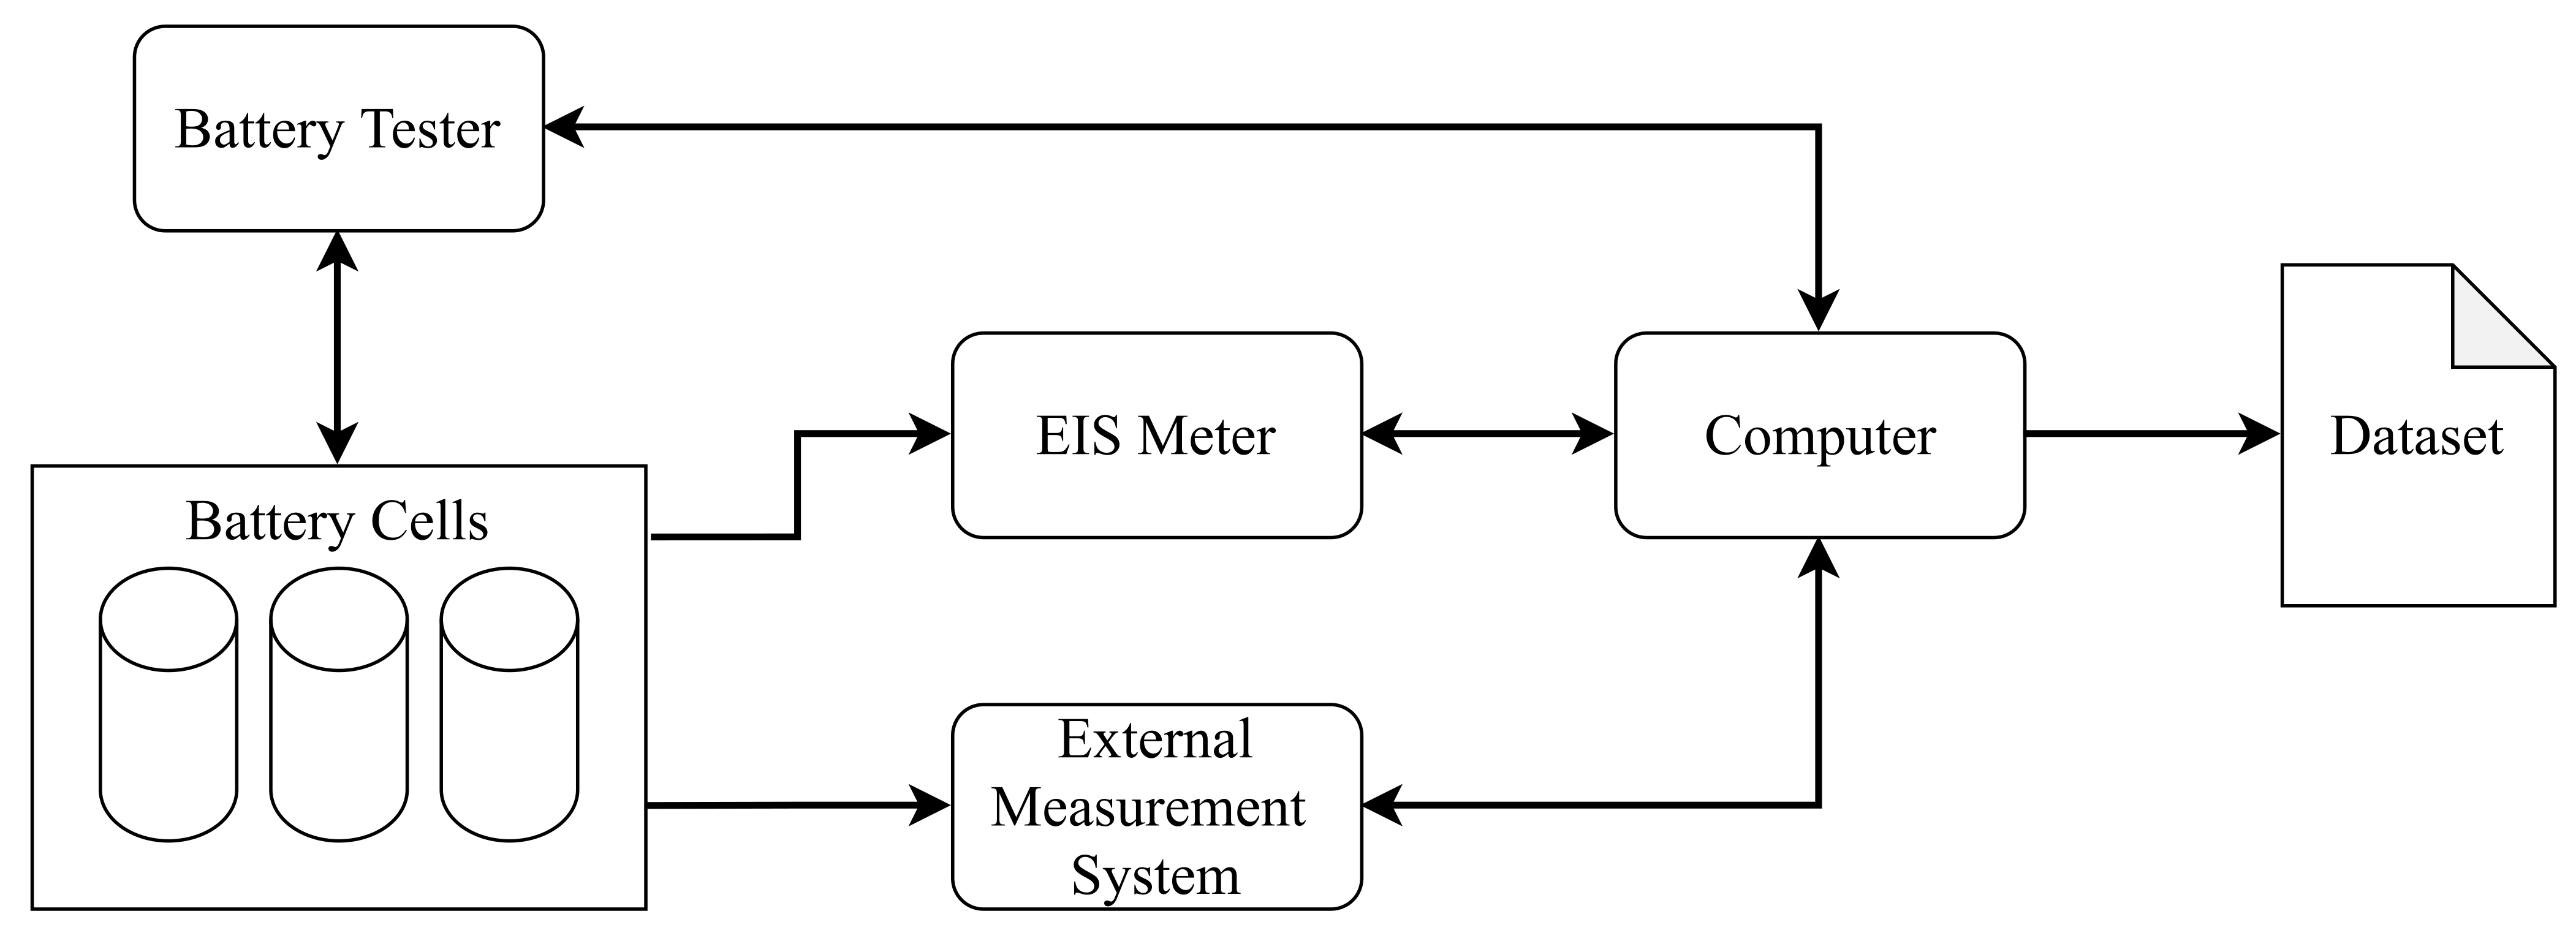
4. Experimental Setup
4.1. Test Bench DC Reference and Calendar Tests
4.2. Test Bench Sinusoidal/Ripple Tests
- Superposition of 1–4 sinusoidal oscillations to the applied DC current with freely adjustable amplitudes and frequencies
- −
- Amplitudes: 0–25 A, 10 mA resolution
- −
- Frequency range: 1–50 kHz; 1 kHz resolution
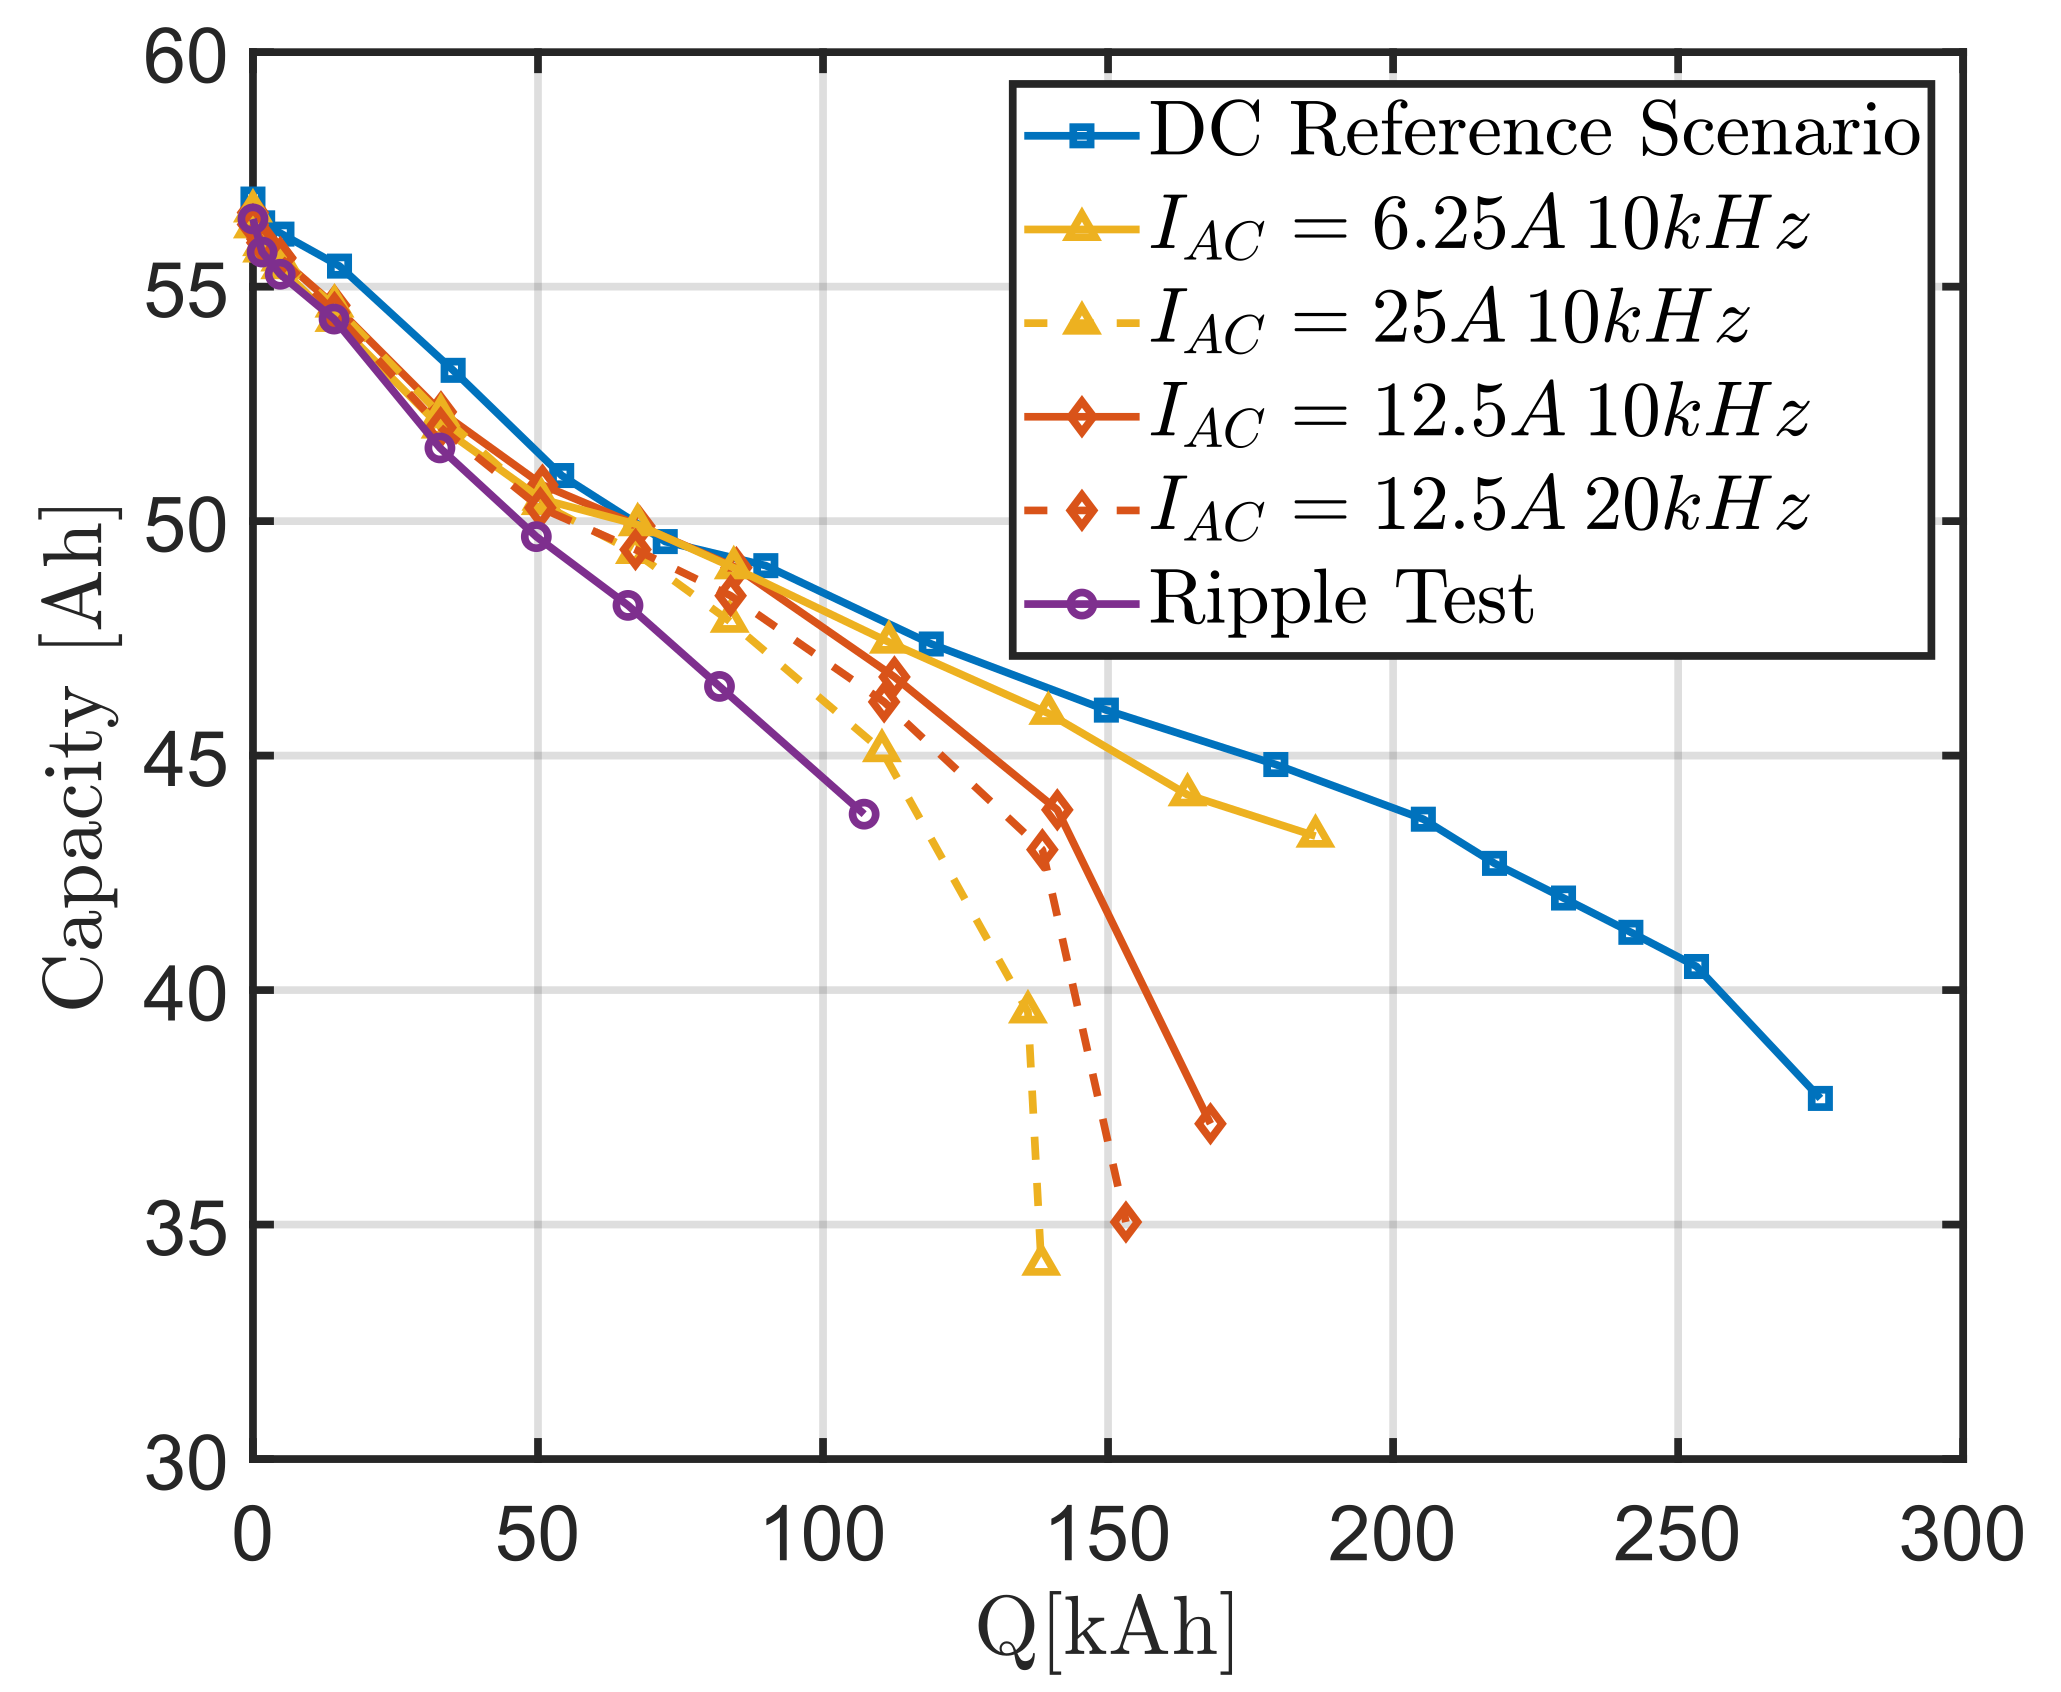
5. Results
6. Conclusions
Author Contributions
Funding
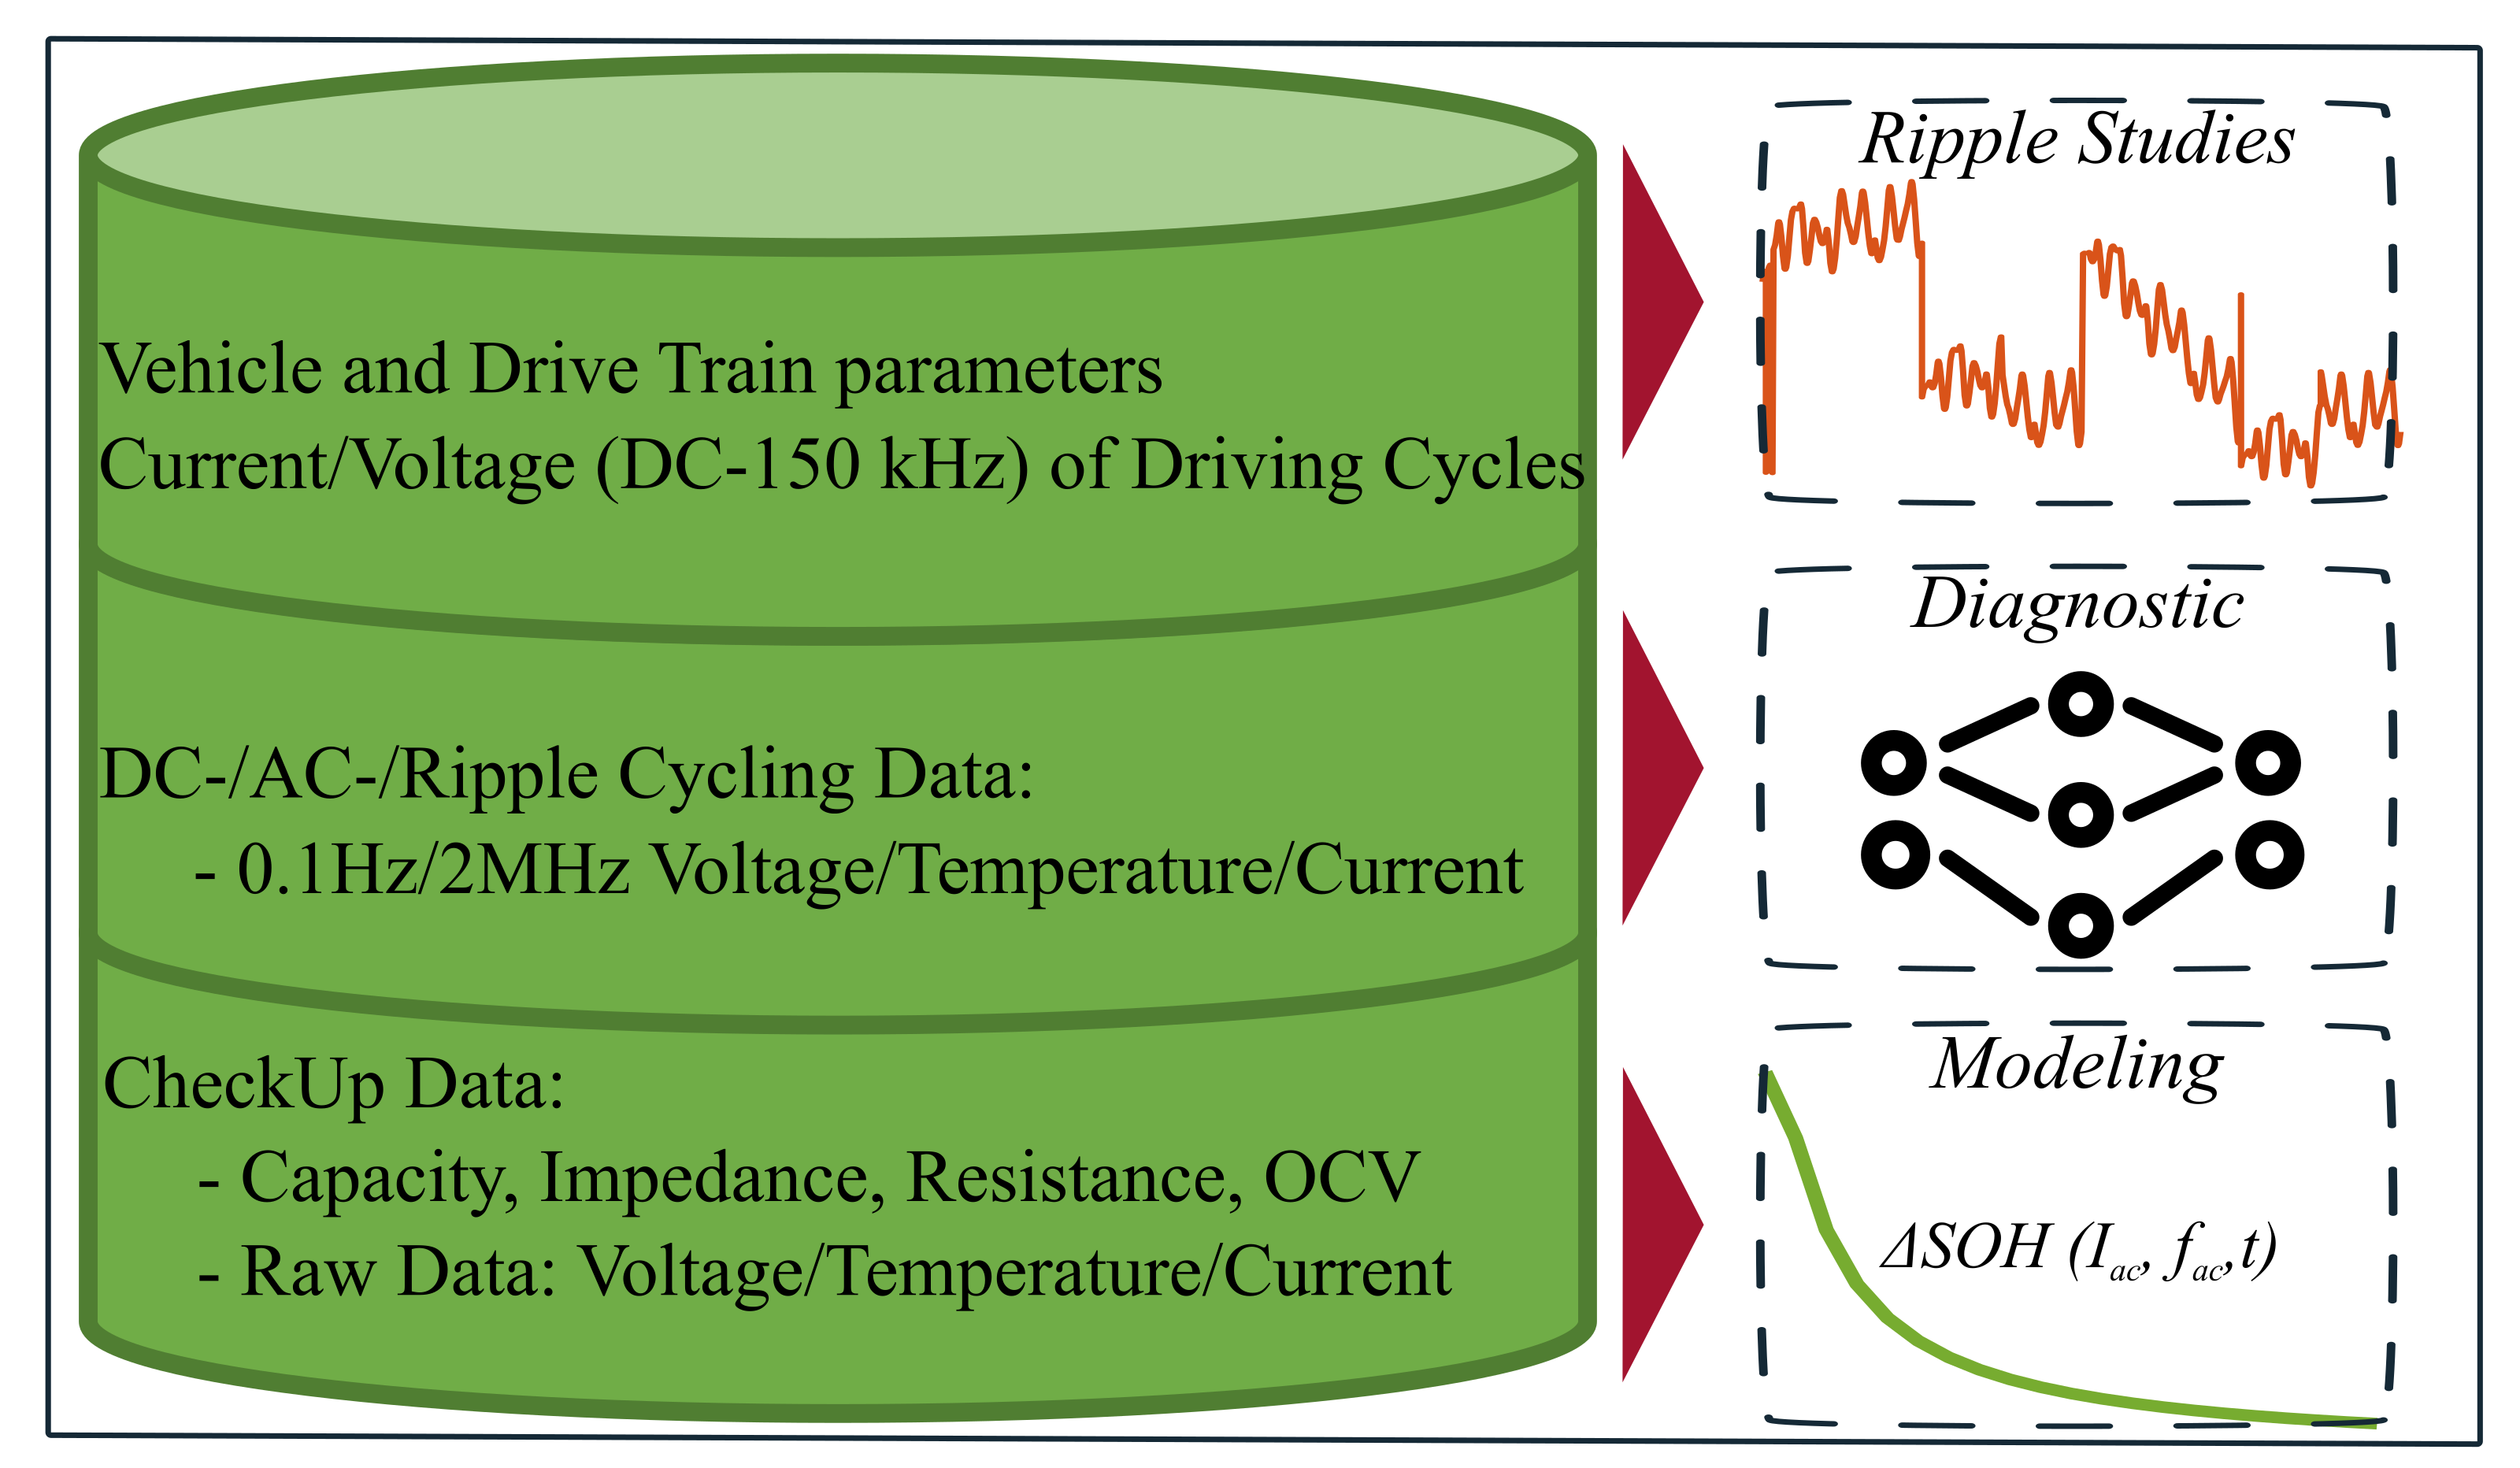
Data Availability Statement
Acknowledgments
Conflicts of Interest
Abbreviations
| AC | Alternating current |
| CC | Constant-current |
| CCCV | Constant-current-constant-voltage |
| DC | Direct current |
| DFT | Discrete Fourier Transformation |
| DOAJ | Directory of open access journals |
| DoD | Depth of discharge |
| DVA | Differential voltage analysis |
| EET | Electrical Energy Storage Technology |
| EIS | Electrochemical impedance spectroscopy |
| EV | Electric vehicle |
| ICA | Incremental capacity analysis |
| HPPC | Hybrid pulse power characterization |
| LIBs | Lithium-ion batteries |
| MDPI | Multidisciplinary Digital Publishing Institute |
| MDT | Electronic Measurement and Diagnostic Technology |
| OCV | Open-circuit voltage |
| OP | Operating point |
| PE | Power Electronics |
| SEI | Solid electrolyte interface |
| SoC | State of charge |
| SoH | State of health |
| UDDS | Urban Dynamometer Driving Schedule |
| WLTC | Worldwide harmonized Light-duty Test Cycle |
References
- Weber, D.; Gentejohann, M.; Goldammer, E.; Schlüter, M.; Dieckerhoff, S.; Gühmann, C.; Kowal, J. The SiCWell Dataset. IEEE DataPort 2021. [Google Scholar] [CrossRef]
- Schlüter, M.; Gentejohann, M.; Dieckerhoff, S. High Bandwidth On-Board DC Voltage and Current Measurements of the Main Inverter of an Electric Vehicle. IEEE DataPort 2021. [Google Scholar] [CrossRef]
- Juang, L.W.; Kollmeyer, P.J.; Anders, A.E.; Jahns, T.M.; Lorenz, R.D.; Gao, D. Investigation of the influence of superimposed AC current on lithium-ion battery aging using statistical design of experiments. J. Energy Storage 2017, 11, 93–103. [Google Scholar] [CrossRef]
- Savoye, F.; Venet, P.; Pelissier, S.; Millet, M.; Groot, J. Impact of periodic current pulses on Li-ion batteries lifetime in vehicular application. Int. J. Electr. Hybrid Veh. 2015, 7, 323. [Google Scholar] [CrossRef]
- Uddin, K.; Moore, A.D.; Barai, A.; Marco, J. The effects of high frequency current ripple on electric vehicle battery performance. Appl. Energy 2016, 178, 142–154. [Google Scholar] [CrossRef] [Green Version]
- Uddin, K.; Somerville, L.; Barai, A.; Lain, M.; Ashwin, T.R.; Jennings, P.; Marco, J. The impact of high-frequency-high-current perturbations on film formation at the negative electrode-electrolyte interface. Electrochim. Acta 2017, 233, 1–12. [Google Scholar] [CrossRef]
- Brand, M.J.; Hofmann, M.H.; Schuster, S.S.; Keil, P.; Jossen, A. The Influence of Current Ripples on the Lifetime of Lithium-Ion Batteries. IEEE Trans. Veh. Technol. 2018, 67, 10438–10445. [Google Scholar] [CrossRef]
- Bessman, A.; Soares, R.; Wallmark, O.; Svens, P.; Lindbergh, G. Aging effects of AC harmonics on lithium-ion cells. J. Energy Storage 2019, 21, 741–749. [Google Scholar] [CrossRef]
- Amamra, S.A.; Tripathy, Y.; Barai, A.; Moore, A.D.; Marco, J. Electric Vehicle Battery Performance Investigation Based on Real World Current Harmonics. Energies 2020, 13, 489. [Google Scholar] [CrossRef] [Green Version]
- Soares, R.; Bessman, A.; Wallmark, O.; Lindbergh, G.; Svens, P. An Experimental Setup with Alternating Current Capability for Evaluating Large Lithium-Ion Battery Cells. Batteries 2018, 4, 38. [Google Scholar] [CrossRef] [Green Version]
- Chen, L.R.; Chen, J.J.; Ho, C.M.; Wu, S.L.; Shieh, D.T. Improvement of Li-ion Battery Discharging Performance by Pulse and Sinusoidal Current Strategies. IEEE Trans. Ind. Electron. 2013, 60, 5620–5628. [Google Scholar] [CrossRef]
- Chen, L.R.; Wu, S.L.; Shieh, D.T.; Chen, T.R. Sinusoidal-Ripple-Current Charging Strategy and Optimal Charging Frequency Study for Li-Ion Batteries. IEEE Trans. Ind. Electron. 2013, 60, 88–97. [Google Scholar] [CrossRef]
- Prasad, R.; Namuduri, C.; Kollmeyer, P. Onboard unidirectional automotive G2V battery charger using sine charging and its effect on li-ion batteries. In Proceedings of the 2015 IEEE Energy Conversion Congress and Exposition (ECCE), Montreal, QC, Canada, 20–24 September 2015; pp. 6299–6305. [Google Scholar] [CrossRef]
- Beh, H.Z.Z.; Covic, G.A.; Boys, J.T. Effects of pulse and DC charging on lithium iron phosphate (LiFePO4) batteries. In Proceedings of the 2013 IEEE Energy Conversion Congress and Exposition, Denver, CO, USA, 15–19 September 2013; pp. 315–320. [Google Scholar] [CrossRef]
- Klass, V.; Behm, M.; Lindbergh, G. Capturing lithium-ion battery dynamics with support vector machine-based battery model. J. Power Sources 2015, 298, 92–101. [Google Scholar] [CrossRef]
- McGrath, B.P.; Holmes, D.G. A General Analytical Method for Calculating Inverter DC-Link Current Harmonics. IEEE Trans. Ind. Appl. 2009, 45, 1851–1859. [Google Scholar] [CrossRef]
- SiCWell—Einfluss von Siliziumcarbid-Wechselrichtern auf die Lebensdauer von Traktionsbatterien. Available online: https://www.elektronikforschung.de/projekte/sicwell (accessed on 26 January 2022).
- Gentejohann, M.; Schlüter, M.; Hepp, M.; Dieckerhoff, S. Driving Cycle Analysis of the DC Bus Current Ripple in Electric Vehicles. In Proceedings of the 2021 23rd European Conference on Power Electronics and Applications (EPE’21 ECCE Europe), Virtual Conference, Ghent, Belgium, 6–10 September 2021. [Google Scholar]
- ISO 21498-2:2021. Electrically Propelled Road Vehicles—Electrical Specifications and Tests for Voltage Class B Systems and Components—Part 2: Electrical Tests for components; ISO: Geneva, Switzerland, 2021. [Google Scholar]
- Tutuianu, M.; Bonnel, P.; Ciuffo, B.; Haniu, T.; Ichikawa, N.; Marotta, A.; Pavlovic, J.; Steven, H. Development of the World-wide harmonized Light duty Test Cycle (WLTC) and a possible pathway for its introduction in the European legislation. Transp. Res. Part Transp. Environ. 2015, 40, 61–75. [Google Scholar] [CrossRef]
- Kruse, R.E.; Huls, T.A. Development of the Federal Urban Driving Schedule. In National Automobile Engineering Meeting; SAE International: Warrendale, PA, USA, 1973. [Google Scholar] [CrossRef]
- Pastor-Fernández, C.; Yu, T.F.; Widanage, W.D.; Marco, J. Critical review of non-invasive diagnosis techniques for quantification of degradation modes in lithium-ion batteries. Renew. Sustain. Energy Rev. 2019, 109, 138–159. [Google Scholar] [CrossRef]
- Petzl, M.; Danzer, M.A. Advancements in OCV Measurement and Analysis for Lithium-Ion Batteries. IEEE Trans. Energy Convers. 2013, 28, 675–681. [Google Scholar] [CrossRef]
- Wildfeuer, L.; Gieler, P.; Karger, A. Combining the Distribution of Relaxation Times from EIS and Time-Domain Data for Parameterizing Equivalent Circuit Models of Lithium-Ion Batteries. Batteries 2021, 7, 52. [Google Scholar] [CrossRef]
- Barai, A.; Widanage, W.D.; Marco, J.; McGordon, A.; Jennings, P. A study of the open circuit voltage characterization technique and hysteresis assessment of lithium-ion cells. J. Power Sources 2015, 295, 99–107. [Google Scholar] [CrossRef]


| Amplitude | 6.25 A | 12.5 A | 25 A | 0 A | |
|---|---|---|---|---|---|
| Frequency | |||||
| 10 kHz | AC07-09 | AC01-03 | AC04-06 | DC01-03 | |
| 20 kHz | AC13-15 | ||||
| 40 kHz | AC16-18 | AC10-12 | |||
| DC charge current () | 0.75 C |
| DC discharge current () | 1.6 C |
| End of charge voltage () | 4.0 V |
| Cycle depth () | ≈30% |
| Average SoC () | ≈60% |
| Ambient temperature () | 25 C |
| SoC | 20% | 45% | 60% | 80% | |
|---|---|---|---|---|---|
| Temperature | |||||
| 35 C | Ka03/04 | Ka01/02 | |||
| 45 C | Ka07/08 | Ka09/10 | Ka11/12 | Ka05/06 | |
| AC | / | / | / | / | |
|---|---|---|---|---|---|
| Operating Point (OP) | |||||
| Ripple OP1 | 11.28 A/9 kHz | 7.02 A/11 kHz | 2.62 A/10 kHz | 2.53 A/20 kHz | |
| Ripple OP2 | 12.01 A/19 kHz | 9.00 A/21 kHz | 2.57 A/40 kHz | 2.23 A/16 kHz | |
| Ripple OP3 | 7.20 A/40 kHz | 4.77 A/20 kHz | - | - | |
Publisher’s Note: MDPI stays neutral with regard to jurisdictional claims in published maps and institutional affiliations. |
© 2022 by the authors. Licensee MDPI, Basel, Switzerland. This article is an open access article distributed under the terms and conditions of the Creative Commons Attribution (CC BY) license (https://creativecommons.org/licenses/by/4.0/).
Share and Cite
Goldammer, E.; Gentejohann, M.; Schlüter, M.; Weber, D.; Wondrak, W.; Dieckerhoff, S.; Gühmann, C.; Kowal, J. The Impact of an Overlaid Ripple Current on Battery Aging: The Development of the SiCWell Dataset. Batteries 2022, 8, 11. https://doi.org/10.3390/batteries8020011
Goldammer E, Gentejohann M, Schlüter M, Weber D, Wondrak W, Dieckerhoff S, Gühmann C, Kowal J. The Impact of an Overlaid Ripple Current on Battery Aging: The Development of the SiCWell Dataset. Batteries. 2022; 8(2):11. https://doi.org/10.3390/batteries8020011
Chicago/Turabian StyleGoldammer, Erik, Marius Gentejohann, Michael Schlüter, Daniel Weber, Wolfgang Wondrak, Sibylle Dieckerhoff, Clemens Gühmann, and Julia Kowal. 2022. "The Impact of an Overlaid Ripple Current on Battery Aging: The Development of the SiCWell Dataset" Batteries 8, no. 2: 11. https://doi.org/10.3390/batteries8020011
APA StyleGoldammer, E., Gentejohann, M., Schlüter, M., Weber, D., Wondrak, W., Dieckerhoff, S., Gühmann, C., & Kowal, J. (2022). The Impact of an Overlaid Ripple Current on Battery Aging: The Development of the SiCWell Dataset. Batteries, 8(2), 11. https://doi.org/10.3390/batteries8020011