1. Introduction
A lithium-ion battery is a secondary battery that can be continuously used through charging. This technology is advantageous in terms of its high energy density and power, as well as low self-discharge ratio [
1,
2]. Consequently, demand for lithium-ion batteries has risen rapidly in various fields, such as for automobile and electronic products. Lithium-ion batteries are also used as efficient energy supply systems for a carbon-neutral transition [
3]. Energy storage systems are applied in small-scale facilities to ensure stable power supply with distributed power generation [
4,
5,
6]. The International Energy Agency has published a report to establish a roadmap for the energy sector, taking into account the severity of global climate change [
7]. Therefore, globally, the transition to carbon-neutral implementation strategies, energy storage, and supply systems has drawn increasing interest.
Recently, a short circuit and the subsequent thermal runaway (TR) reaction of a lithium-ion battery resulted in a grave fire-related accident; this event reveals the challenge of ensuring the stability of these types of batteries. The TR reaction occurs because of various causative substances, via complex mechanisms [
8,
9,
10]. For example, a lithium-ion battery mainly comprises a cathode (CA), an anode (AN), a separator, and an electrolyte (ELE); each constituent is highly reactive and includes a combustible electrolyte. Different abuse conditions in lithium-ion batteries leads to internal and external short circuit, ejection of combustible electrolyte, self-heating of the battery, and flame and fire [
11]. In addition, in electric vehicles, the battery module includes multiple lithium-ion battery cells, and one of these batteries may encounter abnormal TR. Accordingly, TR propagation to adjacent objects is highly probable, and will cause a chain thermal-runaway accident involving a large number of battery cells. Safety of passengers in electric vehicles is paramount and, to prevent accidents caused by TR in batteries, the standard safety time is a crucial factor.
In 2020, as the number of electric-vehicle-related accidents caused by TR of lithium-ion batteries increased rapidly in China, the GB 38031-2020 Electric Vehicle Traction Battery Requirements were enacted. They specify that no harmful gas, including electrolyte gas, should be introduced into the vehicle for at least 5 min after the occurrence and detection of an abnormality in the battery.
In this perspective, several countries have devised strategies to extinguish fires, and research is actively conducted for diagnosing an abnormal battery state through pre-measurement and detection of various factors, such as voltage and temperature, to prevent fire accidents caused by TR. However, no technically sound alternatives are currently available for suppressing this TR phenomenon [
12,
13,
14]. In the event of self-heating, there is a limit to suppressing the TR solely via battery pre-diagnosis and control of ambient oxygen [
15]; moreover, suppressing TR is a challenging task until the battery or combustible material has completely burned. As mentioned earlier, the TR of the battery is driven by complex causes such as electrical, physical, and chemical actions, unlike that observed in general fire-related accidents. Thus, identifying the TR mechanism is essential for establishing a stable energy-supply system using lithium-ion batteries.
The causes of TR in lithium-ion batteries can be largely classified as short circuits caused by physical damage or penetration, high temperature exposure, and electrical overcharging. TR is a phenomenon in which electrical and chemical energy is converted to thermal energy, and is closely related to combustion reactions. Recently, research on TR characteristics has revealed the underlying mechanism, which is characterized by the changes in the structure of a secondary battery, a component of a cathode material, anode material, and state of charge (SOC) [
16]. However, there is a limitation, in that the relationship between the factors affecting the TR of the battery is not clear. Among such factors, internal short circuit in lithium-ion batteries has been identified as a primary cause of TR, and a correlation between the internal electrodes and TR, a result of exposure to high temperature, has been reported.
The correlation between various factors concerning the electrode and TR has been analyzed. For example, TR in a battery has been reported to occur even in the absence of an internal short circuit; thus, the hidden mechanism of TR triggering was identified as chemical crosstalk between the cathode and anode [
17]. Furthermore, strategies have been adopted to derive a correlation between TR and various factors, such as estimating the energy density of a battery by analyzing the correlation between carbon monoxide (CO) and carbon dioxide (CO
2). In addition, the heat transfer to adjacent surrounding cells during TR of a single object in modules including multiple cells has been numerically analyzed, and the results are reported in the literature [
18]. The correlation between the internal states (factor) of the battery, which has been explored in previous research, and TR can be summarized briefly as follows:
Previous studies did not clearly present a correlation between the TR occurring in batteries and time, in particular the effect of constant heat at a specific temperature on a factor, namely the TR time. Reportedly, TR occurred at approximately 200 °C in a nickel–cobalt–manganese lithium-ion battery that was heated for approximately 4 h at a temperature increment rate of 0.01 °C/min [
16,
18]. However, the TR experiment under this condition may encounter TR at a relatively low temperature owing to the low increment rate of temperature and thermal energy accumulation. Moreover, this approach also has certain limitations in terms of predicting the time required for chain TR and explosions resulting from heat transfer to adjacent components. Previous studies have focused on research to clearly identify the vent generation temperature (T1), rise in temperature through rapid heating (T2), and maximum thermal-runaway temperature (T3) in the event of TR by increasing the environmental temperature of the battery gradually via accelerated rate calorimetry. Owing to the limitation of the existing research method, safety standards for ensuring the safety time may be difficult to establish when a TR-related accident occurs in battery modules used in energy storage systems or electric vehicles. On the basis of heat conduction, this study explores the relationship between TR time and battery cell adjacent temperature.
TR time was obtained through short circuiting the cell, and the relevant criteria of safety trends was established taking into account results of recent studies concerning the electrolyte and TR after another eruption of time, which was judged to be an important factor for establishing safety standards. This research sought to obtain a correlation with respect to the TR temperature. A change in TR characteristics was observed while designing a method and apparatus for the thermal shock experiment and applying a specific temperature of nickel–cobalt-aluminum (NCA) lithium-ion battery. Finally, a new standard is proposed for characterizing the effect on the TR time for .
2. Materials and Methods
2.1. Experimetal Methodology
For characterizing the effect of thermal abuse conditions on the TR, a lithium-ion battery employed in various electronic products and electric motorcycles was considered; it comprised a commercially available cylindrical 18650 NCA-based cathode material (INR18650-35E, SAMSUNG SDI, Yongin, Korea). The average mass of 10 batteries was 48.33 (±0.06) g. According to the model specification, the nominal voltage is 3.6 V, with voltage limits 2.65–4.2 V, and the maximum current for discharge-charge is 8-2 A. During the experiment, a data logger model (FW1020, Yokogawa, Tokyo, Japan) was used to record the temperature and voltage data of the battery, and an image was captured using a camera (HERO 10, GoPro, San Mateo, CA, USA) to observe the TR of the lithium-ion battery in real time. A chamber made of reinforced glass was installed to contain any accidents caused by ambient damage. The combustion effect of the battery vent gas generated after TR was minimized by supplying nitrogen (99.9%), rather than air, at a flow rate of 25 L/min using mass flow controller (LINE-TECH, Daejeon, Korea).
The experimental methods can be classified into two types: battery thermal shock for pre-battery charging, and TR simulation. The battery open-circuit voltage (OCV) is important information when estimating the SOC of the battery, and SOC of the battery can be estimated using the OCV-SOC curve [
19]. Therefore, the OCV-SOC curve was derived using battery testing system (BTS4000-5V6A, Nweare, Shenzhen, China). The OCV was charged to approximately 4.05 (±0.01) V under all experimental conditions. When the voltage range of the battery was 2.7 to 4.2 V, the OCV was 4.05 V, a voltage corresponding to approximately 93.3% of the SOC. In order to accurately measure the OCV to estimate the SOC, a rest time of at least 30 min is required. After charging, the charge was stabilized for approximately 30 min or more; subsequently, the TR experiment was conducted. As shown in
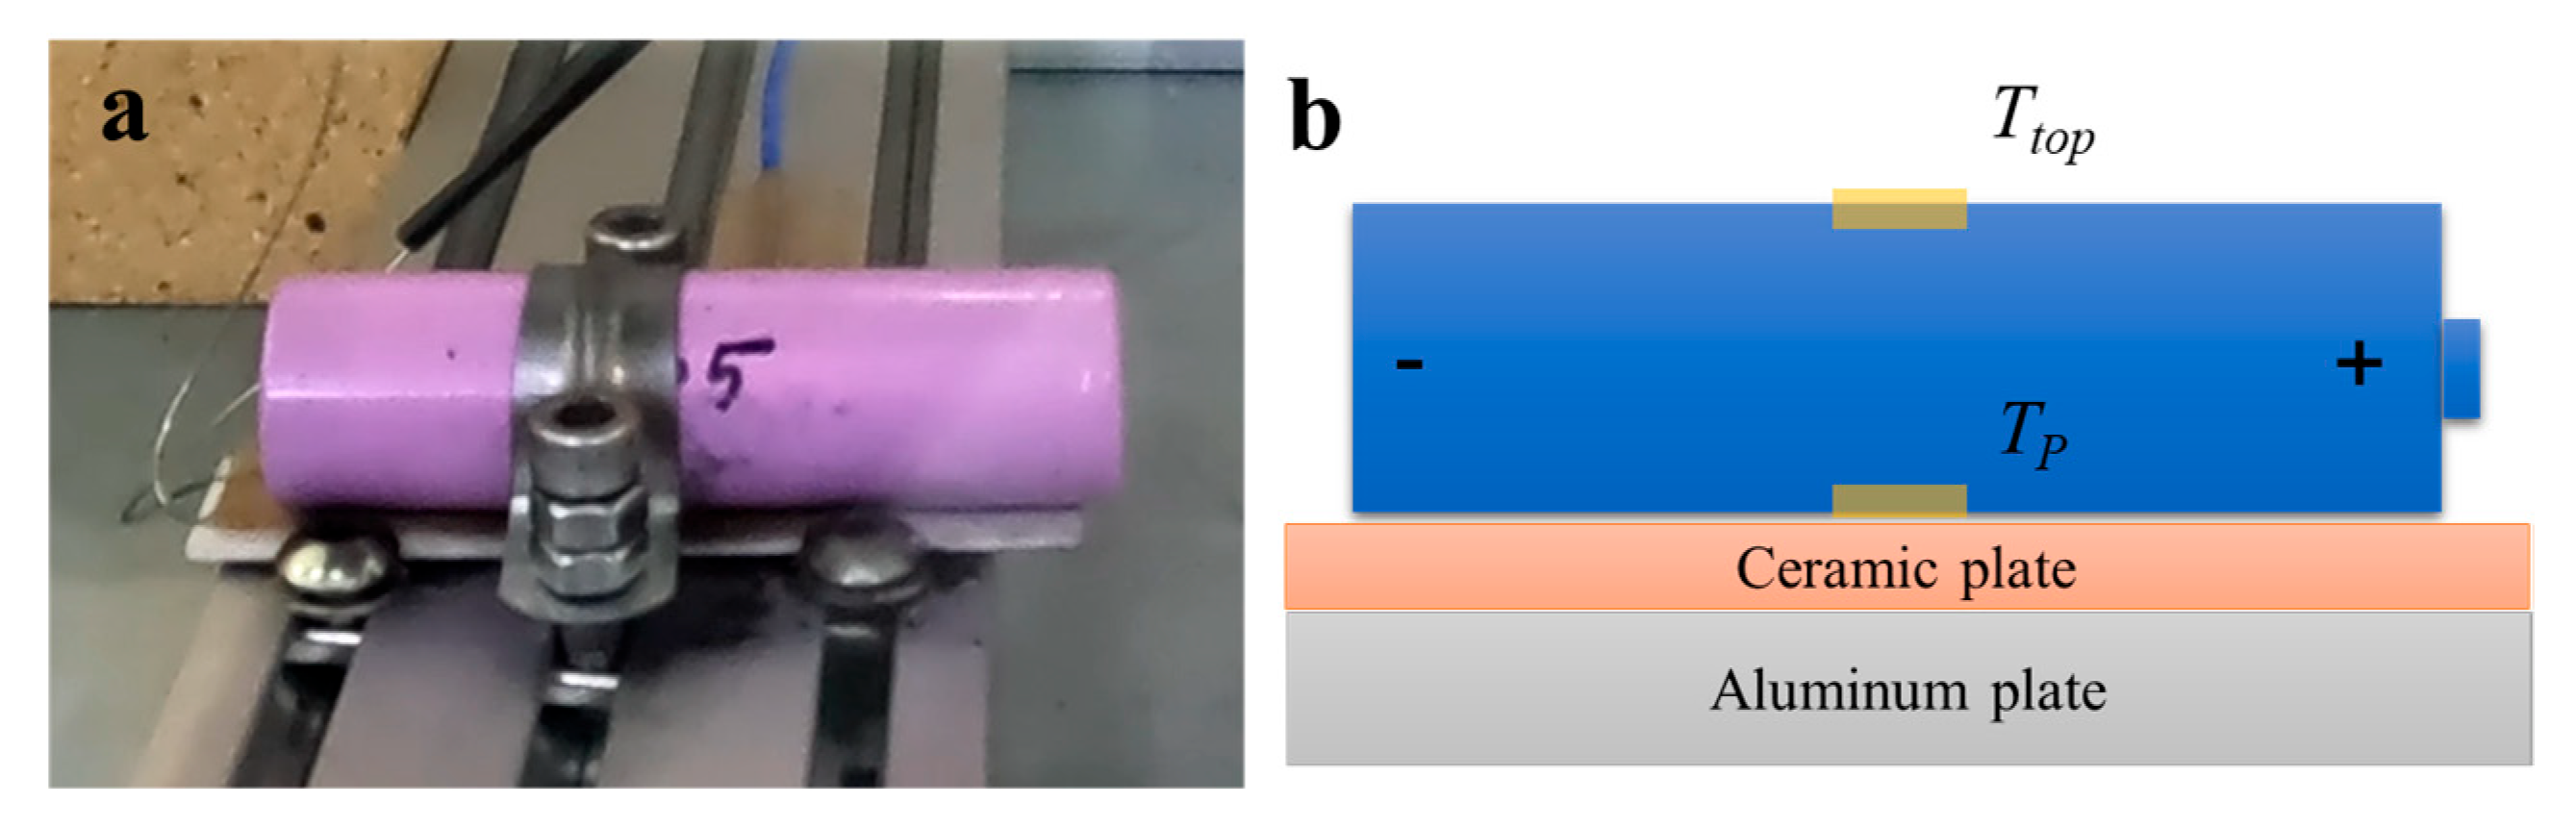
Figure 1, for the thermal shock experiment on the battery, an alumina–ceramic-based plate heater (dimensions: 15 mm × 70 mm × 6 mm), a temperature controller (TC200P, Misung Scientific, Yangju, SKorea), and K-type thermocouple were rapidly heated to
of 250–550 °C for battery heating.
2.2. Chemical Kinetic Analysis for Arrhenius Correlation
This study aims to analyze substitution of chemical kinetics during TR, depending on the plate’s surface temperature. Several studies have focused on numerical simulations of TR in batteries. Although several studies report on reaction mechanisms related to battery TR, studies focusing on kinetics, yielding a simple characterization of actual battery TR, are yet to be performed, and the internal mechanism driving this phenomenon remains unknown.
This study assumes that the battery mechanisms can be classified into two global reactions during TR. The first reaction begins at
, i.e., when the raw material of the lithium-ion battery starts receiving thermal abuse, and continues until
, i.e., when the gaseous electrolyte begins to vent (
). The second reaction proceeds in two timeframes, from the moment when the first reaction is completed (
) to the moment when the heating rate of the battery is 1 °C/s (
). The TR time difference,
, may be expressed according to the temperature using the chemical reaction kinetics expressed by the Arrhenius equation. As shown in Equation (2), the speed constant of the existing Arrhenius equation is defined as the activation energy (
), temperature (
), and gas constant (
) [
20].
In the Arrhenius equation, the correlation Equation (4), relating the plate temperature (
) of the battery to the reaction rate (
) of Equation (3), can be derived relating
to
of the battery TR.
2.3. TR Gas Composition Analysis
Electrolyte vaporization and thermal expansion may occur depending on the rise in the battery’s internal temperature during TR. In this study, the composition of the battery TR gas is analyzed in relation to the thermal shock temperature of . A high concentration gas analyzer (MCA 100 SYN-P, ETG Risorse, Chivasso, Italy) was used in real time to measure the battery TR gas during thermal runaway of the battery. This analysis method performed real-time analysis of high concentration hydrocarbons (HC), CO2, CO, O2, and H2 gases, and it was possible to make measurements in percentages. Since there were no significant results for the concentrations of O2 and H2, only HC, CO2, and CO gases were analyzed and discussed in the results and discussion section.
3. Results and Discussions
3.1. TR Characteristics of Lithium-Ion Batteries under Thermal Abuse Conditions
A TR experiment was conducted using a ceramic plate heater under a wide range of temperatures of
from 250 °C to 500 °C, to derive a correlation between
and TR times (
,
,
, and
).
Figure 2 and
Table 1 present the TR characteristics of lithium-ion batteries with variations in the plate temperature. The time
was required to attain the experimental temperature starting from room temperature. For example,
of 250 °C is 37 s. The amount of heat transfer transmitted to the battery was not considered during the corresponding time. The time difference,
, from the target temperature (
) to the electrolyte vent (
) refers to the time taken to vaporize the electrolyte and emit combustible gas, which results from the increase in internal pressure owing to the heat transferred to the battery after the temperature of the heat source is increased. This parameter refers to the time taken for vent gas substances to be discharged into the external environment from the electricity storage system or the battery mounted on the electric vehicle. As
increased from 250 °C to 500 °C,
decreased rapidly from a maximum value of 780 s to 1 s. The experimental results reveal that when the lithium-ion battery is exposed to a high temperature, the chances of attaining a specific temperature or emitting harmful gases such as electrolytes in a short time are high.
The time difference refers to the time when the battery reaches self-heating after the gaseous electrolyte has been emitted. Notably, the self-heating of the battery is closely related to the TR phenomenon, and is considered an important factor. Similarly, as the temperature is increased, the time difference rapidly decreases, which implies that the battery may reach the self-heating time in a short period. In addition, when was greater than 500 °C, a self-heating phenomenon was observed before the vaporized electrolyte was sufficiently discharged. Presumably, a high level of energy can be emitted in a short time if it reacts with a large amount of electrolyte gas remaining thereafter.
The term represents the time taken by the battery to attain TR after self-heating. As a result of the experiment, a short time of approximately 10 s was required to initiate TR, regardless of the temperature condition. As the temperature quickly rises from the starting point of self-heating of the battery and is linked to TR, measures for the time point before self-heating are required to control the TR of the battery. Our experimental results reveal that the overall state change of the battery over time, , is related to and is significantly affected by temperature conditions; thus, the time required for the state change of the battery rapidly decreases as the temperature increases. Therefore, a large number of adjacent cells will likely lead to a chain TR accident. Considering this key aspect, fire-related accidents can be prevented by implementing a cooling system for the battery or by inserting an anti-inflammatory agent between the batteries.
The measured temperature data values located at the top of the battery are illustrated in
Figure 3. During TR, the maximum temperature at the top of the battery is different for each battery and temperature condition. However, the temperature range in which the TR phenomenon occurs frequently occurred under the top-side temperatures (
) of 160–170 °C, located farthest from the heat source, regardless of the time and the
conditions of the heat source. Particularly, as the
approaches approximately 160–170 °C, the temperature rises rapidly owing to the heat generated by the battery and the TR phenomenon progresses. Generally, lithium-ion batteries use separators manufactured using a polymer made of polyethylene (PE) or polypropylene (PP), and this choice of materials leads to TR; the damage is initiated at a temperature of approximately 130 °C [
21]. In addition, the actual internal temperature of the battery is expected to be higher; nevertheless, these data, verified through experiments, are useful for predicting the possibility of runaway TR through external temperature measurements. As the TR temperature range of the battery may change in accordance with the appearance and shape of the battery, the type of cathode material, and the SOC, additional verification is necessary.
The specific steps during a battery TR process in the nitrogen atmosphere for
of 250 °C are depicted in
Figure 4.
Figure 4a presents the first vent phenomenon, which is a precursor of battery TR. The high temperature of
= 250 °C causes heat conduction to the battery, resulting in release of the internal electrolyte. Thereafter, the battery self-heating temperature rises rapidly (refer to
Figure 4b), and the battery TR is terminated (refer to
Figure 4e) following spark generation (refer to
Figure 4c) and the attainment of the maximum temperature range (refer to
Figure 4d). The increased internal temperature and pressure in the battery cell facilitate strong explosive forces during the battery TR process. When the battery cell encounters TR, the explosive strength—causing the strong release of spark particles (PM release during TR) and structural fault of the aluminum casing—is expected to be directly affected by the internal accumulation and increased internal pressure (refer to
Figure 4c–e).
3.2. Correlation between Battery TR Time and Temperature Reaction Kinetics
The experimental results of the time difference of the battery TR and plate target temperature can be expressed using the correlation Equation (4). Under the thermal abuse temperature (
),
indicates the time difference from the time (
), at which the target plate temperature is attained, to the time
of the electrolyte vent;
implies that the temperature rapidly rises from the time (
) when the gaseous electrolyte begins to vent, and the heating rate exceeds 1 °C/s. The correlation between
and
with respect to
is plotted in
Figure 5; the experimental results related to
are expressed using Equation (4).
Figure 5 presents the linear relationship between
and
. For the two aforementioned reactions that were considered, the first reaction refers to the vent
of the gaseous electrolyte and the overall reaction
that rises rapidly from the beginning. Particularly, the linearity of
and
demonstrate a high level of correlation (
is approximately 0.97). In addition, the linearity of
and
exhibits a high correlation of
= 0.96. Based on the linear relationship between the results
of the two reactions for
, the activation energy of the two reactions,
and
, are estimated to be 36.6 and 39.9 kJ/mol, respectively.
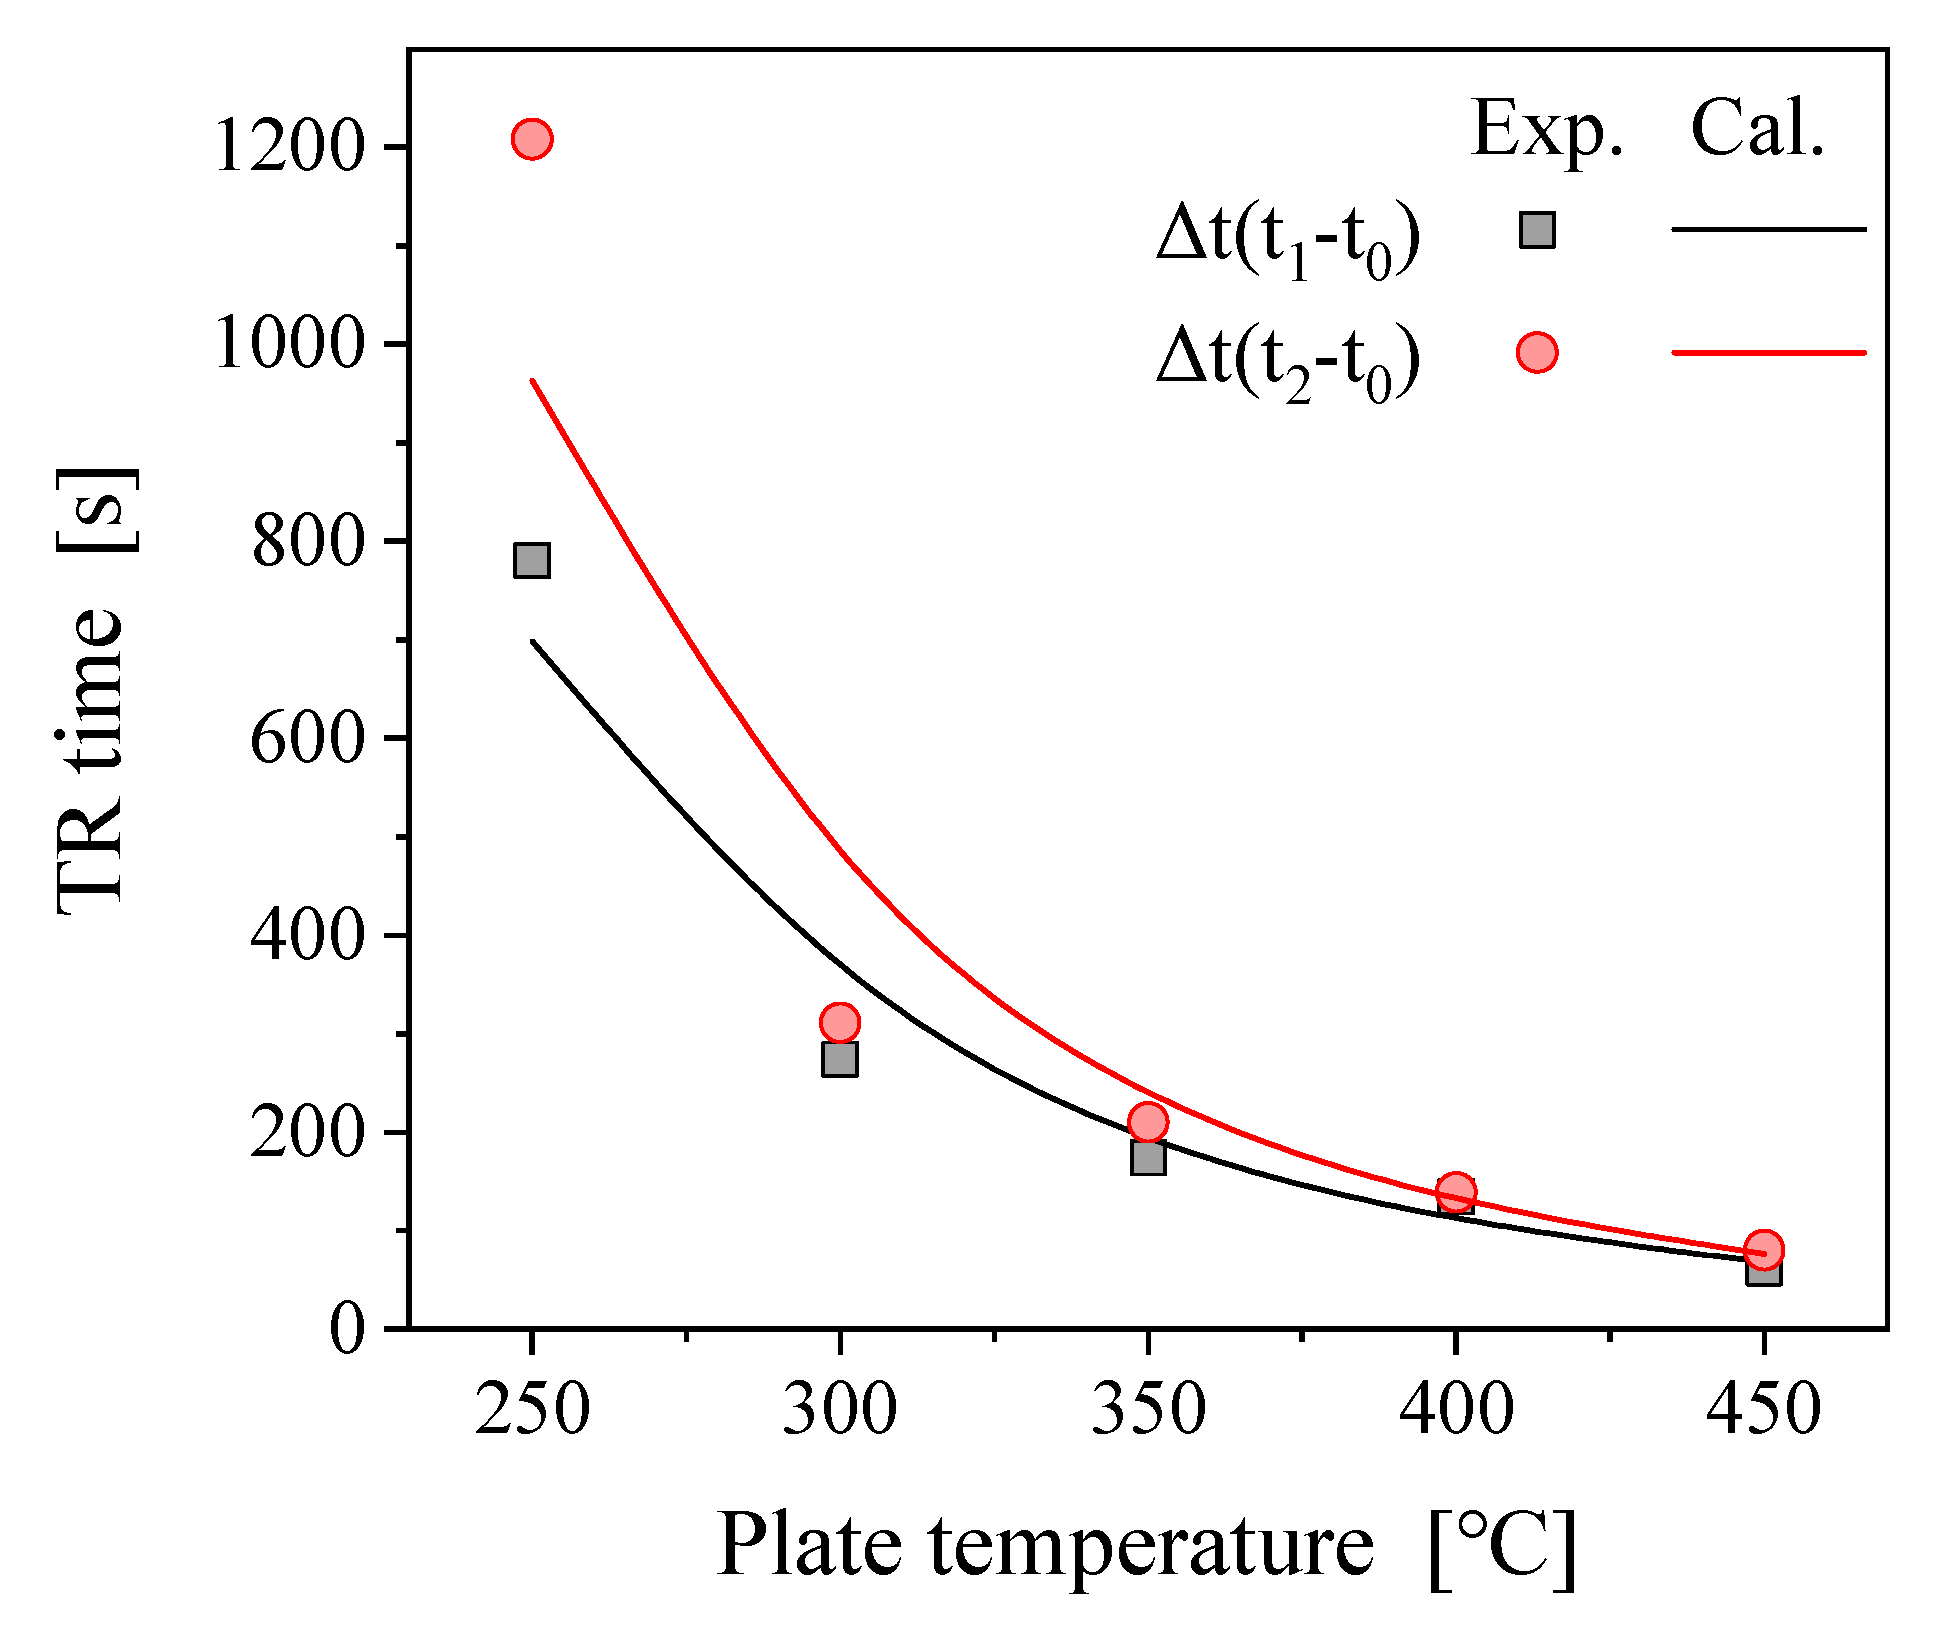
Figure 6 illustrates the comparison between the expected value and the experimental result using the derived expression for the reaction rate (refer to Equation (4)). The prediction result of the occurrence time (
) from the emergence of temperature (
) to the first vent was relatively convincing compared with the experimental result. Moreover, the prediction result of the time range (
), in which the temperature rose rapidly from the time of reaching the temperature, showed a tendency to deviate from the prediction result at a low temperature of
= 250 °C; nevertheless, it was a predictable range for the entire experiment. For the same lithium-ion battery, different results of the TR test were obtained, and, in a low-temperature environment, the TR-triggering temperature or the rate of thermal abuse to the lithium-ion battery was relatively slow. Thus, it is expected to deviate from the low temperature condition. Based on the results of the reaction kinetics of this battery TR, the minimum evacuation time of 5 min was evaluated, which is mandated by the safety regulations for electric vehicle batteries (GB 38031-2020). Using the kinetic model presented in this paper, under thermal abuse of the battery, it can be expected that
= 5 min is satisfied at a contact temperature of 308.4 °C, and
= 5 min is satisfied at
= 326.2 °C.
3.3. TR Gas Composition in Lithium-Ion Batteries
The analyzed results of the battery TR gas composition in relation to the thermal shock temperature of
are presented in this section. A typical TR precursor of a lithium-ion battery is a phenomenon in which not only self-heating occurs, but also an electrolyte in an internal liquid phase is vaporized and ejected from the battery. The analysis results of the real-time concentration measurements of HC, namely CO
2 and CO, over time inside a sealed reactor are illustrated in
Figure 7. The electrolyte comprising vaporized HC is ejected outside the battery before the emergence of TR in the temperature range 250–300 °C. Subsequently, CO
2 and CO are simultaneously detected during self-heating and TR. This process results in the rapid release of thermal energy and decomposition of the HC-based electrolyte, and the maximum CO
2 and CO concentrations were measured to be 2.47% and 4.78%, respectively. Reportedly, the higher the energy density, the lower the ratio of CO
2 to CO will be [
22,
23]. In this experiment, as the same battery and SOC were utilized, the concentration ratio of the combustion gases CO
2 and CO was approximately 0.5 regardless of the temperature condition. Considering the gas composition for the TR experiment from 350 to 500 °C, a rapid increase in temperature was observed when the HC was detected. As a considerable amount of thermal energy was instantly released, the lower temperature of the battery gradually increased from 250 °C to 500 °C, and the maximum temperature attained was found to be 747 °C. As indicated by the results of this experiment, when the lithium-ion battery is exposed to a high temperature, leading to TR, a larger amount of heat energy than that supplied is instantaneously emitted, and the high-temperature atmosphere acts as an igniter, causing a continuous combustion–explosion reaction between the battery vented gas and the ambient air.
3.4. Residue of Lithium-Ion Battery Components after TR
Through the analysis of high-temperature particulate debris generated during the TR process of lithium-ion battery materials and batteries, the changes before and after the electrochemical mechanism and the TR phenomenon were analyzed in
Table 2 and
Table 3. Additionally, the components of the cathode material, the anode material, and two types of TR residues of the lithium-ion battery were investigated. Residue sample #1 is a residue generated by TR occurring at a temperature of 250 °C, and residue sample #2 is a residue generated by the release of explosive energy resulting from ignition of the electrolyte that is vaporized at a relatively high battery temperature of 550 °C. Based on this element analysis, the oxygen content was estimated to be approximately 22.88%, and most of it was in the form of cobalt oxide (Co
3O
4). Conversely, carbon is a component of the anode material, and changes in the cathode and anode materials contributing to the TR reaction can be indirectly confirmed using the metal analysis and element composition of the TR residue.
In the composition of residue #1, the ratio of Ni and Co is half that of the cathode material, and the remaining carbon content is also half that of the anode material. On the basis of the analysis results, the residue is presumably a mixture of cathode and anode materials. In addition, the aluminum and copper contents were approximately 2%, which was remarkably higher than the content of the cathode material (metal oxide) that was collected for analysis. As the internal temperature of the battery rises sharply during TR, each aluminum and copper substrate coated with metal oxide and graphite melts and is subsequently ejected from the battery. As stated in the literature, the melting points of pure aluminum, copper, and iron are 660, 1085, and 1538 °C, respectively; thus, the internal temperature of the battery will expectedly attain a temperature of 1100 °C or higher [
24,
25,
26]. In a study, the internal temperature during TR was measured using the K-type electric-heat transfer zone, and the result was approximately 1000 °C [
27]. This result indirectly confirms that aluminum, copper, and iron melt as a large amount of thermal energy is released within a short period of time inside the battery.
In addition to the phenomenon of battery TR, the phenomenon of battery explosion was also observed in this experiment. In particular, a relatively high temperature of 350 °C or higher generally results in a battery explosion. This explosion phenomenon severely damages the aluminum structure of the battery, and the internal cathode material and anode material explode and are ejected from the battery in tandem with the erupting high-temperature PM. As for residue #2, the composition of nickel, cobalt, and aluminum was higher than that of residue #1, and the ratio of copper was analyzed at a level of approximately 20%. Interestingly, the ratio of the components contained in residue #2 was predicted to be larger than that of the cathode material. In addition, considering that the copper content was evidently low, the temperature inside the battery was not sufficiently increased. This is because the battery’s aluminum structure was damaged and heat loss occurred owing to the rapid emission of energy.
4. Conclusions
An experiment was conducted on a cylindrical lithium-ion battery to derive the correlation between the TR phenomenon according to the thermal shock temperature of and time (, ). The higher the temperature conditions, the lower the time required to reach electrolyte ejection, self-heating, and TR will be, thereby increasing the risk of fire-related accidents featuring ejection of combustible gases. The chemical reaction rate of thermal runaway was classified according to temperature into two global mechanisms and applied to the Arrhenius equation, thereby yielding a correlation between and (i.e., or ). As a result, the activation energy for the overall reaction of the TR was estimated to be 39.9 kJ/mol. CO and CO2 were measured at a time when a high concentration of hydrocarbons was ejected, thereby releasing the gas inside the battery, resulting in TR. The mechanism and internal temperature range were predicted through component analysis of the TR residues. The main components of the cathode and anode accounted for half of the ratio, respectively, and both components were detected owing to the increase in contact and pressure between the internal short circuit and the electrode. In addition, considering that the ratio of aluminum, copper, and iron content of the residue increased, the internal temperature may approach approximately 1000 °C or higher.
As a future research direction, considering that the charging rate of the battery is linked to the TR phenomenon, a study shall be conducted to derive a correlation among charging rate, temperature, and TR characteristics. Various factors can be used to detect an abnormal state of a battery in advance, such as change in gas composition, temperature, and deformed appearance; however, the fastest measure for detection is temperature change, and, in this regard, research on the prediction of TR time is required.


