Abstract
The sodium/nickel chloride battery (Na/NiCl2) is considered an eco-friendly, long-term stable and safe alternative to other secondary battery technologies. The overall system efficiency of this high-temperature battery can be increased by optimizing the thermal management system. This paper addresses the integration of a phase change material (PCM) into the battery modules and evaluates the thermal performance and environmental impact of such a design. The module layout with PCM and heat transfer elements (HTEs) was selected based on 2D FEM simulation results and verified in a prototype Na/NiCl2 module. It was shown that the module temperatures could be kept within the operating limits during operation by the HTEs and the PCM even at high current rates. Since no critical temperature limits were reached, the usable battery capacity was higher compared to results of a reference module without PCM or HTEs. In addition, the PCM prolonged the cooling down process after discharge. In parallel with the experimental studies, the environmental performance of the battery was evaluated using a life cycle assessment (LCA). Amongst other things, it was found that the application of PCM is also beneficial from an ecological point of view.
1. Introduction
The energy transition from fossil fuel-based power generation towards renewable energy-based power generation requires new infrastructures, energy management tools and most importantly energy storage systems. The storage of electrical energy is an important element in matching the electricity demand and supply for various applications.
In secondary batteries, electrochemical reactions are used to charge and discharge electrical power. Due to the order in the electro potential series, lithium-ion batteries (LiB) yield high voltages and are with their high energy density predestined for high performance secondary batteries [1]. However, resources, long-term stability and operational safety are limited with this type of battery. Therefore, alternative battery technologies are investigated, also at elevated temperatures, to apply environmentally friendly and easily available materials [2,3,4] in order to progress towards a sustainable battery technology.
In this regard, the sodium/nickel chloride (Na/NiCl2) battery with an operation temperature of about 300 °C is a promising alternative for stationary applications that do not require high charge and discharge rates (<1 C). No rare raw materials are necessary for cell production and the battery operation is intrinsically safe with inactive cells in case of failures or damage [5]. Due to the high operating temperature, these batteries are robust against the surrounding temperature conditions (−30 to 50 °C).
The Na/NiCl2 battery technology has been investigated for some decades, and was also referred to as the ZEBRA battery [6]. A promising cell concept was established by FIAMM/FZSoNick S.A., introducing battery modules to the market for different applications in the stationary and the mobile sector [7,8].
As for other high temperature batteries, cell heating is necessary to overcome the heat losses to the environment. The required heating power is reduced during operation since heat is released due to the electrical resistance of the cell and additionally there is a self-heating effect during the discharge reaction [9]. Therefore, regarding the overall battery efficiency, it is important to make efficient use of this internal energy. The innovative approach of the thermal management system is rooted in the use of a high-temperature phase change material (PCM), which serves as a latent thermal storage in the required operating temperature range.
In recent years, passive cooling with PCM has been increasingly investigated as a method for battery thermal management systems (BTMS) to ensure battery safety of lithium-ion batteries in electric vehicles [10,11,12,13]. Advantages include ease of use, no need for additional equipment, and low cost compared to other cooling methods. Various PCMs and different composite structures have been developed and tested, and efforts have been made to reduce the disadvantages of poor thermal conductivity, easy leakage, low strength, and subcooling of the PCM [10,14,15,16].
In the high-temperature range, PCM heat storage systems are typically used in solar thermal power plants or waste heat recovery systems [17,18]. Apart from a patent dealing with the integration of PCM into a high efficiency Na/NiCl2 cell [19], there has been no published work on the use of PCM for the thermal management of high temperature batteries. In contrast to the safety-related motives in the field of Li-ion batteries, the focus for a PCM-based thermal management system in high-temperature batteries is on increasing efficiency. The aim is to extend the module’s cooling down time, homogenizing the operating temperature in steady-state mode, and to store the heat released during discharge in order to use it as a heat source at a later time. In addition, it is important to avoid high module temperatures (>350 °C) to minimize the risk of cell failures.
Therefore, the aim of the research was to develop and test product-related design concepts for Na/NiCl2 battery modules including devices for thermal management under practical operating conditions. The PCM thermal storage was combined with effective heat transfer elements (HTEs) between the battery cells. A Na/NiCl2 battery module prototype was built and tested to demonstrate the effectiveness of the thermal management system.
Stationary batteries are necessary for defossilization of energy systems. Life cycle assessment (LCA) is an essential tool to drive the development of stationary battery systems with reduced environmental impacts [20]. There are only limited LCA studies published evaluating the Na/NiCl2 battery technology. Compared to existing studies [21,22,23] to determine the environmental impacts of these technologies, this study focuses in particular on increasing efficiency through the use of suitable thermal management systems. Targeted thermal management has already demonstrated for comparable battery technologies that energy and environmental impacts can be significantly reduced. To evaluate the environmental performance of the Na/NiCl2 battery module, an LCA was conducted. It identifies the hotspots of environmental impacts in the battery life cycle and shows the environmental advantages for implementing PCM as heat storage.
2. Results
2.1. Module Prototype Design
Based on thermal characterization tests of Na/NiCl2 cells and by means of 2D FEM simulations the module design including the thermal management system was developed. The final design of the battery module prototype consists of a 6 × 6 grid layout with 32 Na/NiCl2 cells and four heating elements in each corner providing the necessary power to keep the operating temperature, see Figure 1. Four chambers filled with the PCM NaNO3 are positioned adjacent to the cell pack enabling direct heat conduction between the cell pack and the PCM whereas each PCM chamber contains 1.1 kg of NaNO3. To improve the overall heat conduction capability of the cell pack, heat transfer elements in form of 3 mm thick aluminum sheets are provided between the cells. To ensure electrical insulation between the cells they are covered by a thin layer of glimmer material. The battery pack is enclosed by a thermal insulation material of 55 mm thickness and an aluminum housing.
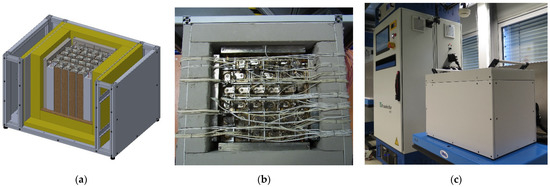
Figure 1.
Final design of the Na/NiCl2 module prototype with a PCM based thermal management system: (a) 3D design, (b) assembled module prototype, (c) module prototype on the test rig.
2.2. Experimental Results
The prototype module and a reference module without PCM or HTEs (see Section 4.4) were subjected to different testing procedures to evaluate the performance of the proposed thermal management system.
Figure 2 shows the heat-up process for both modules. The heater temperatures (dotted lines) served as control temperatures, the setpoint was ramped up to 300 °C at 1 K/min. Since the entire process took place below the phase change temperature of about 308 °C, only the HTEs affect the results shown. The good thermal conductivity within the prototype module results into a very narrow temperature range between minimum and maximum cell temperature (shaded area). In the reference module, the heat input from the heating elements into the cell block is slow, as evidenced by the reference module reaching the temperature set point quickly but having a slower heating rate overall. In addition, this results in about 20 K lower steady-state temperatures in the reference module despite the same setpoint temperature. Therefore, in further tests, the setpoint of the reference module was adjusted so that the center temperature of the cell block was identical in both modules. In this steady-state case, the heat loss of both modules was about 60 W with less than 4% difference. The total temperature range of the cell block was only about 3 K for the prototype module and about 11 K for the reference module.
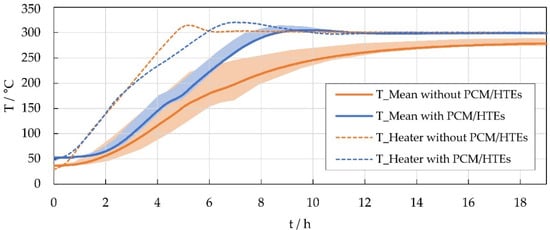
Figure 2.
Average cell temperatures (solid line), min/max cell temperature range (shaded area) and heater temperatures (dotted line) during the heat-up process of the prototype (blue) and the reference module (orange).
Figure 3 shows the temperature results of discharge tests with different C rates. The discharge was limited by the minimum cell voltage and the maximum cell temperature, respectively. After completion of the discharge, the modules cooled down passively. With the start of the discharge process, the heating was switched off and only switched on again after all cell temperatures cooled down below 300 °C. As can be seen in Figure 3, the prototype module with PCM heats up more slowly and reaches significantly lower maximum temperatures at the end of the discharge. After the discharge, it cools more rapidly to the level of the phase change temperature (about 308 °C), where the temperature remains constant for a while before cooling further. Apparently, at moderate C rates between 20 A and 30 A (0.5 C … 0.75 C), the prototype module stays hot longer (about 2 h) than the reference module. Furthermore, at the end of discharge, a wider min/max cell temperature range can be observed in the prototype module with increasing C rates.
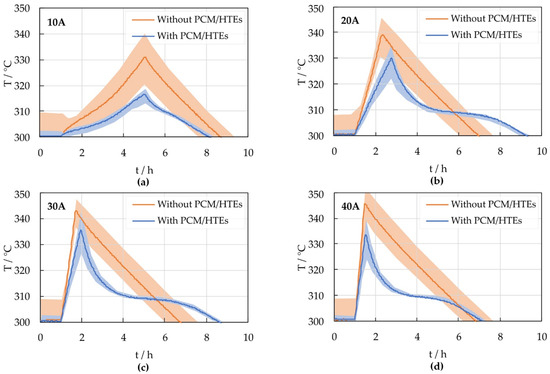
Figure 3.
Average cell temperatures (solid line) and min/max cell temperature range (shaded area) for discharge tests with different C rates: (a) 10 A, (b) 20 A, (c) 30 A and (d) 40 A.
Figure 4 shows the maximum cell temperatures at end of discharge and the corresponding amount of discharged Ah. While the reference module without HTEs and PCM already reaches the temperature limit at a discharge current of 15 A, the maximum cell temperature in the prototype module remains below the limit at all discharge rates, see Figure 4a. Therefore, the discharge process of the prototype module is limited only by the electrochemistry and the effective usable capacity of the module is higher than that of the reference module, see Figure 4b.
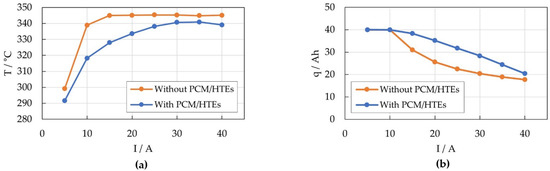
Figure 4.
(a) Maximum cell temperature at end of discharge and (b) discharged Ah for the prototype (blue) and the reference module (orange).
The center temperatures of one of the PCM chambers of the prototype module are shown in Figure 5a at different discharge rates. The phase change temperature of 308 °C is clearly noticeable as a temperature plateau. For discharge currents above 20 A, the PCM center temperature rises a little above the phase change temperature, i.e., the PCM is completely melted and therefore continues to heat up. The fact that this is not just a local effect at the position of the temperature sensor is evidenced by the comparison of the temperatures at the outside surface of the PCM chambers with the PCM center temperatures. They show the same overheating at the same time.
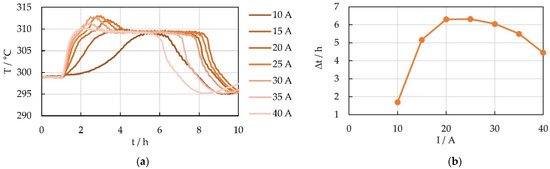
Figure 5.
(a) Center temperature of one of the PCM chambers at different discharge rates and (b) duration of the temperature plateau at the phase change temperature for center temperature of PCM chamber 01.
The duration of the phase change plateau is shown in Figure 5b. It increases with increasing C rates but starts to decrease again for currents above 25 A. Possible reasons for this behavior are discussed in Section 3.
Comparing the results of the prototype module with the FEM simulations and the findings of the tests with a thermal demonstrator (described in detail in Section 4.4), there is a very good agreement, see Figure 6. While the simulation data and the demonstrator data are based on the input heat profile shown (see Section 4.2), the plotted prototype module result originated from the discharge test with 25 A.
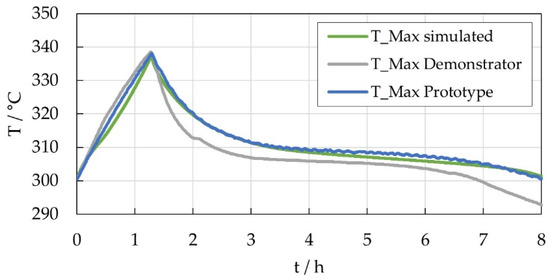
Figure 6.
Comparison of maximum cell temperature determined based on FEM simulation (green), thermal demonstrator tests (grey) and tests with the prototype module (blue).
2.3. LCA
The environmental evaluation performed considers the whole life cycle of the Na/NiCl2 battery. For the basic scenario, a battery without the PCM and a lifetime of 15 years is assumed to be operating within a PV home storage system. The calculated overall global warming potential in the best case (see Section 4.5) is 21.7 kg CO2-eq. per kWh per year. In order to identify the hotspots, a contribution analysis was performed. The results in form of relative contributions for nine different impact categories from the impact assessment method ILCD 2.0 2018 midpoint no LT [24] are shown in Figure 7a. In most categories such as climate change, freshwater eutrophication, and fossil resources the highest impact occurs on the use phase due to the energy consumption keeping the operation temperature high. Additionally, the production phase, especially the production of the cell, is the main contributor. The end-of-life phase has a rather small impact.
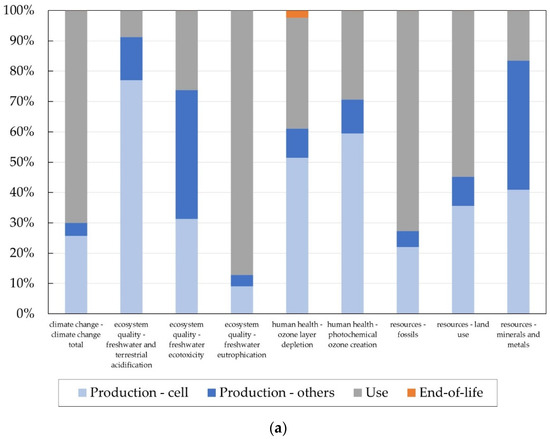
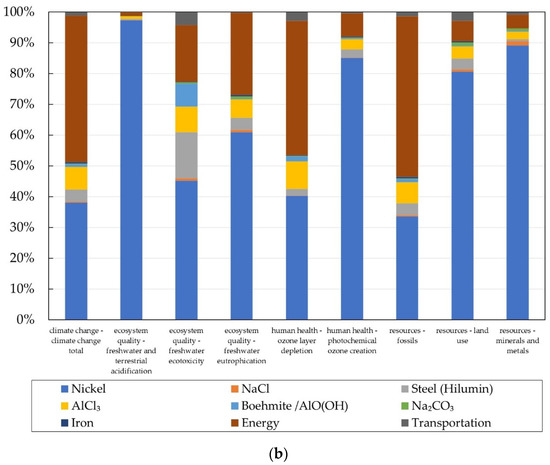
Figure 7.
Contribution analysis of (a) the Na/NiCl2 battery life cycle (Production-cell: material and energy consumption for cell manufacturing; Production—others: material and energy consumption for manufacturing of other components, such as case, insulation, etc.; Use: energy consumption keeping operating temperature; End-of-life: collection and dismantling) and (b) the cell production.
Since the cell production is one main contributor, a detailed look was taken on the production chain of one single Na/NiCl2 cell. In Figure 7b the relative contribution of the different cell components can be seen. The hotspots and therefore levers to improve the environmental performance are the energy needed for the production as well as the nickel used for the cathode.
As it could be seen in the contribution analysis of the whole life cycle, the use phase has a significant environmental impact. The integration of the PCM causes an extra impact in the production phase but reduces the energy demand in the use phase. Consequently, the effect of the PCM on the environmental performance was determined. The global warming potential (climate change) for both scenarios without and with the PCM heat storage are calculated for a lifetime between two and 20 years. Figure 8 shows a break-even-point close to six years, from this point onwards the environmental savings in the use phase are bigger than the burden on the production stage. After 20 years, the PCM results in a reduction of 13% of greenhouse gas emissions.
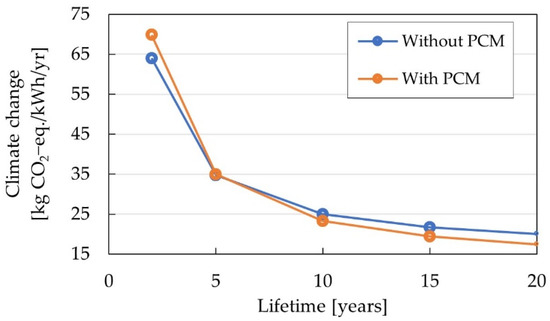
Figure 8.
Global warming potential for the scenarios of a Na/NiCl2 battery without and with integrated PCM heat storage.
3. Discussion
3.1. Module Tests
The comparison of discharge tests with a prototype module versus measurements on a reference module that did not contain PCM/HTEs confirms the expected effects of PCM and HTEs on the thermal performance. First, the HTEs result in an excellent homogeneity of temperature within the module during steady-state operation. Second, HTEs and PCM reduce the maximum cell temperature during discharge. This leads to an optimal utilization of the battery capacity. Third, the PCM prolongs the cool-down time of the prototype module by up to 2 h at moderate discharge currents of 15 A to 35 A. For smaller C rates, the heat released during discharge is insufficient to properly melt the PCM, while for higher currents, the heat is released too quickly, so that the thermal conduction becomes the limiting factor, and the heat cannot be stored fast enough. This shows that the current design could be optimized with respect to applications with high C rates.
However, the present investigation was carried out only with artificial discharge cycles with the heating switched off. In a next step, real load profiles for the battery operation including active heating control should be investigated, as envisaged in the overall objective of the project. Only based on such tests would a final evaluation of the developed thermal management system design be possible, especially regarding the heating demand. Questions of efficiency and operating costs could then also be answered. Nevertheless, the observed prolonging of the cool down process already supports the assumption that the developed thermal management system can reduce the heating energy demand.
From a scientific point of view, it would also be interesting to study the effects of HTEs and PCM separately. For this purpose, HTEs could be integrated into the reference module to observe exclusively the influence of the PCM on the thermal behavior.
Moreover, the results obtained so far confirm the effectiveness of the applied methodology for the development of thermal management systems for Na/NiCl2 batteries. As Figure 6 shows, the prediction of the thermal behavior of the prototype module by simulation and preliminary tests with a dummy system was very satisfactory. The small deviation of the demonstrator results might originate from differences in the thermal properties of the dummy cells compared to real cells. Based on the tools developed in the project, a forecast can be made for competitive, cost- and energy-efficient operation in real applications such as stationary energy storage systems.
A direct literature comparison with lithium-ion BTMS, e.g., [11], or with the thermal design of Na/NiCl2 batteries in the work of Bhamidipati et al. [25], where convective air cooling is used, is difficult because cell and module size, temperature range, and cooling method, respectively, are different. Therefore, the present work with its novel approach is a beneficial extension of previous research and development of effective thermal management systems for high-temperature batteries.
3.2. LCA
The life cycle analysis was conducted to evaluate the environmental performance of the Na/NiCl2 battery. As hotspots, the cell manufacturing especially its energy and nickel usage and the energy consumption during the use phase were pointed out. The production efficiency might increase with rising production scale. Instead of primary nickel it is recommended to either use secondary nickel or alternative materials as substitution. The PCM accounts for 16% of the overall production related greenhouse gas emissions. Due to the resulting energy savings in the use phase the application of PCM is advantageous from an ecological perspective after a lifetime of at least 6 years for the considered scenario.
Life cycle assessments are always based on assumptions and include limitations which need to be considered. Sensitive parameters in the studied model are the assumed lifetime and the estimated energy consumption during the use phase. Following the experimental results regarding the heat loss of the prototype and the reference module, a simplification was made for the PCM scenario, assuming an equal heat loss for both modules considered in the LCA.
Comparing the LCA results to values from literature by Longo et al. [22], the calculated global warming potential with 21.7 kg CO2-eq/kWh/year is higher than the one stated by Longo et al., with 13.8 CO2-eq/kWh/year. The main differences are the greenhouse gas emissions due to energy consumption in the use phase; Longo et al. assumed 80% less energy demand during usage. Both studies agree on nickel being the main contributing material in the production stage.
In addition to the studies by Longo et al., there is another work by Rossi et al. [26] that calculates and compares the environmental impact of different battery technologies, including Na/NiCl2 technology. In their study, a global warming potential of 168 kg CO2 eq./MWh (stored energy during lifetime) was calculated, but due to a different system boundary and functional unit, this result is difficult to compare. Moreover, the energy demand of the Na/NiCl2 battery during its use phase was not studied, which shows the relevance of the work presented here.
4. Materials and Methods
The different steps of the concept development methodology in the present work are illustrated in Figure 9. In addition to literature research, experimental validation as well as an environmental analysis were performed. Starting with a detailed thermal specification of the Na/NiCl2 cell and module performance, thermal module simulations followed in order to develop the specific design of the PCM based thermal management system. Subsequently, various tests were performed on real test items in the laboratory to investigate the operation of the developed design. A use phase simulation, based on results of the thermal specification tests, provided input for the life cycle assessment, which was used to evaluate the environmental impact of the developed thermal management system.
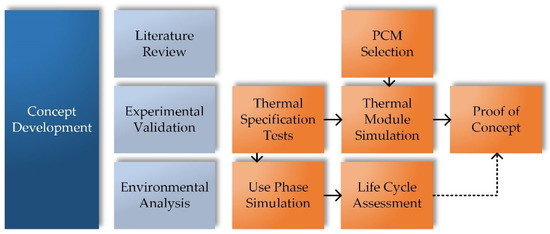
Figure 9.
Scheme of the methodology of the present work for the development of a PCM based thermal management system.
4.1. PCM Selection
Part of the literature review was to research suitable PCM materials for use in a thermal management system for a Na/NiCl2 battery module. Various aspects had to be considered, such as melting point, handling, thermal stability, steel compatibility and economic aspects [27,28]. The phase change temperatures of nitrates are in the range of the operating temperature of the Na/NiCl2 cells from 250 °C to 350 °C. NaNO3 with a melting point of about 300 °C and its thermal stability up to 350 °C and only low nitrite formation up to 450 °C [28,29] proved to be a very suitable PCM for the described application. In addition, the low price of sodium salts [27] was another convincing factor in choosing NaNO3.
4.2. Thermal Specification Tests
Developing a thermal management system for a Na/NiCl2 battery module is based on the understanding and determination of the characteristic thermal effects within such a module. As described in [30], the electrochemical process within the cell is accompanied by heat effects, distinguishing between dissipative and reversible effects. The former causes heat evolution due to the electrical resistance of the cell, also known as Joule heat or irreversible heat and is dissipated both during charge and discharge. In contrast, the reversible heat depends on the current direction. During discharge, the cell releases heat, while during the charge process, assuming ideal conditions, the heat is reabsorbed. The superposition of both the irreversible and the reversible heat, as shown in Figure 10, ultimately results in heat emission during the discharge of a Na/NiCl2 cell, while the charge process almost shows no thermal effect. Therefore, the charging process will not be considered hereafter.
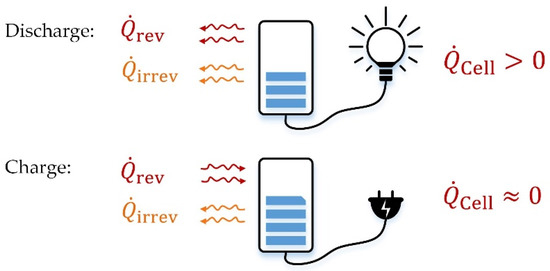
Figure 10.
Schematic illustration of thermal effects of a Na/NiCl2 cell.
In order to quantify the heat flow depending on the current rate, different experimental characterization tests were conducted. The test item was a battery module with five commercial Na/NiCl2 cells from FZSonick, 6855 Stabio, Switzerland. Together with an electrical panel heating, the cells were surrounded by thermal insulation material and a metal housing.
The thermodynamic system boundary for the intended heat flow characterization is the outer module surface. According to the first law of thermodynamics the sum of all heat flows over the system boundaries and all heat sources/sinks within the system results in a change of the inner energy , which correlates with a change of the system temperature. Neglecting the thermal mass of the insulation material and assuming the cells being a lumped-capacitance object with heat capacity and temperature , Equation (1) can be applied.
The heat capacity of a single cell is a function of the depth of discharge (DOD) and the cell temperature , taken from the literature [30]. Avoiding the influence of the transient characteristic of the panel heating controller reacting on the occurring temperature changes during charge/discharge, all measurements are conducted with a constant heating power correlated with a certain setpoint temperature. The heat loss of the module depends on the temperature difference to the surrounding, see Equation (2). Hence, its variation according to the temperature changes during charge/discharge is also considered. The module heat loss parameter kA is derived from measuring the required heating power for different setpoint temperatures in steady-state mode and calculated as = 0.2647 W/K.
Combining Equations (1) and (2) the heat power released by N cells during discharge can be estimated based on the measured temperature gradient . Figure 11a shows the measured temperatures observed during the discharge test series. The observed temperature gradients lead to the heat power released by one cell shown in Figure 11b. Due to the rise of the cell heat capacity from about 470 J/K up to 570 J/K during the discharge and the simultaneously considered increasing heat loss because of the rising module temperature, the estimated thermal output of the cell increases during the discharge process.
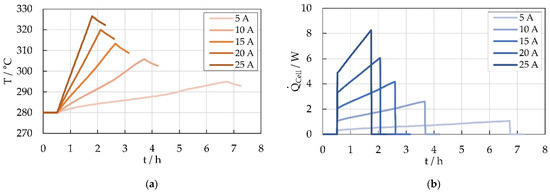
Figure 11.
(a) Cell temperature within the 5-cell battery module measured during discharge with different current rates, (b) Estimated heat output of a Na/NiCl2 cell during discharge, based on cell temperature measurements at different discharge current rates.
In addition to the described approach of estimating the heat output of a cell based on the measured temperature gradient during discharge, the thermal energy released during a full charge/discharge cycle can be derived from the round trip efficiency (RTE) of the cell. Considering a full cycle, the energy needed for fully charging the cell is higher than the energy that can be taken from the cell during discharge. The difference can be considered as the thermal loss of the cell related to the charge/discharge process. The RTE was determined for the discharge test series according to the definition given in [31]; results are shown in Figure 12.
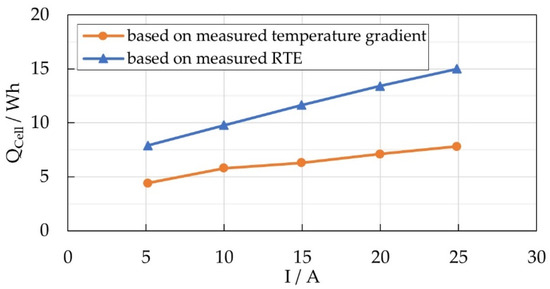
Figure 12.
Estimated thermal energy released by a Na/NiCl2 cell during discharge.
Compared with the amount of thermal energy calculated from the results given in Figure 11b, the approach based on the RTE leads to much higher values. The differences might arise out of the limitations of the experimental approach, such as the inhomogeneous temperature distribution within the module, or the influence of the heat capacitance of the insulation material. Nevertheless, the results found here could be verified by conducting the same investigations using a second test module consisting of 60 Na/NiCl2 cells.
Finally, the heat output profile shown in Figure 13 was used for the subsequent simulative dimensioning and design of the PCM based thermal management of a Na/NiCl2 battery module. This choice represents a more conservative assumption regarding the amount of PCM required in the module design, as it ensures that there is enough PCM to store the released heat.
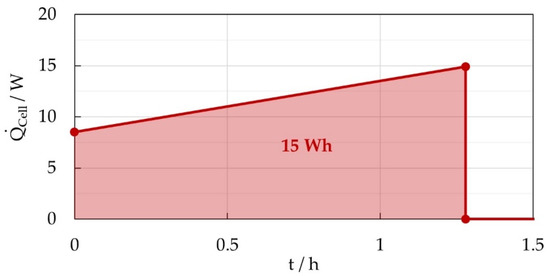
Figure 13.
Assumed heat output profile of a Na/NiCl2 cell during discharge for subsequent development of a PCM based thermal management system.
4.3. Thermal Module Simulation
Numerical simulations using the software COMSOL Multiphysics® [32] were carried out during the design process of the battery module. The main goal of the numerical simulations was the determination of an optimal and feasible internal layout of the battery module regarding thermal performance and including all the main components, e.g., battery cells, heating elements, PCM chambers, HTEs and insulation. Due to the self-heating of the battery cells, the discharge process was chosen for the numerical simulations. By focusing on the thermal design, the battery cells were modelled as heat sources with each cell following the heat profile presented in Figure 13; hence, no electrochemical behavior was modelled.
As shown in Figure 14 the modelling and design process started with a 2D approach. By varying locations and dimensions of the involved components in a 2D model an optimal layout was derived and transferred into a full 3D CAD module design. The 2D simulation model represents a fully parameterized cut-plane through the middle of a battery module whereas the 3D simulation model relates to a quarter of the final module design utilizing symmetry options.
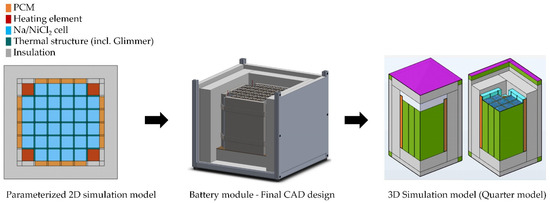
Figure 14.
Numerical modelling and design process.
Table 1 summarizes the material data for the main components of the battery module used in the numerical simulations. The material data for the Na/NiCl2 cells was based on [33]. In the simulation, the phase change process of NaNO3 was implemented using the phase change interface of COMSOL’s heat transfer module. In this case the melting and solidification of the PCM was purely treated as a thermal exchange process with varying material properties depending on the phase state. The heat storage and release were handled by the phase change temperature and the latent heat of the PCM.

Table 1.
Component and material data for numerical simulations.
Figure 15 shows the comparison of the simulated maximum cell temperature during the discharge process (represented by using the heat profile of Figure 13) for the PCM and non-PCM variants for the final module layout. For the PCM variant the temperature is rising almost in a linear manner until a maximum of 344 °C at the end of the discharge process at 1.28 h due to the heat output of the cells. During this period the PCM melting temperature is exceeded, hence the PCM is melting, and storing of the released heat occurs. In the cooling-off phase the maximum temperature decreases initially very fast until approximately 310 °C. Afterwards the decrease in temperature is slowed down due to the released heat of the PCM which now begins to solidify again. Due to the PCM effect the entire cooling-off time is about 7 h until the cells reach a temperature of 300 °C again. In contrast, the temperature of the non-PCM variant increases up to 385 °C and thus exceeds the maximum operating temperature of the cells of 350 °C. After this, a linear decrease can be observed for 6.5 h. In real operation, the non-PCM variant would therefore be limited to a lower discharge rate or shorter discharge duration in order to maintain the temperature limits. In this case, the cooling-off back to 300 °C of the non-PCM variant can be expected to be much faster compared to the presented graph. The simulation results demonstrate both capabilities of the PCM design to decrease the maximum temperatures in the battery module and as well as the delayed cooling-off process due to the phase change which leads to an improved overall energy efficiency.
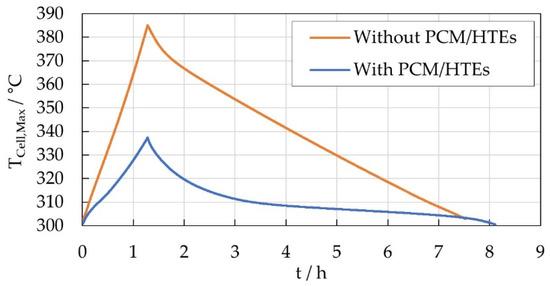
Figure 15.
Maximum cell temperature during the simulated discharge and cooling-off process for the battery module without and with PCM.
In Figure 16a an example of the temperature field of the module at the end of the discharge process is illustrated and shows a very homogenous distribution across the cells with a rapid temperature decrease within the insulation layer due to the outer convection. Additionally, the liquid fraction of the PCM is shown in the 3D model, see Figure 16b, and illustrates that the PCM is almost completely molten. There is a small fraction of a mixed solid-fluid phase around the centers of the outer surfaces for each PCM chamber.
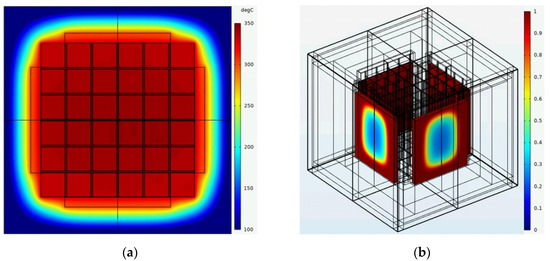
Figure 16.
(a) Temperature field across middle plane and (b) liquid fraction of PCM at the end of the discharge process.
4.4. Proof of Concept
To demonstrate the functionality of the proposed PCM-based thermal management system, a thermal demonstrator, a module prototype and a reference module (without HTEs/PCM) were built and tested after the simulation design process. Details and interim results are presented below.
In contrast to the final battery module the thermal demonstrator uses cell dummies, which only represent the thermal characteristics of the cells. Hence no electro-chemical reactions occur, and the heat output of the cells is controlled by heating elements which are part of the cell dummies. This approach allows a faster and more flexible testing procedure. The constructed thermal demonstrator is shown in Figure 17. Overall, 25 thermocouples are integrated and distributed across the middle plane of the module in the various components, e.g., heating elements, PCM chambers, between the cells in thermal structures and the housing.
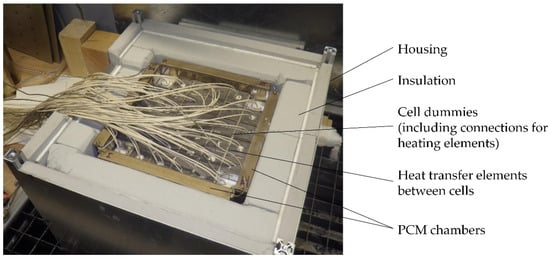
Figure 17.
Thermal demonstrator using cell dummies.
In Figure 18, results of the thermal demonstrator testing are presented and divided into the measured temperatures along the horizontal and vertical middles axes. The maximum temperatures are around 339 °C near the center and drop to around 325 °C near the edges of the cell module at the end of the discharge process. The horizontal axis is characterized by the cable feed-through, visible on the left side of the module in Figure 17. The temperatures near the feed-through are lower than their corresponding temperature positions along the vertical axis. The measured and simulated maximum temperatures are very close. The measured cooling-off times are over 10 h compared to 7 h of the simulation results. This difference can be explained by the existence of non-ideal thermal contacts between the components in the demonstrator which, in this case, help to delay the cooling of the module. In contrast, all contacts in the simulation are modelled as ideal. Additionally, the demonstrator was tested in a climatized laboratory with constant ambient temperature identical to the simulation model, but unsteady airflow around the demonstrator module during the testing cannot be prevented and influences the convection performance. However, the demonstrator results confirm the functionality of the PCM approach and verify the simulation design process.
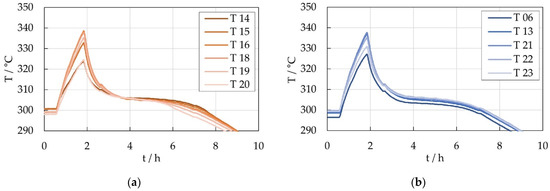
Figure 18.
Measured temperatures along the middle axes (a) horizontal (b) vertical of the thermal demonstrator (for temperature sensor positions see Figure 19).
Subsequent to the thermal demonstrator tests, the thermal management concept was evaluated in the final prototype design of the battery module with real Na/NiCl2 cells. Two module prototypes were assembled. While one of them contained the developed PCM based thermal management system, a second module without HTEs and without PCM served as a reference for the thermal performance. The HTEs were replaced by mica sheets of the same thickness and the space of the PCM chambers was left empty. Various temperature sensors were installed within both modules recording the temperature profiles, see Figure 19. In this study, the minimum, maximum and average temperatures of one quarter of the cell block were analyzed. All measurements were conducted on in-house test rigs using a bidirectional DC power supply.
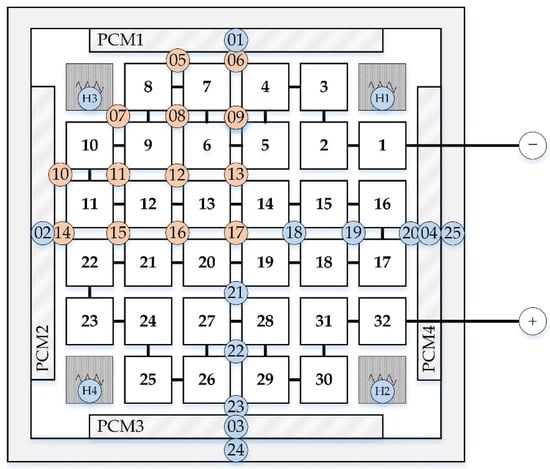
Figure 19.
Positions and numbers of temperature sensors (T) within the module prototypes. In the vertical direction all sensors are placed at the same height in the middle plane of the module. Sensors relevant to the results shown are marked in red.
4.5. Use Phase Simulation
In order to generate input parameters for the use phase of the life cycle analysis of a Na/NiCl2 battery operating in a PV home storage system, annual simulation results of a power flow model in Modelica/Dymola were analyzed. Figure 20 shows the schematic diagram of the model.
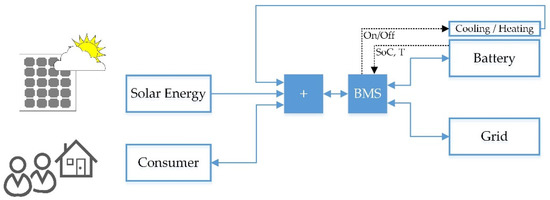
Figure 20.
Simplified illustration of the PV home storage simulation model.
Different scenarios were investigated by varying the PV panel area (3–43 m2), the battery capacity (5/10/15 kWh) as well as the daily average of household energy consumption (5/10/15 kWh/d). A cost analysis based on those results showed that not every system configuration would be economically viable. The most cost-effective scenarios were those of high consumption (15 kWh/d) and larger PV panel areas over 30 m2 [34]. The correlated annual heating energies per kWh battery capacity, which are taken from the grid, were derived from the simulation results for those cases and are shown in Figure 21.
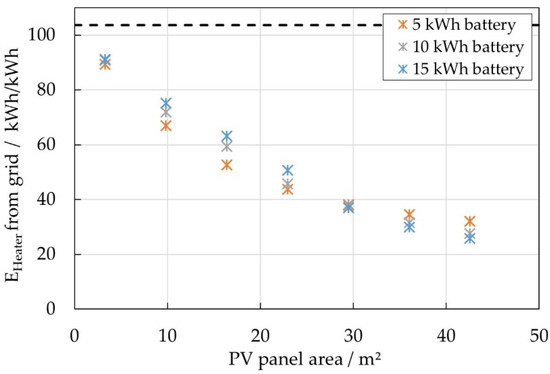
Figure 21.
Annual heating energy per kWh battery capacity taken from the grid for different battery sizes. Dashed line: Maximum heat demand required for continuous heating (worst-case scenario).
In the best case—for systems with large PV panel areas—only 26 kWh of heating energy per kWh of battery capacity would annually be required from the grid. The remaining heat demand of the battery would be covered by PV power. In contrast, in the worst-case scenario the heater would solely consume grid power and run continually. This maximum annual heat demand for a given nominal heating power of about 12 W per kWh of battery capacity would be 104 kWh per kWh of battery capacity.
In order to estimate the effect of PCM on the annual heat demand of the battery, the energy released by self-heating was correlated with the overall heating energy for each scenario. It was found that about 20% of the heating energy taken from the grid could be covered by the self-heating. Assuming that the self-heating energy could be stored/withdrawn ideally in/from the PCM, it is supposed that at best the annual heating energy taken from the grid would reduce to 20 kWh per kWh of battery capacity. The best case / worst case data is summarized in Table 2.
Table 2.
Estimated annual heating energy taken from the grid of a Na/NiCl2 battery operating in a PV home storage system as input parameter for the use phase of the LCA.
4.6. Life Cycle Assessment
To include also the environmental perspective in this study, a cradle-to-grave life cycle assessment was performed. The goal of the assessment was to point out the environmental hotspots of the battery’s life cycle as well as investigate the ecological advantages of implementing PCM heat storage as part of the thermal management in the Na/NiCl2 battery modules. The studied product system was a Na/NiCl2 battery considering the entire life cycle from raw material extraction via manufacturing, use and end-of-life. The cut-off approach was chosen; therefore, no credits were given for potential recyclable content. For modelling the software, openLCA [35] was used in combination with the Ecoinvent 3.7 [36] database and the impact method ILCD 2.0 2018 midpoint no LT [24].
During the inventor analysis a flow chart as presented in Figure 22 was built including all relevant material and energy flow for the three life cycle stages.
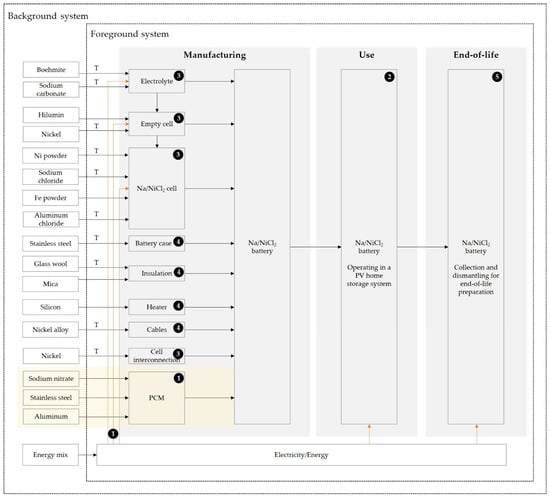
Figure 22.
Qualitative flow chart of the lifecycle of a Na/NiCl2 battery including the manufacturing, use and end-of-life stages; T = Transport activity with data from [22]; Data source according to numbering: ❶ Primary data, ❷ Simulation data, ❸ FZSonick (Safety Data Sheet) [37], ❹ Longo et al. 2013, [22], ❺ Dustmann 2004 [6].
The inventory data for the manufacturing phase was based on primary data, literature data from Longo et al. [22] and specifications from the battery safety data sheet by FZSonick [37]. The energy demand for the manufacturing of the cell was based on in-house manufacturing data. Within the system boundary were the raw material extraction, the material transportation, the production of the battery components as well as the assembly. Manufacturing infrastructure and further transportation steps were not considered. The summarized inventory data is listed in Appendix A, Table A1.
The material composition of one Na/NiCl2 cell is shown in Figure 23a and the energy demand for all manufacturing steps of the cell in Figure 23b. For the scenario with PCM the materials used for the PCM heat storage were added to the manufacturing stage.
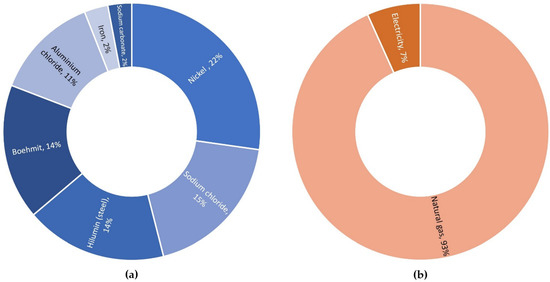
Figure 23.
Inventory data for the production of a Na/NiCl2 cell: (a) material composition (b) energy demand for manufacturing.
For the use phase the application as a home storage system in combination with photovoltaic panels was assumed. The data for the energy demand during usage were taken from the simulation described in Section 4.4. Use Phase Simulation. The annual heating demand was simulated for a battery without/with PCM and for both scenarios the best-case values were chosen for this assessment.
Due to the chosen cut-off approach the end-of-life phase ends with the activity producing the recyclable material and no credits were given. Thus, only collection and dismantling were included, which is also assumed by Dustmann [6].
Author Contributions
Conceptualization, M.R., R.D., A.Z., T.H., F.C., S.Z. and D.H.; methodology, M.R., R.D., A.Z., L.N., M.L., M.F., N.E., T.H., F.C., S.Z. and D.H.; software, R.D., A.Z. and L.N.; validation, M.R., R.D., A.Z., L.N., M.F., T.H., F.C. and S.Z.; formal analysis, M.R., R.D., A.Z. and L.N.; investigation, M.R., R.D., A.Z., L.N. and M.L.; resources, M.L., N.E. and D.H.; data curation, M.R., R.D. and A.Z.; writing—original draft preparation, R.D., M.R., A.Z. and L.N.; writing—review and editing, M.R., R.D., A.Z., L.N., T.H. and S.Z.; visualization, M.R., R.D. and A.Z.; supervision, M.R., T.H., S.Z. and D.H.; project administration, T.H., S.Z. and D.H.; funding acquisition, T.H., S.Z. and D.H. All authors have read and agreed to the published version of the manuscript.
Funding
This research was promoted by the Fraunhofer Project Center for Energy Storage and Systems ZESS and funded by the „Niedersächsische Vorab“. Support code 11-76251-99-2/17 (ZN3402).
Data Availability Statement
Not applicable.
Conflicts of Interest
The authors declare no conflict of interest.
Appendix A
Table A1.
Inventory data for the manufacturing, use and end-of-life phase of Na/NiCl2 batteries.
Table A1.
Inventory data for the manufacturing, use and end-of-life phase of Na/NiCl2 batteries.
| ID | I/O | Input | Data Set/Provider | Database | Data Source | Region | Value | Unit |
|---|---|---|---|---|---|---|---|---|
| Manufacturing | ||||||||
| Electrolyte production | ||||||||
| M00001 | Output | Electrolyte | 1 | pcs | ||||
| Input | Boehmite AlO(OH) | aluminium hydroxide production|aluminium hydroxide|Cutoff, U | Ecoinvent 3.7 | [37] | EU27 | 0.137 | kg | |
| Input | Transport | market for transport, freight, lorry 16–32 metric ton, EURO6|transport, freight, lorry 16–32 metric ton, EURO6|Cutoff, U | Ecoinvent 3.7 | [22] | RER | 0.082 | t∙km | |
| Input | Sodium carbonate Na2CO3 | soda production, solvay process|sodium bicarbonate | Ecoinvent 3.7 | [37] | RER | 0.024 | kg | |
| Input | Transport | market for transport, freight, lorry 16–32 metric ton, EURO6|transport, freight, lorry 16–32 metric ton, EURO6|Cutoff, U | Ecoinvent 3.7 | [22] | RER | 0.024 | t∙km | |
| Input | Electricity | market for electricity, medium voltage|electricity, medium voltage|Cutoff, U | Ecoinvent 3.7 | Fraunhofer IKTS | DE | 0.758 | kWh | |
| Input | Natural gas | heat production, natural gas, at boiler atm. low-NOx condensing non-modulating <100 kW | heat, central or small-scale, natural gas|Cutoff, U | Ecoinvent 3.7 | Fraunhofer IKTS | Europe | 10.195 | kWh | |
| Empty cell production | ||||||||
| M00002 | Output | Empty cell | 1 | pcs | ||||
| Input | Electrolyte | Electrolyte Production | M00001 | 1 | pcs | |||
| Input | Hilumin (Case + Shims) | sheet rolling, steel|sheet rolling, steel|Cutoff, U | Ecoinvent 3.7 | [37] | Europe | 0.143 | kg | |
| Input | market for steel, unalloyed|steel, unalloyed|Cutoff, U | Ecoinvent 3.7 | [37] | Global | 0.143 | kg | ||
| Input | Nickel (collector) | smelting and refining of nickel concentrate, 16% Ni|nickel, class 1 | Ecoinvent 3.7 | [37] | Europe | 0.048 | kg | |
| Input | Nickel (seal) | smelting and refining of nickel concentrate, 16% Ni|nickel, class 1 | Ecoinvent 3.7 | [37] | Global | 0.018 | kg | |
| Input | Transport | market for transport, freight, lorry 16–32 metric ton, EURO6|transport, freight, lorry 16–32 metric ton, EURO6|Cutoff, U | Ecoinvent 3.7 | [22] | RER | 0.040 | t∙km | |
| Input | Electricity | market for electricity, medium voltage|electricity, medium voltage|Cutoff, U | Ecoinvent 3.7 | Fraunhofer IKTS | DE | 0.009 | kWh | |
| Input | Natural gas | heat production, natural gas, at boiler atm. low-NOx condensing non-modulating <100 kW|heat, central or small-scale, natural gas|Cutoff, U | Ecoinvent 3.7 | Fraunhofer IKTS | Europe | 2.026 | kWh | |
| Cell production | ||||||||
| M00003 | Output | Cell | 1 | pcs | ||||
| Input | Empty cell | empty cell production | M00002 | 1 | pcs | |||
| Input | Nickel powder | smelting and refining of nickel concentrate, 16% Ni|nickel, class 1 | Ecoinvent 3.7 | [37] | Global | 0.153 | kg | |
| Input | Transport | market for transport, freight, lorry 16–32 metric ton, EURO6|transport, freight, lorry 16–32 metric ton, EURO6|Cutoff, U | Ecoinvent 3.7 | [22] | RER | 0.199 | t∙km | |
| Input | Sodium chloride | sodium chloride production, powder|sodium chloride, powder|Cutoff, U | Ecoinvent 3.7 | [37] | Europe | 0.151 | kg | |
| Input | Transport | market for transport, freight, lorry 16–32 metric ton, EURO6|transport, freight, lorry 16–32 metric ton, EURO6|Cutoff, U | Ecoinvent 3.7 | [22] | RER | 0.196 | t∙km | |
| Input | Aluminium chloride anhydrous | aluminium chloride production|aluminium chloride|Cutoff, U | Ecoinvent 3.7 | [37] | Global | 0.106 | kg | |
| Input | Transport | market for transport, freight, lorry 16–32 metric ton, EURO6|transport, freight, lorry 16–32 metric ton, EURO6|Cutoff, U | Ecoinvent 3.7 | [22] | RER | 0.064 | t∙km | |
| Input | Fe powder | pig iron production|pig iron|Cutoff, U | Ecoinvent 3.7 | [37] | Europe | 0.024 | kg | |
| Input | Electricity | market for electricity, medium voltage|electricity, medium voltage|Cutoff, U | Ecoinvent 3.7 | Fraunhofer IKTS | DE | 0.115 | kWh | |
| Production of other battery components | ||||||||
| M00004 | Output | Battery case | 1 | pcs | ||||
| Input | Stainless steel | iron-nickel-chromium alloy production|iron-nickel-chromium alloy|Cutoff, U | Ecoinvent 3.7 | [22] | Europe | 11.00 | kg | |
| Input | Transport | market for transport, freight, lorry 16–32 metric ton, EURO6|transport, freight, lorry 16–32 metric ton, EURO6|Cutoff, U | Ecoinvent 3.7 | [22] | RER | 2.200 | t∙km | |
| M00005 | Output | Thermal insulation | 1 | pcs | ||||
| Input | Glass wool | glass wool mat production|glass wool mat|Cutoff, U | Ecoinvent 3.7 | [22] | CH | 10 | kg | |
| Input | Transport | market for transport, freight, lorry 16–32 metric ton, EURO6|transport, freight, lorry 16–32 metric ton, EURO6|Cutoff, U | Ecoinvent 3.7 | [22] | RER | 8.500 | t∙km | |
| M00006 | Output | Insulation among cells | 1 | pcs | ||||
| Input | Mica | kaolin production|kaolin|Cutoff, U | Ecoinvent 3.7 | [22] | Europe | 0.35 | kg | |
| M00007 | Output | Ohmic heater | 1 | pcs | ||||
| Input | Silicon | silicon production, electronics grade|silicon, electronics grade|Cutoff, U | Ecoinvent 3.7 | [22] | Europe | 0.35 | kg | |
| M00008 | Output | BMI | 1 | pcs | ||||
| Input | Electronics | electronics production, for control units|electronics, for control units|Cutoff, U | Ecoinvent 3.7 | [22] | Europe | 0.7 | kg | |
| Input | Transport | market for transport, freight, lorry 16–32 metric ton, EURO6|transport, freight, lorry 16–32 metric ton, EURO6|Cutoff, U | Ecoinvent 3.7 | [22] | RER | 0.280 | t∙km | |
| M00009 | Output | Electric cables | 1 | pcs | ||||
| Input | Nickel alloy | iron-nickel-chromium alloy production|iron-nickel-chromium alloy|Cutoff, U | Ecoinvent 3.7 | [22] | Europe | 0.2 | kg | |
| Input | Transport | market for transport, freight, lorry 16–32 metric ton, EURO6|transport, freight, lorry 16–32 metric ton, EURO6|Cutoff, U | Ecoinvent 3.7 | [22] | RER | 0.050 | t∙km | |
| M00010 | Output | Cells interconnection | 1 | pcs | ||||
| Input | Nickel | market for nickel, class 1|nickel, class 1|Cutoff, U | Ecoinvent 3.7 | [22] | Global | 0.36 | kg | |
| PCM component production | ||||||||
| M00011 | Output | PCM | 1 | pcs | ||||
| Input | Sodium nitrate | sodium nitrate production|sodium nitrate|Cutoff, U | Ecoinvent 3.7 | Fraunhofer IFAM | RER | 4.4 | kg | |
| Input | Stainless steel | market for iron-nickel-chromium alloy|iron-nickel-chromium alloy|Cutoff, U | Ecoinvent 3.7 | Fraunhofer IFAM | GLO | 4.2 | kg | |
| Input | Aluminium (HTEs) | market for aluminium, wrought alloy|aluminium, wrought alloy|Cutoff, U | Ecoinvent 3.7 | Fraunhofer IFAM | GLO | 3.2 | kg | |
| Na/NiCl2 battery production | ||||||||
| M00012 | Output | Na/NiCl2 battery | 1 | pcs | ||||
| Input | Cell | cell production | M00003 | 100 | pcs | |||
| Input | Battery case | battery case production | M00004 | 1 | pcs | |||
| Input | Thermal insulation | thermal insulation production | M00005 | 1 | pcs | |||
| Input | Insulation amoung cells | insulation among cells production | M00006 | 1 | pcs | |||
| Input | Ohmic heater | ohmic heater production | M00007 | 1 | pcs | |||
| Input | BMI | BMI production | M00008 | 1 | pcs | |||
| Input | Electric cables | electric cables production | M00009 | 1 | pcs | |||
| Input | Cells interconnection | cells interconnection production | M00010 | 1 | pcs | |||
| Input | PCM | PCM component production | M00011 | 1 | pcs | |||
| Use | ||||||||
| U00001 | Output | Na/NiCl2 battery_used | ||||||
| Input | Na/NiCl2 battery | M00012 | 1 | pcs | ||||
| Input | Electricity | market for electricity, medium voltage|electricity, medium voltage|Cutoff, U | Ecoinvent 3.7 | Fraunhofer IKTS | DE | Annual heating demand ∙Lifetime | kWh | |
| End-of-life | ||||||||
| Output | Na/NiCl2 battery_Eol | |||||||
| Input | Na/NiCl2 battery_used | U00001 | 1 | pcs | ||||
| Input | Dismantling | market for manual dismantling of electric scooter|manual dismantling of electric scooter|Cutoff, U | Ecoinvent 3.7 | [6] | GLO | 1 | pcs | |
| Input | Collection | market for transport, freight, lorry 16–32 metric ton, EURO6|transport, freight, lorry 16–32 metric ton, EURO6|Cutoff, U | Ecoinvent 3.7 | [6] | RER | 0.0315 | t ∙ km | |
References
- Kurzweil, P. Lithium Battery Energy Storage. In Electrochemical Energy Storage for Renewable Sources and Grid Balancing; Elsevier: Amsterdam, The Netherlands, 2015; pp. 269–307. ISBN 9780444626165. [Google Scholar]
- Hueso, K.B.; Armand, M.; Rojo, T. High temperature sodium batteries: Status, challenges and future trends. Energy Environ. Sci. 2013, 6, 734. [Google Scholar] [CrossRef]
- Hueso, K.B.; Palomares, V.; Armand, M.; Rojo, T. Challenges and perspectives on high and intermediate-temperature sodium batteries. Nano Res. 2017, 10, 4082–4114. [Google Scholar] [CrossRef]
- Moseley, P.T.; Rand, D.A. High-Temperature Sodium Batteries for Energy Storage. In Electrochemical Energy Storage for Renewable Sources and Grid Balancing; Moseley, Patrick, T., Garche, J., Eds.; Elsevier: Amsterdam, The Netherlands, 2015; pp. 253–268. ISBN 9780444626165. [Google Scholar]
- Trickett, D. Current Status of Health and Safety Issues of Sodium/Metal Chloride (Zebra) Batteries; National Renewable Energy Laboratory: Golden, Colorado, 1998. [Google Scholar]
- Dustmann, C.-H. Advances in ZEBRA batteries. Eighth Ulm. Electrochem. Tage 2004, 127, 85–92. [Google Scholar] [CrossRef]
- Sudworth, J. The sodium/nickel chloride (ZEBRA) battery. J. Power Sources 2001, 100, 149–163. [Google Scholar] [CrossRef]
- Dustmann, C.-H.; Bito, A. Secondary Batteries-High Temperatur Systems|Safety. In Encyclopedia of Electrochemical Power Sources; Garche, J., Ed.; Elsevier: Amsterdam, The Netherlands, 2009; pp. 324–333. ISBN 9780444527455. [Google Scholar]
- Cleaver, B.; Cleaver, D.J.; Littlewood, L.; Demott, D.S. Reversible and irreversible heat effects in ZEBRA cells. J. Appl. Electrochem. 1995, 25, 1128–1132. [Google Scholar] [CrossRef]
- Jaguemont, J.; Omar, N.; van den Bossche, P.; Mierlo, J. Phase-change materials (PCM) for automotive applications: A review. Appl. Therm. Eng. 2018, 132, 308–320. [Google Scholar] [CrossRef]
- Huang, R.; Li, Z.; Hong, W.; Wu, Q.; Yu, X. Experimental and numerical study of PCM thermophysical parameters on lithium-ion battery thermal management. Energy Rep. 2020, 6, 8–19. [Google Scholar] [CrossRef]
- Liu, C.; Xu, D.; Weng, J.; Zhou, S.; Li, W.; Wan, Y.; Jiang, S.; Zhou, D.; Wang, J.; Huang, Q. Phase Change Materials Application in Battery Thermal Management System: A Review. Materials 2020, 13, 4622. [Google Scholar] [CrossRef]
- Malik, M.; Dincer, I.; Rosen, M.A. Review on use of phase change materials in battery thermal management for electric and hybrid electric vehicles. Int. J. Energy Res. 2016, 40, 1011–1031. [Google Scholar] [CrossRef]
- Grimonia, E.; Andhika, M.R.C.; Aulady, M.F.N.; Rubi, R.V.C.; Hamidah, N.L. Thermal Management System Using Phase Change Material for Lithium-ion Battery. J. Phys. Conf. Ser. 2021, 2117, 12005. [Google Scholar] [CrossRef]
- Verma, A.; Shashidhara, S.; Rakshit, D. A comparative study on battery thermal management using phase change material (PCM). Therm. Sci. Eng. Prog. 2019, 11, 74–83. [Google Scholar] [CrossRef]
- Youssef, R.; Hosen, M.S.; He, J.; AL-Saadi, M.; van Mierlo, J.; Berecibar, M. Novel design optimization for passive cooling PCM assisted battery thermal management system in electric vehicles. Case Stud. Therm. Eng. 2022, 32, 101896. [Google Scholar] [CrossRef]
- Cárdenas, B.; León, N. High temperature latent heat thermal energy storage: Phase change materials, design considerations and performance enhancement techniques. Renew. Sustain. Energy Rev. 2013, 27, 724–737. [Google Scholar] [CrossRef]
- Zhou, D.; Eames, P. Thermal characterisation of binary sodium/lithium nitrate salts for latent heat storage at medium temperatures. Sol. Energy Mater. Sol. Cells 2016, 157, 1019–1025. [Google Scholar] [CrossRef][Green Version]
- Restello, S.; Residori, Z.; Crugnola, G.; Zanon, N. Hocheffiziente natriumbasierte Hochtemperatur-Elektrochemiezelle. German Patent and Trade Mark Office DE112014005945T5, 19 December 2014. [Google Scholar]
- Porzio, J.; Scown, C.D. Life-Cycle Assessment Considerations for Batteries and Battery Materials. Adv. Energy Mater. 2021, 11, 2100771. [Google Scholar] [CrossRef]
- Matheys, J.; van Autenboer, W.; van Mierlo, J. SUBAT: Sustainable Batteries—Work Package 5: Overall Assessment; Final Public Report; Vrije Universiteit Brussel and ETEC: Brussel, Belgium, 2004. [Google Scholar]
- Longo, S.; Antonucci, V.; Cellura, M.; Ferraro, M. Life cycle assessment of storage systems: The case study of a sodium/nickel chloride battery. J. Clean. Prod. 2013, 85, 337–346. [Google Scholar] [CrossRef]
- Longo, S.; Cellura, M.; Cusenza, M.A.; Guarino, F.; Mistretta, M.; Panno, D.; D’Urso, C.; Leonardi, S.G.; Briguglio, N.; Tumminia, G.; et al. Life Cycle Assessment for Supporting Eco-Design: The Case Study of Sodium–Nickel Chloride Cells. Energies 2021, 14, 1897. [Google Scholar] [CrossRef]
- European Commission, Joint Research Centre, Institute for Environment and Sustainability. Characterisation Factors of the ILCD Recommended Life Cycle Impact Assessment Methods. Database and Supporting Information, 1st ed.; EUR 25167; Publications Office of the European Union: Luxembourg, 2012. [Google Scholar]
- Bhamidipati, K.; Lindsey, J.; Frutschy, K.; Ajdari, A.; Browell, J.; Hólló, S. Sodium Metal Halide Battery Thermal Design for Improved Reliability. J. Electrochem. Energy Convers. Storage 2018, 15, 041004. [Google Scholar] [CrossRef]
- Rossi, F.; Parisi, M.L.; Greven, S.; Basosi, R.; Sinicropi, A. Life Cycle Assessment of Classic and Innovative Batteries for Solar Home Systems in Europe. Energies 2020, 13, 3454. [Google Scholar] [CrossRef]
- Wei, G.; Wang, G.; Xu, C.; Ju, X.; Xing, L.; Du, X.; Yang, Y. Selection principles and thermophysical properties of high temperature phase change materials for thermal energy storage: A review. Renew. Sustain. Energy Rev. 2018, 81, 1771–1786. [Google Scholar] [CrossRef]
- Bauer, T.; Laing, D.; Tamme, R. Characterization of Sodium Nitrate as Phase Change Material. Int. J. Thermophys. 2012, 33, 91–104. [Google Scholar] [CrossRef]
- Bauer, T.; Laing, D.; Kroener, U.; Tamme, R. Sodium Nitrate for High Temeprature Latent Heat Storage. In Proceedings of the 11th Internation Conference on Thermal Energy Storage, Stockholm, Sweden, 14–17 June 2009. [Google Scholar]
- Cleaver, B. Asymmetric Thermal Effects in High Temperature Cells with Solid Electrolytes. J. Electrochem. Soc. 1995, 142, 3409. [Google Scholar] [CrossRef]
- Rubenbauer, H.; Henninger, S. Definitions and reference values for battery systems in electrical power grids. J. Energy Storage 2017, 12, 87–107. [Google Scholar] [CrossRef]
- COMSOL Multiphysics® v. 5.6. COMSOL AB. Stockholm, Sweden. Available online: www.comsol.com (accessed on 1 November 2021).
- D’Urso, C.; Briguglio, N.; Bonanno, A.; Ferraro, M.; Antonucci, V.; Vasta, S. Thermochemical investigation on a novel sodium-metal-halide battery configuration: Experimental and FEM model results. J. Energy Storage 2019, 25, 100818. [Google Scholar] [CrossRef]
- Nousch, L.; Richter, M.; Herold, D. Simulation based Energy Performance Analysis and Economic Assessment of Na/NiCl2 Batteries compared to Li-Ion Batteries Operating in a PV Home Storage System. In Proceedings of the SBS2-2 International Sodium Battery Symposium, Dresden, Germany, 13–14 January 2021. [Google Scholar]
- openLCA v. 10.3.1. Berlin, Germany. Available online: https://www.openlca.org (accessed on 1 November 2021).
- Ecoinvent v. 3.7. Zurich, Schwitzerland. Available online: https://ecoinvent.org (accessed on 1 November 2021).
- FZSoNick. Product Safety Data Sheet. 2017. Available online: https://www.fzsonick.com/applications/residential-energy-storage (accessed on 23 October 2020).
Publisher’s Note: MDPI stays neutral with regard to jurisdictional claims in published maps and institutional affiliations. |
© 2022 by the authors. Licensee MDPI, Basel, Switzerland. This article is an open access article distributed under the terms and conditions of the Creative Commons Attribution (CC BY) license (https://creativecommons.org/licenses/by/4.0/).