Article

Comparison of Cooling Performance in a Cylindrical Battery with Single-Phase Direct Contact Cooling under Various Operating Conditions

1
Department of Mechanical Engineering, Graduate School of Chosun University, 309 Pilmundaero, Dong-gu, Gwangju 61452, Korea
2
Department of Mechanical Engineering, Chosun University, 309 Pilmundaero, Dong-gu, Gwangju 61452, Korea
3
Korea Automotive Technology Institute, 303 Pungse-ro, Pungse-Myeon, Cheonan 31214, Korea
*
Author to whom correspondence should be addressed.
Batteries 2022, 8(10), 195; https://doi.org/10.3390/batteries8100195
Submission received: 6 September 2022 / Revised: 9 October 2022 / Accepted: 13 October 2022 / Published: 20 October 2022
(This article belongs to the Special Issue Thermal Management System for Lithium-Ion Batteries)

Abstract

:
This study compares the performance according to a working fluid, the number of battery cooling block ports, and header width required for cooling according to the application of the direct contact single-phase battery cooling method in a 1S16P battery module and examines the battery cooling performance according to the flow rate under the standard and summer conditions based on an optimized model. The analysis result verified that R134a showed low-pressure drop and high cooling performance as the working fluid of the direct contact single-phase cooling system in the 1S16P battery module, and R134a showed the best cooling and stability when applied with three ports and a 5 mm header. In addition, under 25 °C outdoor conditions, the maximum temperature of the battery and the temperature difference between the batteries at 3 and 5 lpm excluding 1 lpm are 30.5 °C, 4.91 °C, and 28.7 °C, 3.28 °C, indicating that the flow rate of refrigerant was appropriate for battery safety. In contrast, in the summer condition of 35 °C, the maximum temperature of the battery and temperature difference between the batteries were 38.8 °C and 3.27 °C at the R134a flow rate of 5 lpm or more, which was verified as a stable flow condition for battery safety.

1. Introduction

As greenhouse gas emissions and the depletion of natural resources have become major issues in recent years, there is increasing interest in developing and applying eco-friendly energy to solve energy problems. Now, in the transportation industry, conventional internal combustion engine vehicles, which account for 49% of the existing fossil fuel oil resources and is the largest energy consuming and fastest growing sector in the world, are being replaced by eco-friendly energy vehicles [1,2]. In addition, many countries are investing much effort in achieving the goal of zero carbon emissions by 2050. In particular, the electric cars and battery industry have grown significantly to contribute to achieving zero carbon emissions through international agreements in the automobile industry [3]. Electric cars use lithium-ion batteries mainly for power sources, and lithium-ion batteries are a key element in energy storage and automobiles, having advantageous properties, such as high energy density, lightweight, no memory effect, and low-self-discharge rate [4]. However, in lithium-ion batteries, the operating temperature changes significantly due to electrochemical reactions during charging and discharging time, which directly affects the performance and lifespan of the battery. Hence, a cooling system to control the heat generation of the battery is essential [5].
In general, the safe operation and management temperature of a battery should be 20–40 °C and the temperature difference (TD) between batteries should be maintained at 5 °C or less [6]. Failure to adequately cool or control the heat generation of lithium-ion batteries results in reduced capacity and performance degradation of battery batteries due to the increase in temperature non-uniformity between battery cells and pack temperatures, which may lead to thermal runaway [7,8]. Wang et al. [9] experimentally tested the performance of the lithium-ion batteries according to the charge/discharge cycle when the ambient air temperature was 25 °C and 45 °C, respectively, and reported that the battery charge capacity decreased significantly over time, and specifically at high temperatures. In addition, it was verified that after 200 cycles, the capacity of the battery decreased to 21.3% and 22.6%, respectively, under the condition that the ambient air temperature was 25 °C and 45 °C. Li et al. [10] analyzed the change in internal structure due to mechanical deformation of 21700 lithium-ion batteries using X-ray computer tomography technology. As a result, as the mechanical deformation and the charge/discharge cycle increase, the internal resistance of the lithium-ion battery increases, and the capacity and state of health of the lithium-ion battery decrease significantly. Sun et al. [11] conducted experiments and analyzed the mechanical deformation characteristics against overcharging in 72 pouch battery modules. They reported that it is very important to prevent mechanical deformation of lithium-ion batteries because the pouch cell is deformed even at a low temperature (below −60 °C), and the volume change offset is 277% under internal pressure of 32,434 Pa. Supported by various study results, a battery thermal management system (BTMS) that maintains a constant temperature inside the battery, prevents mechanical deformation, and dissipates heat is essential for the normal operation of the battery.
The current study of battery cooling systems consists mainly of air cooling [12,13], liquid cooling [14,15], phase change material (PCM) cooling [16,17], and heat pipe cooling [18,19]. Air cooling poses no risk of leakage, such as liquid cooling. In addition, since cooling is performed using air, there are advantages, including the low maintenance cost, simple structure without a cooling loop, and low weight and energy consumption. However, due to the low heat capacity and thermal conductivity of air, the long-term high C-rate charge and discharge, high ambient temperature, and the like may cause problems such as battery malfunction or overheating [20]. Compared to air cooling, liquid cooling is more complex, heavy, and expensive to build but exhibits excellent cooling performance with a compact structure, high thermal capacity, and thermal conductivity [12]. In addition, the PCM-based cooling system has a significant advantage in terms of temperature distribution uniformity of the battery to be utilized as a cooling system. However, developing a single-PCM-BTMS is limited due to low thermal conductivity, structural instability due to leakage, and phase change. However, the PCM-BTMS system can be applied to batteries as a composite PCM [5]. Finally, due to its flexibility, low maintenance, and high thermal conductivity, the heat pipe cooling system rapidly expands within industries, including BTMS [21]. Such heat pipe-based cooling has not been applied in the battery thermal management field due to inefficient heat pipe and immaturity in the production standards and equipment, and remains in the research stage [22].
Other than the thermal management system presented above, a study on a refrigerant cooling system using a refrigerant is being conducted, and in the case of an electric vehicle, it can be applied as a system to expand a refrigeration system of a conventional air conditioning system, which has the advantage of reducing the cost. However, the refrigerant used in the heating, ventilation, and air conditioning (HVAC) system has to be maintained at a higher pressure than the liquid-cooling system. It is not easy to apply due to the design or control of the system. Shen et al. [23] conducted a study on improving the cooling performance of battery packs through indirect cooling using R134a and a cooling plate to study the refrigerant cooling system. As a result of the change in the flow rate and C-rate of the refrigerant, the maximum temperature (MXT) of the battery can be controlled within the safe operating temperature range, and a method for improving the thermal performance of the large battery pack to prevent from thermal runway expansion of the cell was proposed. Hong et al. [24] conducted a study on the thermal characteristics of batteries by comparing the performance of liquid cooling and refrigerant cooling systems under actual vehicle conditions. It was suggested that the two-phase refrigerant cooling method is more efficient than liquid cooling as refrigerant cooling provides 16.1% higher battery charge capacity and 15.0% lower internal resistance than liquid cooling, even in extreme environments.
Liquid cooling or refrigerant cooling system may be classified into direct-contact and indirect-contact cooling methods. Manufacturers widely use indirect cooling in the EV field in various BTMSs, including Audi, Tesla, GM, BMW, and Ford [25]. Xie et al. [26] analyzed the indirect liquid cooling system using an aluminum plate on the top and bottom parts of the battery module. They reported that it is an effective cooling technology that can optimize the thickness and flow rate of the cooling plate and maintain the MXT of the battery below 31.8 °C at a 3 C-rate. Chen et al. [27] proposed a 7-channel-based parallel liquid cooling system at the bottom of the battery and analyzed thermal performance and energy costs through an analytical study. They reported through analysis that the MXT, TD, and energy cost of the battery at 2.5 C-rate are 33.1 °C, 0.9 °C, and 17.29 J, respectively, which are effective cooling technology. Lu et al. [28] proposed an indirect liquid cooling method through a one-stage Tesla valve on the side of a battery and analyzed the valve angle, channel distance, and coolant effect at a 3 C-rate. Based on the analysis result, they suggested that it is an efficient cooling technology that can maintain the MXT of the battery below 30.5 °C. As such, indirect liquid cooling is performed using a working fluid obtained by mixing liquid with ethylene glycol to avoid electrically short-circuited and chemical erosion. However, these devices increase the non-uniformity of temperature distribution inside the battery pack and the cost and complexity of the battery due to a decrease in thermal conductivity. In addition, the battery performance and life cycle can be degraded significantly due to the non-uniformity of temperature distribution between the battery and the other battery [29].
Contrarily, direct-contact cooling does not require a channel design process of the working fluid and provides compactness and high efficiency compared to indirect contact cooling with high heat transfer performance. Nevertheless, direct contact BTMS has not been widely used [30]. In direct contact cooling, liquid usage is limited due to electrical and chemical reactions caused by direct contact with the battery and problems such as liquid leakage. However, various studies are currently conducted to apply direct contact cooling to battery systems. Tan et al. [25] designed a direct contact cooling system adopting HFE-6120 dielectric coolant under 3 C-rate conditions and analyzed the effect through system optimization. The study presented the results of improving the battery’s MXT and temperature deviation by 18.1% and 25.0%, respectively, and provided direct contact cooling design guidelines. In addition, Wu et al. [29] designed a direct contact cooling system using silicone oil and reported that the MXT increment rate of a battery was significantly reduced by 20% to 30% compared to indirect contact cooling, which showed more efficient performance. Liu et al. [30] conducted theoretical and experimental verification with a direct contact cooling battery system using transformer oil (TO) at a 2 C-rate discharge rate, analyzed the effect of change in flow rate on performance, and Al Zareer et al. [31] established a direct contact refrigerant-based thermal management system using R134a refrigerant-based analyzed under 5 C-rate conditions. The result verified that when the working fluid covers 40% or more of the battery, the battery system is maintained below 30 °C to design a stable system.
In an actual battery, the working fluid for direct contact cooling is very limited, and fluid ensuring electrical insulation, non-toxicity, temperature resistance, and chemical stability must be used [30]. However, notwithstanding such disadvantages, direct contact cooling minimizes thermal resistance between the battery and the cooling fluid compared to indirect contact, thus showing an efficient cooling performance, and particularly, it is an effective method for dissipating heat from the battery even at a high battery heating value. Moreover, it is a cooling system that can be a based model for utilizing heat pipes and PCM cooling methods.
However, despite these shortcomings, direct contact cooling exhibits efficient cooling performance by minimizing the thermal resistance between the battery and the cooling fluid compared to indirect contact and is an effective way to dissipate heat from the battery, especially even at a high battery heating value. To increase the mileage of the electric vehicle, a large number of batteries must be installed in a limited space than before, thus excellent battery cooling performance is essentially required. Due to the dense arrangement of the battery, it is necessary to micronize the cooling plate and the cooling structure in order to utilize the indirect contact cooling method. Micronization of the cooling structure increases the pressure drop and requires high pump power consumption. On the other hand, the direct contact cooling method can efficiently manage battery heat due to a decrease in thermal resistance between the battery and the working fluid.
In this study, to evaluate the possibility of introducing the direct contact cooling method to the electric vehicle thermal management system, candidates for the working fluid (silicone oil, transformer oil, HFE-6120, R134a), considering the cost and their cooling performances, were investigated. In addition, the influence of the number and arrangement of inlet and outlet ports was evaluated to improve the battery cooling performance by optimization of the limited space of space. Finally, since the external air temperature affects the battery cooling system, the battery cooling performance according to the external air temperature was evaluated. This study is expected to contribute to the practical and efficient design for the BTMS of electric vehicles through a comprehensive analysis of the cooling performance and cost of working fluid of the direct contact cooling method.

2. Numerical Methodology

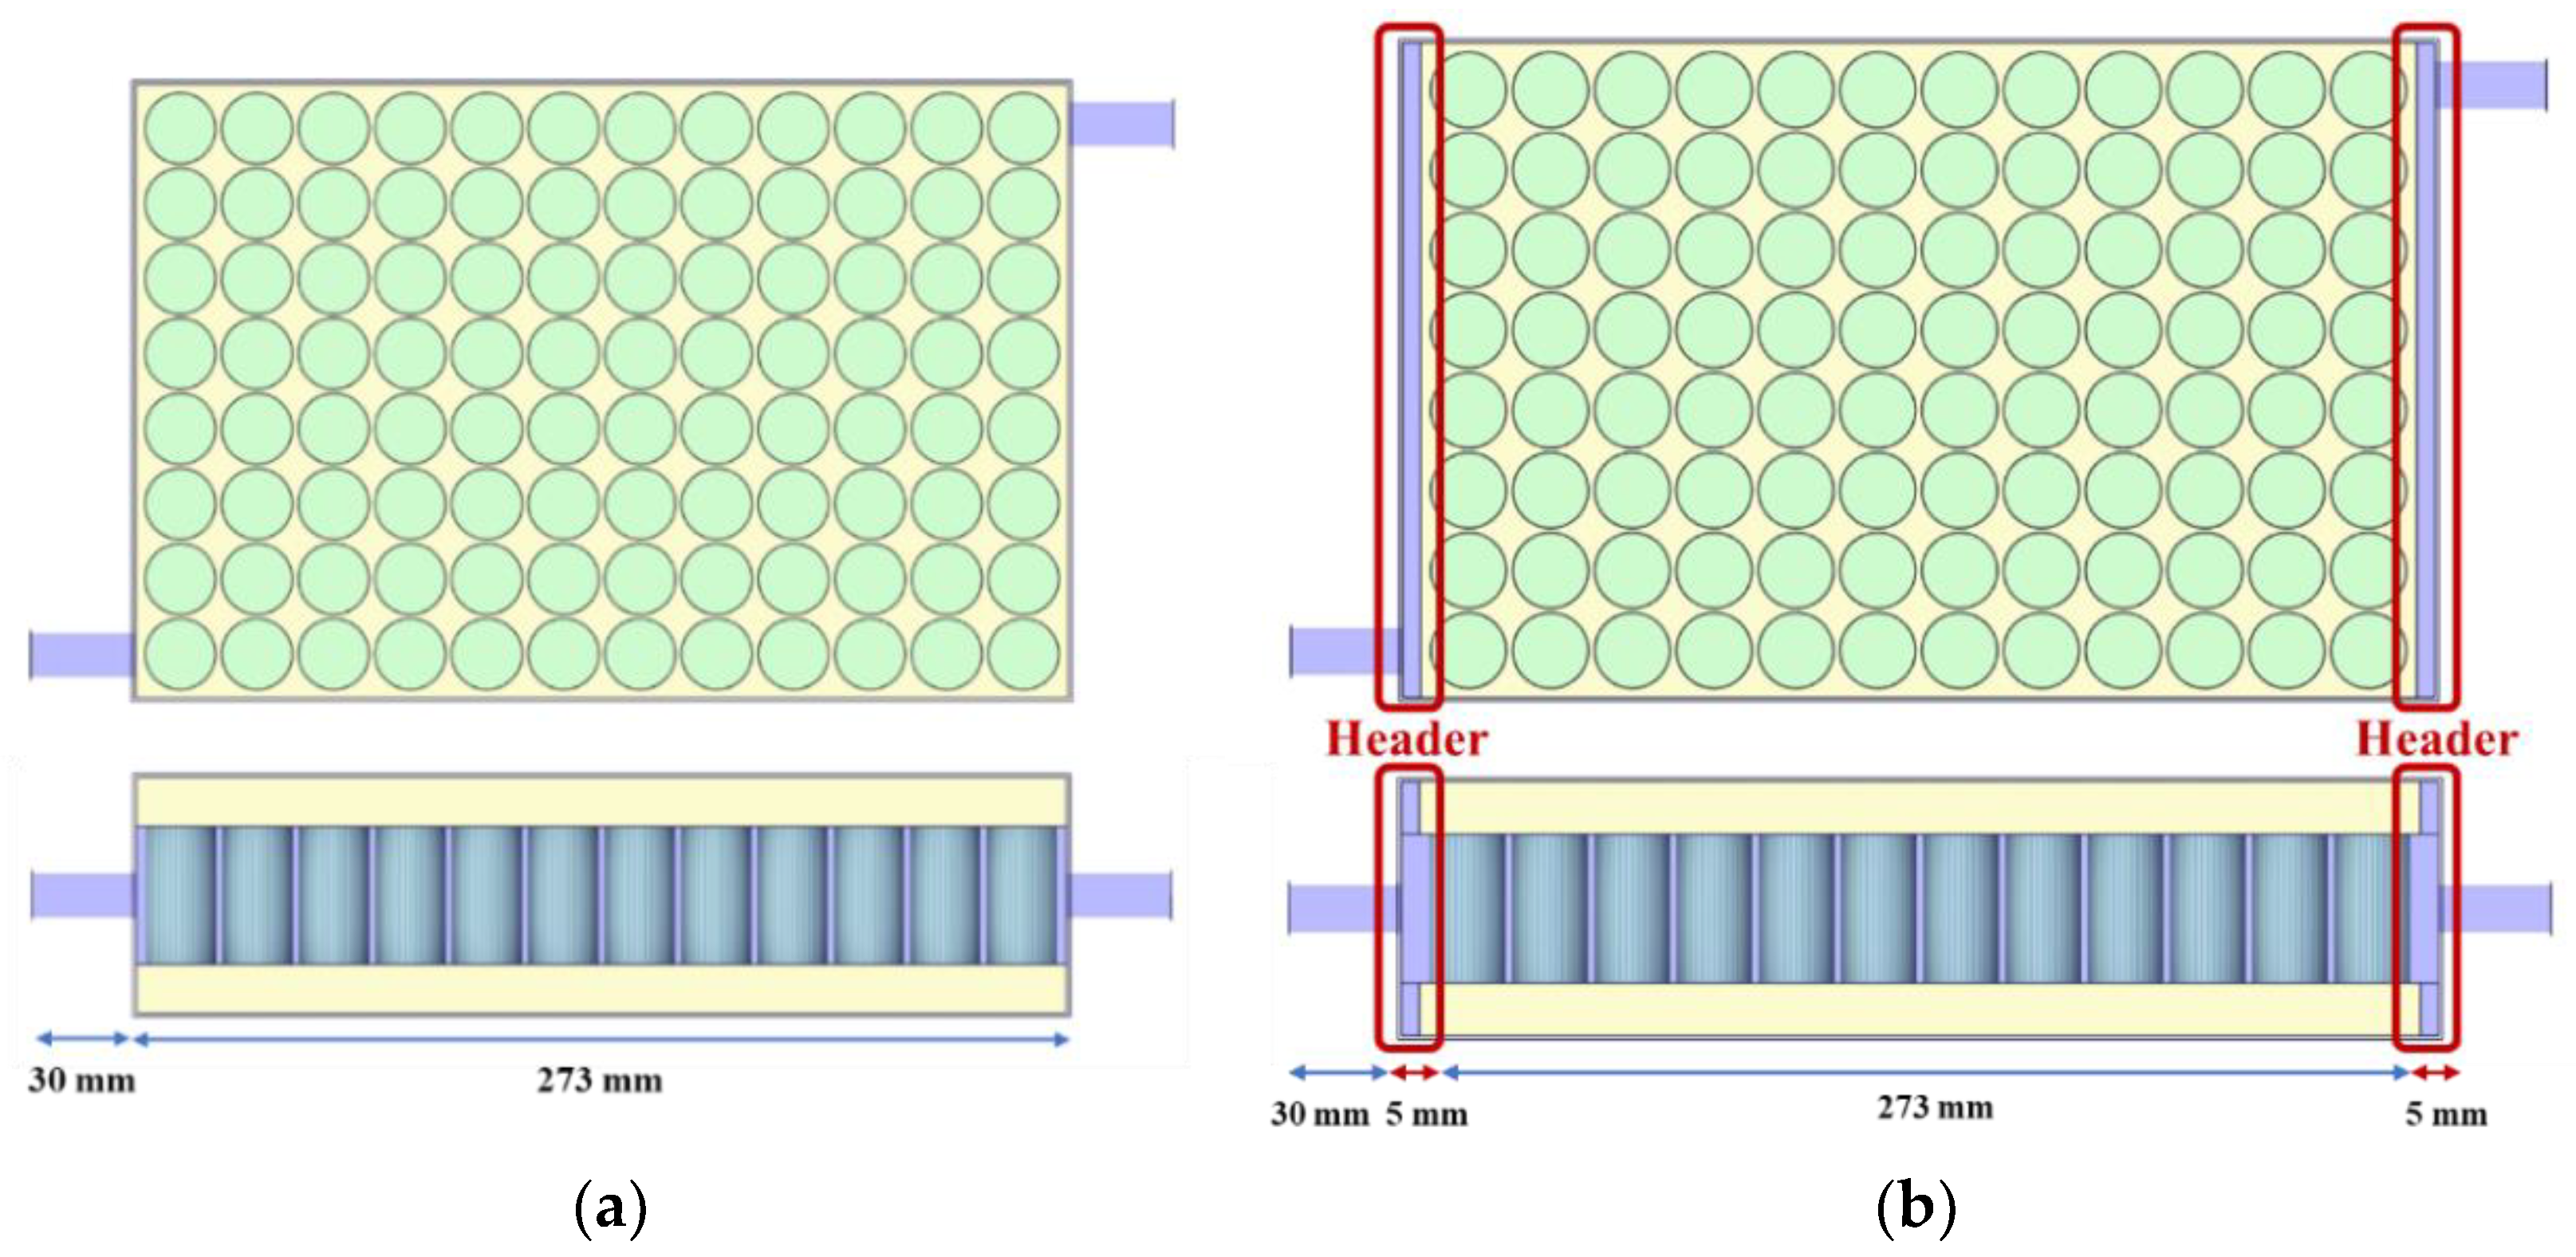
2.1. Battery and Cooling System Modeling

This study analyzed the cooling performance of the battery using ANSYS Fluent 2021 R2 [32]. Figure 1 shows a battery module model and fluid volume for analysis according to the change in the number of ports of the working fluid in the battery module. In this study, the cooling performance was studied by changing the number of inlet and outlet ports of the battery module to 1, 2, and 3. The battery model used for the analysis was a cylindrical 21700 battery, which has a capacity of 4.95 Ah and was designed with a total number of 96. The battery module in Figure 1 was designed to have a battery size of 21 mm (D) × 70 mm (H), a battery holder size of 181.6 mm (L) × 276.4 mm (W) × 14.5 mm (H), and a battery cooling block size of 183.6 mm (L) × 273.4 mm (W) × 72 mm (H). The gap between the batteries is maintained at 1.2 mm. For the analysis under the same flow conditions, the flow rate flowing into each port was designed as Q ˙ in Figure 1a, and the flow rate entering from Figure 1b,c to each port was designed as Q ˙ /2 and Q ˙ /3 of the flow rate flowing into in Figure 1a, respectively, to perform the analysis. Figure 1d shows the volume of fluid flowing through the battery cooling block in the model with three ports. In addition, Table 1 shows the thermal properties of each component of the battery module applied in this study.
The cooling performance and battery temperature distribution depending on the change of working fluid were analyzed to select a suitable working fluid for cooling in a battery module with a single port before evaluating the cooling performance according to the change of inlet and outlet ports of the battery block. The types of working fluids applied to the analysis are silicone oil, TO, HFE-6120, and R134a, and each working fluid was selected based on the working fluids used in the previous study [25,29,30,31]. R1234yf and R1234ze as new generation refrigerants are used as alternative refrigerants for R134a. The GWP for R1234yf, R1234ze, and R134a is 4, 7, and 1430, respectively, thus R134a has a higher GWP than R1234yf and R1234ze. However, R1234yf and R1234ze have flammability. Moreover, they are very expensive compared to other refrigerants such as R134a. In addition, the price of the working fluid is important to utilize the direct contact cooling method because the direct contact cooling method has a wider space for the fluid to flow compared to the existing indirect contact cooling method. Therefore, R1234yf and R1324ze as working fluids in the direct contact cooling method are excluded in this study [34]. Accordingly, R134a was selected as the working fluid candidate group for direct contact cooling.
Table 2 shows the typical thermal properties and cost of working fluids applied in this study. The silicone oil [29] is obtained at an operating temperature of 17 °C, TO [30] is obtained at an operating temperature of 20 °C, and HFE-6120 [25] is obtained at an operating temperature of 21 °C. In general, the thermal properties of working fluids change according to temperature. Thus, thermal properties should be applied according to temperature. In addition, the cost of working fluid was confirmed as R134a showed the lowest cost at $41/kg [35], while silicon oil showed the highest cost at $245/kg [36]. The selected working fluids for the batter thermal system were analyzed based on the model presented in Figure 1a to select the recommendable working fluid for battery cooling. A model optimized for battery thermal management was derived with the analysis of the cooling performance of various ports and header width. The width of the header applied in this study was applied equally to both the inlet and outlet, and the header width was changed to 0 mm, 5 mm, and 10 mm to be analyzed. Figure 2 shows a model with a header width of 0 mm and 5 mm to consider the battery cooling performance according to the header width change.

2.2. Governing Equation and Boundary Conditions

In the direct cooling system, the heat dissipation of the battery is achieved by direct heat exchange between the battery and working fluid and has a very complex structure. Therefore, in order to simplify the analysis, the following assumption was made.
(1)
There is no phase change in the interpretation of this analysis.
(2)
It is assumed that the working fluid is filled with the cooling model, and there is no air.
(3)
Thermal resistance and radiation are not considered.
(4)
The working fluid is incompressible.
The equation of energy generated in a battery cell is as follows [39].
ρ b a c b a T b a t = λ b a 2 T b a + q ˙
where T, ρ, and c are temperature, density, and specific heat capacity of the battery, respectively. λ and q ˙ are thermal conductivity and volumetric heat generation rate of battery (subscript ba), respectively.
The equation of heat generated in a battery (Qgen) is as follows [40,41].
Q g e n = Q i r + Q r e = I 2 R I T U O C V T
where Qgen, Qir, and Qre represent total heat generation, irreversible heat and reversible heat of battery cell, respectively. I and R represent discharge/charge current and equivalent internal resistance of the battery cell, respectively. T represents the battery temperature. ∂UOCV/∂T represents the temperature coefficient of open-circuit voltage.
The mass, momentum, and energy balance equations of the governing equations of working fluid in the battery module are as follows [31].
ρ w f t + · ( ρ w f u ) = 0
t ( ρ w f u ) + · ( ρ w f u u ) + P = ρ g
t ( ρ w f c w f T w f ) + ( ρ w f c w f u T w f ) = ( λ w f T w f )
where u , P, and g are velocity, static pressure, and gravitational acceleration (subscript wf), respectively.
In addition, the cooling capacity of the cooling system for controlling the battery heating value is calculated as follows.
Q = m ˙ c w f ( T o u t T i n )
where m ˙ is mass flow rate, Q is cooling capacity, while Tout and Tin are outlet temperature and inlet temperature of working fluid, respectively.
In the battery cooling block, the theoretical pump power is assumed to be 100% efficiency, and the pump power required at this time can be expressed by the following simple equation.
W p u m p = Δ P Q ˙
where Wpump is pump power, ΔP is the pressure drop between the inlet and the outlet pressure of the cooling plate, and Q ˙ is the flow rate.
In this study, there are four types of fluids considered as working fluids in the battery cooling block, among which silicone oil, TO, and HFE-6120 are shown as Reynolds number Re < 2300, in which a Laminar flow model is applied. An R134a, Re > 2300, is applied to a realizable k-ε turbulence model. In addition, this study applied 1 lpm (L/min), 3 lpm, and 5 lpm to the flow rates of working fluid and set the outdoor air temperature, the temperatures of the initial battery system, and the inlet of working fluid to 25 °C. Here, the convective heat transfer coefficient for the ambient air was 10 W/m·K [42]. The battery charge/discharge rate applied to the analysis and verification experiments was applied at a 2 C-rate. In addition, when a direct contact battery cooling block was applied to the summer, the temperature distribution characteristics and cooling performance of the battery were additionally reviewed under outdoor air and inlet temperature of working fluid of 35 °C [43,44] based on the developed analysis model.

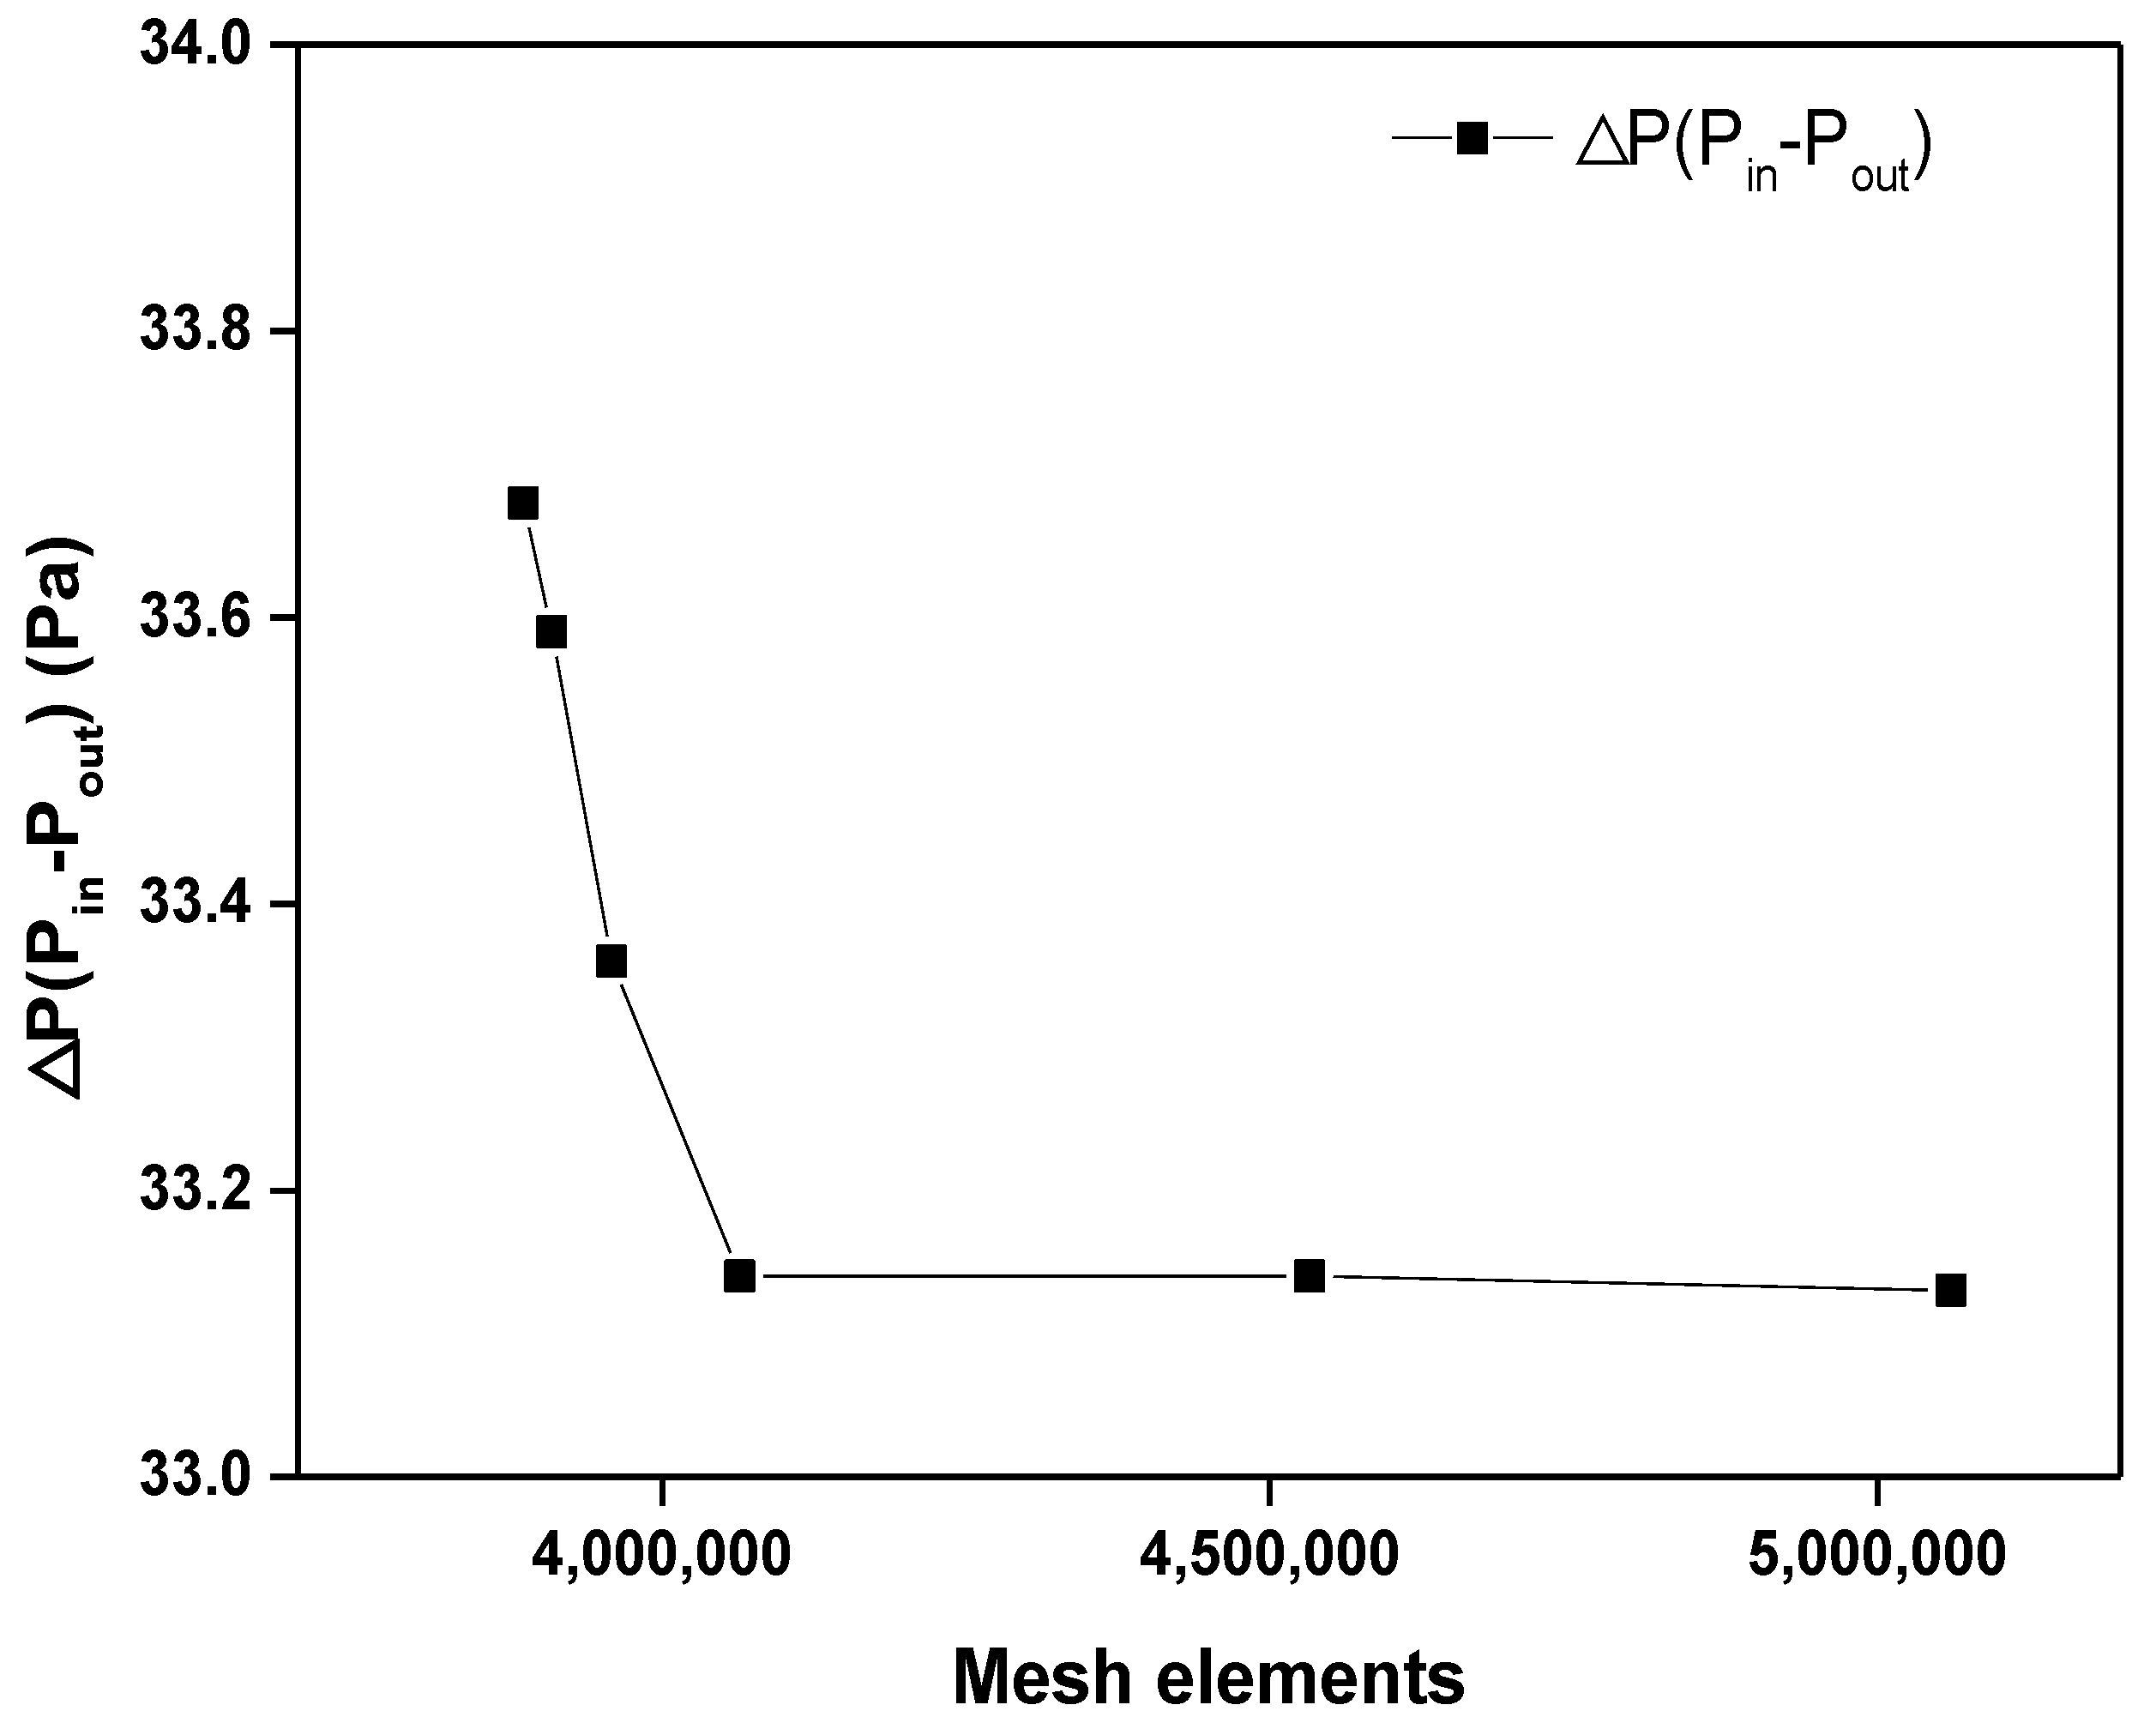
2.3. Grid Independence Test

The analysis for evaluating grid independence was conducted by applying refrigerant R134a fluid at initial battery temperature, outdoor air temperature, and coolant inlet temperature at 25 °C when the number of the port was 1 and the flow rate was 1 lpm. Figure 3 shows the change in pressure drop in the battery module according to the number of meshes. When the initial number of meshes was 3,885,580, the pressure drop decreased rapidly from 33.68 Pa, and even if the number of meshes increased further from 4,063,590 to 33.14 Pa, the pressure drop did not increase and converge as a result. Therefore, this study analyzed the battery temperature and cooling performance of the battery cooling block using 4,063,590 meshes.

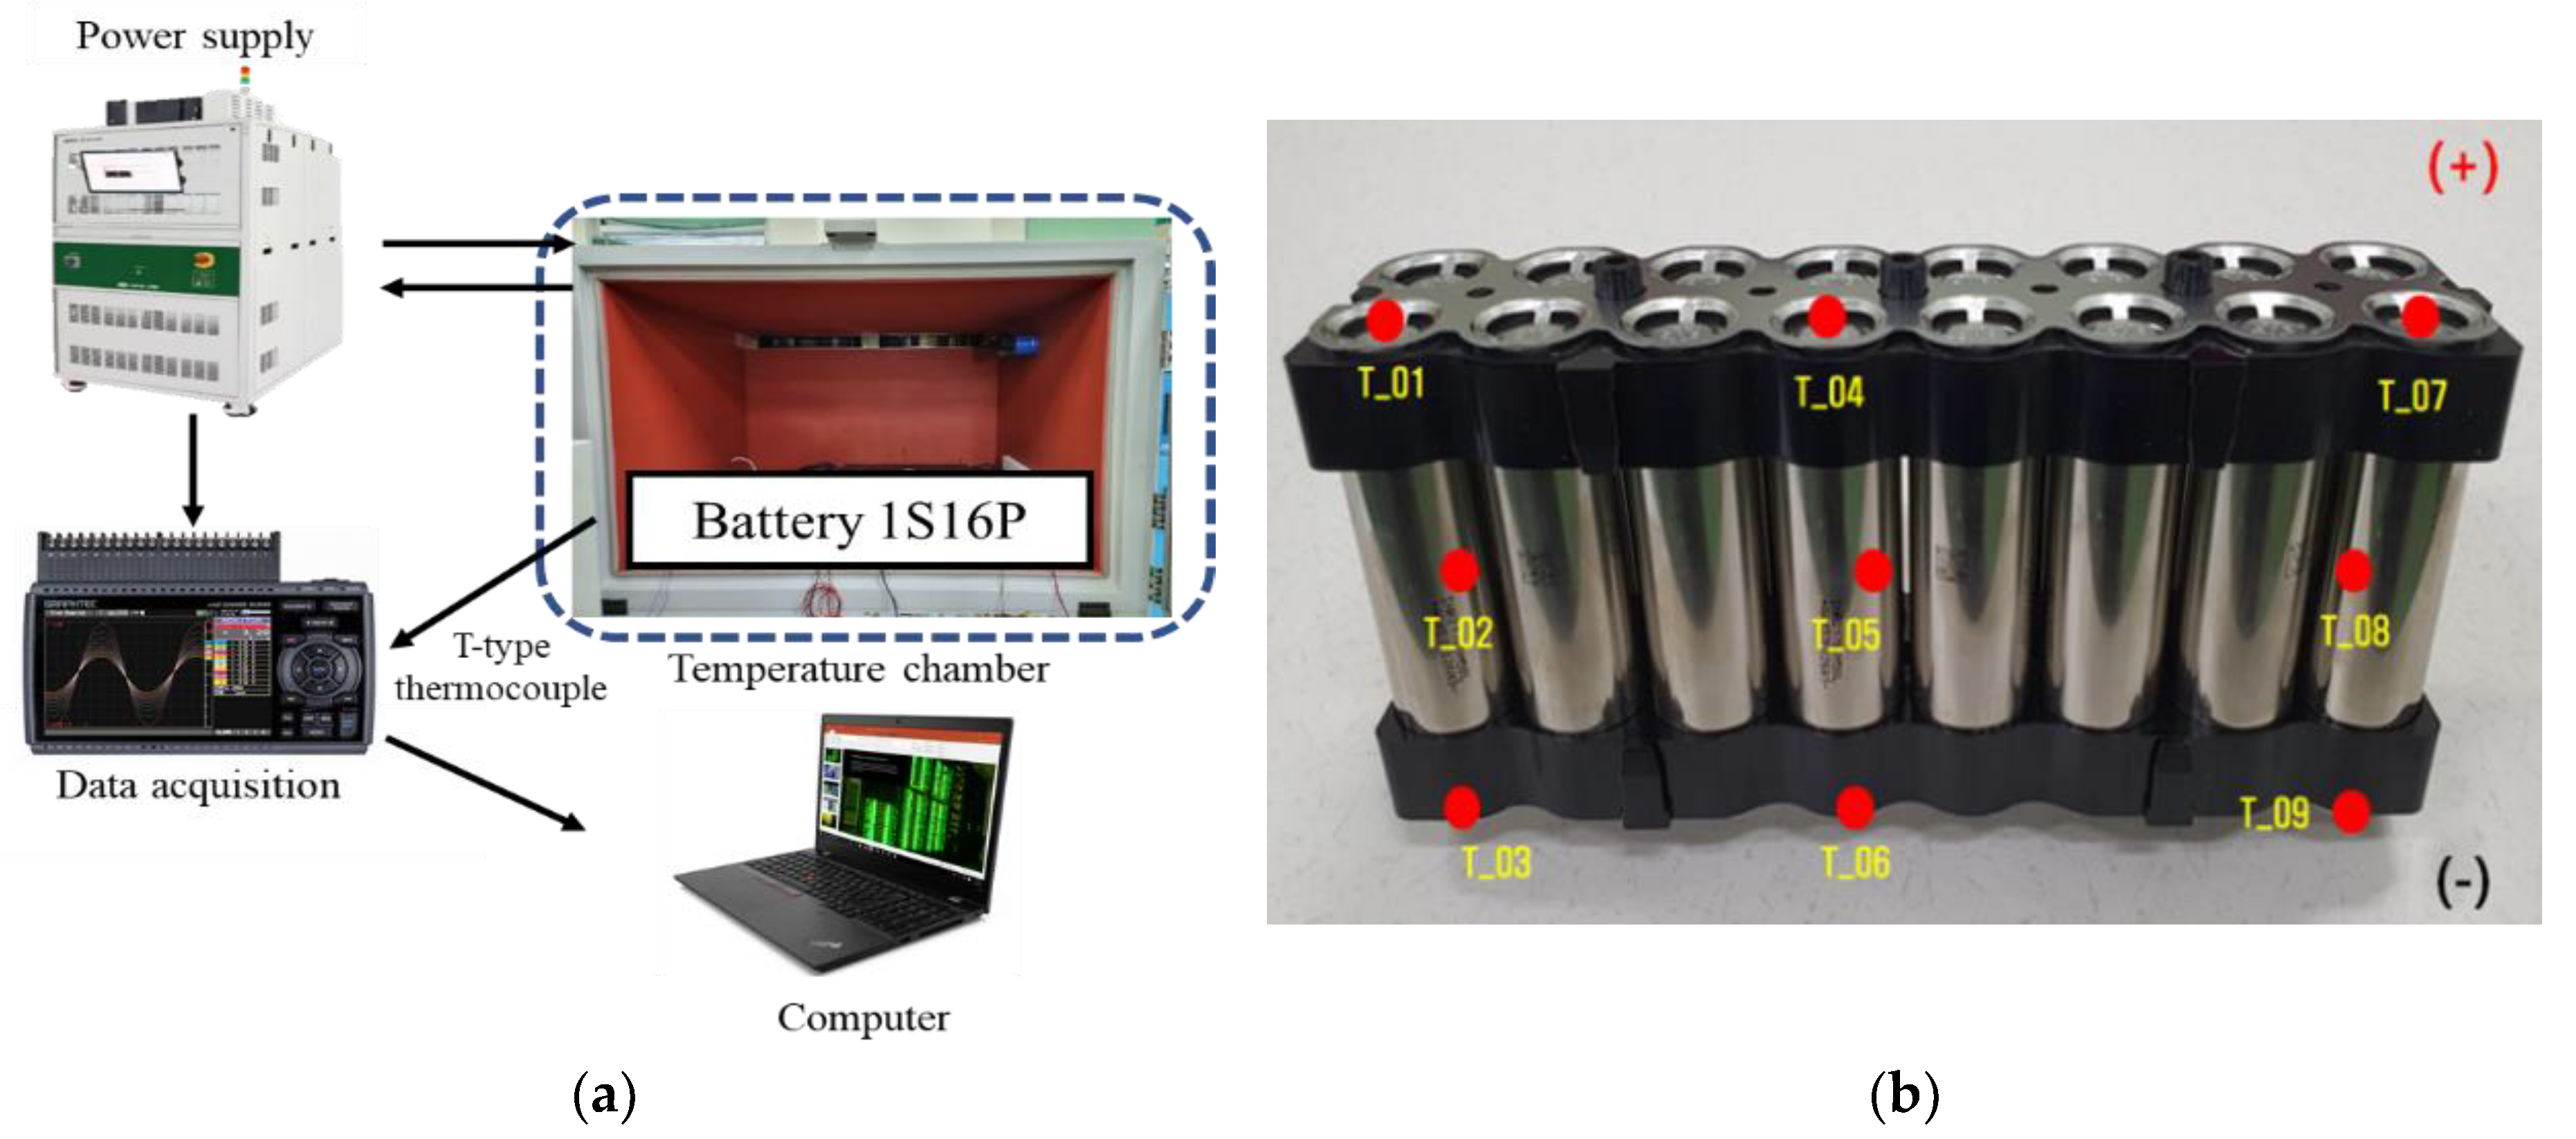
2.4. Verification Experiment Setup and Method

An experiment was conducted on cooling during battery charging and discharging in order to verify the reliability of the analysis model used, and a schematic diagram of the experimental apparatus was shown in Figure 4. As shown in Figure 4a, the experimental apparatus for verification consists of Power supply (PNE Solution Co., Suwon, Korea, Uncertainty: ±0.1%), Data acquisition (GRAPHTEC Co., Yokohama, Japan, Uncertainty: ±0.5%), computer, temperature chamber, 1 serial × 16 parallel (1S16P) battery module, T-type thermal couple (Omega Co., Techlink, Singapore, Uncertainty: ±0.5). As a condition for the battery charge/discharge experiment, the experiment was carried out under 2 C-rate conditions after maintaining the ambient temperature at 25 °C. 1S16P battery module has a capacity of 80 Ah and consists of a battery holder, a busbar, and a 21,700 battery. Figure 4a shows the location of the T-type thermocouple attached to the battery module. A total of nine thermocouples were used. Three thermocouples were installed at the top, middle, and bottom of the battery, and the average temperature of the battery was used. The presented experiment results are the average value of 5 repeated experiments, and the error of the obtained temperature is 6.43%.

3. Results and Discussion

3.1. Verification of Battery Analytical Model

A change in temperature of the battery according to the time under the 2 C-rate discharging condition is shown in Figure 5. Figure 5a shows a change in the average temperature of each of the three thermocouples located at the upper end (T_01, 04, 07), middle end (T_02, 05, 08), and bottom end (T_03, 06, 09) under natural convection condition. When discharging was performed for 1800 s under 2 C-rate conditions, the battery temperature continued to rise over time, and the average temperature at the top, middle, and bottom ends of the battery was 52.3 °C, 60.2 °C, and 54.2 °C, respectively. Heat is generated by a chemical reaction internal cell during the charging and discharging of the battery cell. The temperature in the middle of the battery during discharging was the highest, and the top and bottom parts of the battery showed almost the same temperature. Since the heat is generated by a chemical reaction in the battery cell, the temperature farther from the center of the battery cell is lower than that at the center. It is confirmed that a similar temperature distribution was also observed in the verification experiment on the heat generation of the battery cell. To compare the experimental and analysis results of the 1S16P battery module when the natural convection cooling method was applied under the same conditions, the MXT of the battery was compared and presented in Figure 5b. The MXT of the battery was 58.3 °C and 60.5 °C, respectively, in the analysis and experiment when the time of discharge reached 1800 s. In addition, the change in the MXT of the battery over time showed a similar tendency, and the average error rate of the MXT over time was 2.09%, verifying the reliability of the battery analysis model used in this study.

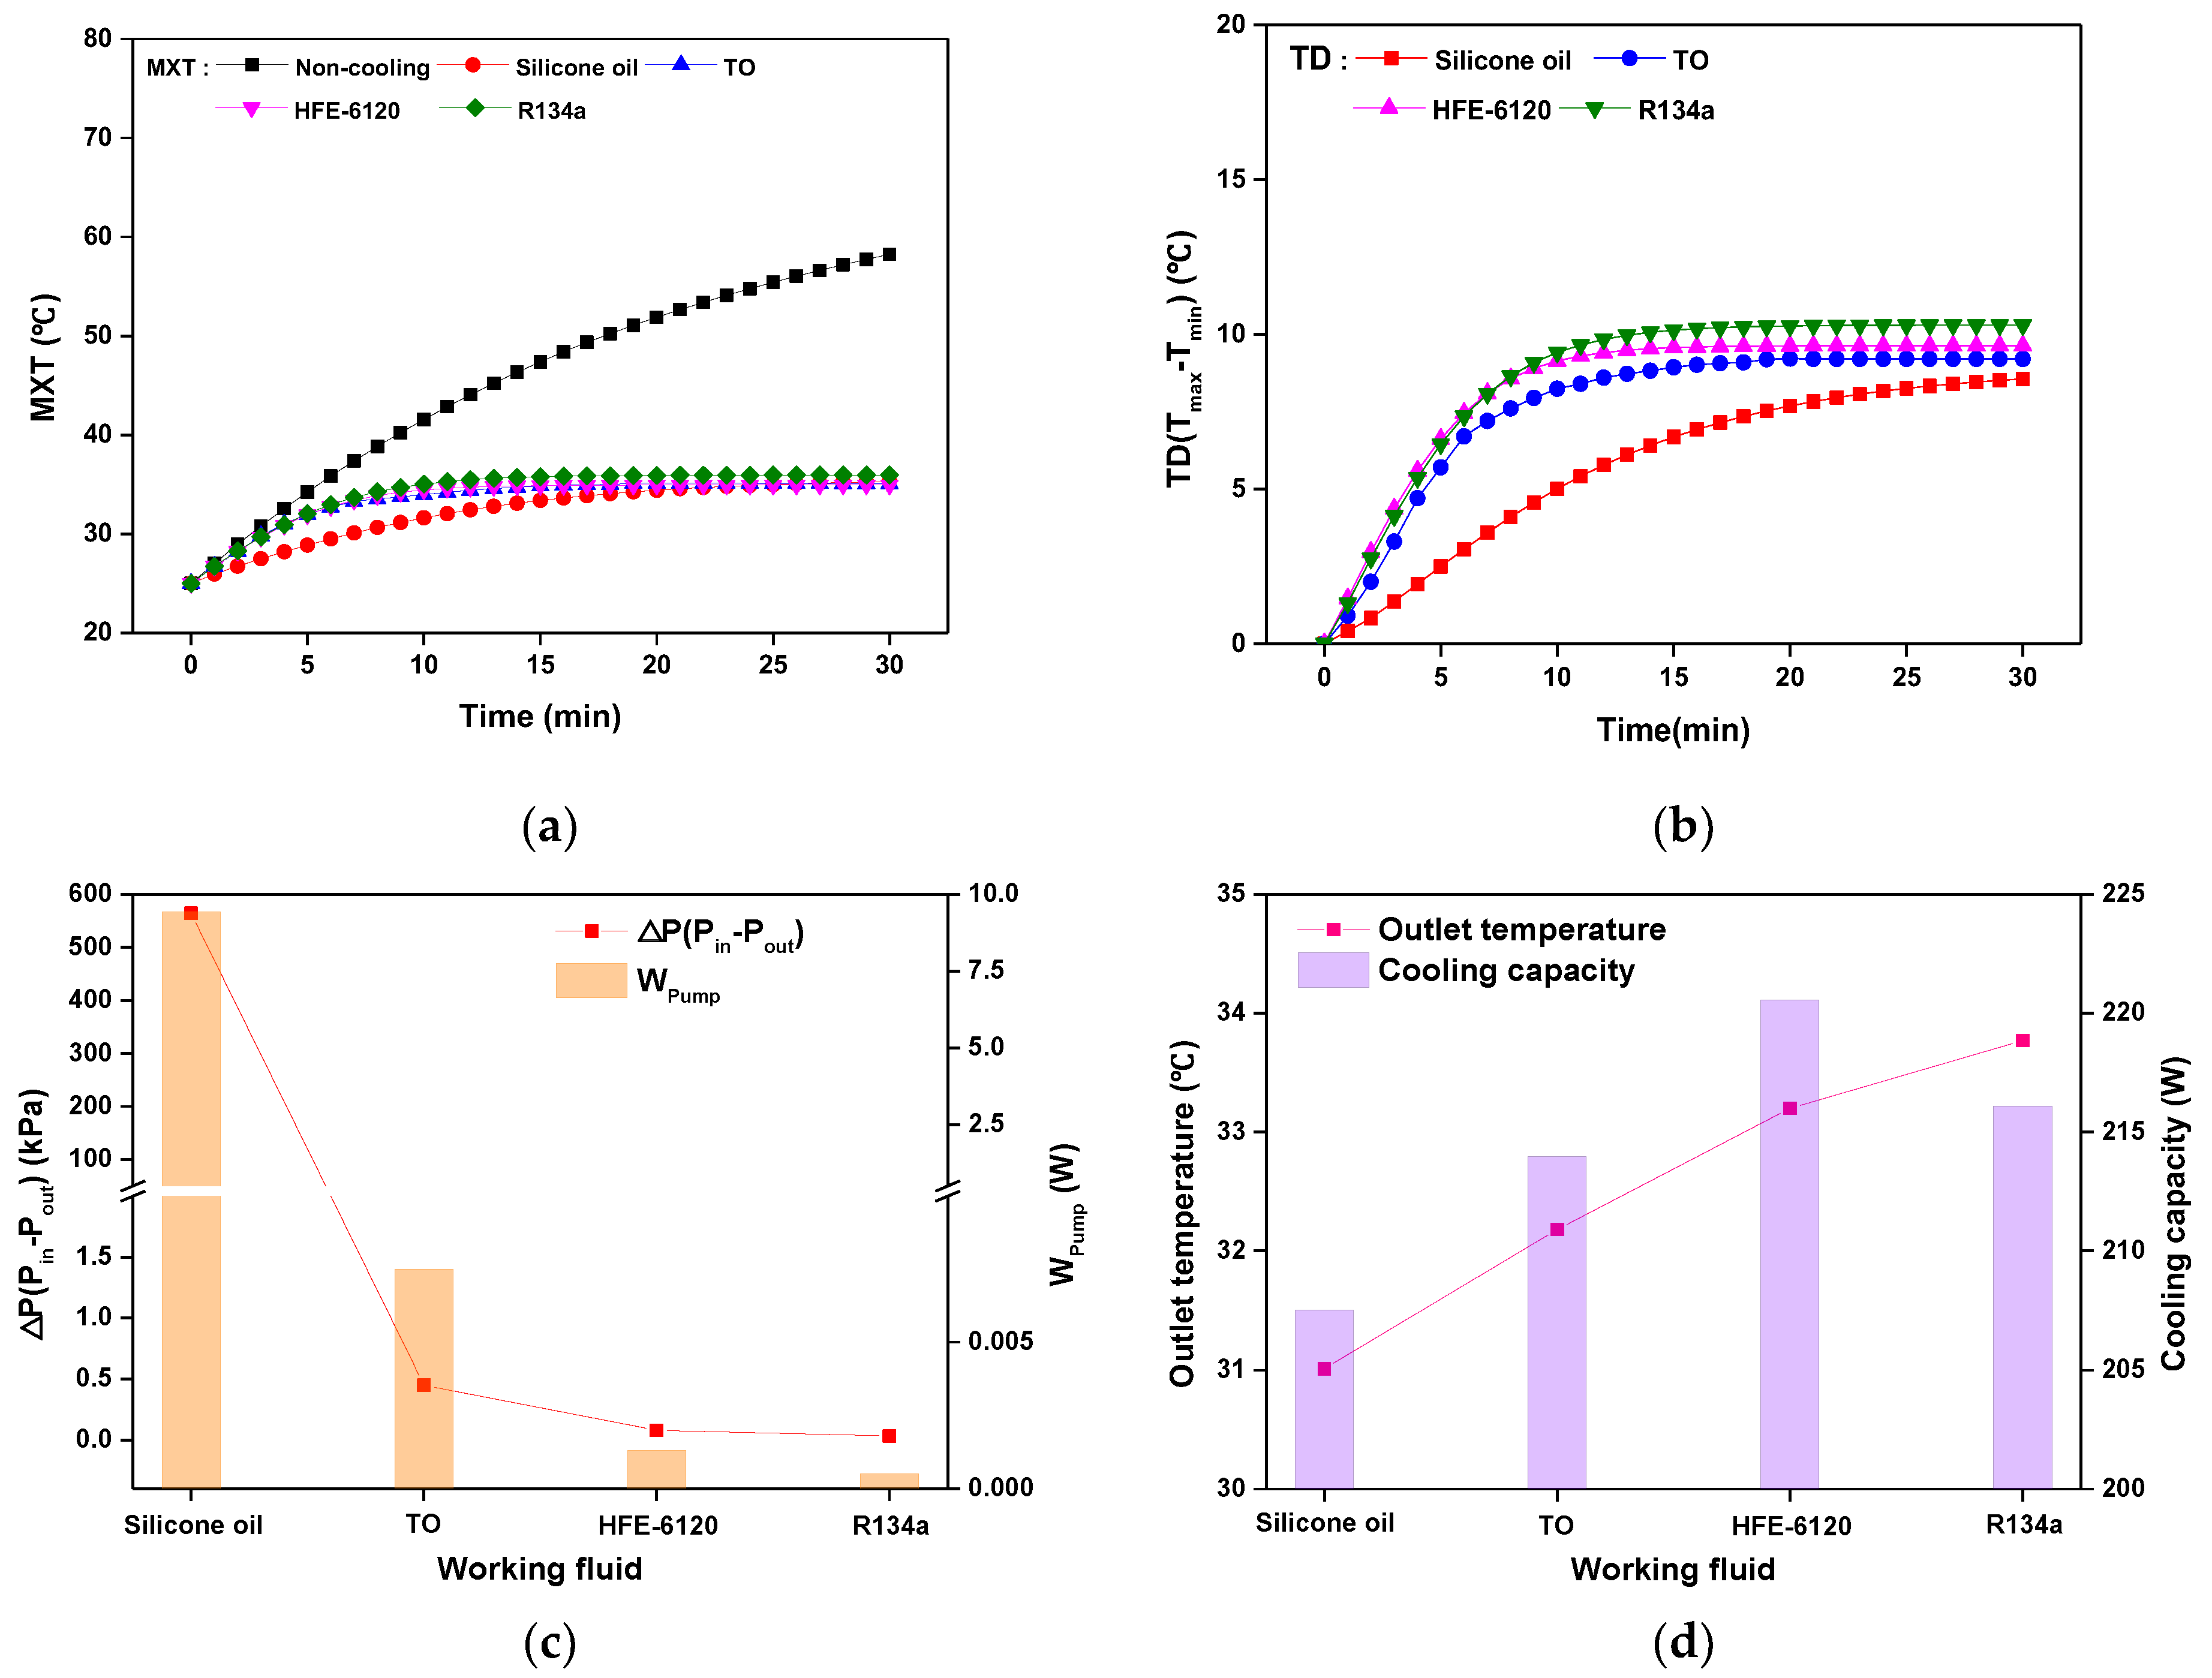
3.2. Cooling Performance according to the Working Fluid

The cooling performance and temperature distribution according to the change of working fluid were analyzed by applying a battery module with a single port, as illustrated in Figure 1a, to select a suitable working fluid necessary for cooling the battery module. The initial, ambient, and inlet temperature was 25 °C, and the flow rate of the working fluid was 1 lpm, and Figure 6 illustrates the battery temperature, pressure drop of the battery cooling block, and cooling performance depending on the change of the working fluid. Figure 6a,b show the MXT and a TD between the batteries according to the change of the working fluid. When discharging for 30 min under natural convection conditions without cooling using working fluid, the MXT of the battery was 58.3 °C, and in the battery cooling block, when the working fluids were silicone oil, TO, HFE-120, and R134a, the MXT of the battery was 35.3 °C, 35.1 °C, 34.9 °C, and 35.9 °C, respectively. In addition, as presented in Figure 6b, the TD between batteries were 8.56 °C, 9.20 °C, 9.6,3 °C, and 10.30 °C, respectively, and the TD between batteries was the largest in the order of R134a, HFE-6120, TO and silicone oil. Based on the analysis results, HFE-6120 was the most suitable fluid for managing the MXT of the battery, and silicone oil was the most suitable for managing the TD between batteries.
Figure 6c shows a comparison of pressure drop and pump power for each working fluid in the battery module. Silicone oil, TO, HFE-6120, and R134a were applied, and the pressure drop of the battery cooling block was 564 kPa, 0.45 kPa, 0.08 kPa, and 0.03 kPa, respectively, and the power required for the pump was 9422 mW, 0.08 mW, 1.33 mW, and 0.55 mW. The pressure drop for each working fluid is in the order of silicon oil, TO, HFE-6120, and R134a. Since the silicone oil and TO, has a higher viscosity than R134a and HFE-6120, the use of such a large viscosity leads to a decrease in the performance and capacity of an electric vehicle or battery system. Figure 6d shows the outlet temperature and cooling capacity of the battery cooling block for each working fluid. When silicon oil, TO, HFE-6120, and R134a are applied, the outlet temperatures of the battery cooling block are 31.0 °C, 32.2 °C, 33.2 °C, and 33.8 °C, respectively, followed by order of R134a HFE-6120, TO, and silicone oil. In addition, the cooling capacity of the battery cooling block was 207.5 W, 213.9 W, 220.6 W, 216.1 W, respectively, in the order of HFE-6120, R134a, TO, and silicone oil. This difference is caused by the thermal properties of each working fluid, and it is determined that HFE-6120 and R134a, excluding silicone oil and TO, which consume a large pump power, are appropriate cooling fluids. As a result, the cooling capacity of HFE-6120 and R134a was 4.47 W, indicating that HFE-6120 showed slightly greater cooling performance, but HFE-6120 generated 0.8 mW more power. However, HFE-6120 is a newly developed material, and the price of HFE-7000 is $217/kg [37], 5.29 times higher than R134a, which is $41.0/kg [35]. Therefore, this study comprehensively considered cooling performance, the power required, and the economic aspect and selected R134a as a working fluid to cool the direct contact single phase of the battery module. The cooling performance according to variables is considered analytically.

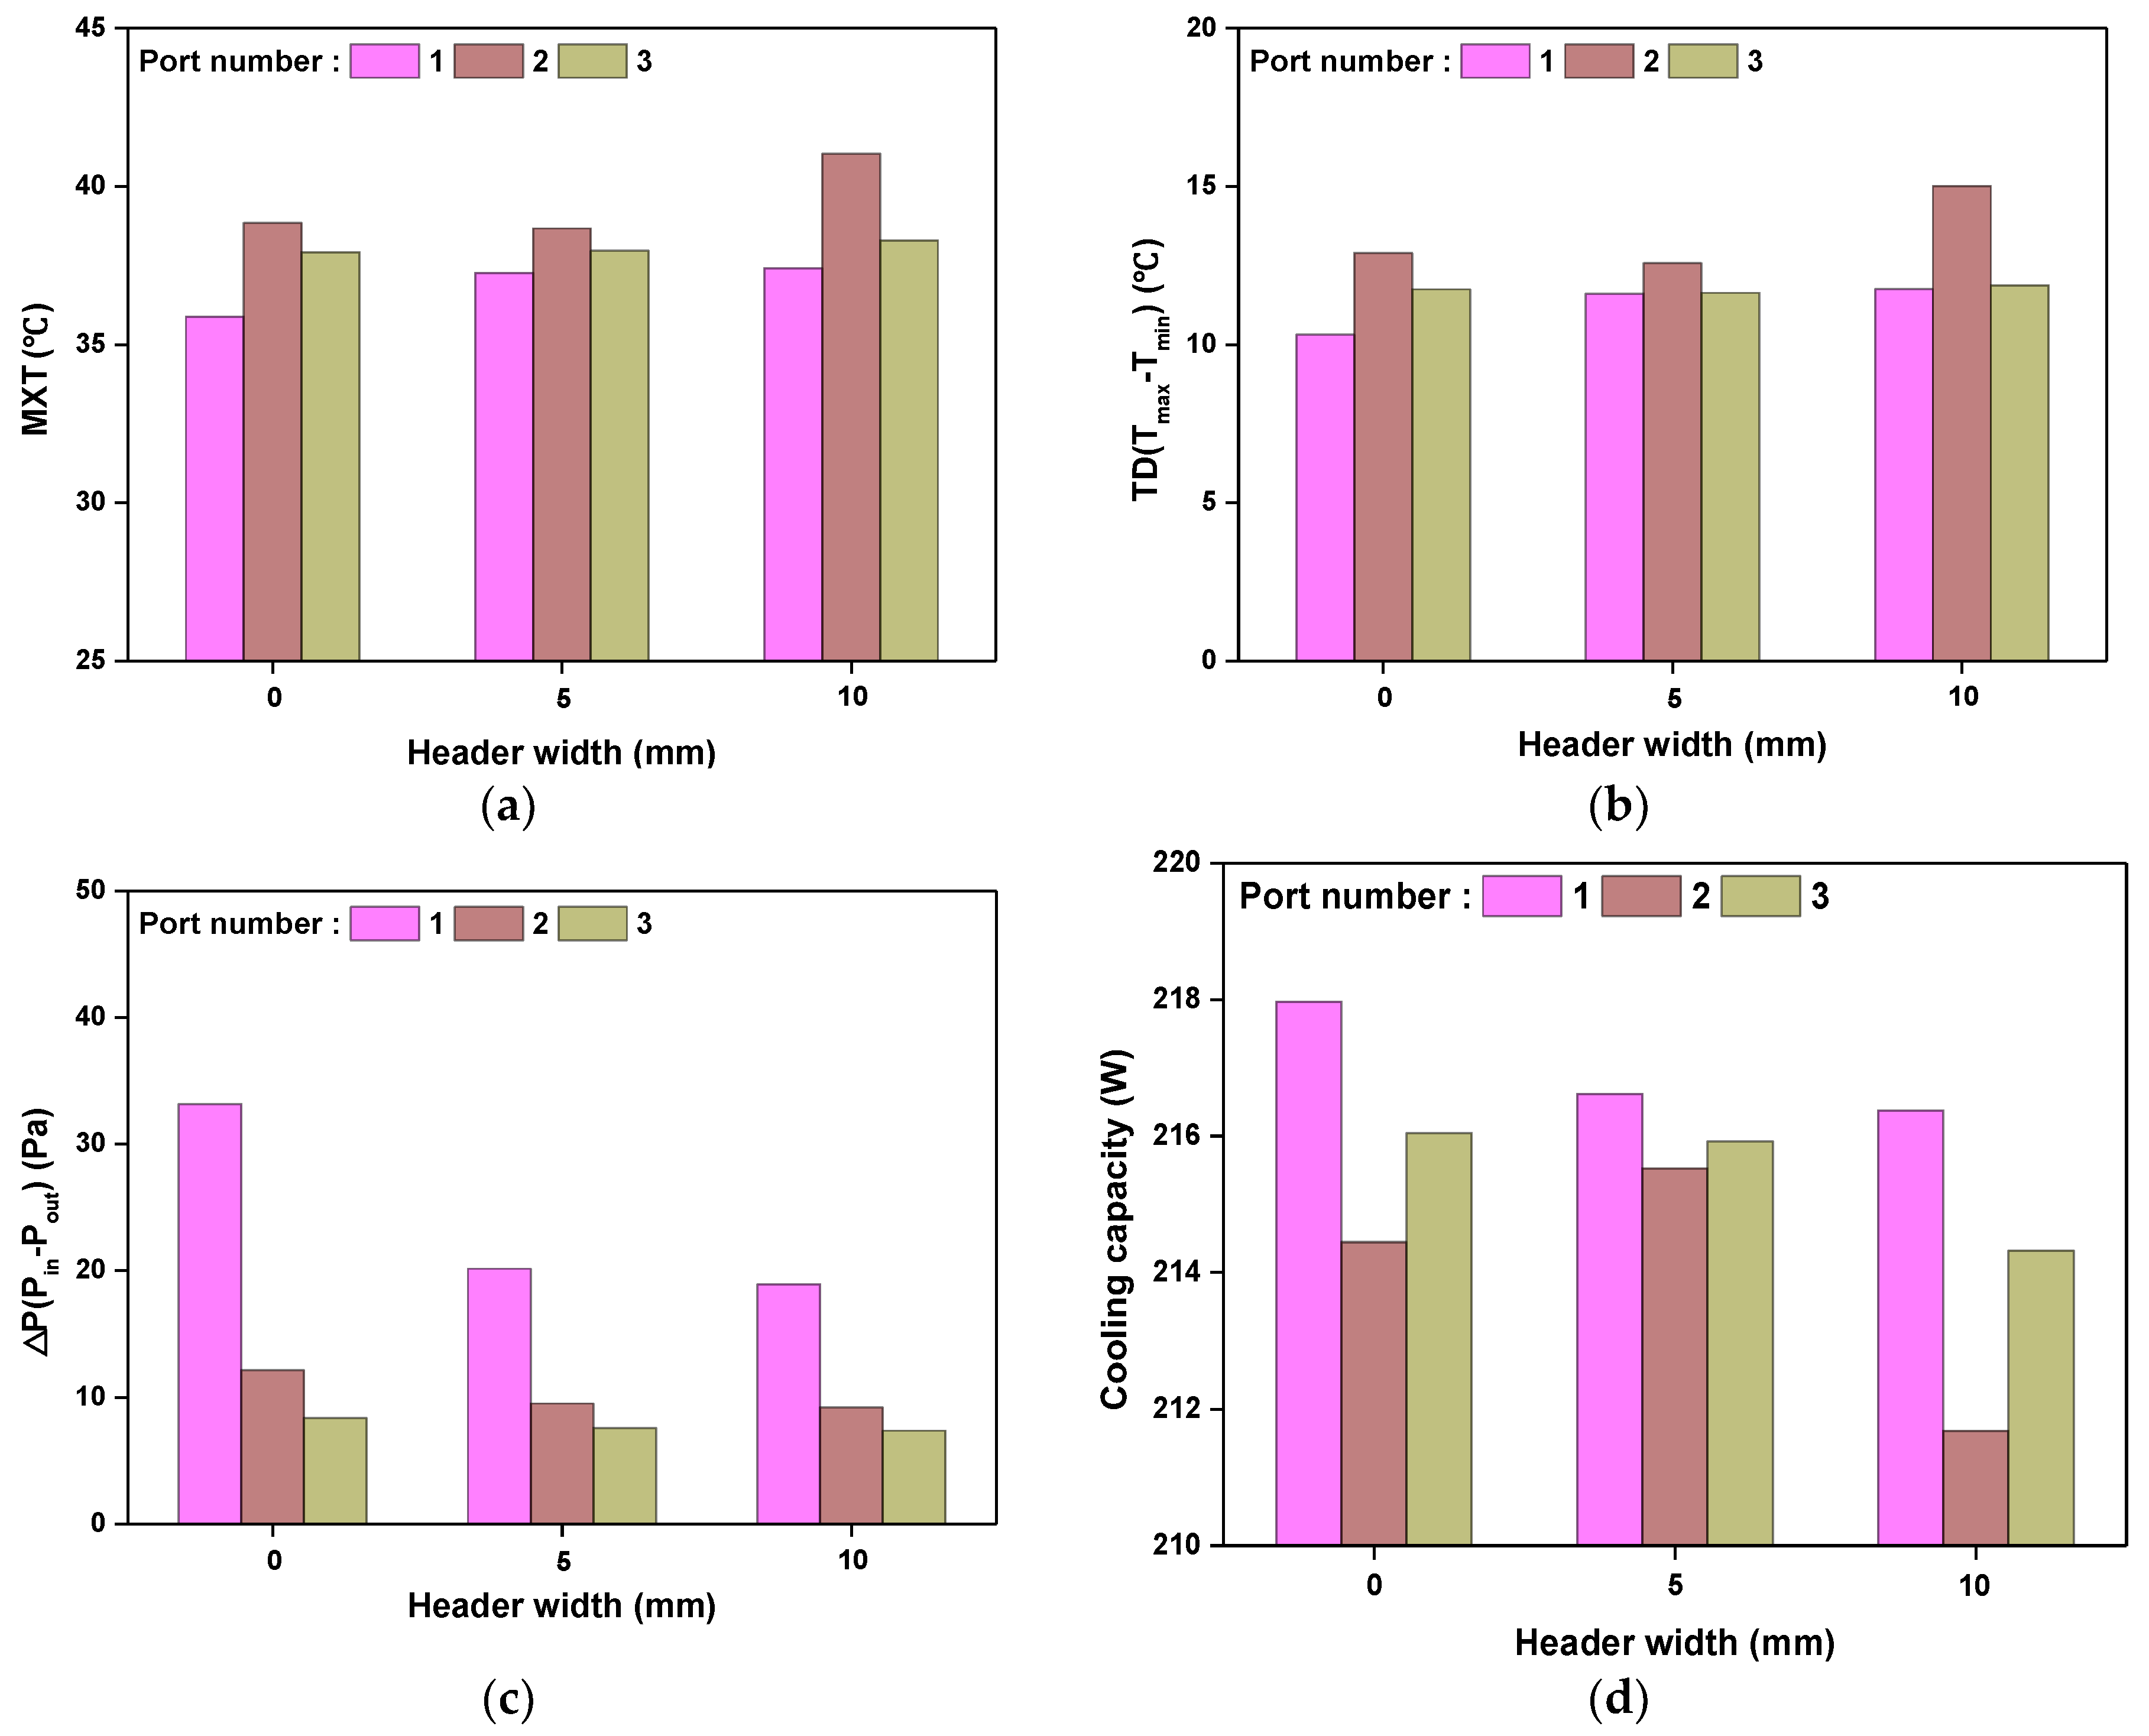
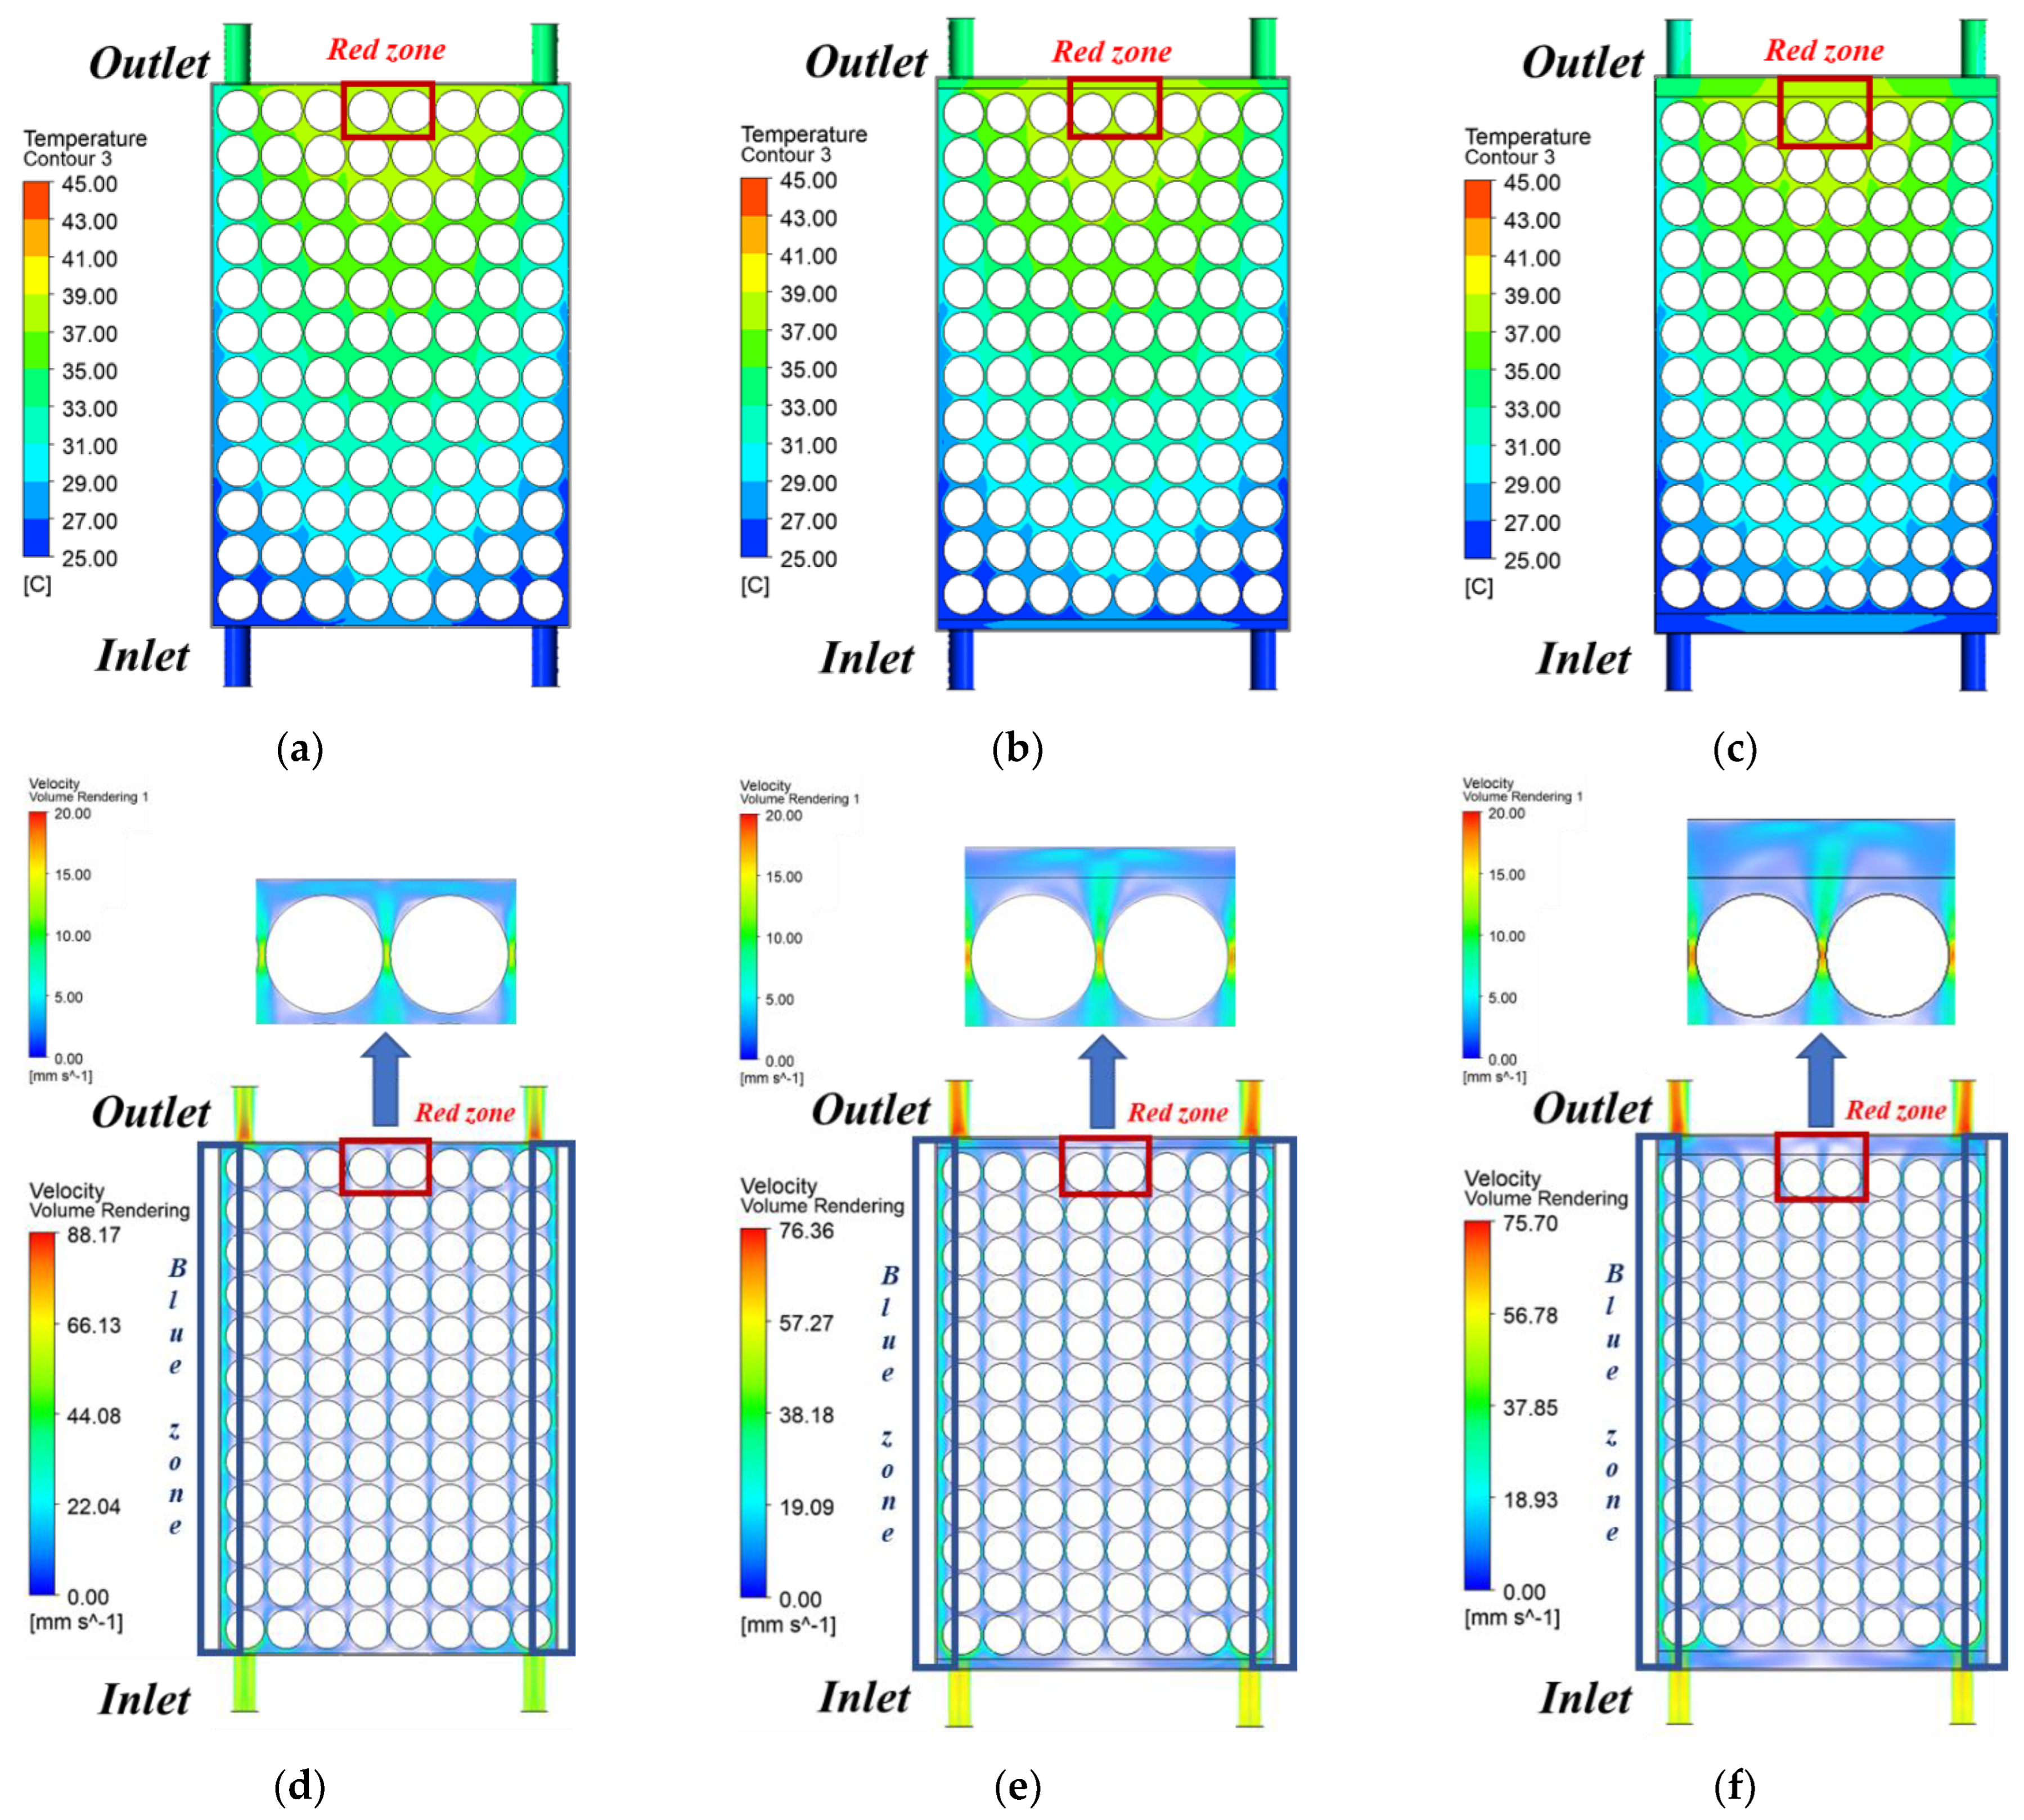
3.3. Cooling Performance according to the Number of Port and Header Width Using R134a

The cooling performance according to the number of inlet and outlet ports of the battery cooling block and the change in the width of the inlet and outlet headers was studied using R134a selected through the analysis results as the working fluid. The number of ports of the battery cooling block was changed to 1, 2, and 3, and the width of the inlet/outlet header was changed to 0 mm, 5 mm, and 10 mm (as shown in Figure 2) to perform the analysis. The results are shown in Figure 7. Figure 7a,b show the MXT of the battery and a TD between the batteries according to the change of width. In addition, Figure 7c,d show the pressure drop and cooling capacity of R134a in the battery cooling block. As the header width increased from 0 mm to 10 mm in a single port, the MXT of the battery and the TD between batteries were higher in the order of the models with header widths of 10 mm, 5 mm, and 0 mm, whereas the pressure drop of the battery cooling block and the cooling capacity showed the largest value in the order of header width 0 mm, 5 mm, and 10 mm. The pressure drop of the battery cooling block in a single port decreases to 10.2 mm/s, 9.19 mm/s, and 8.43 mm/s, respectively, when the header widths are 0 mm, 5 mm, and 10 mm, the maximum temperature difference between the batteries increases, while the pressure drop decreases to 33.1 Pa, 20.1 Pa, and 18.9 Pa, respectively. Thus, when the battery cooling block has a single port, the increase in the width of the inlet/outlet header has a negative effect on the battery thermal management. The best cooling performance was shown when the header width was 0 mm. In addition, when there are two ports, the MXT of the battery, the TD between batteries, and the cooling capacity of the battery cooling block were significantly higher in the order of 10 mm, 0 mm, and 5 mm. At the same time, the pressure drop was more significant in the order of 0 mm, 5 mm, and 10 mm. For a single port, the header width of 0 mm showed the best cooling performance, whereas for two ports, the header width of 5 mm showed the best cooling performance. With two ports and 0 mm header width, the cooling fluid does not flow in the center of the outlet and shows a dead zone where the cooling fluid stagnates. Battery cooling by increasing the number of headers is related to the fluid inflow characteristics according to the location of the header. In the battery cooling structure, the distance between the inlet and the battery is very close. Therefore, a smooth distribution of working fluid does not occur when the working fluid enters the cooling area. Therefore, the working fluid flows to the side with relatively little flow resistance, and the battery located in the center cannot be cooled sufficiently. Due to the difference in the number of ports, there is a difference in entering velocity from the inlet port to the battery cooling area. Therefore, the effect of reducing the flow resistance by the header width is different. As the number of ports increases, entering velocity is slow. The flow resistance through the batteries decreases and the flow of fluid into the center becomes smooth. Due to uniform flow velocity, the cooling performance increases. On the other hand, when the number of ports is two, the inlet port is located on the side. Therefore, the fluid flows smoothly due to the collision of the fluid flow in the center. When the header width of the cooling structure with 3 ports exceeds 5 mm, the flow resistance to the side is lower than the flow resistance in the center. Thus, the battery cooling performance is reduced due to the non-uniformity of the fluid flow distribution.
When the number of inlet/outlet ports is two, the flow phenomenon at the outlet side can be identified in Figure 8. Figure 8 shows the temperature and velocity distribution according to the change in header width in the battery cooling block with two ports. In header widths 0 mm, 5 mm, and 10 mm, the MXT of the battery all showed in the red zone of the outlet, and the temperatures were 39.0 °C, 38.7 °C, and 41.0 °C, respectively. At header widths 0 mm, 5 mm, and 10 mm, the velocity of R134a in the battery cooling block was 88.2 mm/s, 76.4 mm/s, and 75.7 mm/s, respectively. When header width is 0 mm, a space in the inlet and outlet is narrow, so the flow rate of cooling fluid flows along the wall of the blue zone is higher than that of an internal battery, so the fluid velocity on the wall is faster than in a case where a header width is 5 mm or 10 mm. This phenomenon has been verified in Figure 8D–F. These figures enlarged the velocity distribution of the red zone, showing the MXT of the battery. The maximum velocity in the red zone at header widths of 0 mm, 5 mm, and 10 mm were 15.3 mm/s, 18.8 mm/s, and 18.9 mm/s, respectively, which were much lower than the average velocity. As the header width increases from 0 mm to 5 mm, the maximum velocity of R134a in the battery cooling block decreases to 11.8 mm/s. Still, the maximum velocity in the red zone increases to 3.50 mm/s, so the cooling effect between the batteries increases. As a result, the MXT of the battery and the TD between the batteries decreased by 0.32 °C and 0.47 °C, respectively. However, when the header width increases from 5 mm to 10 mm, the maximum velocity of R134a in the battery cooling block decreases by 0.66 mm/s, and the maximum velocity of the red zone increases by 0.14 mm/s. This is because the inlet/outlet space increases due to an increase in header width, and a stagnation section at the rear surface of the battery increases due to a low velocity of R134a, so the MXT of the battery increases by 2.36 °C and 2.44 °C, respectively. In addition, the cooling capacity of the battery cooling block was decreased by 3.84 W, which adversely affected the battery thermal management. These results verified that a model with a header width of 5 mm showed the best cooling performance in a model with two ports of the battery cooling block. A model with two ports showed a better maintenance cost because of a smaller pressure drop compared to a model with a single port, but a model with two ports and a battery with a maximum temperature difference showed a smaller cooling capacity in the same header width than a model with a single port and three ports.
When the number of ports in the battery cooling block is three and the header width increases from 0 to 10 mm, the MXT of the battery is higher in the order of the models with header widths of 10 mm, 5 mm, and 0 mm, and the TD between the batteries is 10 mm, 0 mm and 5 mm model showed the highest temperature, and the pressure drop and cooling capacity of the battery cooling block showed the largest values in the order of 0 mm, 5 mm, and 10 mm models. As the header width increased from 0 mm to 5 mm, the MXT of the battery increased by 0.03 °C, while the cooling capacity decreased by 0.12 W, which had a negative effect on the battery performance. However, the TD and pressure drop between the batteries was 0.11 °C and 0.79 Pa decreased, showing excellent cooling performance. This is because, as illustrated in Figure 8, the increase in header width from 0 mm to 5 mm resolves the flow of fluid that has been stagnant at the center of the outlet and reduces the TD and pressure drop between batteries, thereby having a positive effect on BTMS. On the other hand, as the header width increases from 5 mm to 10 mm, the MXT of the battery and the TD between the batteries increase by 0.33 °C and 0.24 °C, and the cooling capacity of the battery cooling block decreases by 1.60 W, which degrades the cooling performance. As a result, it was found to have an adverse effect on battery thermal management. A pressure drop of the battery cooling block decreased by 0.2 Pa from 7.57 Pa, but as the MXT of the battery and the TD between the batteries increases, and the cooling capacity decreases, under the condition of having three ports, a model with a header width of 10 mm is relatively inefficient, and a header width of 5 mm having three ports is the most effective model for the battery thermal management. As a result of analysis according to various condition changes, the model with the best battery cooling performance was found to have a header width of 0 mm for a single port and a header width of 5 mm for three ports, and when comparing the performance under two conditions, the MXT of the battery and the pressure drops of the battery cooling block was 35.9 °C, 33.1 Pa, and 37.9 °C, 7.57 Pa, respectively. In other words, under the condition of having a single port, the MXT of the battery was lower than in the condition of having three ports, but the pressure drop of the battery cooling block increased by approximately 4.38 times In both cases, a battery cooling block with a header width of 5 mm was selected as the optimal model considering a pressure drop that significantly affects maintenance cost, because the MXT of the battery is maintained under a safe operating temperature, which was below 40 °C. Based on the selected model, the battery temperature and cooling performance were compared depending on the change of the working fluid flow rate under the standard conditions of 25 °C and summer conditions of 35 °C, and the flow rate conditions were analyzed to maintain the safe operation management temperature of the battery in summer.

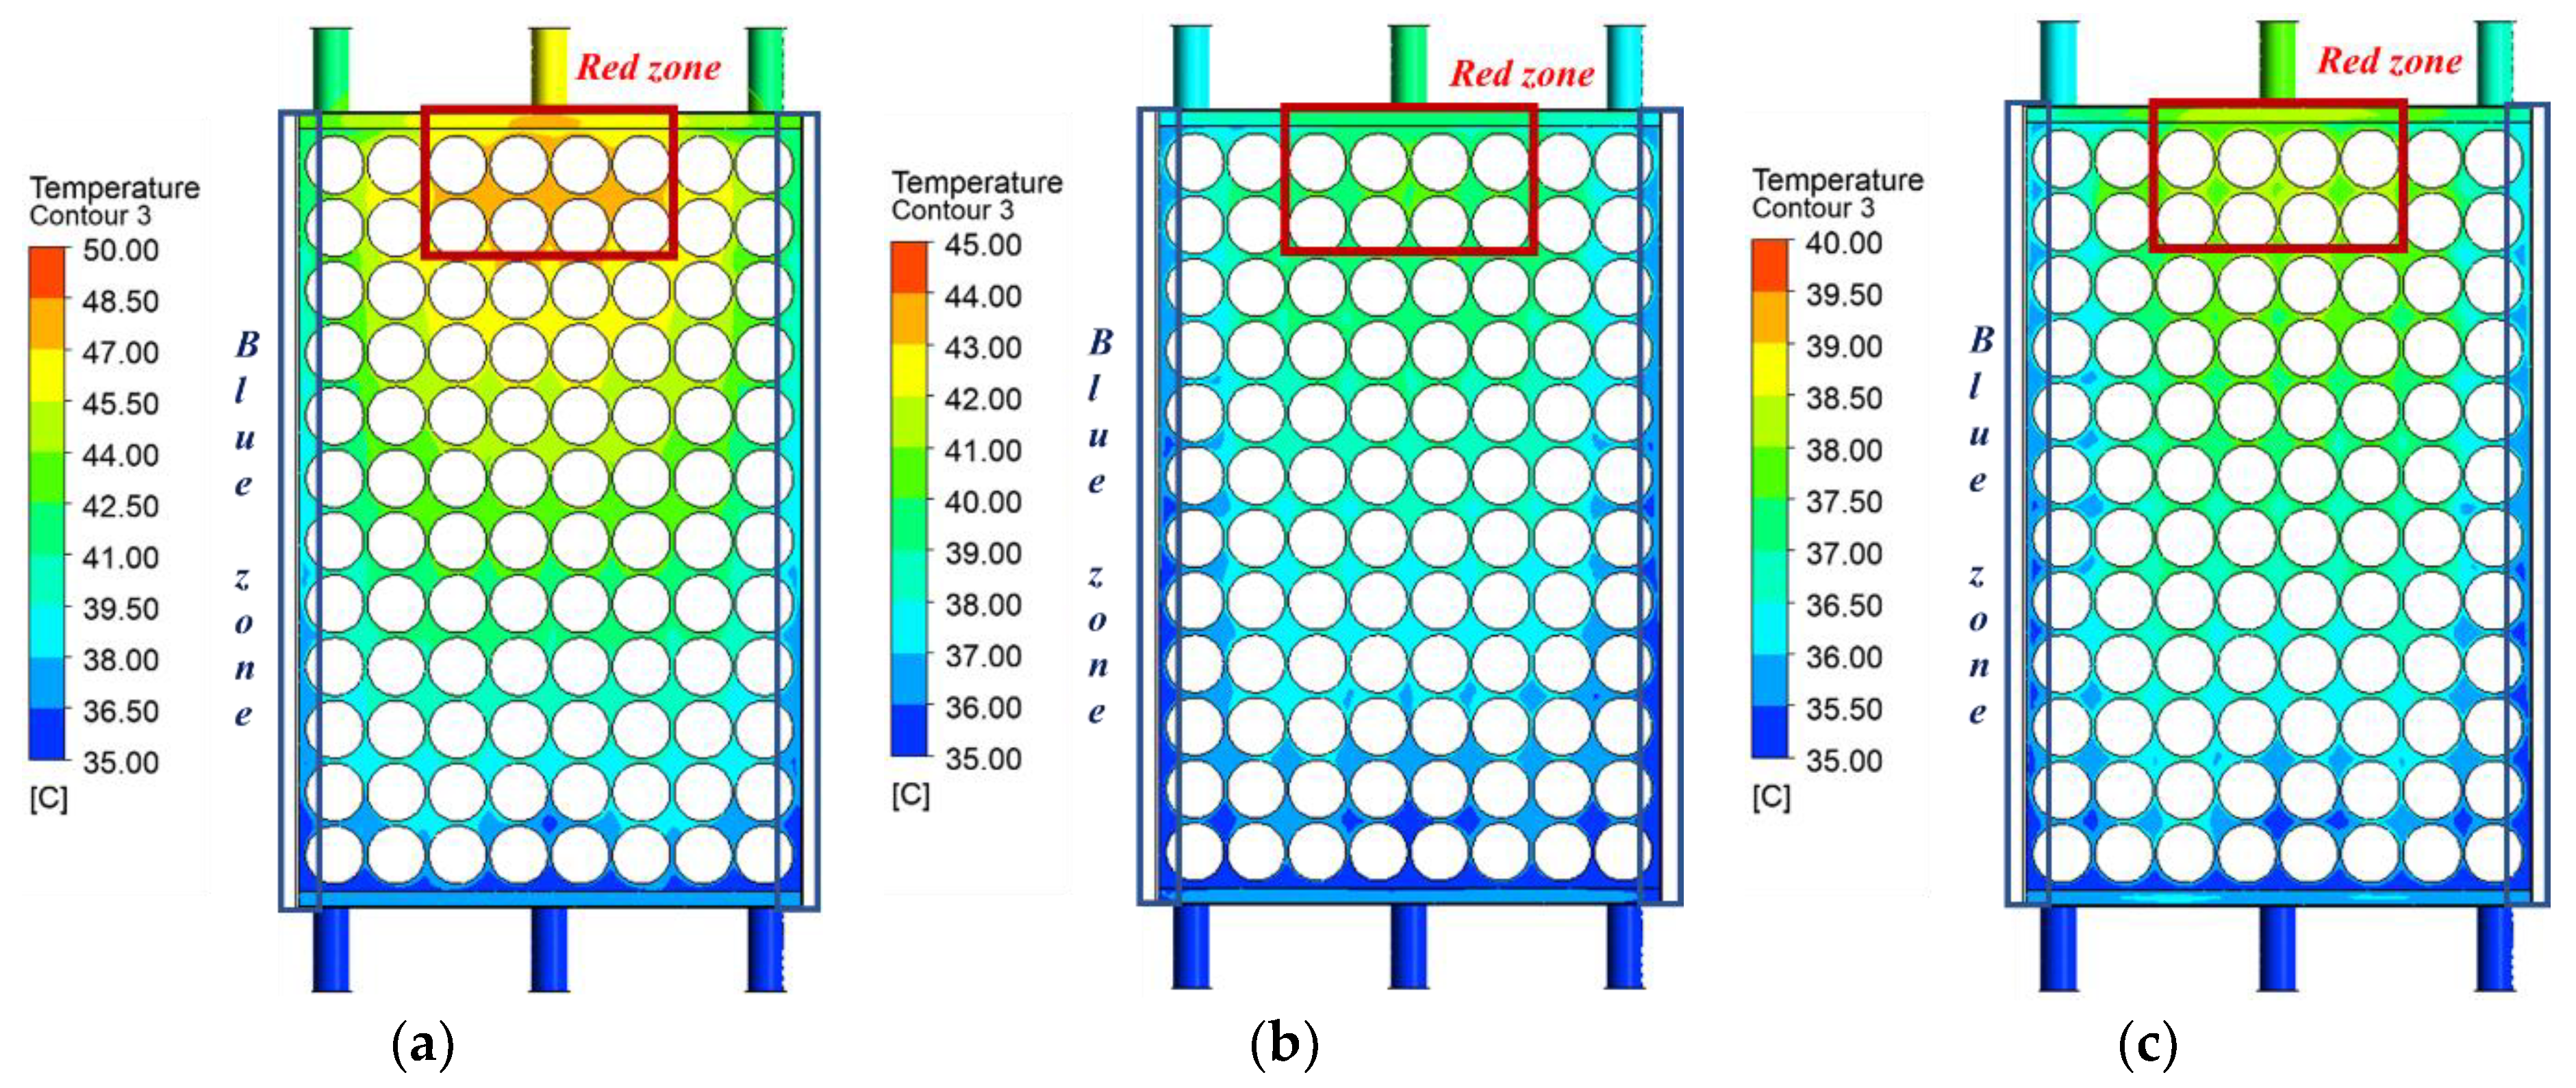
3.4. Comparison of Cooling Performance according to the Flow Rate of R134a under Standard and Summer Conditions

This study selected R134a as the working fluid through analysis according to changes in the working fluid, number of inlet and outlet ports, and header width. It was verified that a model with three ports of battery cooling block and 5 mm header width had the best cooling performance. The analysis was performed assuming that the initial temperature of the battery cooling block and inlet temperature of the working fluid, and the outside air temperature are 25 °C and 35 °C, respectively, to compare the battery cooling performance under standard and summer conditions. In addition, by changing the flow rate of R134a, which is the working fluid, the flow rate of the working fluid to maintain the MXT of the battery, which is the safe operation management temperature of the battery, 40 °C, and the TD between the batteries of 5 °C or less were verified. Figure 9 shows the comparison of cooling performance according to the flow rate change of R134a in the model with three inlet and outlet ports. Figure 9a shows the MXT of the battery according to the discharging time under standard and summer conditions. When the flow rate of R134a was 1, 3, and 5 lpm under standard and summer conditions, the MXT of the battery at 30 min of discharging time was 38.0 °C, 30.5 °C, 28.7 °C, and 48.0 °C, 40.5 °C, and 38.8 °C, respectively. In the case of standard conditions, the MXT of the battery was below the safe operating temperature of 40 °C under all flow conditions, indicating stable performance for the battery thermal management. However, in summer conditions, the MXT of the battery was 40 °C or higher at 1 lpm and 3 lpm except for 5 lpm, confirming that the battery cooling system was not suitable for thermal management. Figure 9b shows the MXT of the battery and a TD between batteries according to outdoor air conditions. When the discharging time reaches 30 min, and the flow rate of R134a is 1 lpm, 3 lpm, and 5 lpm under standard and summer conditions, the TD between the batteries was 11.6 °C, 4.91 °C, 3.28 °C, and 11.6 °C, 11.6 °C, 4.85 °C, 3.27 °C, respectively. Depending on the change in the outdoor air conditions, the variation in the TD between batteries at 3 lpm flow rate of the same working fluid was at the maximum of 0.06 °C. In addition, at 1 lpm, the TD between batteries in both standard and summer conditions was 6.63 °C and 6.61 °C, which is significantly higher than 5 °C, verifying that it is not suitable for battery thermal management. However, under the condition that the flow rate of R134a is 3 lpm or more, the TD between batteries is maintained at 5 °C or lower, verifying that the flow rate condition is suitable for the battery thermal management.
Figure 9c shows the pressure drop of the battery cooling block according to the change in the outdoor air condition. When the discharge time reached 30 min, as the flow rate of R134a increased to 1 lpm, 3 lpm, and 5 lpm under standard and summer conditions, the pressure drop of the battery cooling block was 7.57 Pa, 45.5 Pa, 124 Pa, and 6.82 Pa, 41.7 Pa, and 103 Pa, respectively, and the required power of the pump was 0.13 mW, 2.27 mW, 10.4 mW, and 0.11 mW, 2.09 mW, and 8.58 mW, respectively. When the flow rate of R134a was 1 lpm, 3 lpm, and 5 lpm, the difference in pressure drop of the battery cooling block was 0.75 Pa, 3.75 Pa, and 21.4 Pa as the ambient temperature changed from 25 °C to 35 °C. The pressure drop varies greatly depending on the change in ambient temperature because the density of R134a, which is directly proportional to the pressure drop, decreases as the temperature increases [45]. Therefore, an increase in the flow rate of working fluid leads to a pressure drop in the battery cooling block, which is proportional to an increase in the power required by the pump, so the flow rate of appropriate cooling fluid for cooling has to be controlled The outside temperature increases the inlet temperature of the battery cooling system. Accordingly, the viscosity of the working fluid decreases due to the increased temperature of the working fluid, and the pressure drop also decreases. However, it does not significantly affect the cooling performance of the battery cooling system. In Figure 9d, the cooling capacity of the battery cooling block according to the outdoor conditions is shown according to the change in the flow rate of R134a. When the discharging time reached 30 min, the cooling capacity of the battery cooling block was 215.9 W, 221.5 W, 222.8 W, and 215.9 W, 221.5 W, 222.8 W, as the flow rate increased to 1 lpm, 3 lpm, and 5 lpm under standard and summer conditions. This is because the outdoor temperature affects the temperature of the surface of the battery cooling structure, but does not significantly affect the temperature of the working fluid that affects cooling performance. Therefore, the cooling performance is not significantly reduced.
Figure 10 illustrates the temperature distribution of a battery module depending on a change in flow rate when applying summer outdoor conditions in a model where the number of ports of the battery cooling block is three and the header width is 5 mm. In the red zone of all flow bands, the battery showed a high temperature distribution, and the blue zone showed a relatively low temperature distribution compared to the red zone. The maximum velocity of R134a in the blue zone of the battery cooling block was 37.8 mm/s, 121 mm/s, and 220 mm/s when the flow rate was 1 lpm, 3 lpm, and 5 lpm, respectively, and the maximum velocity in the red zone was 25.9 mm/s, 75.4 mm/s, and 139 mm/s, respectively. When the R134a flow rate of the battery cooling block was 1 lpm, 3 lpm, 5 lpm, the blue zone showed a relatively low temperature distribution because the maximum velocity of the blue zone was 11.9 mm/s, 45.6 mm/s, and 81 mm/s faster than the maximum velocity of the red zone. In addition, as the flow rate of R134a increases from 1 lpm to 3 lpm and 5 lpm, the MXT of the battery decreases to 7.5 °C and 9.2 °C, respectively, confirming that an increase in the flow rate of R134a could significantly reduce the MXT of the battery. As a result of the analysis, according to the change in ambient temperature, the TD between batteries was 5 °C or higher under the 1 lpm condition of the flow rate of R134a, which was not suitable for the battery thermal management condition. Under the standard conditions of 25 °C, the MXT of the battery, which is a safe operation management temperature of the battery, and the difference between batteries were maintained at 40 °C and 5 °C or less, but as the pressure drop increases by about 2.74 times as the pressure increases from 3 lpm to 5 lpm, it is verified that 3 lpm is the most suitable condition for battery heat management under the standard conditions. However, in summer, unlike standard conditions, the MXT of the battery and the TD between the batteries were 40.5 °C and 4.91 °C, so the difference between batteries was maintained at 5 °C or lower, but the MXT was 40 °C or higher, exceeding the safe operation management temperature of the battery. Therefore, in the summer condition of 35 °C, the condition where the flow rate of R134a is 5 lpm was confirmed as a suitable condition for battery thermal management.

4. Conclusions

In this study, to examine the applicability of direct contact cooling, the cooling performance characteristics of the working fluids (silicone oil, transformer oil, HFE-6120, R134a) that can be recommended as direct contact cooling for the system with 96 batteries of 21700 type are analyzed and optimized. In addition, the effect on the number and arrangement of the inlet and outlet ports was investigated. Finally, the influence of outside air temperature on direct contact cooling was also studied. The main conclusions obtained through this study are as follows.
(1) The analysis result of the different working fluids in direct contact cooling with a single port verified that silicone oil and TO have a pressure drop and required power of about ten times more than R134a and HFE-6120. In addition, among the studied working fluids, HFE-6120 was found to have a cooling capacity of 4.47 W higher than that of R134a, but the required power was 0.8 mW smaller than that of HFE-6120, showing a small maintenance ratio. In addition, among the four fluids, R134a, which has advantages in terms of power requirement and price, has also been identified as a fluid for proper cooling because the HFE-6120 has a price 5.29 times higher than that of R134a.
(2) As a result of the analysis of cooling performance and pressure drop according to the number of ports and header width of the direct contact battery cooling block applied, R134a, the cooling performance was lower than that of one and three ports. Analysis showed that a model with excellent performance had a header width of 0 mm for one port and 5 mm for three ports. A model with a header width of 5 mm for three ports had an MXT of the battery of 2.08 °C. Still, the pressure drop was 4.38 times smaller, so it was verified that the battery cooling block had an excellent cooling performance.
(3) Analysis results were obtained according to the flow rate change of R134a applying the optimal model with respect to the number of ports and header width under standard and summer conditions. The MXT and the TD between the batteries were 30.5 °C, 4.91 °C, 28.7 °C, and 3.28 °C, respectively, confirming that it is an appropriate refrigerant flow condition for battery safety. However, as the battery pressure drop increases from 3 lpm to 5 lpm, it increases 2.47 times, so 3 lpm is more effective in terms of maintenance costs. In addition, the MXT of the battery at 1 lpm and 3 lpm, excluding 5 lpm, was 48.0 °C and 40.5 °C, respectively, in the summer condition of 35 °C in outdoor air, which was not suitable for battery thermal management. Therefore, it was verified that 5 lpm or more is a flow condition suitable for battery thermal management.

Author Contributions

Conceptualization, H.C. and D.S.; methodology J.H.; validation, D.S. and H.C.; formal analysis, M.K. and J.H.; investigation, M.K. and J.H.; resources, M.K. and D.S.; writing—original draft preparation, M.K. and H.C.; writing—review and editing, H.C.; supervision, H.C. All authors have read and agreed to the published version of the manuscript.

Funding

This work was supported by “Eco-friendly Car Sector in Development Technology” of the Korea Institute of Industrial Technology Evaluation and Management (KEIT), granted financial resource from the Ministry of Trade, Industry & Energy, Korea. (No. 20011906).

Data Availability Statement

Not applicable.

Conflicts of Interest

The authors declare no conflict of interest.

Nomenclature

BTMSBattery thermal management systemUVoltage (V)
cSpecific heat capacity (J/kg·°C)uVelocity, (m/s)
DDiameter (m)WPower
EESEngineering equation solver1S16P1 serial × 16 parallel
gGravitational acceleration (m/s2)
HHeight (m)Greek symbols
HVACHeating, ventilation, and air conditioningρDensity (kg/m3)
ICurrent (A)λThermal conductivity (W/m·°C)
LLength, (m)
MXTMaximum temperature of the battery (°C)Subscript
m ˙ Mass flow rate (kg/s)avgaverage
PPressure (Pa)baBattery
PCMPhase change materialininlet
Q ˙ Flow rate (m3/s)irirreversible heat
QHeat generation rate (W)maxMaximum
q ˙ Volumetric heat generation rate (W/m3)minMinimum
REquivalent internal resistance, ΩpumpPump
TTemperature (°C)rereversible heat
TDTemperature difference between batteries (°C)OCVOpen circuit voltage
TOTransformer oilwfWorking fluid
tTime (s)

References

  1. Chen, S.; Bao, N.; Garg, A.; Peng, X.; Gao, L. A Fast Charging–Cooling Coupled Scheduling Method for a Liquid Cooling-Based Thermal Management System for Lithium-Ion Batteries. Engineering 2021, 7, 1165–1176. [Google Scholar] [CrossRef]
  2. Amjad, S.; Neelakrishnan, S.; Rudramoorthy, R. Review of design considerations and technological challenges for successful development and deployment of plug-in hybrid electric vehicles. Renew. Sustain. Energy Rev. 2010, 14, 1104–1110. [Google Scholar] [CrossRef]
  3. Roe, C.; Feng, X.; White, G.; Li, R.; Wang, H.; Rui, X.; Li, C.; Zhang, F.; Null, V.; Parkes, M.; et al. Immersion cooling for lithium-ion batteries—A review. J. Power Sources 2022, 525, 231094. [Google Scholar] [CrossRef]
  4. Chitta, S.D.; Akkaldevi, C.; Jaidi, J.; Panchal, S.; Fowler, M.; Fraser, R. Comparison of lumped and 1D electrochemical models for prismatic 20Ah LiFePO4 battery sandwiched between minichannel cold-plates. Appl. Therm. Eng. 2021, 199, 117586. [Google Scholar] [CrossRef]
  5. Zhang, J.; Shao, D.; Jiang, L.; Zhang, G.; Wu, H.; Day, R.; Jiang, W. Advanced thermal management system driven by phase change materials for power lithium-ion batteries: A review. Renew. Sustain. Energy Rev. 2022, 159, 112207. [Google Scholar] [CrossRef]
  6. Gan, Y.; He, L.; Liang, J.; Tan, M.; Xiong, T.; Li, Y. A numerical study on the performance of a thermal management system for a battery pack with cylindrical cells based on heat pipes. Appl. Therm. Eng. 2020, 179, 115740. [Google Scholar] [CrossRef]
  7. Ramadass, P.; Haran, B.; White, R.; Popov, B.N. Capacity fade of Sony 18650 cells cycled at elevated temperatures: Part II. Capacity fade analysis. J. Power Sources 2002, 112, 614–620. [Google Scholar] [CrossRef] [Green Version]
  8. Huang, P.; Yao, C.; Mao, B.; Wang, Q.; Sun, J.; Bai, Z. The critical characteristics and transition process of lithium-ion battery thermal runaway. Energy 2020, 213, 119082. [Google Scholar] [CrossRef]
  9. Wang, S.; Takyi-Aninakwa, P.; Jin, S.; Yu, C.; Fernandez, C.; Stroe, D.I. An improved feedforward-long short-term memory modeling method for the whole-life-cycle state of charge prediction of lithium-ion batteries considering current-voltage-temperature variation. Energy 2022, 254, 124224. [Google Scholar] [CrossRef]
  10. Li, L.; Chen, X.; Yuan, Q.; Wang, T.; Ji, H.; Papović, S.; Raleva, K.; Pan, F.; Yang, T.; Li, J. Effects of Minor Mechanical Deformation on the Lifetime and Performance of Commercial 21700 lithium-Ion Battery. J. Electrochem. Soc. 2022, 169, 060544. [Google Scholar] [CrossRef]
  11. Sun, Y.; Lu, H.; Jin, Y. Experimental and Numerical Study on Mechanical Deformation Characteristics of Lithium Iron Phosphate Pouch Battery Modules under Overcharge Conditions. Energy Fuels 2021, 35, 15172–15184. [Google Scholar] [CrossRef]
  12. Akbarzadeh, M.; Kalogiannis, T.; Jaguemont, J.; Jin, L.; Behi, H.; Karimi, D.; Beheshti, H.; Van Mierlo, J.; Berecibar, M. A comparative study between air cooling and liquid cooling thermal management systems for a high-energy lithium-ion battery module. Appl. Therm. Eng. 2021, 198, 117503. [Google Scholar] [CrossRef]
  13. Egab, K.; Oudah, S.K. Thermal management analysis of li-ion battery-based on cooling system using dimples with air fins and perforated fins. Int. J. Therm. Sci. 2022, 171, 107200. [Google Scholar] [CrossRef]
  14. Xu, H.; Zhang, X.; Xiang, G.; Li, H. Optimization of liquid cooling and heat dissipation system of lithium-ion battery packs of automobile. Case Stud. Therm. Eng. 2021, 26, 101012. [Google Scholar] [CrossRef]
  15. Wang, N.; Li, C.; Li, W.; Chen, X.; Li, Y.; Qi, D. Heat dissipation optimization for a serpentine liquid cooling battery thermal management system: An application of surrogate assisted approach. J. Energy Storage 2021, 40, 102771. [Google Scholar] [CrossRef]
  16. Liu, H.; Ahmad, S.; Shi, Y.; Zhao, J. A parametric study of a hybrid battery thermal management system that couples PCM/copper foam composite with helical liquid channel cooling. Energy 2021, 231, 120869. [Google Scholar] [CrossRef]
  17. Xin, Q.; Xiao, J.; Yang, T.; Zhang, H.; Long, X. Thermal management of lithium-ion batteries under high ambient temperature and rapid discharging using composite PCM and liquid cooling. Appl. Therm. Eng. 2022, 210, 118230. [Google Scholar] [CrossRef]
  18. Jang, D.S.; Yun, S.; Hong, S.H.; Cho, W.; Kim, Y. Performance characteristics of a novel heat pipe-assisted liquid cooling system for the thermal management of lithium-ion batteries. Energy Convers. Manag. 2022, 251, 115001. [Google Scholar] [CrossRef]
  19. E, J.; Yi, F.; Li, W.; Zhang, B.; Zuo, H.; Wei, K.; Chen, J.; Zhu, H.; Zhu, H.; Deng, Y. Effect analysis on heat dissipation performance enhancement of a lithium-ion-battery pack with heat pipe for central and southern regions in China. Energy 2021, 226, 120336. [Google Scholar] [CrossRef]
  20. Zhao, G.; Wang, X.; Negnevitsky, M.; Zhang, H. A review of air-cooling battery thermal management systems for electric and hybrid electric vehicles. J. Power Sources 2021, 501, 230001. [Google Scholar] [CrossRef]
  21. Jouhara, H.; Delpech, B.; Bennett, R.; Chauhan, A.; Khordehgah, N.; Serey, N.; Lester, S.P. Heat pipe based battery thermal management: Evaluating the potential of two novel battery pack integrations. Int. J. Thermofluids 2021, 12, 100115. [Google Scholar] [CrossRef]
  22. Wang, X.; Liu, S.; Zhang, Y.; Lv, S.; Ni, H.; Deng, Y.; Yuan, Y. A Review of the Power Battery Thermal Management System with Different Cooling, Heating and Coupling System. Energies 2022, 15, 1963. [Google Scholar] [CrossRef]
  23. Shen, M.; Gao, Q. Structure design and effect analysis on refrigerant cooling enhancement of battery thermal management system for electric vehicles. J. Energy Storage 2020, 32, 101940. [Google Scholar] [CrossRef]
  24. Hong, S.H.; Jang, D.S.; Park, S.; Yun, S.; Kim, Y. Thermal performance of direct two-phase refrigerant cooling for lithium-ion batteries in electric vehicles. Appl. Therm. Eng. 2020, 173, 115213. [Google Scholar] [CrossRef]
  25. Tan, X.; Lyu, P.; Fan, Y.; Rao, J.; Ouyang, K. Numerical investigation of the direct liquid cooling of a fast-charging lithium-ion battery pack in hydrofluoroether. Appl. Therm. Eng. 2021, 196, 117279. [Google Scholar] [CrossRef]
  26. Xie, J.; Wang, Y.; He, S.; Zhang, G.; Liu, X.; Yang, X. A simple cooling structure with precisely-tailored liquid cooling plate for thermal management of large battery module. Appl. Therm. Eng. 2022, 212, 118575. [Google Scholar] [CrossRef]
  27. Chen, S.; Zhang, G.; Zhu, J.; Feng, X.; Wei, X.; Ouyang, M.; Dai, H. Multi-objective optimization design and experimental investigation for a parallel liquid cooling-based Lithium-ion battery module under fast charging. Appl. Therm. Eng. 2022, 211, 118503. [Google Scholar] [CrossRef]
  28. Lu, Y.; Wang, J.; Liu, F.; Liu, Y.; Wang, F.; Yang, N.; Lu, D.; Jia, Y. Performance optimization of Tesla valve-type channel for cooling lithium-ion batteries. Appl. Therm. Eng. 2022, 212, 118583. [Google Scholar] [CrossRef]
  29. Wu, S.; Lao, L.; Wu, L.; Liu, L.; Lin, C.; Zhang, Q. Effect analysis on integration efficiency and safety performance of a battery thermal management system based on direct contact liquid cooling. Appl. Therm. Eng. 2022, 201, 117788. [Google Scholar] [CrossRef]
  30. Liu, J.; Fan, Y.; Xie, Q. Feasibility study of a novel oil-immersed battery cooling system: Experiments and theoretical analysis. Appl. Therm. Eng. 2022, 208, 118251. [Google Scholar] [CrossRef]
  31. Al-Zareer, M.; Dincer, I.; Rosen, M.A. Heat and mass transfer modeling and assessment of a new battery cooling system. Int. J. Heat Mass Transf. 2018, 126, 765–778. [Google Scholar] [CrossRef]
  32. Fluent, I. Fluent 2021 user’s guide. Fluent Solut. 2021. [Google Scholar]
  33. Sheng, L.; Zhang, Z.; Su, L.; Zhang, H.; Zhang, H.; Li, K.; Fang, Y.; Ye, W. A calibration calorimetry method to investigate the thermal characteristics of a cylindrical lithium-ion battery. Int. J. Therm. Sci. 2021, 165, 106891. [Google Scholar] [CrossRef]
  34. Yataganbaba, A.; Kilicarslan, A.; Kurtbaş, İ. Exergy analysis of R1234yf and R1234ze as R134a replacements in a two evaporator vapour compression refrigeration system. Int. J. Refrig. 2015, 60, 26–37. [Google Scholar] [CrossRef]
  35. A/C Pro Certified Auto Air Conditioner R-134a Refrigerant, 12 oz, 301CA. Available online: Walmart.com (accessed on 17 August 2022).
  36. Silicone oil Dow Corning Corporation 200 fluid, 60,000cSt 25 °C 63148-62-9. Available online: Sigmaaldrich.com (accessed on 20 September 2022).
  37. Sigma Aldrich Fine Chemicals Biosciences Novec 7000 Engineered Fluid, 375-03-1. Fisher Scientific: Waltham, MA, USA. Available online: Fishersci.com (accessed on 17 August 2022).
  38. HD TO4 NO.10 18L|Transmission Oil. Sinopec: Sydney, NSW, Australia. Available online: Sinopeconline.com (accessed on 20 September 2022).
  39. Sheng, L.; Zhang, H.; Zhang, H.; Su, L.; Zhang, Z. Lightweight liquid cooling based thermal management to a prismatic hard-cased lithium-ion battery. Int. J. Heat Mass Transf. 2021, 170, 120998. [Google Scholar] [CrossRef]
  40. Lai, Y.; Wu, W.; Chen, K.; Wang, S.; Xin, C. A compact and lightweight liquid-cooled thermal management solution for cylindrical lithium-ion power battery pack. Int. J. Heat Mass Transf. 2019, 144, 118581. [Google Scholar] [CrossRef]
  41. Bernardi, D.; Pawlikowski, E.; Newman, J. A general energy balance for battery systems. J. Electrochem. Soc. 1985, 132, 5–12. [Google Scholar] [CrossRef] [Green Version]
  42. Ghahfarokhi, P.S.; Kallaste, A.; Vaimann, T.; Rassolkin, A.; Belahcen, A. Determination of natural convection heat transfer coefficient over the fin side of a coil system. Int. J. Heat Mass Transf. 2018, 126, 677–682. [Google Scholar] [CrossRef]
  43. Shin, Y.; Im, G.; Yu, K.; Cho, H. Experimental study on the change in driver’s physiological signals in automobile HVAC system under Full load condition. Appl. Therm. Eng. 2017, 112, 1213–1222. [Google Scholar] [CrossRef]
  44. Dong, J.; Lan, H.; Liu, Y.; Wang, X.; Yu, C. Indoor environment of nearly zero energy residential buildings with conventional air conditioning in hot-summer and cold-winter zone. Energy Built Environ. 2022, 3, 129–138. [Google Scholar] [CrossRef]
  45. Huang, Z.; Li, G.; Tian, S.; Song, X.; Sheng, M.; Shah, S. Operation Parameters Calculation. Abras. Water Jet Perforation Multi-Stage Fract. 2018, 191–203. [Google Scholar] [CrossRef]
Figure 1. Modeling of the battery module according to the port number: (a) Port = 1; (b) Port = 2; (c) Port = 3; (d) Fluid volume at port 3.
Batteries 08 00195 g001
Figure 2. Modeling of the battery module according to the changing header width: (a) Header width = 0 mm; (b) Header width = 5 mm.
Batteries 08 00195 g002
Figure 3. Grid independence according to mesh elements.
Batteries 08 00195 g003
Figure 4. Verification experimental setup: (a) Schematic diagram of experimental setup; (b) 1S16P battery module.
Batteries 08 00195 g004
Figure 5. Battery temperature variation under 2 C-rate discharge condition: (a) Average temperature according to time; (b) Comparison of MXT according to time between experimental and simulation results.
Batteries 08 00195 g005
Figure 6. Variation of cooling performance according to working fluids: (a) MXT of battery according to time; (b) TD of battery according to time; (c) Pressure drop and pump power for different working fluids; (d) Outlet temperature and cooling capacity for different working fluids.
Batteries 08 00195 g006
Figure 7. Comparison of cooling performance according to header width: (a) MXT of battery for different header width; (b) TD of battery for different header width; (c) Pressure drop for different header width; (d) Cooling capacity for different header width.
Batteries 08 00195 g007
Figure 8. Temperature and velocity distribution according to header width at the battery cooling block with port 2: (a) Temperature contour at 0 mm; (b) Temperature contour at 5 mm; (c) Temperature contour at 10 mm; (d) Velocity contour at 0 mm; (e) Velocity contour at 5 mm; (f) Velocity contour at 10 mm.
Batteries 08 00195 g008
Figure 9. Comparison of cooling performance according to flow rate under 25 °C and 35 °C outdoor air conditions: (a) MXT of the battery according to time; (b) TD of the battery according to time; (c) Pressure drop for different ambient temperatures; (d) Cooling capacity for different ambient temperatures.
Batteries 08 00195 g009
Figure 10. Temperature variation of battery module according to the flow rate under 35 °C outdoor air condition: (a) 1 lpm; (b) 3 lpm; (c) 5 lpm.
Batteries 08 00195 g010
Table 1. Thermo-physical properties of the battery module [33].
ParametersBatteryBattery HolderBattery Cooling Block
Density (kg m−3)2525.512002719
Specific heat (J kg−1 °C−1) 1040.5 + 2.29 × T1250871
Thermal conductivity (W m−1 °C−1)23.60.2202.4
Table 2. Thermo-physical properties and cost of the working fluid [25,29,30,35,36,37,38].
ParametersSilicone OilTOHFE-6120R134a
Density (kg m−3)9658201600(−1.20 × 10⁻²) × T2 − 3.28 × T + 1297.94
Specific heat (J kg−1 °C−1)249025301170(3.62 × 10⁻²) × T2 + 2.52 × T + 1336.14
Thermal conductivity (W m−1 °C−1)0.160.38750.23(−1.42 × 10⁻⁶) × T2 − (4.29 × 10⁻⁴) × T + 0.10
Viscosity (Pa s)500.00820.0019(1.83 × 10⁻⁸) × T2 + (−3.40 × 10⁻⁶) × T + (2.69 × 10⁻⁴)
Cost ($ kg−1)24581.6821741
Publisher’s Note: MDPI stays neutral with regard to jurisdictional claims in published maps and institutional affiliations.

