Article

Development of a Data-Driven Method for Online Battery Remaining-Useful-Life Prediction

by
Sebastian Matthias Hell
and
Chong Dae Kim
*
Technische Hochschule Köln, 50679 Köln, Germany
*
Author to whom correspondence should be addressed.
Batteries 2022, 8(10), 192; https://doi.org/10.3390/batteries8100192
Submission received: 15 September 2022 / Revised: 8 October 2022 / Accepted: 14 October 2022 / Published: 18 October 2022

Abstract

:
Remaining-useful-life (RUL) prediction of Li-ion batteries is used to provide an early indication of the expected lifetime of the battery, thereby reducing the risk of failure and increasing safety. In this paper, a detailed method is presented to make long-term predictions for the RUL based on a combination of gated recurrent unit neural network (GRU NN) and soft-sensing method. Firstly, an indirect health indicator (HI) was extracted from the charging processes using a soft-sensing method that can accurately describe power degradation instead of capacity. Then, a GRU NN with a sliding window was applied to learn the long-term performance development. The method also uses a dropout and early stopping method to prevent overfitting. To build the models and validate the effectiveness of the proposed method, a real-world NASA battery data set with various battery measurements was used. The results show that the method can produce a long-term and accurate RUL prediction at each position of the degradation progression based on several historical battery data sets.

1. Introduction

Li-ion batteries have become an essential part of our everyday lives. Due to their low cost, high energy density and long service life, they are already an essential component of cell phones, laptops and electric cars [1]. In particular, the current progressive political developments away from combustion engines in the direction of electric mobility increasingly support this spread of batteries [2], so that energy-efficient and at the same time safe use of these energy storage devices is essential for an environmentally friendly, resource-saving and economic future. The lifetime of these batteries is not unlimited, because conductivity decreases with repeated charging and discharging processes. As soon as the battery falls below its end-of-life (EOL) threshold, the risk of battery failure or even battery fire increases [3]. By monitoring the condition and predicting the expected EOL of the battery, the risk of battery failure can be reduced, thereby increasing safety [4]. On the other hand, replacing the battery too early leads to a waste of valuable resources, which contradicts the claim of efficient use. Therefore, a precise prognosis is of essential importance.
To predict the remaining-useful-life (RUL) of Li-ion batteries, a differentiation is usually made between model-based and data-driven methods. For the application of model-based methods, detailed prior knowledge of the respective battery is required [5]. Mainly, an electrochemical model is used, which is represented by differentiated mathematical models in order to be able to represent the internal chemical process reactions [6]. Model-internal variables can be represented precisely with this method, whereby a high accuracy in the prediction can be achieved [6]. However, these models are highly complex and the battery has to be disassembled for the parameterization of the electrochemical model [7], which makes them difficult to integrate into real applications [8]. In contrast, data-driven methods do not focus on the complex internal electrochemical reactions and failure mechanisms of the battery [9]. Rather, the internal behavior of a battery is considered as a black box to model and simplify electrochemical dynamics. For this purpose, a model is generally created first and then it is refined and optimized using plenty of historical data [10] so that the model can learn battery performance degradation behavior directly from the monitoring data.
In recent years, the data-driven method and in particular the AI-based methods have attracted much attention in the research area of RUL prediction for Li-ion batteries. These methods can be divided into the meta-areas of Neural Networks [11,12,13], Support Vector Machines [14,15,16] and Deep Learning. One widely used method for predicting time-series data is the Recurrent Neural Network (RNN). However, this method tends to explode and vanish gradients due to its structure. Therefore, the RNN-based and improved variant, the Long-Short-Term-Memory Neural Network (LSTM NN) is often used. For example, Zhang et al. presented an LSTM NN that predicts the RUL based on historical capacity data [17]. Park et al. introduced an LSTM model using multi-channel charging profiles. However, the prediction interval is set to a fixed value [18]. LSTMs are well suited to store and transfer information from long data sequences, but LSTMs require a large number of parameters for training.
To overcome this issue, the Gated Recurrent Unit Neural Network (GRU NN) was developed. This method is similar to the LSTM but has a simplified structure and fewer parameters, making it especially suitable for online RUL prediction. Previous works with this approach are mostly based only on using classical performance indicators such as the capacity to predict the RUL. However, these direct health indicators are difficult to measure in real applications, because the particular battery must be separated from the original application [19]. To overcome this challenge, indirect health indicators (HI) were used, which can be obtained from the monitoring sensor data to represent the direct HIs. The authors of [20] use the voltage-measured data of the discharge process for this approach. In real applications, discharges mostly correspond to dynamic behavior that can lead to large prediction errors. In contrast, the use of charging data is more static and thus more controllable, which can lead to more reliable results. An open aspect in many of these works is the detailed design and algorithm for the longer-term RUL prediction.
Therefore, this paper proposes a detailed described RUL method from the combination of soft sensing and deep learning. To avoid difficulties in measuring HI directly, an indirect health indicator is extracted from the monitoring data. In addition, a GRU NN is presented using the sliding window method and detailed procedure. The major contributions of this paper are listed as follows:
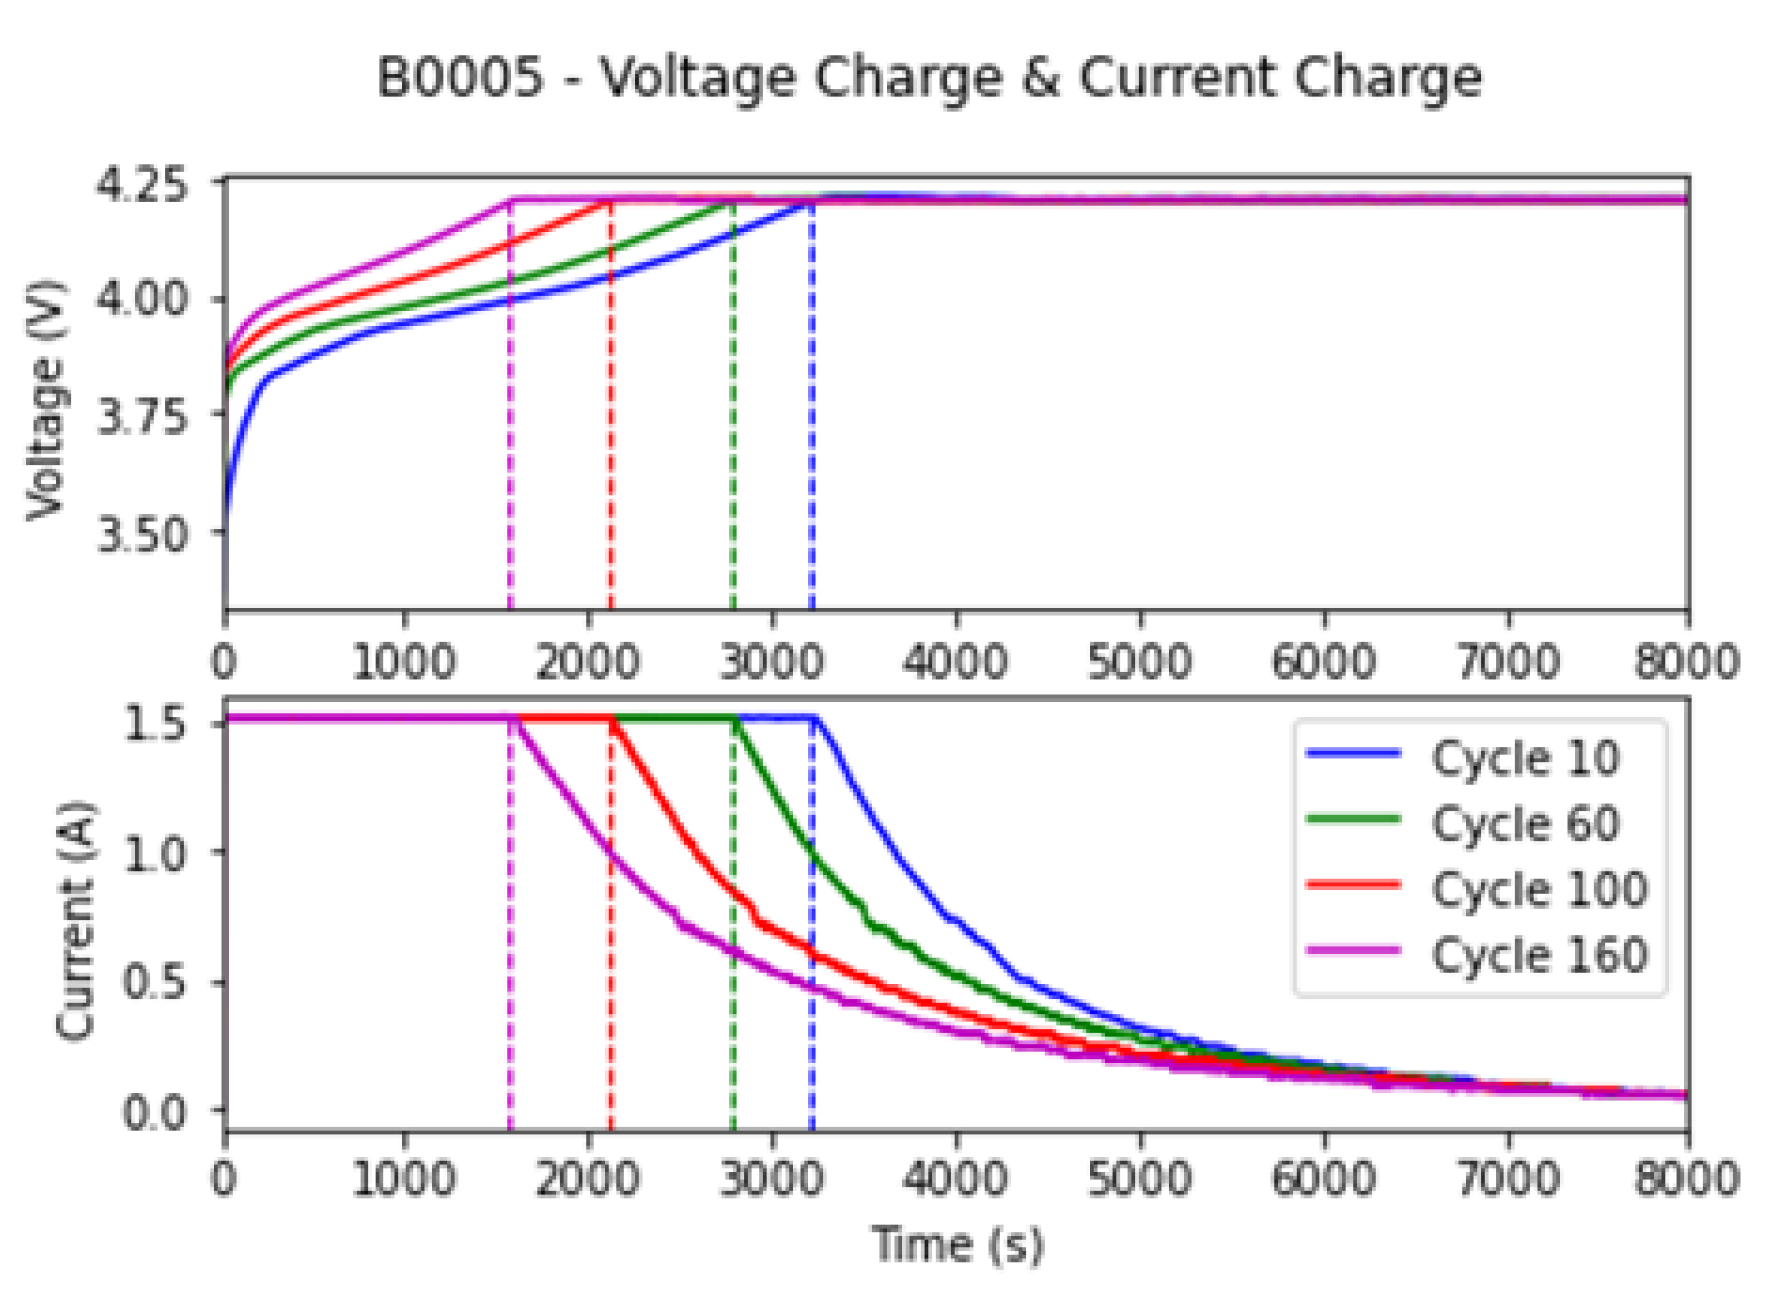
  • A specific indirect HI is extracted from the charge monitoring data. A correlation analysis is used to show that these indirect HIs accurately reflect the capacity. Therefore, complicated measurements or elaborate calculations are no longer needed.
  • The combination of soft-sensing and GRU NN with sliding window produces a model capable of both accurate state-of-health estimation and reliable long-term RUL prediction using historical data sets.
  • Dropout and early stopping methods were also used to prevent overfitting.
  • The effectiveness of the method is validated and verified by the real-world NASA data set.
The structure of this paper is as follows: Section 2 shows the general structure of GRU NN. Section 3 presents data preparation and the construction of indirect HI. The algorithm and the approach of the GRU NN model are proposed in Section 4. Section 5 includes the results and discussion and Section 6 represents the conclusion.

2. Gated Recurrent Unit Neural Network

A GRU NN is a neural network based on Gated Recurrent Unit and is a further development of RNN to overcome the exploding and vanishing gradient problem in long-term dependencies. The structure of the GRU NN is also a simplified version of the LSTM since no cell state is needed anymore. The hidden cell state takes over the data transfer tasks.
The output of the GRU NN depends on the parameters update gate and reset gate. The update gate decides which new information should be added and which information should be dropped. The reset gate decides which and how much information from the past should be forgotten. The general architecture of a GRU NN is shown in Figure 1. Moreover, it is described by the following equations [21]:
z t = σ ( W z · [ h t 1 ; x t ] + b z )
r t = σ ( W r · [ h t 1 ; x t ] + b r )
h ˜ t = t a n h ( W h · [ ( r t h t 1 ) ; x t ] + b h )
h t = ( 1 z t ) h t 1 + z t h ˜ t
where z t represents the update gate and r t the reset gate. Both gates depend on the current state x t and hidden state h t 1 at the previous time. For the output of the hidden state h t at time t, the candidate state h ˜ t is also required. W z , W r , W h are weight matrices and b z , b r , b h indicates the biases for the update gate, candidate state and reset gate. The symbol shows an element-wise multiplication, σ is the sigmoid function and ; indicates a vector-concatenation operation.

3. Data Preparation

3.1. Test Data

The data used here were derived from a battery data set from NASA Ames Research Center [22]. Four Li-ion batteries (Bat. 5, Bat. 6, Bat. 7, and Bat. 18) were fully charged cyclically at room temperature (24 °C) and then fully discharged. The batteries were charged with the constant current-constant voltage (CC-CV) mode with a constant current of 1.5 A until the battery voltage reached 4.2 V. The battery was then charged in a constant current mode. Then, charging was continued in a constant voltage mode until the charge current dropped to 20 mA. Discharging was performed at a constant current mode of 2 A until the discharge voltage dropped to 2.7 V for Bat. 5, 2.5 V for Bat. 6, 2.2 V for Bat. 7, and 2.5 V for Bat. 18. The nominal capacity of the batteries is equal to 2 Ah. EOL is reached when the capacity value of the respective battery falls below 70% of the nominal capacity (from 2 Ah to 1.4 Ah).
Another step of data preparation is data cleaning. Since the tests for Bat. 5, Bat. 6, and Bat. 7 were recorded at the same time, these batteries have the same documented irregular behavior. To maintain a regular and cyclically ordered sequence, the first measurement series for both charging and discharging was removed because it was an outlier. Measurement series 12 and 33 were dropped for charging, as the batteries were charged twice here without any documented discharge in the meantime. Measurement series 90 was dropped for discharging, due to a double discharge without documented charging. The charging process of cycle 170 was an incomplete charge. For Bat. 18, the first charge and discharge measurement series was also removed because it was also an outlier. In addition, charge cycles 47 and 58 were dropped because here the batteries were charged twice, without documented discharge. After data cleaning, the records for Bat. 5, Bat. 6, and Bat. 7 had 166 complete cycles and Bat. 18 had 131 complete charge and discharge cycles.

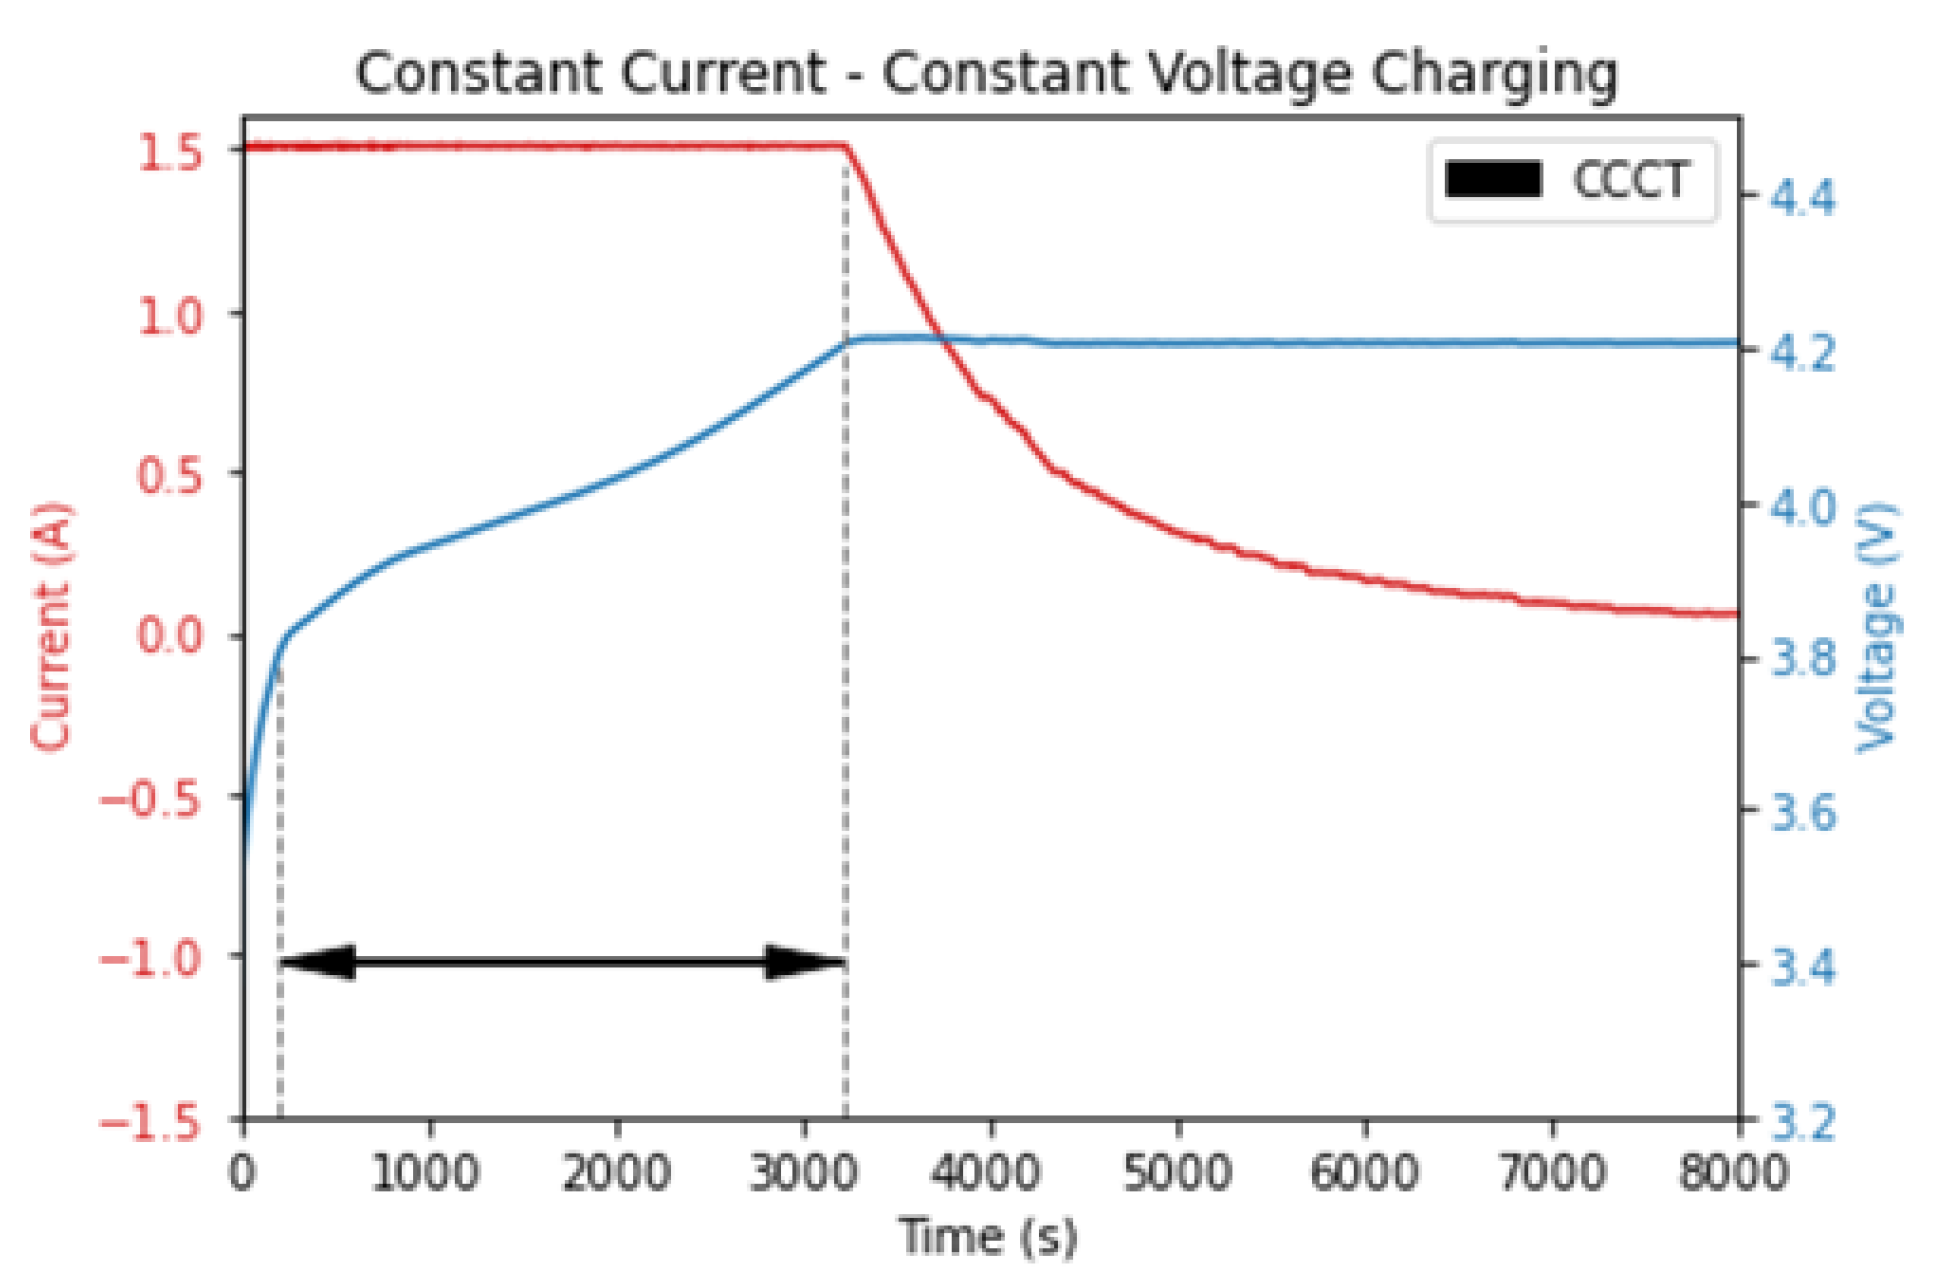
3.2. Health Indicator Extraction

Capacity and internal resistance are direct health indicators of power degradation, but they are difficult to measure in real time. Therefore, an effective indirect health indicator is needed to reflect the performance degradation of the battery. To achieve this, a soft-sensing method was used. In this method, a directly measured variable that is difficult to measure is represented by an easily measurable variable or several variables of the existing monitoring data [23].
The charging process was used for this since it is more stable than the discharging process. As an example, the voltage and current values for cycles 10, 60, 100, and 160 are shown for Bat. 5 in Figure 2. The time range of the constant current charge time (CCCT) decreases as the number of cycles increases. The documented voltages started at different voltage values. To create the same conditions, the start point of CCCT is the time value when the voltage value exceeded 3.8 V for the first time. The end point is the time value when the voltage value of 4.2 V was exceeded for the first time. The respective value for CCCT was calculated by the difference between the end time value and the start time value. Figure 3 shows an example of the CC-CV procedure for the 10th cycle of Bat. 5, and CCCT is also shown. All extracted CCCT values of the 4 batteries are shown in Figure 4.

3.3. Correlation Analysis

The correlation analysis between CCCT and capacity can be used to show the degree to which the two variables are related. The correlation coefficient indicates the strength of the correlation in a value range between 0 and 1. A value of 1 indicates a strong correlation and a value of 0 indicates a low correlation.
Table 1 shows correlation coefficients close to 1 for both the Spearman and the Pearson analyses for all batteries. This proves that there is a significant linear correlation between CCCT and capacity. Accordingly, the indirect HI is able to represent the battery performance degradation instead of the capacity.

4. Algorithm and Approach

4.1. General Algorithm

Figure 5 shows the schematic structure of the RUL prediction model. This process has three different phases. In the preparation phase, data are imported, data are cleaned, the indirect HI is extracted, and the linear relationship between HI and capacity is tested using correlation analysis. In the state-of-health (SOH) estimation phase, the GRU NN is built and trained using the extracted HI. In this work, the SOH describes the expected performance capability of the battery to a next cycle. The last phase describes the RUL prediction process. Here, it is checked whether the initially determined threshold value is reached. If the last prediction value is higher than this, then the predicted value is fed back into the neural network. A prediction is then made based on this value. This process is then iteratively repeated until the system falls below the EOL threshold. The RUL describes the expected cycles during which the battery is still capable of performing under the current conditions.

4.2. SOH Estimation Framework

The SOH estimation can be shown in more detail. Figure 6 shows a flowchart of the SOH estimation process. After HI extraction, data sets were selected that were later used for training, validation or testing (cf. Section 4.3.1). These data were normalized between 0 and 1 using the min-max scaler to obtain the same scaling for the different data sets. Subsequently, the selected data sets were split into the train, test, and validation sets and prepared for the recurrent neural network. The next step is to transform the different data sets into the appropriate format for Recurrent Neural Networks. For this purpose, the sliding window method with a constant window size is used in order to create a temporal reference. Hyperparameters and network architecture were determined to create the GRU NN. The detailed approach is explained in Section 4.3.2. Then, the model was trained and evaluated for SOH prediction. Based on this trained model, the SOH and RUL prediction was subsequently created.

4.3. Approach

4.3.1. Data Set Selection

The training of two data sets is a challenging task. Since we were dealing here with cyclically ordered data sets and the sequence was accordingly decisive, two data sets were not simply combined into one large data set because this would not correspond to the actual sequence of this data structure. Therefore, the training was split. The first training data set was used to build a base model. Since recursive neural networks have the possibility to store and pass weights and settings, this opportunity was used to train the second data set based on the pretrained model and to update the model with additional data.
The data sets were divided according to the following principle: One battery data set was used for the test in each case. Two batteries were used for training and the fourth battery was used as a validation set. This procedure was repeated three times so that each battery had been used twice as a training set and once as a validation set. The combination with the best result was used for the final model. Table 2 shows an overview of the final combinations.

4.3.2. Hyperparameter Optimization

The hyperparameters were determined and optimized using the following procedure. First, the sequence length and batch size were selected. The number of epochs was also defined, but the training of the epochs was stopped early by the early stopping method. For the optimizer, the superior Adam optimizer was used. The common Mean Square Error (MSE) was used to determine the loss function. In addition, the architecture of the neural network was defined using various tests and experiments. Subsequently, with the help of the learning rate, the training data set was adjusted so that the evaluation metrics produced values as good as possible. In addition, a visual comparison of the generated regression with the real curves of the training and validation set was made. In this context, this means that the difference between predicted graphs and expected graphs was examined. In the process of different experiments, it was shown that especially here a small difference is an essential factor for the quality of the later test results. As soon as suitable values were shown and the trend was correct, the trained model was used to make predictions for the SOH and RUL of the test set. Table 3 shows the overview of the hyperparameters used.
The network architecture has 2 GRU layers with 50 neurons. The tanh function was used for the activation function. Each GRU layer is followed by a dropout layer with a dropout rate of 0.2 to prevent overfitting. The output layer has a dense layer with a single output neuron.

5. Results and Discussion

5.1. Evaluation Parameters

In this paper, the quality measures for evaluating the predictions are root mean square error (RMSE), mean absolute error (MAE), coefficient of determination (R2), and Actual Error (AE).
R M S E = 1 n i = 1 n ( y i y ^ i ) 2
M A E = 1 n i = 1 n | y i y ^ i |
R 2 = 1 i = 1 n ( y y ^ ) 2 i = 1 n ( y y ¯ ) 2
A E = R R ^
where y ^ describes the predicted value and y ¯ represents the mean value of y . R and R ^ denote the real and predicted number of cycles until the EOL threshold is reached.

5.2. SOH Results Analysis

Figure 7 shows the predictions of the four batteries created by the GRU NN. The blue graph indicates the real values of the extracted health indicator. The prediction is shown in magenta. In addition, the EOL threshold is shown by a horizontal red line and the starting point is shown by a black vertical line, from which the training is completed and the test area begins. The prediction is shown as an example for the starting position from 30% of the test data set.
For Bat. 5, Bat. 6, and Bat. 7, the results show that the SOH estimations approximate the real trends. The power regeneration peaks can be partially mapped. The recorded performance curve of Bat. 18 was significantly different relative to the other three batteries. The curve also shows several local variations. Therefore, multiple and larger differences can be seen for the SOH estimation, since the model takes longer to represent the real values. This can be illustrated using the evaluation parameters. This is shown in Table 4 for start position 0.3. The denormalized values of RMSE, MAE and R2 refer to the SOH scale.
Bat. 5, Bat. 6, and Bat. 7 show comparable results for an R2 score close to 1, which means that the estimated values are close to the actual values. Bat. 6 shows higher deviations for RMSE and MAE in relation to the other two batteries. This is due to the stronger characteristics of the power regeneration peaks. The parameters also show the outliers of Bat. 18. Overall, the results demonstrate that training for the test data set for a step forward is successful and the GRU NN produces an accurate state-of-health estimation. This is significant because the subsequent RUL prediction is based on the trained model.

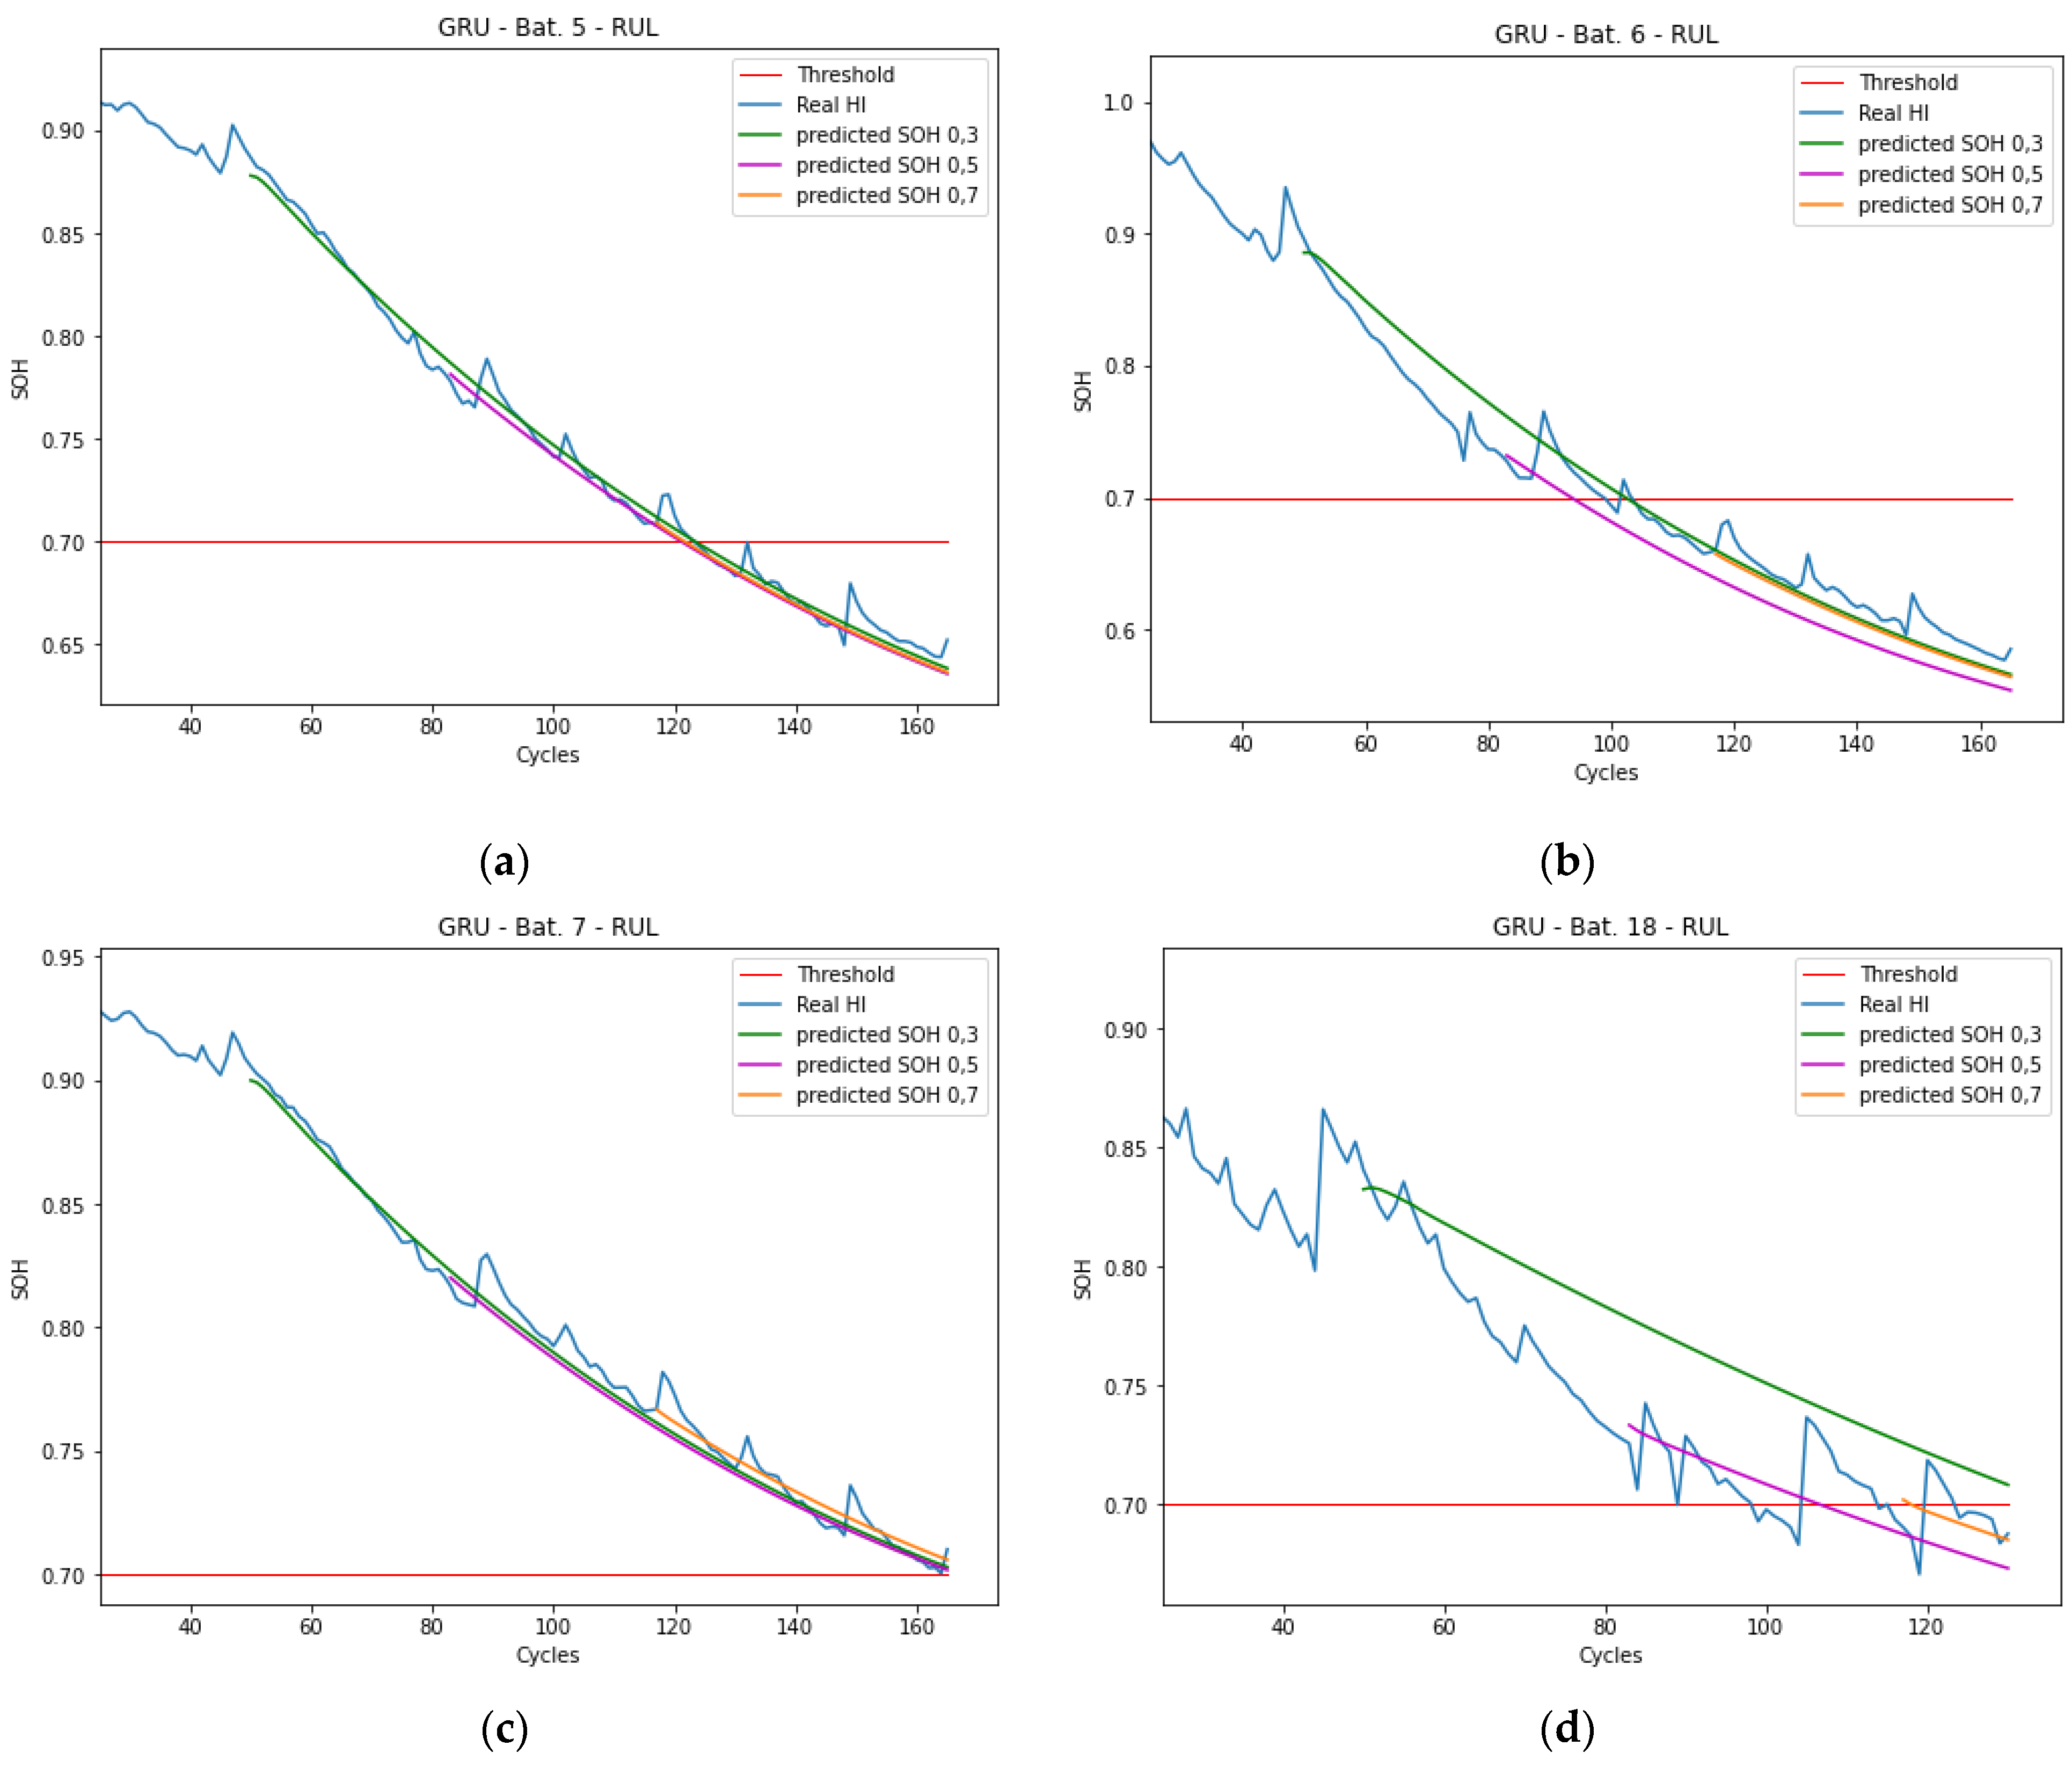
5.3. RUL Results Analysis

Figure 8 shows the RUL prediction based on two pre-trained battery data sets. The start position of 0.3 of the total data set is shown in green, in magenta, the start position is 0.5 and in orange, the start position is 0.7. In addition, the EOL threshold is also shown in red.
The predictions show the descending trend of the individual batteries. Bat. 5 to 7 show a decent curve progression, which becomes flatter as the number of cycles increases. The predictions of Bat. 18 each follow an almost linear course. The individual predictions in each battery data set start at the designated position and each shows a similar curve thereafter. From this can be derived that the focus of the model is on the wide and longer-term evolution of performance degradation. Table 5 shows an overview of the RUL prediction for the four batteries at the three different starting positions.
The table shows precise prediction values for Bat. 5–7. For example, at 75 steps into the future, Bat. 5 is exactly the real value. With 42 steps ahead, the prediction is off by only 2 cycles. For Bat. 6, the AE RUL is 4 cycles for start point 0.3. For start point 0.5, the prediction is short by 5 cycles. The prediction value for battery 7 is also accurate. For example, at 115 steps into the future, the prediction is 5 cycles off the real value and at 82 steps, it is only 3 steps off. Due to the nature of the data, the experiments of Bat. 18 show ambivalent results. Since the predicted values are close to the actual values, the proposed model can produce an accurate and long-term RUL prediction.

6. Conclusions

In this paper, an RUL prediction method for Li-ion batteries based on the combination of deep learning and soft-sensing is presented and described in detail. For this purpose, an indirect HI is extracted from the monitoring data of the charging area, which can reflect the performance degradation instead of capacity. At the same time, the GRU NN was trained on the basis of various historical data sets to learn the long-term dependencies. For verification and validation, several experiments were created and presented using the real NASA Li-ion battery data set. This leads to precise results for SOH estimation and accurate results for long-term RUL prediction trends. In reality, the variable loads of actual user charging on the battery are one of the main challenges. In the future, the presented method will be validated with more practical measured data and compared with further time-series methods. In addition, the prediction accuracy will be improved by incorporating more of the existing historical data from the current battery.

Author Contributions

Conceptualization, S.M.H. and C.D.K.; Formal analysis, S.M.H.; Methodology, S.M.H.; Software, S.M.H.; Supervision, C.D.K.; Validation, S.M.H. and C.D.K.; Visualization, S.M.H.; Writing—original draft, S.M.H.; Writing—review and editing, C.D.K. All authors have read and agreed to the published version of the manuscript.

Funding

This research received no external funding.

Institutional Review Board Statement

Not applicable.

Informed Consent Statement

Not applicable.

Acknowledgments

The authors would like to thank the reviewers and the editor for their comments and suggestions that helped to improve the paper significantly. The authors thank Hans Willi Langenbahn, the Dean of the Faculty of Process Engineering, Energy and Mechanical Systems of Technische Hochschule Köln, for financial assistance in publishing our research paper.

Conflicts of Interest

The authors declare no conflict of interest.

References

  1. Korthauer, R. Handbuch Lithium-Ionen-Batterien; Springer: Berlin/Heidelberg, Germany, 2013. [Google Scholar]
  2. Bundes-Ministerium für Wirtschaft und Klimaschutz, “bmwk.de”. Available online: https://www.bmwk.de/Redaktion/DE/Dossier/elektromobilitaet.html (accessed on 15 July 2022).
  3. Wang, D.; Miao, Q.; Pecht, M. Prognostics of lithium-ion batteries based on relevance vectors and a conditional three-parameter capacity degradation model. J. Power Sources 2013, 239, 253–264. [Google Scholar] [CrossRef]
  4. Hao, J.; Jing, L.; Ke, H.-L.; Wang, Y.; Gao, Q.; Wang, X.-X.; Sun, Q.; Xu, Z.-J. Determination of cut-off time of accelerated aging test under temperature stress for LED lamps. Front. Inf. Technol. Electron. Eng. 2017, 18, 1197–1204. [Google Scholar] [CrossRef]
  5. Liu, K.; Shang, Y.; Ouyang, Q.; Widanage, W.D. A Data-Driven Approach With Uncertainty Quantification for Predicting Future Capacities and Remaining Useful Life of Lithium-ion Battery. IEEE Trans. Ind. Electron. 2021, 68, 3170–3180. [Google Scholar] [CrossRef]
  6. Wang, Y.; Tian, J.; Sun, Z.; Wang, L.; Xu, R.; Li, M.; Chen, Z. A comprehensive review of battery modeling and state estimation approaches for advanced battery management systems. Renew. Sustain. Energy Rev. 2020, 131, 110015. [Google Scholar] [CrossRef]
  7. Qu, J.; Liu, F.; Ma, Y.; Fan, J. A Neural-Network-Based Method for RUL Prediction and SOH Monitoring of Lithium-Ion Battery. IEEE Access 2019, 7, 87178–87191. [Google Scholar] [CrossRef]
  8. Jin, S.; Sui, X.; Huang, X.; Wang, S.; Teodorescu, R.; Stroe, D.-I. Overview of Machine Learning Methods for Lithium-Ion Battery Remaining Useful Lifetime Prediction. Electronics 2021, 10, 3126. [Google Scholar] [CrossRef]
  9. Lui, Y.H.; Li, M.; Downey, A.; Shen, S.; Nemani, V.P.; Ye, H.; VanElzen, C.; Jain, G.; Hu, S.; Laflamme, S.; et al. Physics-based prognostics of implantable-grade lithium-ion battery for remaining useful life prediction. J. Power Sources 2021, 485, 229327. [Google Scholar] [CrossRef]
  10. Wang, S.; Jin, S.; Deng, D.; Fernandez, C. A Critical Review of Online Battery Remaining Useful Lifetime Prediction Methods. Front. Mech. Eng. 2021, 7, 719718. [Google Scholar] [CrossRef]
  11. Wu, Y.; Li, W.; Wang, Y.; Zhang, K. Remaining Useful Life Prediction of Lithium-Ion Batteries Using Neural Network and Bat-Based Particle Filter. IEEE Access 2019, 7, 54843–54854. [Google Scholar] [CrossRef]
  12. She, C.; Wang, Z.; Sun, F.; Liu, P.; Zhang, L. Battery Aging Assessment for Real-World Electric Buses Based on Incremental Capacity Analysis and Radial Basis Function Neural Network. IEEE Trans. Ind. Inform. 2019, 16, 3345–3354. [Google Scholar] [CrossRef]
  13. Zhou, D.; Li, Z.; Zhu, J.; Zhang, H.; Hou, L. State of Health Monitoring and Remaining Useful Life Prediction of Lithium-Ion Batteries Based on Temporal Convolutional Network. IEEE Access 2020, 8, 53307–53320. [Google Scholar] [CrossRef]
  14. Zhao, Q.; Qin, X.; Zhao, H.; Feng, W. A novel prediction method based on the support vector regression for the remaining useful life of lithium-ion batteries. Microelectron. Reliab. 2018, 85, 99–108. [Google Scholar] [CrossRef]
  15. Wang, F.-K.; Mamo, T. A hybrid model based on support vector regression and differential evolution for remaining useful lifetime prediction of lithium-ion batteries. J. Power Sources 2018, 401, 49–54. [Google Scholar] [CrossRef]
  16. Wei, J.; Dong, G.; Chen, Z. Remaining Useful Life Prediction and State of Health Diagnosis for Lithium-Ion Batteries Using Particle Filter and Support Vector Regression. IEEE Trans. Ind. Electron. 2018, 65, 5634–5643. [Google Scholar] [CrossRef]
  17. Zhang, Y.; Xiong, R.; He, H.; Pecht, M.G. Long Short-Term Memory Recurrent Neural Network for Remaining Useful Life Prediction of Lithium-Ion Batteries. IEEE Trans. Veh. Technol. 2018, 67, 5695–5705. [Google Scholar] [CrossRef]
  18. Park, K.; Choi, Y.; Choi, W.J.; Ryu, H.-Y.; Kim, H. LSTM-Based Battery Remaining Useful Life Prediction With Multi-Channel Charging Profiles. IEEE Access 2020, 8, 20786–20798. [Google Scholar] [CrossRef]
  19. Lee, C.-J.; Kim, B.-K.; Kwon, M.-K.; Nam, K.; Kang, S.-W. Real-Time Prediction of Capacity Fade and Remaining Useful Life of Lithium-Ion Batte-ries Based on Charge/Discharge Characteristics. Electronics 2021, 10, 846. [Google Scholar] [CrossRef]
  20. Chen, L.; Chen, J.; Wang, H.; Wang, Y.; An, J.; Yang, R.; Pan, H. Remaining Useful Life Prediction of Battery Using a Novel Indicator and Framework With Fractional Grey Model and Unscented Particle Filter. IEEE Trans. Power Electron. 2020, 35, 5850–5859. [Google Scholar] [CrossRef]
  21. Abdulwahab, S. Deep Learning Models for Paraphrases Identification. Master’s Thesis, Universitat Rovira I Virgili, Tarragona, Spain, 2017. [Google Scholar]
  22. Saha, B.; Goebel, K. NASA Ames Prognostics Data Repository. 2007. Available online: https://ti.arc.nasa.gov/tech/dash/groups/pcoe/prognostic-data-repository/ (accessed on 28 April 2022).
  23. Kadlec, P.; Gabrys, B.; Strandt, S. Data-driven Soft Sensors in the process industry. Comput. Chem. Eng. 2009, 33, 795–814. [Google Scholar] [CrossRef] [Green Version]
Figure 1. The architecture of the proposed GRU NN.
Batteries 08 00192 g001
Figure 2. The charge voltage and charge current curves for different cycles.
Batteries 08 00192 g002
Figure 3. The charge voltage and charge current curves for Cycle 10.
Batteries 08 00192 g003
Figure 4. The constant current charge time for all cycles for the four batteries.
Batteries 08 00192 g004
Figure 5. The RUL prediction model.
Batteries 08 00192 g005
Figure 6. Flowchart for SOH estimation.
Batteries 08 00192 g006
Figure 7. The SOH estimation result at starting point 0.3 for batteries (a) Bat. 5; (b) Bat. 6; (c) Bat. 7; (d) Bat. 18.
Batteries 08 00192 g007aBatteries 08 00192 g007b
Figure 8. The RUL prediction results at different starting points for batteries (a) Bat. 5; (b) Bat. 6; (c) Bat. 7; (d) Bat. 18.
Batteries 08 00192 g008
Table 1. The Spearman and Pearson correlation analysis.
Correlation between CCCT and CapacityBat. 5Bat. 6Bat. 7Bat. 18
Spearman:0.9930.9960.9920.975
Pearson:0.9970.9930.9900.986
Table 2. Overview of the test, training and validation set combination.
TestTrainVal
Bat. 5Bat. 7 and 18Bat. 6
Bat. 6Bat. 5 and 18Bat. 7
Bat. 7Bat. 6 and 18Bat. 5
Bat. 18Bat. 6 and 7Bat. 5
Table 3. Hyperparameters for RUL prediction model.
DescriptionParameter
Sequence length10
Learning rate9 × 10−4
Number of Epochs100
Batch size16
OptimizerAdam
Loss Mean Square Error
Table 4. The evaluation metrics for the SOH estimations at starting points 0.3.
BatteryRMSEMAER2
Bat. 50.00600.00410.993
Bat. 60.01030.00650.984
Bat. 70.00560.00370.991
Bat. 180.01210.00890.925
Table 5. The RUL prediction results with different starting points.
BatteryStarting PointReal RULPred. RULAE RUL
Bat. 50.375750
0.54240−2
0.786−2
Bat. 60.350544
0.5
0.7
17
-
12
-
−5
-
Bat. 70.31151205
0.582853
0.748568
Bat.180.347--
0.5
0.7
14
-
25
-
11
-
Publisher’s Note: MDPI stays neutral with regard to jurisdictional claims in published maps and institutional affiliations.

