1. Introduction
It is evident that the demand for lithium-ion batteries (LIBs) is significantly increasing as the electrification sector expands. According to the International Energy Agency (IEA), roughly 15–25 million electric vehicles will be sold annually by 2025 and 25–40 million by 2030 [
1]. As the production of rechargeable batteries increases, the demand for battery raw materials rises as well. The energy transformation is the main factor influencing the global demand for lithium, cobalt and nickel [
2]. As most of the battery metals are produced only in a few countries, supply risks, as well as environmental and ethical issues, may occur [
3].
One of the important strategies for circulating the critical battery materials in the supply chain is finding the most efficient ways for recovering the materials from waste LIBs [
4]. In recent years, great effort has been made globally to develop efficient recycling technologies for lithium-ion batteries, and these technologies have been described in several review papers [
4,
5,
6,
7,
8,
9].
Currently, pyrometallurgical processes are widely used in industry as a route for recycling various metal-rich waste streams, including batteries. The advantages and disadvantages of high-temperature processes in recycling were described in the work of Chen et al. [
10]. The authors highlighted that the pyrometallurgical treatment process is simple and mature, and does not require physical pretreatment (e.g sorting or size reduction) [
10]. Moreover, pyrometallurgical processes have the advantage of high-rate chemical reactions, which lead to high treatment capacities [
7]. Pyrometallurgical methods for battery recycling include thermal pretreatment, roasting/calcination and smelting.
Smelting is an effective pyrometallurgical process in which battery scrap is heated above its melting point to achieve the separation of metals in liquid phases through the reduction and formation of a metal alloy [
7]. The metal alloy formed in the system acts as a medium to recover some of the battery metals, such as cobalt, copper and nickel, which are typically the more expensive ones. Other metals like lithium, aluminum and manganese end up in the slag [
10,
11], where it may currently be unfeasible to recover them. Some of the possible smelting processes designed for the recycling of LiBs were described in the review paper of Makuza et al. [
7]. Another possible option is to use existing primary and secondary copper smelters, which allows for eliminating the capital costs of building a new recycling facility. A variety of copper smelting processes can be integrated not only with the recycling of battery metals but also for the recovery of other valuable metals from the waste electric and electronic equipment (WEEE) [
12]. However, the integration of copper smelting processes with the recycling of batteries and/or WEEE brings many new elements to the process circuits and changes the concentrations of existing elements. According to Jak [
13] the demand for reliable data on phase equilibria, thermodynamic and physical properties in metallurgical and recycling industries is increasing due to the growing economical competition, more strict environmental regulations, and availability of more advanced methods used in process control. Therefore, the behavior of different elements under different smelting conditions must be studied in order to understand the phenomena and optimize the processes. However, to optimize smelting processes and to obtain high recoveries of valuable metals, not only thermodynamic data is needed but also the kinetic behavior of trace elements and their reaction mechanisms occurring during the processes need to be known [
14].
Several studies have been conducted obtaining thermodynamic data on how elements typical for WEEE behave in simulated processes of primary and secondary copper smelting in equilibrium conditions [
15,
16,
17,
18,
19,
20,
21,
22,
23,
24,
25,
26,
27]. In our previous studies [
11,
28], the behavior of battery metals (Li, La, Co, Cu, Mn and Ni) was investigated in equilibrium in reducing conditions (between 10
−11 and 10
−8 atm oxygen partial pressure) at 1300 °C. In those studies, the influence of MgO content on slag chemistry and trace element distribution was investigated.
However, the time-dependent behavior of battery metals in copper smelting has not been studied before. The first data on the kinetic behavior of trace elements in copper flash smelting were provided by Wan et al. [
14,
28,
29,
30,
31]. In these studies, the time-dependent behavior of precious metals Au, Ag, Pt, Pd as well as impurity elements As, Sb and Bi during copper flash smelting was investigated experimentally. The time-dependent behavior of Rare Earth Elements (REEs) in copper matte-slag systems in primary copper smelting conditions was researched experimentally by Klemettinen et al. [
32].
The main goal of this study was to investigate how fast the battery metals (cobalt, lithium, nickel, manganese) distribute between different phases in laboratory-scale experiments simulating secondary copper smelting conditions. The evolution of different phases in the system as a function of time was investigated under reducing conditions at high temperatures. In comparison to previous studies [
11,
28] where the battery metals were added to the system as pure substances, industrial battery scrap was used in the current study.
The achievement of equilibrium is obviously the most important and common uncertainty in thermodynamic phase equilibria investigations [
13]. In previous equilibrium studies by us and other researchers, the attainment of equilibrium has been confirmed by conducting experiments for different times and analyzing the composition as well as homogeneity of obtained phases. However, the required equilibration time has been determined only based on major element composition. In this work, the aim was to investigate the time required for the trace and ultra-trace elements to reach equilibrium distributions between copper alloy and slag. Electron probe microanalysis (EPMA) and laser ablation-inductively coupled plasma-mass spectrometry (LA-ICP-MS) analysis techniques were utilized for phase composition quantifications after high-temperature holding and rapid quenching.
2. Experimental
2.1. Materials
The initial sample mixture was comprised of synthetic slag and copper alloy mixtures as well as industrial battery scrap. The mixture of slag contained 15 wt% Al2O3 (powder, Sigma Aldrich, St. Louis, MO, USA), 51 wt% Fe2O3 (powder, Alfa Aesar, Kandel, Germany), 28 wt% SiO2 (powder, 40 mesh, Alfa Aesar, Kandel, Germany) and 6% MgO (powder, 325 mesh, Alfa Aesar, Kandel, Germany). The initial Fe/SiO2 mass ratio was 1.3. All components were mixed in a mortar to obtain a fine and homogenous mixture.
The copper alloy was a mixture of pure metal powders: 93 wt% Cu (powder, Alfa Aesar, Kandel, Germany), 5 wt% Sn (powder, 100 mesh, Alfa Aesar, Kandel, Germany) and 2 wt% Ni (powder, APS 3-7 micron, Alfa Aesar, Kandel, Germany).
The battery scrap was obtained from a Finnish industrial operator. The used fraction was fine cathode material with a high concentration of Co. The chemical composition of the battery scrap was analyzed using four acid digestion of a sample followed by multielement analysis with ICP-OES. Additionally, the carbon content was analyzed with combustion analysis with a Leco analyzer. All analyses were done by CRS Laboratories Oy (Outokumpu, Finland) and the results are summarized in
Table 1.
In every experiment, the starting mass of the battery scrap was approximately 4 wt% of the mass of the copper alloy. The amount of battery scrap was chosen so that the initial concentration of Co in the sample was 1 wt% of the mass of copper alloy, as in our previous equilibrium study [
11].
2.2. Experimental Methods
The applied experimental method was based on heating the sample charge at a controlled temperature and gas atmosphere followed by rapid quenching into the ice-water mixture. Experiments were conducted under simulated black copper smelting conditions at 1300 °C at reducing conditions of oxygen partial pressure
pO
2 = 10
−10 atm. The laboratory vertical furnace (Nabertherm, Lilienthal, Germany, RHTV 120-150/18) with MoSi
2 heating elements and an alumina reaction tube (Frialit AL 23; Friatec AG, Mannheim, Germany; 45 mm OD and 38 mm ID). A calibrated S-type Pt/Pt10Rh thermocouple (Johnson-Matthey, London, UK) with an uncertainty of ±3 °C was used to control the experimental temperature. The furnace setup was presented in detail in a previous study of Klemettinen et al. [
22].
The prepared mixture containing slag, copper alloy and battery scrap was placed in an alumina crucible held by a Pt-wire basket. The first 0.2 g of the metal alloy was weighed into the crucible, then approximately 0.008 g of battery scrap was added on top of the metal alloy, followed by adding 0.2 g of slag on top of the mixture. The weight ratio between metal alloy, slag and battery scrap was 1:1:0.04. The crucible was hooked with a platinum-rhodium wire and pulled up to the hot zone of the furnace. More details regarding the procedure of introducing the sample into the furnace were described in a previous study of Dańczak et al. [
28]. The samples were kept in the hot zone for different times, from 1.5 min to 48 h. Holding times of less than 1.5 min were tested but omitted since the samples did not melt completely. The gas atmosphere was obtained by mixing CO and CO
2 with flow rates of 174.5 mL/min and 125.6 mL/min, respectively. The gas flow rates were calculated using MTDATA software and the SGTE pure substances database [
33]. During experiments, the gas flow gates were controlled using mass flow controllers (DFC 26, Aalborg, Orangeburg, NY, USA). After appropriate contact times, the samples were rapidly quenched in an ice-water mixture without compromising the gas atmosphere. The quenched samples were cut in half, mounted in epoxy resin, ground, polished and carbon coated (
Figure 1).
2.3. Sample Analysis
The sample microstructures were analyzed with SEM (Scanning Electron Microscope; Mira3, Tescan, Czech Republic) and the composition of phases was preliminarily investigated with EDS (Energy Dispersive Spectrometer, Thermo Fisher Scientific, Waltham, MA, USA). For more accurate phase composition analyses regarding major and trace elements, EPMA and LA-ICP-MS were used, respectively.
The EPMA analyses were obtained with CAMECA SX100 electron microprobe at the Geological Survey of Finland (GTK) using WDS (wavelength-dispersive spectrometry) technique. The accelerating voltage and beam current were 20 kV and 60 nA, respectively. A focused beam was used for the spinel phase, while a defocused beam was used for slag (20 µm) and the metal phase (50 µm). Analytical results were corrected using the PAP on-line correction program [
34]. Natural minerals and synthetic metals were used as standards as follows: obsidian for O (Kα), quartz for Si (Kα), almandine for Al (Kα), diopside for Mg (Lβ), hematite for Fe (Mα), rhodonite for Mn (Kα), cobaltite for Co (Kα), copper for Cu (Lα), tin for Sn (Lα) and nickel for Ni (Kα).
The concentrations of several elements fell under the detection limits of EPMA, so their concentrations were quantified using LA-ICP-MS at GTK. The details of the equipment used have been presented previously [
11]. The metal alloy was analyzed using a 50 µm diameter laser spot size, 10 Hz pulse frequency and 3.2 J/cm
2 power. External calibration was conducted using UQAC FeS-1 pressed sulfide pellet [
35] and USGS MASS1 [
36] was used as a monitor.
60Ni isotope was used as the internal standard. The slag was also analyzed using 50 µm diameter spots, but with 5 Hz pulse frequency and 2.17 J/cm
2 power. NIST 610 and 612 [
37] were used for calibration and as a monitor, respectively. The internal standard was the
29Si isotope.
The analysis protocol followed a 2-s pause, 5 pre-ablation shots, 20-s flushing, 20-s background analysis and either 300 (metal, 10 Hz) or 200 (slag, 5 Hz) laser shots. The mass signal intensities were converted to elemental concentrations using Glitter software [
38]. The detection limits obtained using EPMA and LA-ICP-MS are shown in
Table S1 in Supplementary Materials.
4. Discussion
In a multi-element system, the change in concentration of elements in the slag or metal alloy may not always represent the actual change in the recovery of these metals to the metal phase. In our study, the industrial battery scrap used in the experiments was a heterogenous mixture of chemical compounds. Therefore, the starting concentrations of metals in the system may slightly vary in each experiment. When evaluating the recovery of different (trace) metals to the alloy phase, the distribution coefficients of these metals between alloy and slag provide information independent of the slight variations in the starting concentration between different samples.
In metal–slag equilibriums at a high temperature, the oxidic dissolution reaction of a minor element X with a valence of 2
v in the slag can be expressed by Equation (1).
The equilibrium constant
K for the above reaction can be described by the activities of X in metal and XO
v in slag, according to Equation (2)
where
ai is the activity of a chemical species and
pO2 is oxygen partial pressure.
As described in the work of Takeda and Yazawa [
39,
40], the distribution ratio of an element X between molten metal and the slag is expressed in Equation (3):
where the [ ] and ( ) brackets represent the copper alloy and slag phases, respectively. In the above equation,
LCu/s(
X) is the distribution coefficient of element
X between copper alloy and slag;
nT is the total moles of constituents in 100 g of each phase and
γ is the activity coefficient.
The distribution coefficient described with Equation (3) is often used while studying the behavior of trace metals in different systems in metallurgical processes. In this study, copper alloy is used as a medium for collecting the trace metals and the distribution coefficients between copper alloy and slag are essential parameters utilized for evaluating the recycling efficiencies of different metals in copper smelting. If the distribution coefficient of a metal is below 1 (or 0 in logarithmic scale), most of this metal distributes into the slag phase, where its recovery is difficult.
The distribution coefficients of metals are typically determined at equilibrium conditions and presented as a function of oxygen partial pressure or temperature, or of concentration of additives (e.g., CaO, MgO, K
2O). In this study, the experiments were conducted at a constant temperature and oxygen partial pressure. In all experiments, the starting composition of the mixture was also constant, neglecting the possible variations in battery scrap composition mentioned earlier. The only controlled variable was the high-temperature holding time. Therefore, in this study, the distribution coefficients of different metals were presented as a function of contact time (
t). The distribution coefficient values of metals determined at selected times (
t) can be described by Equation (4) [
14].
Figure 6 shows the logarithms of distribution coefficients of Li, Mn, Ni, Sn, Co, Pb, Fe and Cu between copper alloy and the slag as a function of holding time. Comparisons with our previous equilibrium studies [
11,
28] are also presented. The calculated values of distribution coefficients and their uncertainties are presented in
Table S6 in Supplementary Materials.
For copper and iron, the most significant changes in the calculated distribution coefficients occurred before 2.5 min of holding. During that time, the logarithmic distribution coefficient of copper decreased from 3.0 at 1.5 min to 2.2 at 2.5 min and the logarithmic distribution coefficient of iron increased from −2.5 to −2.0. After 2.5 min holding time, the distribution coefficient of copper remained stable, at approximately 2.2 in log scale, all the way up to the longest time. In comparison, the logarithmic distribution coefficient of iron increased further up to −1.6 during the first 60 min. After that, its value remained stable. The low value of iron distribution coefficient indicates that most of the iron remained in the slag phase as iron oxides.
Similar to copper and iron, the distribution coefficient of cobalt decreased the most significantly before 2.5 min holding time, from 1.0 to 0.0 in a log scale. After that time, it increased slightly to 0.1. This is in agreement with the results of our previous equilibrium study [
11]. The logarithmic distribution coefficient value close to 0 indicates that cobalt is basically evenly distributed between copper alloy and the slag at
pO
2 = 10
−10 atm.
In the case of lead, its calculated logarithmic distribution coefficient changed between 1.0 and 1.5 at different contact times without a visible trend. The concentration of lead in the slag decreased close to or even below the LA-ICP-MS detection limits at 8 h and longer holding times, which contributes to the uncertainty of the true distribution coefficient values after long holding times.
The distribution coefficients of nickel and tin increased as the holding time increased, from 1.4 to 2.1 and from 1.7 to 2.3 in the log scale, respectively. After 16 h holding time, nickel and tin distribution coefficient values remained relatively stable.
The logarithmic distribution coefficients of lithium and manganese have very negative values and are much lower in comparison to the other trace elements in this study, which shows that lithium and manganese deport strongly into the slag phase rather than into copper alloy under the investigated conditions. Their distribution coefficient values seem to be fluctuating without clear trends, which can be explained by their extremely low concentrations in the copper alloy. However, the values are in fair agreement with our previous equilibrium study [
11].
The calculated distribution coefficients L
Cu/s(X)
t of battery metals (Li, Co, Ni, Mn) followed the order of Ni >> Co >> Mn > Li at both the shortest (1.5 min) and the longest (48 h) holding time. This order corresponds to the Ellingham diagram showing the stabilities of battery metal oxides [
11].
5. Conclusions
As battery metals such as lithium, cobalt and nickel, are characterized by high demand and/or supply risks, new ways for securing their availability in the future have to be developed. Recycling lithium-ion batteries through high-temperature processes is a viable option for recovering some of the valuable metals within. Integration of battery recycling with already existing pyrometallurgical operations helps decrease investment costs compared to building greenfield facilities. However, changing the feeds of existing smelters introduces many new elements into the system, and therefore influences the process chemistry and recovery of valuables.
In this study, the possibility of integrating LIB recycling with secondary copper smelting was further investigated. The behavior of battery metals in simulated reducing conditions of secondary copper smelting was investigated as a function of time for the first time. The evolution of phases in the system and the required equilibration time were investigated as well.
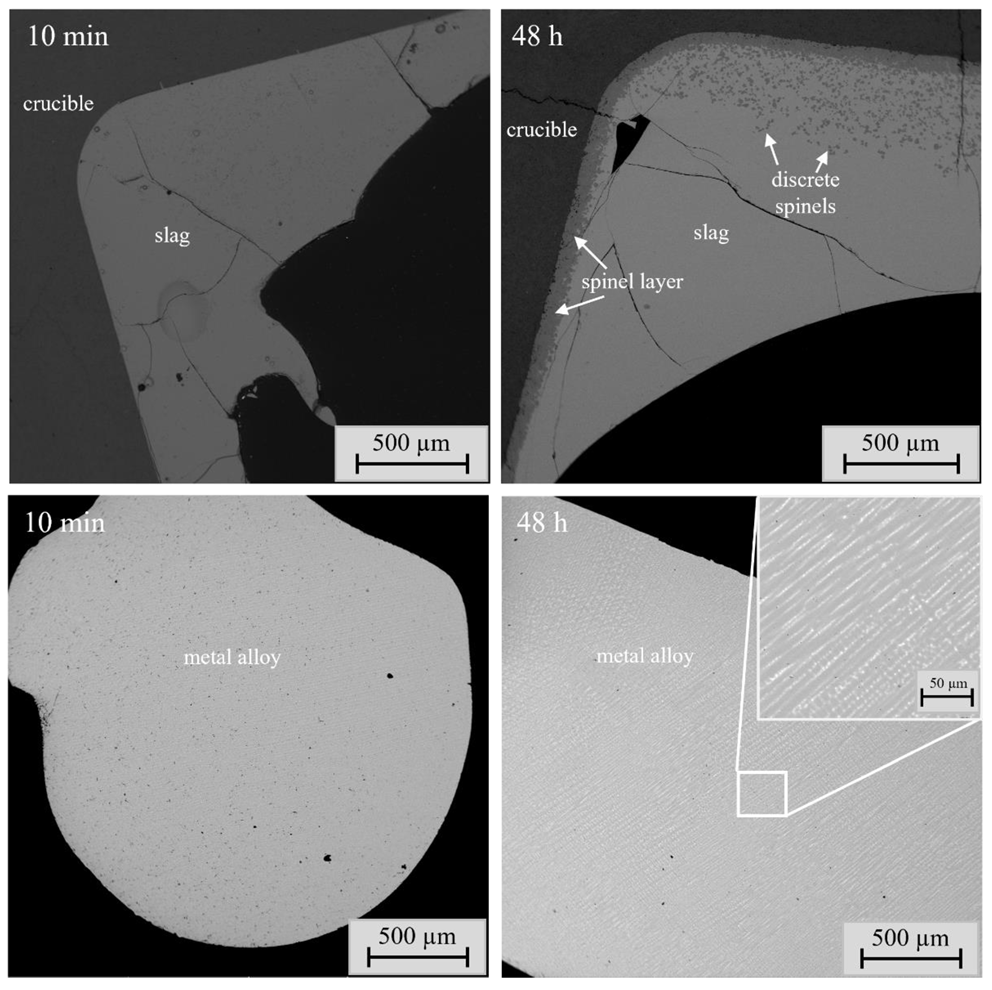
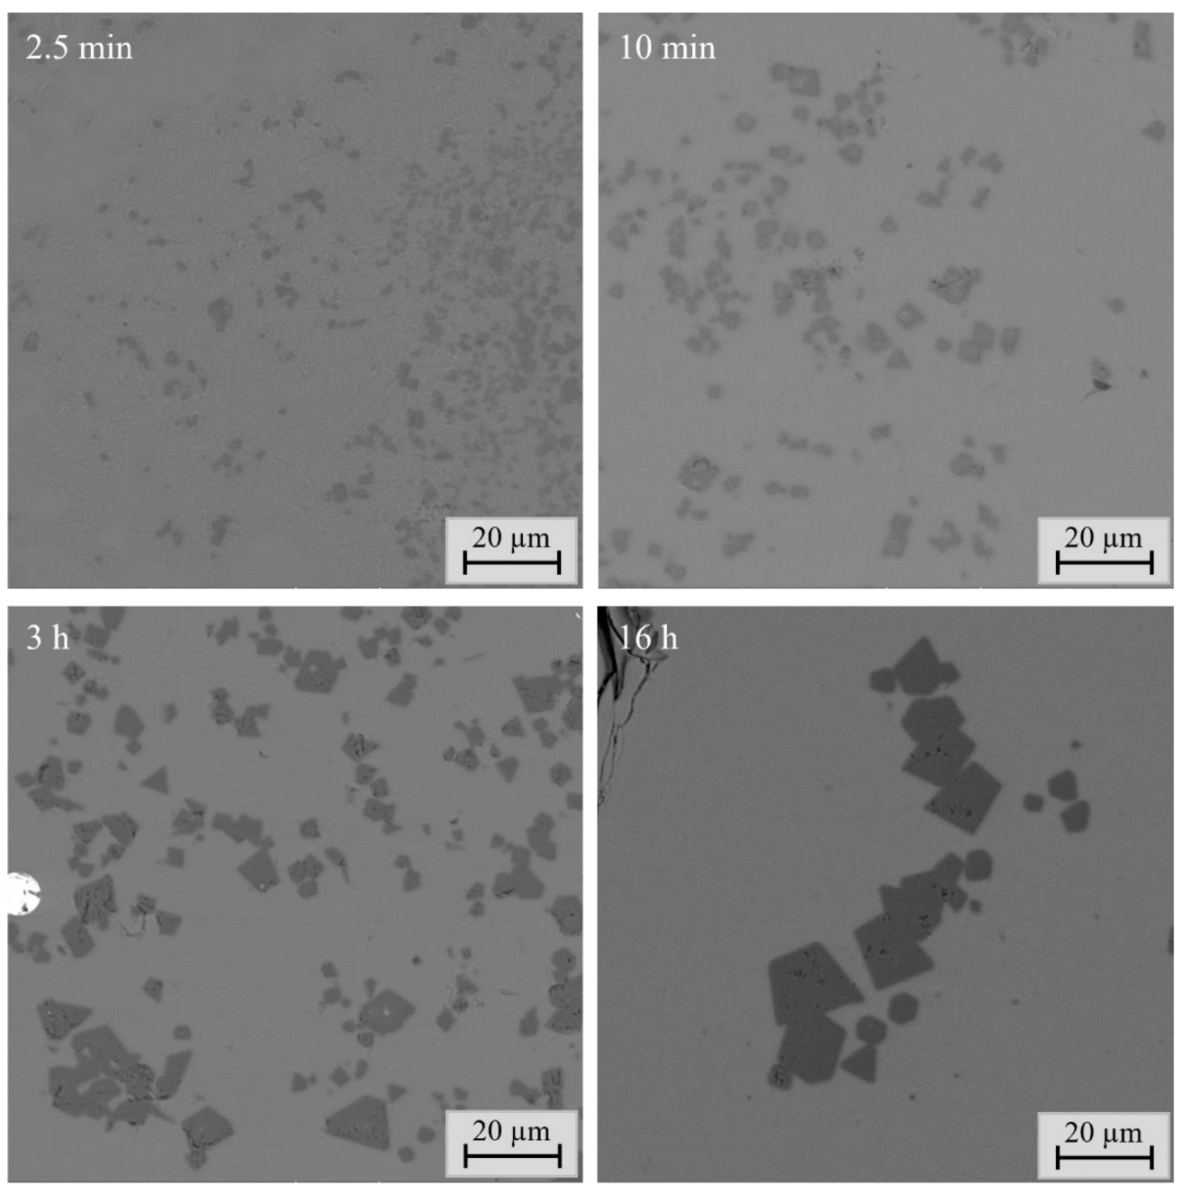
The visual observations regarding sample microstructure are important for determining the equilibration time. One important criterion for the achievement of equilibrium is that the phases present do not change as a function of equilibration time [
23]. In our study, already after 1.5 min holding time all equilibrium phases, i.e., slag, metal alloy and spinel were present and remained in the samples with the longer holding times. Other important criteria are that all phases are homogeneous, and the microstructure does not change as a function of time [
13,
23]. In this study, the most significant change in sample microstructure was connected to the spinel layer and spinel grains. The spinel layer between the slag and crucible became much thicker and more uniform as a function of time, and the size of the discrete spinels increased as well. These changes were observed until 16 h holding time. After 16 h, the phases were homogeneous and the microstructures of samples did not change anymore.
In this study, the chemical compositions were analyzed using the state-of-the-art direct phase analysis methods EPMA and LA-ICP-MS. The concentrations of major elements in the slag remained surprisingly constant throughout the investigated time series, apart from iron, which also stabilized at approximately 30 min holding time. In spinel, the concentrations of major elements changed until 1 h holding time, after which they remained basically stable over the remaining time. The concentrations of major elements in the metal alloy after 1 h holding time reached very similar values as after 48 h contact time.
The results indicated that already after 1 h holding time, the major elements are in equilibrium. However, the observations regarding sample microstructure as well as trace element distribution coefficients suggest that a 16 h holding time is required to obtain steady-state microstructure and homogeneous phases. Therefore, the equilibration time cannot be verified only based on the concentrations of major elements. The distribution of trace elements between metal alloy and slag, as well as microstructural observations, must be taken into consideration. Based on the data presented in
Figure 6 as well as the microstructural observations, it can be concluded that 16 h is sufficient for equilibrating the samples of this study, which also verifies that the equilibration times chosen in our previous studies have been sufficient [
11,
20,
22,
24,
28]. The distribution coefficients of Pb, Li and Mn were somewhat fluctuating even after 16 h due to analysis difficulties associated with extremely low concentrations in slag (Pb) or alloy phase (Li, Mn).
The distribution coefficients of battery metals (Li, Co, Ni, Mn) between metal alloy and slag were investigated as a function of time and their values followed the order of Ni >> Co >> Mn > Li at both the shortest (1.5 min) and the longest (48 h) holding time. The logarithmic values of the distribution coefficients suggest that most of the Ni can be recovered to the metal phase. In the case of cobalt, half of it can be recovered in the metal alloy and the other half is deported to the slag under the experimental conditions applied in this study. Lithium and manganese heavily deport to the slag phase and are basically lost in current copper smelting operations.


 ,
, 


