

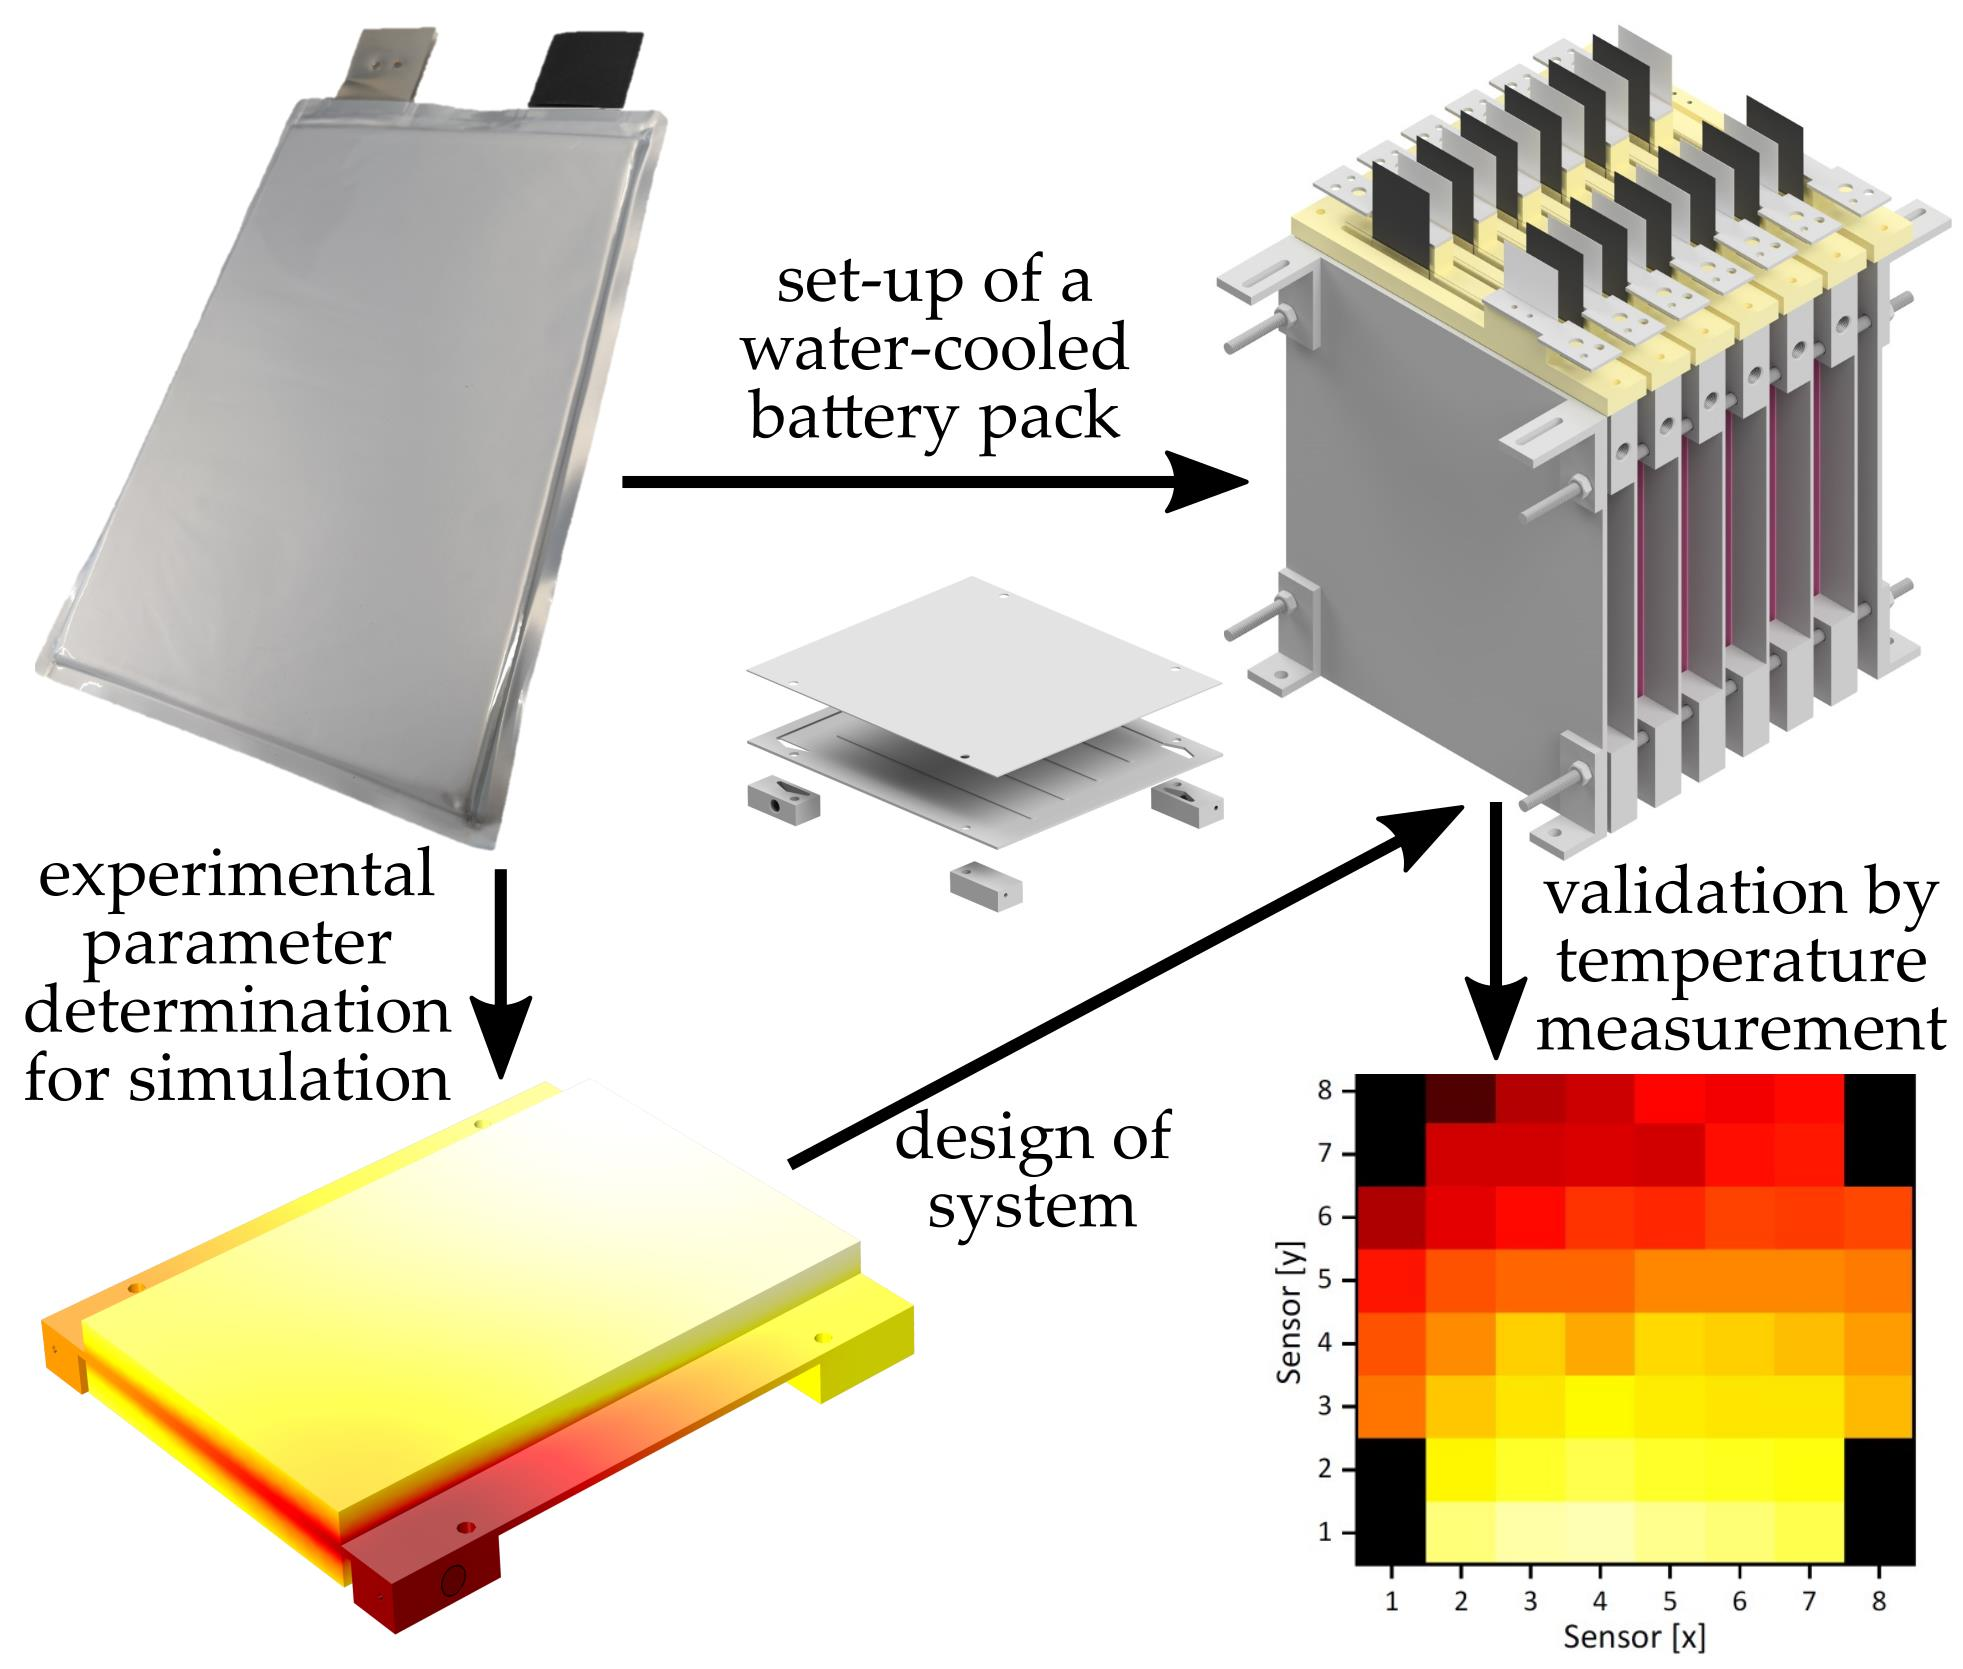
Simulation, Set-Up, and Thermal Characterization of a Water-Cooled Li-Ion Battery System


Abstract

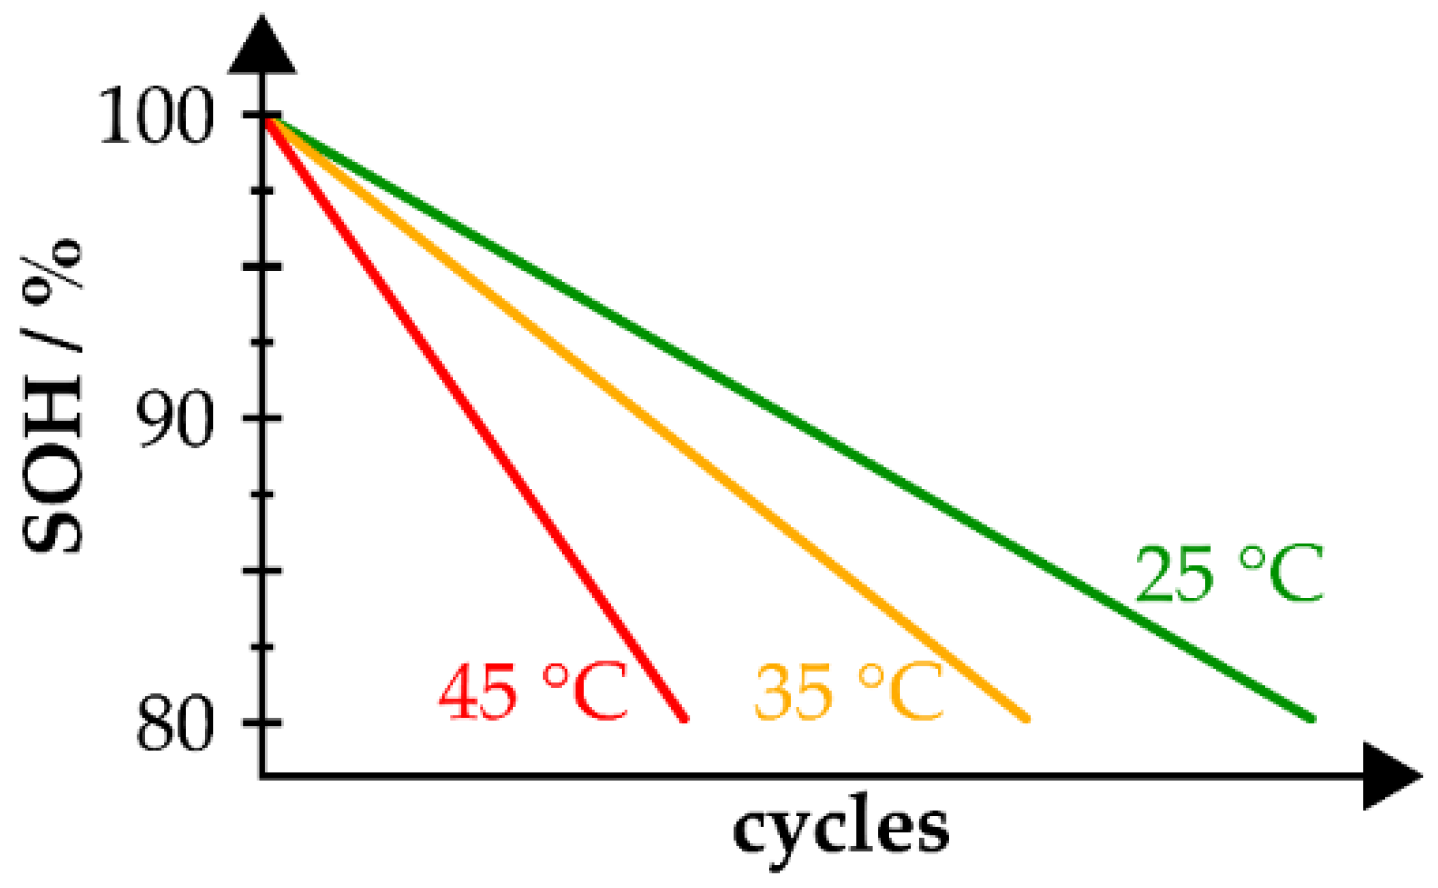
1. Introduction
2. Simulative Methods
2.1. The Lumped Battery Model
2.2. Water-Cooled Battery System
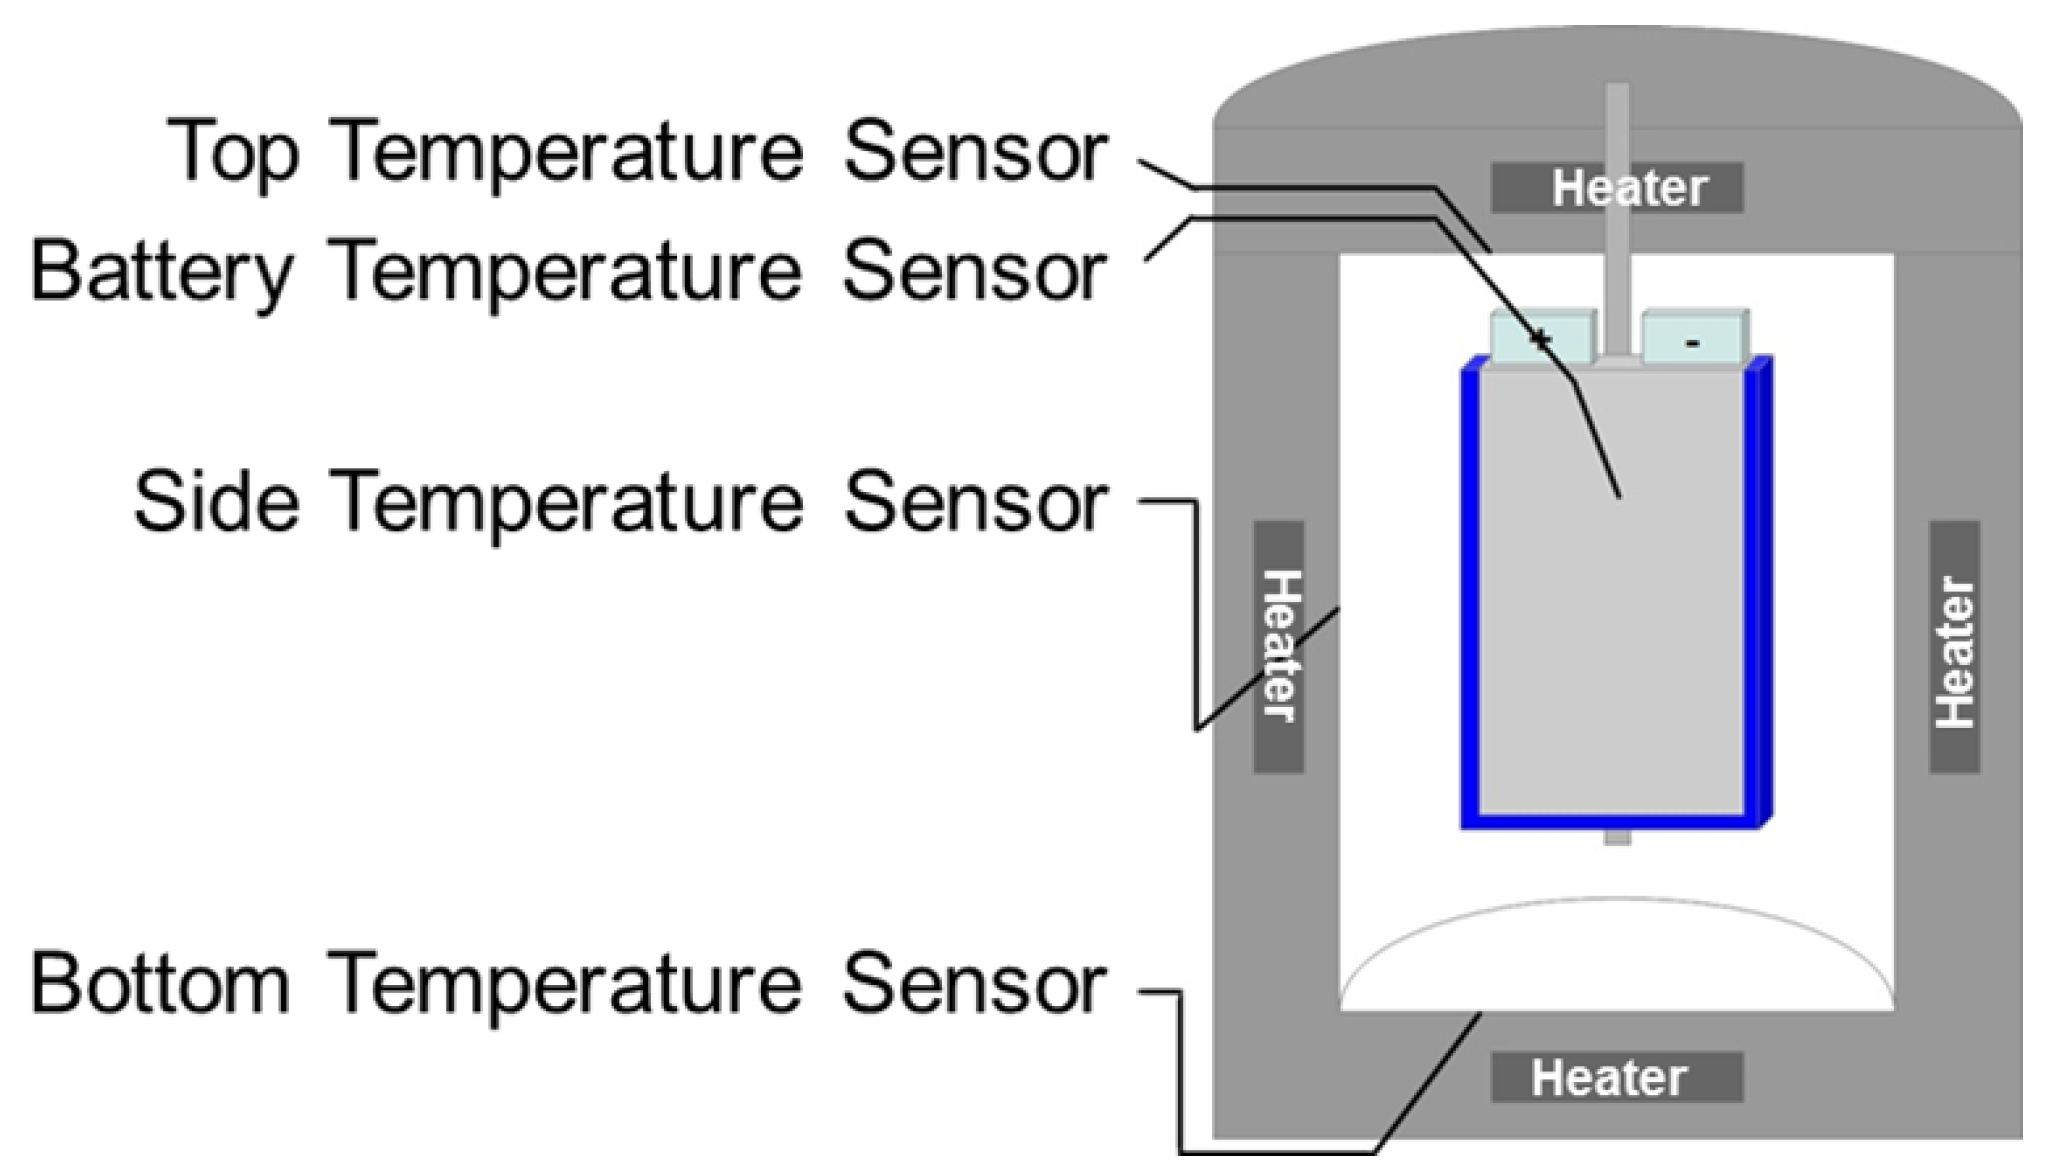
3. Experimental Battery Characterization
3.1. Electrochemical Characterization
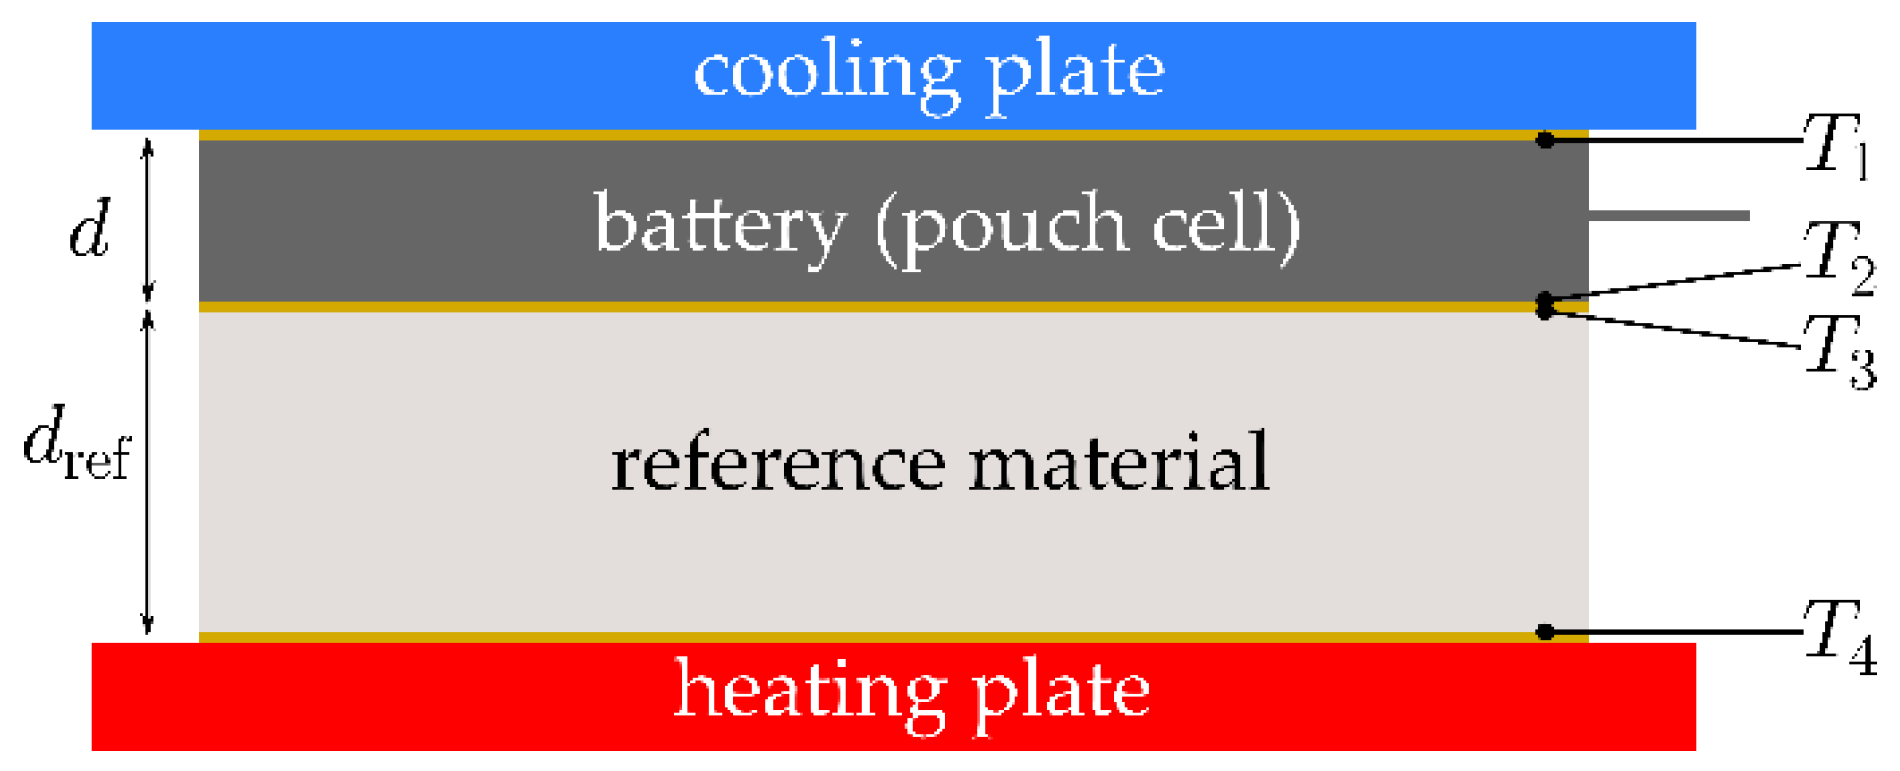
3.2. Thermal Characterization
4. Simulative Results
4.1. Electrochemical and Thermal Behavior of a Single Battery
4.2. Thermal Behavior of a Water-Cooled Battery Pack
5. Setup and Experimental Validation of the Water-Cooled Battery System
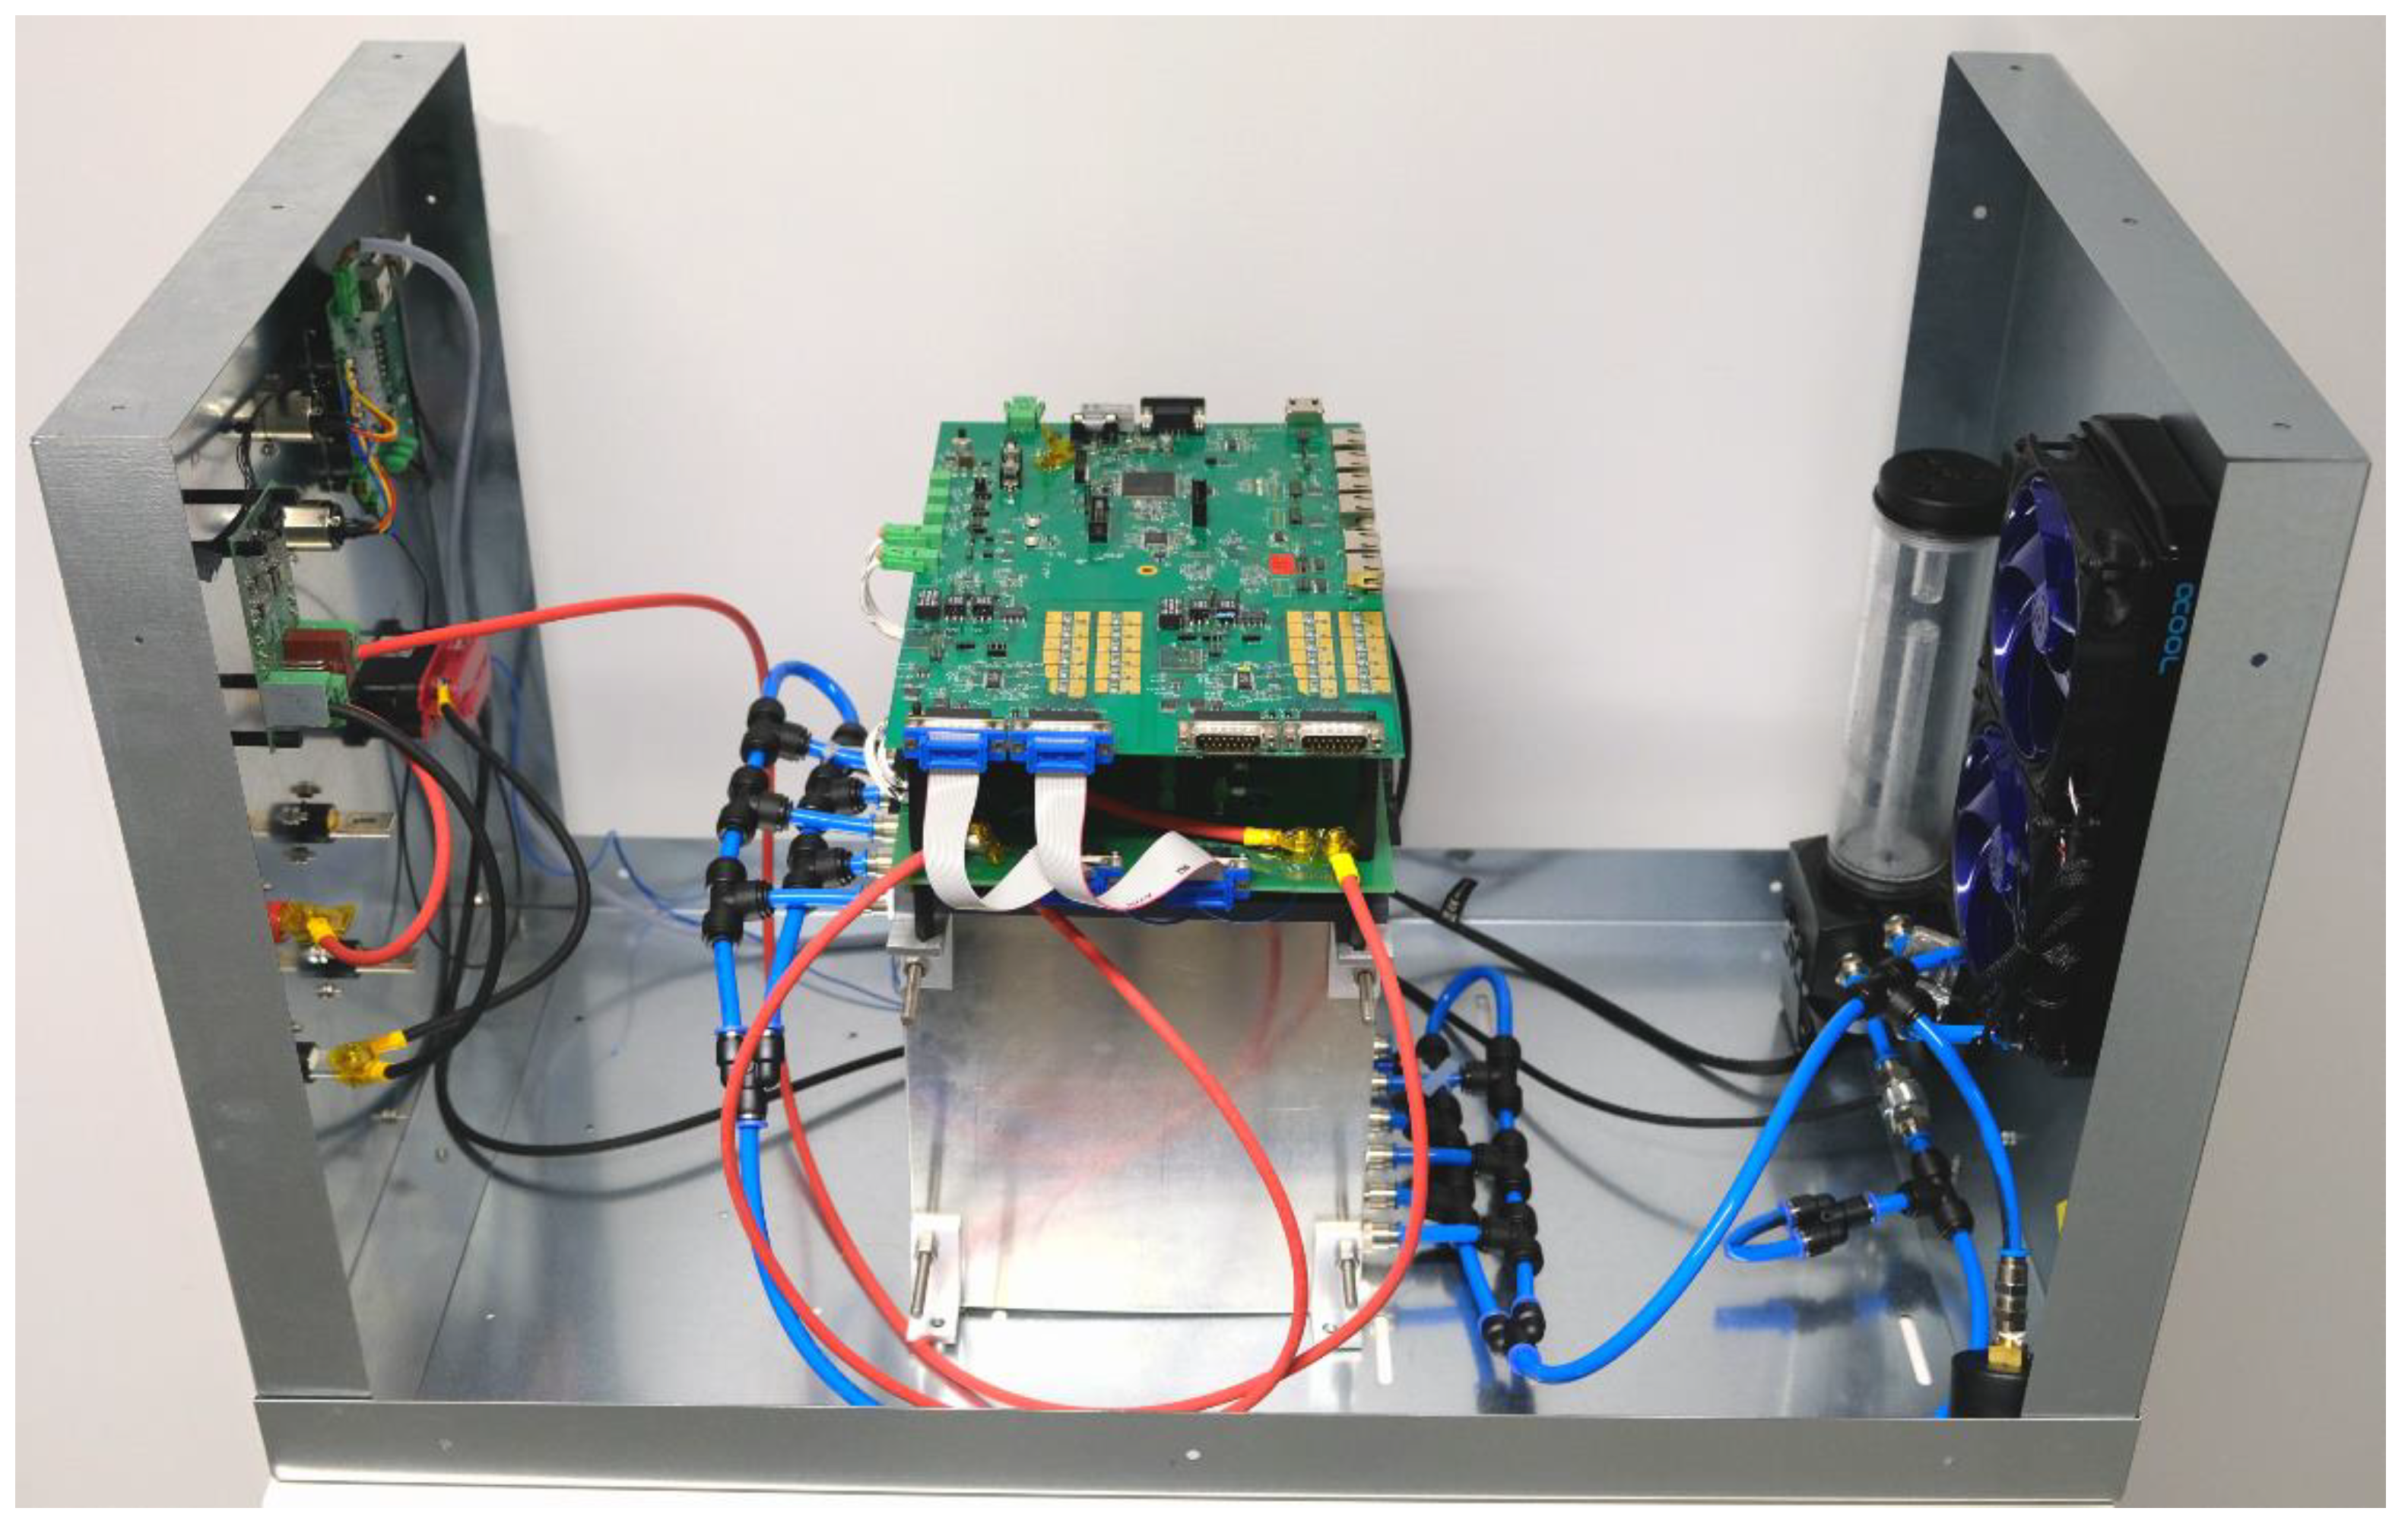
5.1. Setup of the Battery System
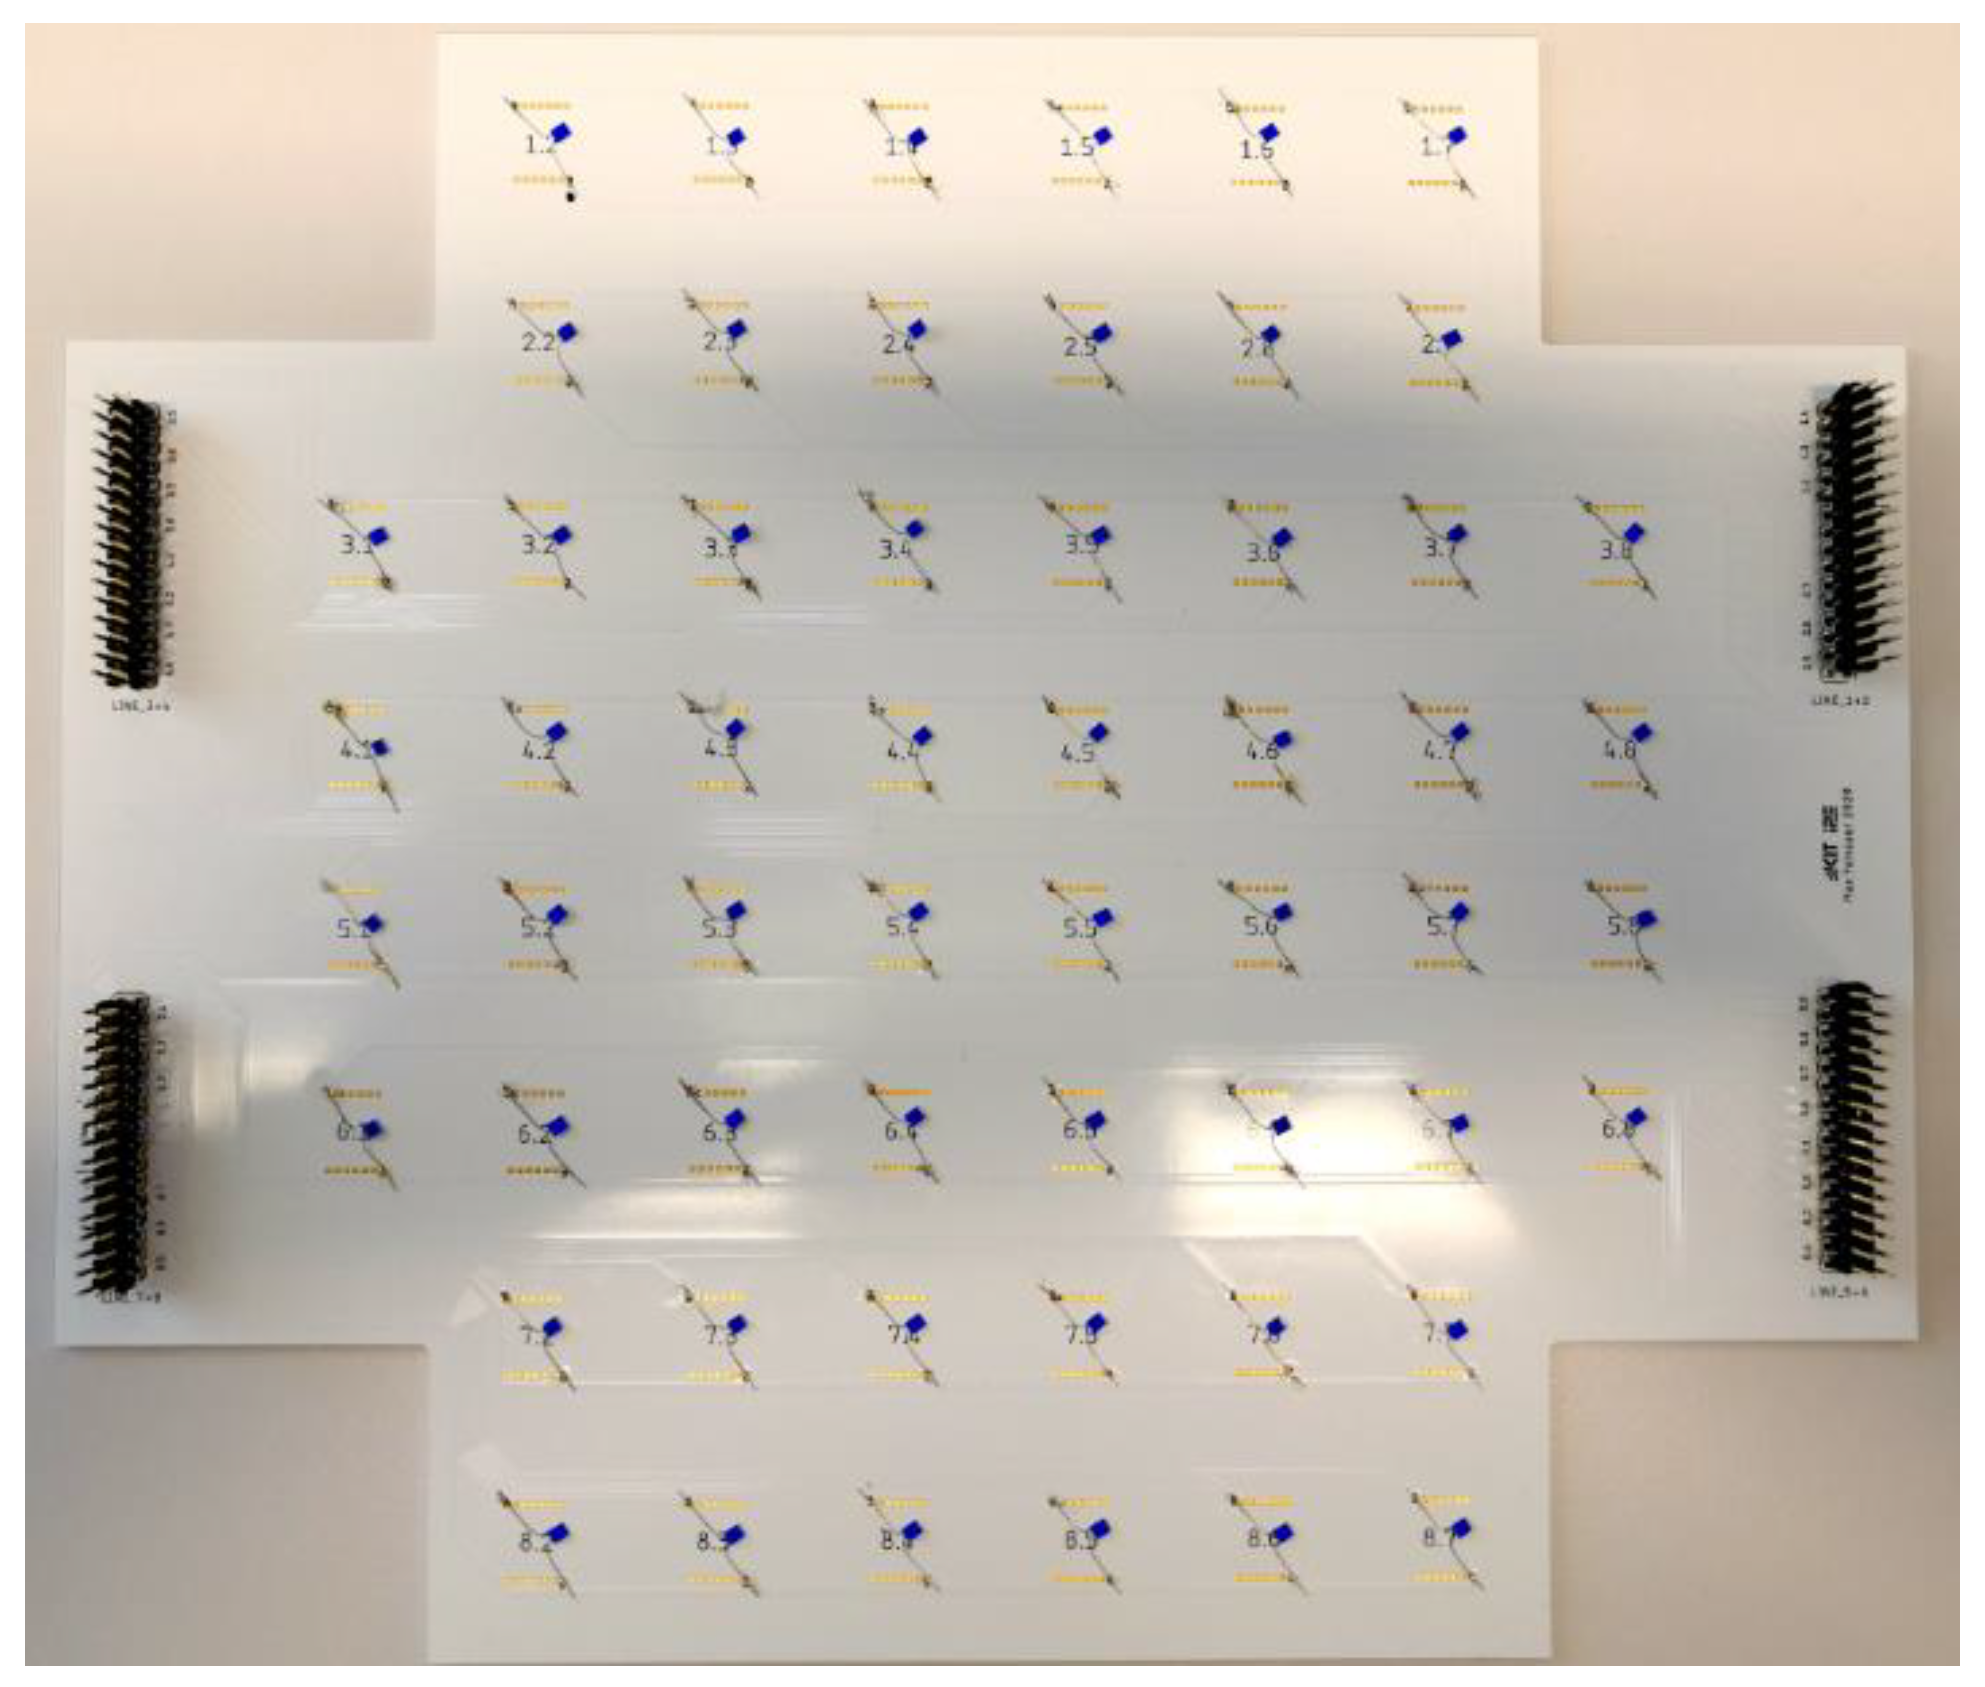
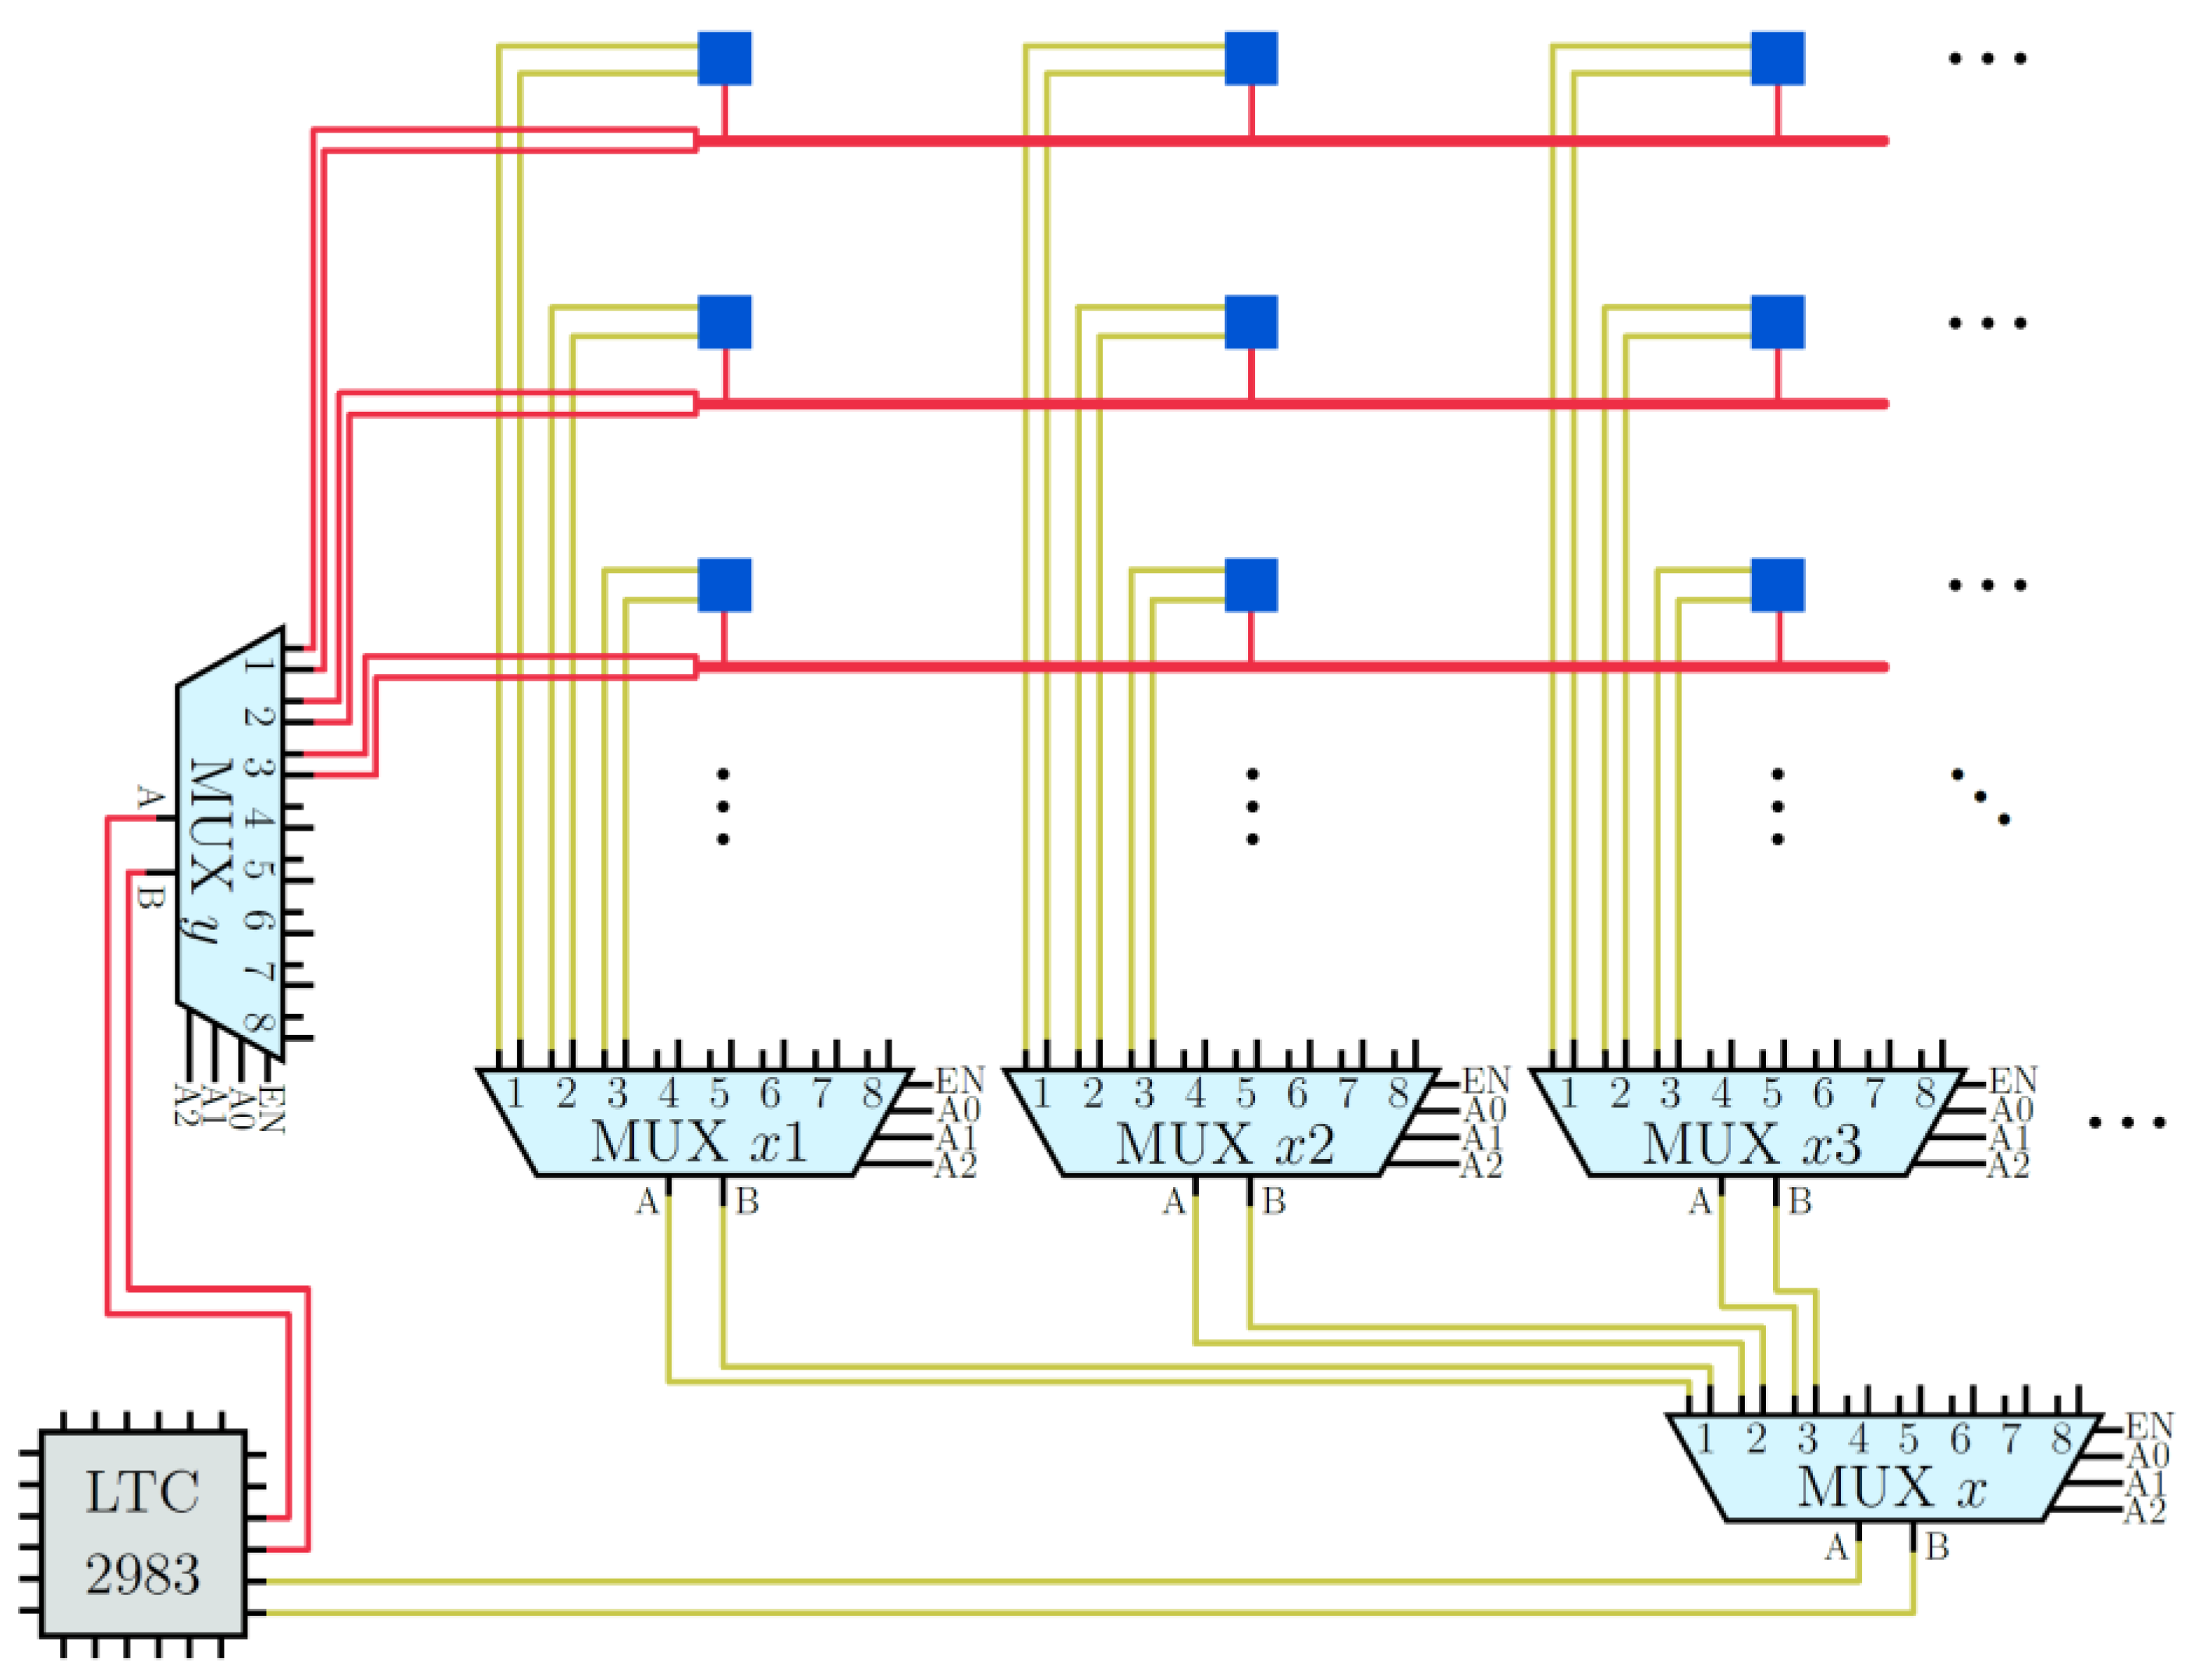
5.2. Temperature Measurement
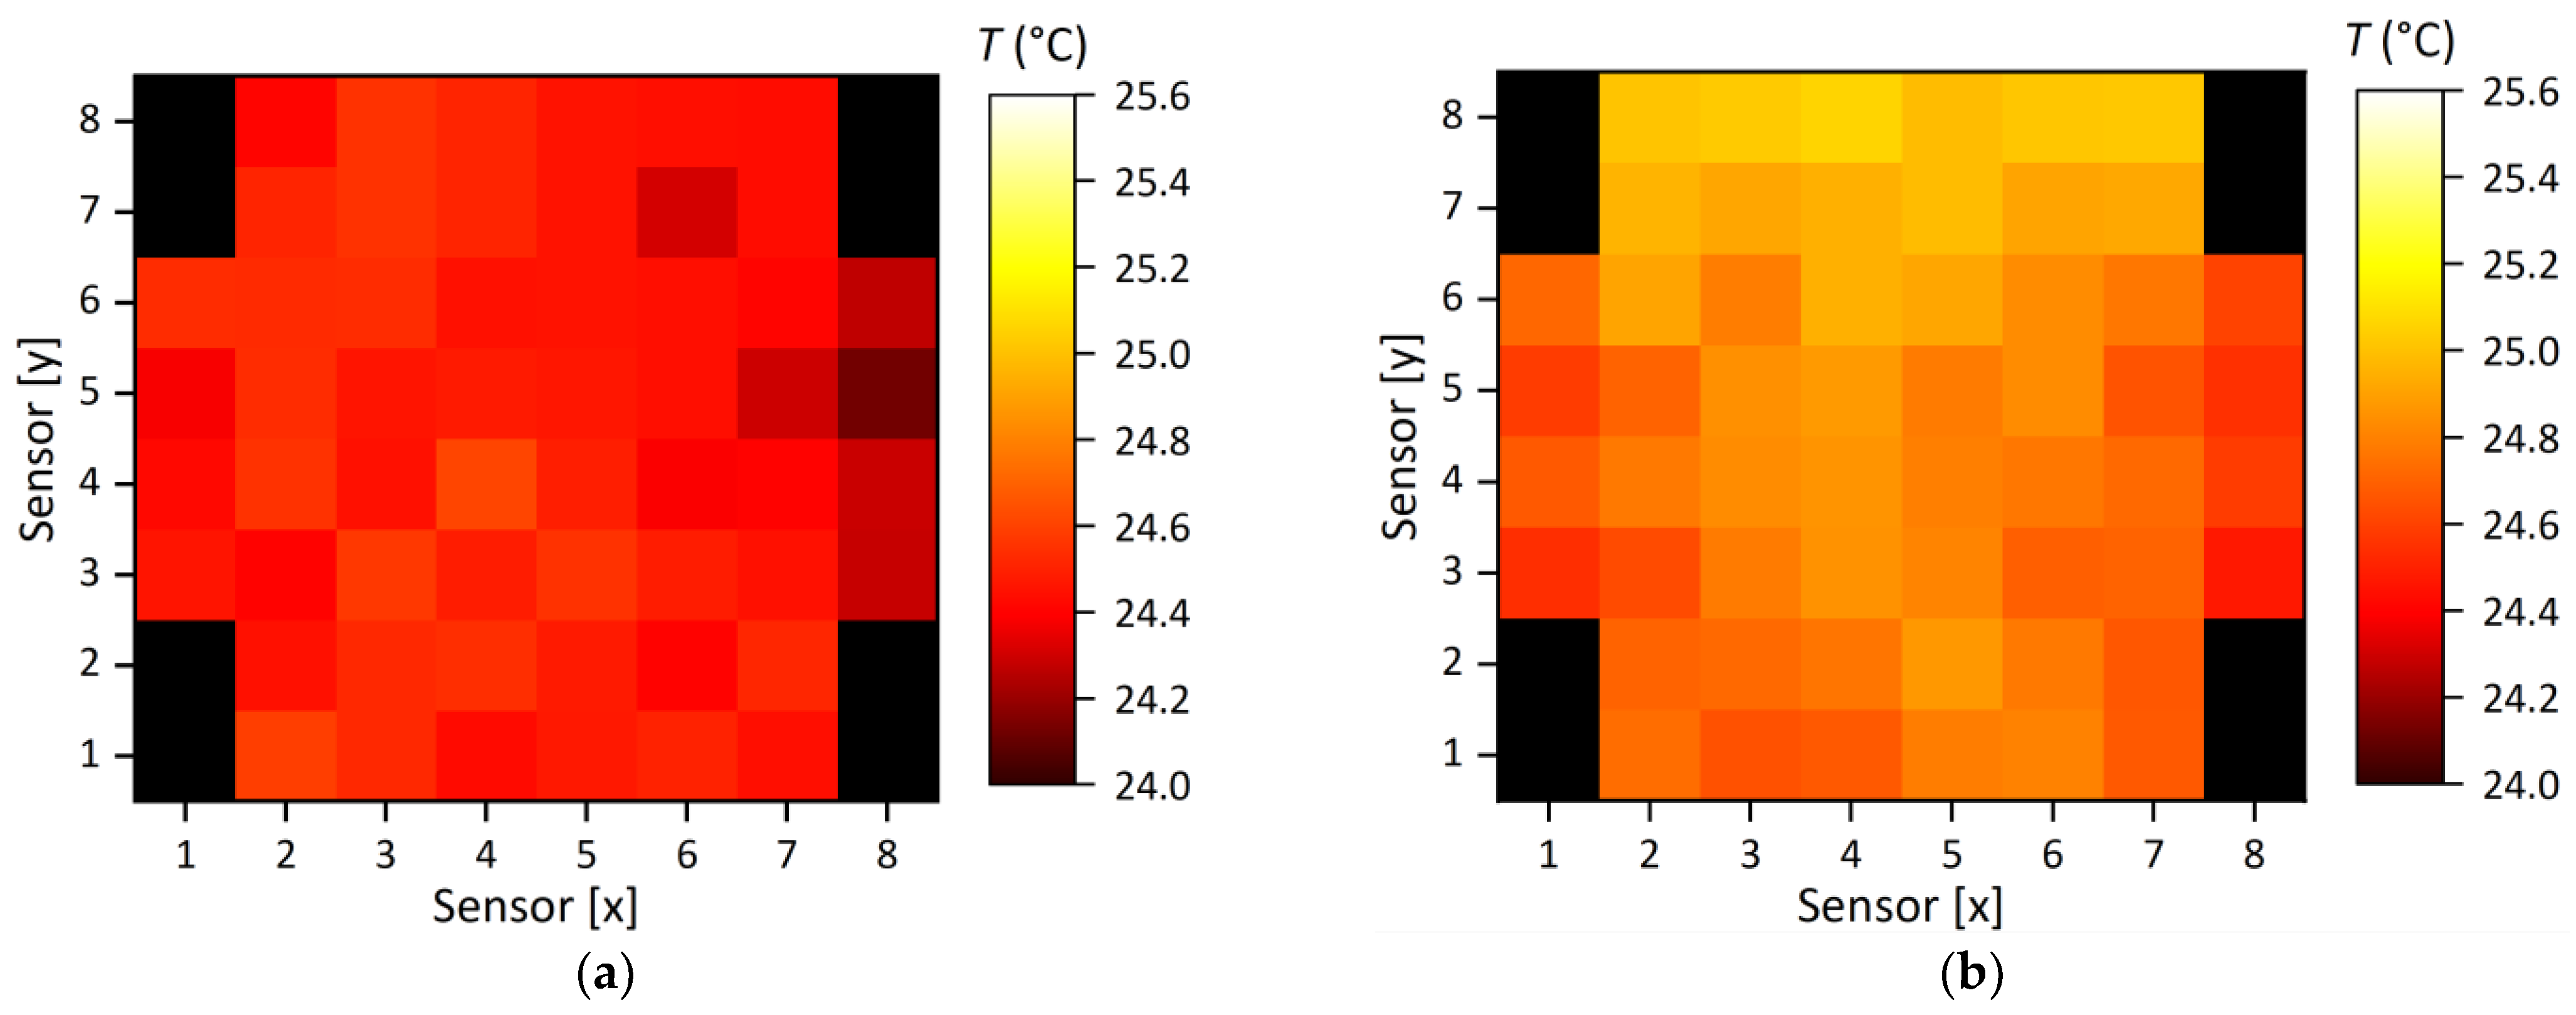
5.3. System Load Test
6. Conclusions
Author Contributions
Funding
Institutional Review Board Statement
Informed Consent Statement
Data Availability Statement
Acknowledgments
Conflicts of Interest
References
- Eshetu, G.G.; Zhang, H.; Judez, X.; Adenusi, H.; Armand, M.; Passerini, S.; Figgemeier, E. Production of high-energy Li-ion batteries comprising silicon-containing anodes and insertion-type cathodes. Nat. Commun. 2021, 12, 5459. [Google Scholar] [CrossRef] [PubMed]
- Shi, Q.; Zhou, J.; Ullah, S.; Yang, X.; Tokarska, K.; Trzebicka, B.; Ta, H.Q.; Rümmeli, M.H. A review of recent developments in Si/C composite materials for Li-ion batteries. Energy Stor. Mater. 2021, 34, 735–754. [Google Scholar] [CrossRef]
- Jiang, M.; Danilov, D.L.; Eichel, R.-A.; Notten, P.H.L. A Review of Degradation Mechanisms and Recent Achievements for Ni-Rich Cathode-Based Li-Ion Batteries. Adv. Energy Mater. 2021, 11, 2103005. [Google Scholar] [CrossRef]
- Judez, X.; Eshetu, G.G.; Li, C.; Rodriguez-Martinez, L.M.; Zhang, H.; Armand, M. Opportunities for Rechargeable Solid-State Batteries Based on Li-Intercalation Cathodes. Joule 2018, 2, 2208–2224. [Google Scholar] [CrossRef]
- Yang, L.; Deng, W.; Xu, W.; Tian, Y.; Wang, A.; Wang, B.; Zou, G.; Hou, H.; Deng, W.; Ji, X. Olivine LiMn x Fe 1−x PO 4 cathode materials for lithium ion batteries: Restricted factors of rate performances. J. Mater. Chem. A 2021, 9, 14214–14232. [Google Scholar] [CrossRef]
- Choi, D.; Shamim, N.; Crawford, A.; Huang, Q.; Vartanian, C.K.; Viswanathan, V.V.; Paiss, M.D.; Alam, M.J.E.; Reed, D.M.; Sprenkle, V.L. Li-ion battery technology for grid application. J. Power Sources 2021, 511, 230419. [Google Scholar] [CrossRef]
- Masias, A.; Marcicki, J.; Paxton, W.A. Opportunities and Challenges of Lithium Ion Batteries in Automotive Applications. ACS Energy Lett. 2021, 6, 621–630. [Google Scholar] [CrossRef]
- Gandoman, F.H.; Behi, H.; Berecibar, M.; Jaguemont, J.; Aleem, S.H.A.; Behi, M.; van Mierlo, J. Reliability evaluation of Li-ion batteries for electric vehicles applications from the thermal perspectives. In Uncertainties in Modern Power Systems; Elsevier: Amsterdam, The Netherlands, 2021; pp. 563–587. ISBN 9780128204917. [Google Scholar]
- Nitta, N.; Wu, F.; Lee, J.T.; Yushin, G. Li-ion battery materials: Present and future. Mater. Today 2015, 18, 252–264. [Google Scholar] [CrossRef]
- European Commission. Joint Research Centre. Li-Ion Batteries for Mobility and Stationary Storage Applications: Scenarios for Costs and Market Growth; Publications Office: Petten, The Netherlands, 2018.
- Saez-de-Ibarra, A.; Martinez-Laserna, E.; Stroe, D.-I.; Swierczynski, M.; Rodriguez, P. Sizing Study of Second Life Li-ion Batteries for Enhancing Renewable Energy Grid Integration. IEEE Trans. Ind. Applicat. 2016, 52, 4999–5008. [Google Scholar] [CrossRef]
- Birkl, C.R.; Frost, D.F.; Bizeray, A.M.; Richardson, R.R.; Howey, D.A. Modular converter system for low-cost off-grid energy storage using second life li-ion batteries. In Proceedings of the 2014 IEEE Global Humanitarian Technology Conference (GHTC 2014), San Jose, CA, USA, 10–13 October 2014; IEEE: Piscataway, NJ, USA, 2014; pp. 192–199, ISBN 978-1-4799-7193-0. [Google Scholar]
- Diouf, B.; Pode, R. Potential of lithium-ion batteries in renewable energy. J. Renew. Energy 2015, 76, 375–380. [Google Scholar] [CrossRef]
- Waldmann, T.; Quinn, J.B.; Richter, K.; Kasper, M.; Tost, A.; Klein, A.; Wohlfahrt-Mehrens, M. Electrochemical, Post-Mortem, and ARC Analysis of Li-Ion Cell Safety in Second-Life Applications. J. Electrochem. Soc. 2017, 164, A3154–A3162. [Google Scholar] [CrossRef]
- Chen, Y.; Kang, Y.; Zhao, Y.; Wang, L.; Liu, J.; Li, Y.; Liang, Z.; He, X.; Li, X.; Tavajohi, N.; et al. A review of lithium-ion battery safety concerns: The issues, strategies, and testing standards. J. Energy Chem. 2021, 59, 83–99. [Google Scholar] [CrossRef]
- Al-Zareer, M.; Dincer, I.; Rosen, M.A. A review of novel thermal management systems for batteries. Int. J. Energy Res. 2018, 42, 3182–3205. [Google Scholar] [CrossRef]
- Raj, A.; Rodrigues, M.-T.F.; Abraham, D.P. Rate-Dependent Aging Resulting from Fast Charging of Li-Ion Cells. J. Electrochem. Soc. 2020, 167, 120517. [Google Scholar] [CrossRef]
- Preger, Y.; Barkholtz, H.M.; Fresquez, A.; Campbell, D.L.; Juba, B.W.; Romàn-Kustas, J.; Ferreira, S.R.; Chalamala, B. Degradation of Commercial Lithium-Ion Cells as a Function of Chemistry and Cycling Conditions. J. Electrochem. Soc. 2020, 167, 120532. [Google Scholar] [CrossRef]
- Golubkov, A.W.; Fuchs, D.; Wagner, J.; Wiltsche, H.; Stangl, C.; Fauler, G.; Voitic, G.; Thaler, A.; Hacker, V. Thermal-runaway experiments on consumer Li-ion batteries with metal-oxide and olivin-type cathodes. RSC Adv. 2014, 4, 3633–3642. [Google Scholar] [CrossRef]
- Aichberger, C.; Jungmeier, G. Environmental Life Cycle Impacts of Automotive Batteries Based on a Literature Review. Energies 2020, 13, 6345. [Google Scholar] [CrossRef]
- Ecker, M.; Nieto, N.; Käbitz, S.; Schmalstieg, J.; Blanke, H.; Warnecke, A.; Sauer, D.U. Calendar and cycle life study of Li(NiMnCo)O2-based 18650 lithium-ion batteries. J. Power Sources 2014, 248, 839–851. [Google Scholar] [CrossRef]
- Waldmann, T.; Wilka, M.; Kasper, M.; Fleischhammer, M.; Wohlfahrt-Mehrens, M. Temperature dependent ageing mechanisms in Lithium-ion batteries—A Post-Mortem study. J. Power Sources 2014, 262, 129–135. [Google Scholar] [CrossRef]
- Bozorgchenani, M.; Kucinskis, G.; Wohlfahrt-Mehrens, M.; Waldmann, T. Experimental Confirmation of C-Rate Dependent Minima Shifts in Arrhenius Plots of Li-Ion Battery Aging. J. Electrochem. Soc. 2022, 169, 30509. [Google Scholar] [CrossRef]
- Ma, S.; Jiang, M.; Tao, P.; Song, C.; Wu, J.; Wang, J.; Deng, T.; Shang, W. Temperature effect and thermal impact in lithium-ion batteries: A review. Prog. Nat. Sci. Mater. 2018, 28, 653–666. [Google Scholar] [CrossRef]
- You, L.; Duan, K.; Zhang, G.; Song, W.; Yang, T.; Song, X.; Wang, S.; Liu, J. N, N -Dimethylformamide Electrolyte Additive Via a Blocking Strategy Enables High-Performance Lithium-Ion Battery under High Temperature. J. Phys. Chem. C 2019, 123, 5942–5950. [Google Scholar] [CrossRef]
- Zhao, H.; Yu, X.; Li, J.; Li, B.; Shao, H.; Li, L.; Deng, Y. Film-forming electrolyte additives for rechargeable lithium-ion batteries: Progress and outlook. J. Mater. Chem. A 2019, 7, 8700–8722. [Google Scholar] [CrossRef]
- Xia, J.; Ma, L.; Dahn, J.R. Improving the long-term cycling performance of lithium-ion batteries at elevated temperature with electrolyte additives. J. Power Sources 2015, 287, 377–385. [Google Scholar] [CrossRef]
- Eom, J.-Y.; Jung, I.-H.; Lee, J.-H. Effects of vinylene carbonate on high temperature storage of high voltage Li-ion batteries. J. Power Sources 2011, 196, 9810–9814. [Google Scholar] [CrossRef]
- Kang, K.S.; Choi, S.; Song, J.; Woo, S.-G.; Jo, Y.N.; Choi, J.; Yim, T.; Yu, J.-S.; Kim, Y.-J. Effect of additives on electrochemical performance of lithium nickel cobalt manganese oxide at high temperature. J. Power Sources 2014, 253, 48–54. [Google Scholar] [CrossRef]
- Chang, W.J.; Kim, S.H.; Hwang, J.; Chang, J.; Yang, D.W.; Kwon, S.S.; Kim, J.T.; Lee, W.W.; Lee, J.H.; Park, H.; et al. Controlling electric potential to inhibit solid-electrolyte interphase formation on nanowire anodes for ultrafast lithium-ion batteries. Nat. Commun. 2018, 9, 3461. [Google Scholar] [CrossRef]
- Werner, D.; Paarmann, S.; Wiebelt, A.; Wetzel, T. Inhomogeneous Temperature Distribution Affecting the Cyclic Aging of Li-Ion Cells. Part I: Experimental Investigation. Batteries 2020, 6, 13. [Google Scholar] [CrossRef]
- Park, S.; Jung, D. Battery cell arrangement and heat transfer fluid effects on the parasitic power consumption and the cell temperature distribution in a hybrid electric vehicle. J. Power Sources 2013, 227, 191–198. [Google Scholar] [CrossRef]
- Pesaran, A.; Vlahinos, A.; Burch, S. Thermal Performance of EV and HEV Battery Modules and Packs. In Proceedings of the 14th International Electric Vehicel Symposium, Orlando, FL, USA, 15–17 December 1997. [Google Scholar]
- Zolot, M.; Pesaran, A.A.; Mihalic, M. Thermal Evaluation of Toyota Prius Battery Pack. In SAE Technical Paper Series; Future Car Congress, JUN. 03, 2002; SAE International400 Commonwealth Drive: Warrendale, PA, USA, 2002. [Google Scholar]
- Wang, Y.; Gao, Q.; Wang, G.; Lu, P.; Zhao, M.; Bao, W. A review on research status and key technologies of battery thermal management and its enhanced safety. Int. J. Energy Res. 2018, 42, 4008–4033. [Google Scholar] [CrossRef]
- Chen, D.; Jiang, J.; Kim, G.-H.; Yang, C.; Pesaran, A. Comparison of different cooling methods for lithium ion battery cells. Appl. Therm. Eng. 2016, 94, 846–854. [Google Scholar] [CrossRef]
- Tran, T.-H.; Harmand, S.; Desmet, B.; Filangi, S. Experimental investigation on the feasibility of heat pipe cooling for HEV/EV lithium-ion battery. Appl. Therm. Eng. 2014, 63, 551–558. [Google Scholar] [CrossRef]
- Rao, Z.; Huo, Y.; Liu, X. Experimental study of an OHP-cooled thermal management system for electric vehicle power battery. Exp. Therm. Fluid Sci. 2014, 57, 20–26. [Google Scholar] [CrossRef]
- Al-Zareer, M.; Dincer, I.; Rosen, M.A. Novel thermal management system using boiling cooling for high-powered lithium-ion battery packs for hybrid electric vehicles. J. Power Sources 2017, 363, 291–303. [Google Scholar] [CrossRef]
- Kizilel, R.; Sabbah, R.; Selman, J.R.; Al-Hallaj, S. An alternative cooling system to enhance the safety of Li-ion battery packs. J. Power Sources 2009, 194, 1105–1112. [Google Scholar] [CrossRef]
- Sabbah, R.; Kizilel, R.; Selman, J.R.; Al-Hallaj, S. Active (air-cooled) vs. passive (phase change material) thermal management of high power lithium-ion packs: Limitation of temperature rise and uniformity of temperature distribution. J. Power Sources 2008, 182, 630–638. [Google Scholar] [CrossRef]
- Wilke, S.; Schweitzer, B.; Khateeb, S.; Al-Hallaj, S. Preventing thermal runaway propagation in lithium ion battery packs using a phase change composite material: An experimental study. J. Power Sources 2017, 340, 51–59. [Google Scholar] [CrossRef]
- Jarrett, A.; Kim, I.Y. Design optimization of electric vehicle battery cooling plates for thermal performance. J. Power Sources 2011, 196, 10359–10368. [Google Scholar] [CrossRef]
- Lan, C.; Xu, J.; Qiao, Y.; Ma, Y. Thermal management for high power lithium-ion battery by minichannel aluminum tubes. Appl. Therm. Eng. 2016, 101, 284–292. [Google Scholar] [CrossRef]
- Shang, Z.; Qi, H.; Liu, X.; Ouyang, C.; Wang, Y. Structural optimization of lithium-ion battery for improving thermal performance based on a liquid cooling system. Int. J. Heat Mass Transf. 2019, 130, 33–41. [Google Scholar] [CrossRef]
- Jarrett, A.; Kim, I.Y. Influence of operating conditions on the optimum design of electric vehicle battery cooling plates. J. Power Sources 2014, 245, 644–655. [Google Scholar] [CrossRef]
- Patil, M.; Panchal, S.; Kim, N.; Lee, M.-Y. Cooling Performance Characteristics of 20 Ah Lithium-Ion Pouch Cell with Cold Plates along Both Surfaces. Energies 2018, 11, 2550. [Google Scholar] [CrossRef]
- Shaaia, R.; Brisbane, R.M. Battery Cell Cooling. Plate. Patent US20160043454A1, 7 August 2014. [Google Scholar]
- Obasih, K.; Mack, R.J.; Houchin-Miller, G.P.; Dekeuster, R.M.; Fuhr, J.D. Battery System Having an External Thermal Management. System. Patent EP2697860B1, 12 April 2012. [Google Scholar]
- Maguire, P.D.; Burrows, N.R. Extended Battery Cooling. Fin. Patent US9509018B2, 16 January 2014. [Google Scholar]
- Götz, S.; Jaensch, M.; Leidig, P. Battery. Module. Patent DE102018100394A1, 1 October 2018. [Google Scholar]
- Newman, J.; Tiedemann, W. Porous-electrode theory with battery applications. AIChE J. 1975, 21, 25–41. [Google Scholar] [CrossRef]
- Doyle, M.; Newman, J. The use of mathematical modeling in the design of lithium/polymer battery systems. Electrochim. Acta 1995, 40, 2191–2196. [Google Scholar] [CrossRef]
- Bandhauer, T.M.; Garimella, S.; Fuller, T.F. Temperature-dependent electrochemical heat generation in a commercial lithium-ion battery. J. Power Sources 2014, 247, 618–628. [Google Scholar] [CrossRef]
- Ekström, H.; Fridholm, B.; Lindbergh, G. Comparison of lumped diffusion models for voltage prediction of a lithium-ion battery cell during dynamic loads. J. Power Sources 2018, 402, 296–300. [Google Scholar] [CrossRef]
- COMSOL AB. COMSOL Multiphysics; COMSOL AB: Stockholm, Sweden, 2019. [Google Scholar]
- Petzl, M.; Danzer, M.A. Advancements in OCV Measurement and Analysis for Lithium-Ion Batteries. IEEE Trans. Energy Convers. 2013, 28, 675–681. [Google Scholar] [CrossRef]
- Baronti, F.; Zamboni, W.; Roncella, R.; Saletti, R.; Spagnuolo, G. Open-circuit voltage measurement of Lithium-Iron-Phosphate batteries. In Proceedings of the 2015 IEEE International Instrumentation and Measurement Technology Conference (I2MTC), Pisa, Italy, 11–14 May 2015; IEEE: New York, NY, USA, 2015; pp. 1711–1716, ISBN 978-1-4799-6114-6. [Google Scholar]
- Plett, G. Battery Management Systems, Volume I; Artech House: Norwood, MA, USA, 2015; ISBN 978-1-63081-023-8. [Google Scholar]
- Fan, G.; Pan, K.; Canova, M.; Marcicki, J.; Yang, X.G. Modeling of Li-Ion Cells for Fast Simulation of High C-Rate and Low Temperature Operations. J. Electrochem. Soc. 2016, 163, A666–A676. [Google Scholar] [CrossRef]
- Marcicki, J.; Yang, X.G. Model-Based Estimation of Reversible Heat Generation in Lithium-Ion Cells. J. Electrochem. Soc. 2014, 161, A1794–A1800. [Google Scholar] [CrossRef]
- Korthauer, R. Handbuch Lithium-Ionen-Batterien; Springer Berlin Heidelberg: Berlin/Heidelberg, Germany, 2013; ISBN 978-3-642-30652-5. [Google Scholar]
- Maleki, H.; Wang, H.; Porter, W.; Hallmark, J. Li-Ion polymer cells thermal property changes as a function of cycle-life. J. Power Sources 2014, 263, 223–230. [Google Scholar] [CrossRef]
- Chen, M.; Bai, F.; Song, W.; Lv, J.; Lin, S.; Feng, Z.; Li, Y.; Ding, Y. A multilayer electro-thermal model of pouch battery during normal discharge and internal short circuit process. Appl. Therm. Eng. 2017, 120, 506–516. [Google Scholar] [CrossRef]
- Viswanathan, V.V.; Choi, D.; Wang, D.; Xu, W.; Towne, S.; Williford, R.E.; Zhang, J.-G.; Liu, J.; Yang, Z. Effect of entropy change of lithium intercalation in cathodes and anodes on Li-ion battery thermal management. J. Power Sources 2010, 195, 3720–3729. [Google Scholar] [CrossRef]
- Bischof, S. Rekonfigurierbare Lithium-Ionen-Batterien für den Betrieb von Industriellen Produktionsstätten. Ph.D. Thesis, KIT, Karlsruhe, Germany, 2020. [Google Scholar]
- Goutam, S.; Nikolian, A.; Jaguemont, J.; Smekens, J.; Omar, N.; van Dan Bossche, P.; van Mierlo, J. Three-dimensional electro-thermal model of li-ion pouch cell: Analysis and comparison of cell design factors and model assumptions. Appl. Therm. Eng. 2017, 126, 796–808. [Google Scholar] [CrossRef]
- Zhang, T.; Gao, Q.; Wang, G.; Gu, Y.; Wang, Y.; Bao, W.; Zhang, D. Investigation on the promotion of temperature uniformity for the designed battery pack with liquid flow in cooling process. Appl. Therm. Eng. 2017, 116, 655–662. [Google Scholar] [CrossRef]
- Bai, F.; Chen, M.; Song, W.; Feng, Z.; Li, Y.; Ding, Y. Thermal management performances of PCM/water cooling-plate using for lithium-ion battery module based on non-uniform internal heat source. Appl. Therm. Eng. 2017, 126, 17–27. [Google Scholar] [CrossRef]
- Huo, Y.; Rao, Z.; Liu, X.; Zhao, J. Investigation of power battery thermal management by using mini-channel cold plate. Energy Convers. Manag. 2015, 89, 387–395. [Google Scholar] [CrossRef]


Publisher’s Note: MDPI stays neutral with regard to jurisdictional claims in published maps and institutional affiliations. |
© 2022 by the authors. Licensee MDPI, Basel, Switzerland. This article is an open access article distributed under the terms and conditions of the Creative Commons Attribution (CC BY) license (https://creativecommons.org/licenses/by/4.0/).
Share and Cite
Feinauer, M.; Uhlmann, N.; Ziebert, C.; Blank, T. Simulation, Set-Up, and Thermal Characterization of a Water-Cooled Li-Ion Battery System. Batteries 2022, 8, 177. https://doi.org/10.3390/batteries8100177
Feinauer M, Uhlmann N, Ziebert C, Blank T. Simulation, Set-Up, and Thermal Characterization of a Water-Cooled Li-Ion Battery System. Batteries. 2022; 8(10):177. https://doi.org/10.3390/batteries8100177
Chicago/Turabian StyleFeinauer, Max, Nils Uhlmann, Carlos Ziebert, and Thomas Blank. 2022. "Simulation, Set-Up, and Thermal Characterization of a Water-Cooled Li-Ion Battery System" Batteries 8, no. 10: 177. https://doi.org/10.3390/batteries8100177
APA StyleFeinauer, M., Uhlmann, N., Ziebert, C., & Blank, T. (2022). Simulation, Set-Up, and Thermal Characterization of a Water-Cooled Li-Ion Battery System. Batteries, 8(10), 177. https://doi.org/10.3390/batteries8100177