Article

Crest Factor Optimization for Multisine Excitation Signals with Logarithmic Frequency Distribution Based on a Hybrid Stochastic-Deterministic Optimization Algorithm

Measurement and Sensor Technology, Faculty of Electrical Engineering and Information Technology, Chemnitz University of Technology, 09111 Chemnitz, Germany
*
Author to whom correspondence should be addressed.
Batteries 2022, 8(10), 176; https://doi.org/10.3390/batteries8100176
Submission received: 16 August 2022 / Revised: 21 September 2022 / Accepted: 30 September 2022 / Published: 12 October 2022
(This article belongs to the Special Issue Feature Papers to Celebrate the First Impact Factor of Batteries)

Abstract

:
For diagnosis of batteries and fuel cells based on impedance spectroscopy, excitation signals are required, including low frequencies down to the mHz range. This leads to a long measurement time and compromises the stability condition for impedance spectroscopy. Multisine excitation signals with logarithmic frequency distribution can significantly reduce the measurement time but need optimization of the crest factor to realize a high signal-to-noise ratio at all excitation frequencies and maintain at the same time the linearity and stability conditions of impedance spectroscopy. Crest factor optimization is challenging, as the obtained results strongly depend on the initial phase values and many trials are necessary. It takes a very long time and can not be easily performed automatically up to now. In this paper, we propose a time-efficient hybrid stochastic-deterministic crest factor optimization method for multisine signals with logarithmic frequency distribution. A sigmoid transform on the multisine signal gradually transforms the multi-frequency signal into a binary-alike signal. The crest factor is significantly decreased, but the phases of the singular frequency signals remain sub-optimal. Further optimization based on the Gauss-Newton algorithm can determine the final phases, realizing a lower crest factor. The proposed method is less sensitive to initial phase values and provides more reasonable results in a reasonable time. The validation on a Samsung INR-18650-25R Lithium-ion battery cell shows that the crest factor of the optimized multisine signals has a median of 3.62 ± 0.7 within 6 min of run time, which is significantly better than the best previous work in the state-of-the-art of 3.85 ± 0.11 for the same run time.

1. Introduction

Impedance Spectroscopy is a powerful method for several applications, such as electrical material characterization [1,2], body tissue diagnosis [3,4], cancer detection [5], cable fault diagnosis [6] and identification [7]. It is suitable for the determination of state-of-charge [8] and state-of-health and aging of battery cells, such as lithium-ion and lead-acid batteries [9,10,11], as well as fuel-cells [12]. For most of these applications, the interest frequency range spans multiple decades. For example, diagnosing rechargeable batteries and fuel cell diagnostics requires a measurement frequency range from 10 mHz to a few kHz. A sinusoidal frequency sweep is the most used excitation signal in impedance spectroscopy devices, but it requires very long measurement times. Spectra measurements covering the frequency range from mHz to kHz can take fifteen minutes to several hours to measure. Multi-frequency signals provide a better alternative, help shorten the measurement time, and increase the accuracy for the same frequency range as the frequency sweep signals [13,14]. Among multi-frequency signals, multisine has been preferred because it has a high signal-to-noise ratio and realizes a good excitation energy per frequency. However, it requires signal optimization, including frequency bins and crest factor optimization, to avoid spectral leakage peaks [15,16].
A multisine excitation signal is the sum of elementary sine waves. Applying the elementary sine waves in parallel shortens the excitation and measurement time. In impedance spectroscopy, the excitation signal should not exceed the linearity region of the I-U characteristic of a device under test. Therefore the maximal amplitude of the excitation signal is, in general, limited. On the other side, according to Parseval’s theorem, the amplitude levels in the time domain correspond to the spectrum amplitude levels in the frequency domain. As the crest factor describes how the effective value of a signal is related to its maximum, it is very important for realizing a high signal power at all excitation frequencies. In this direction, the amplitude spectrum at a frequency f becomes [15]:
| S ( f ) | = σ N A 2
here N is the number of the excited frequencies, σ is the crest factor, and 
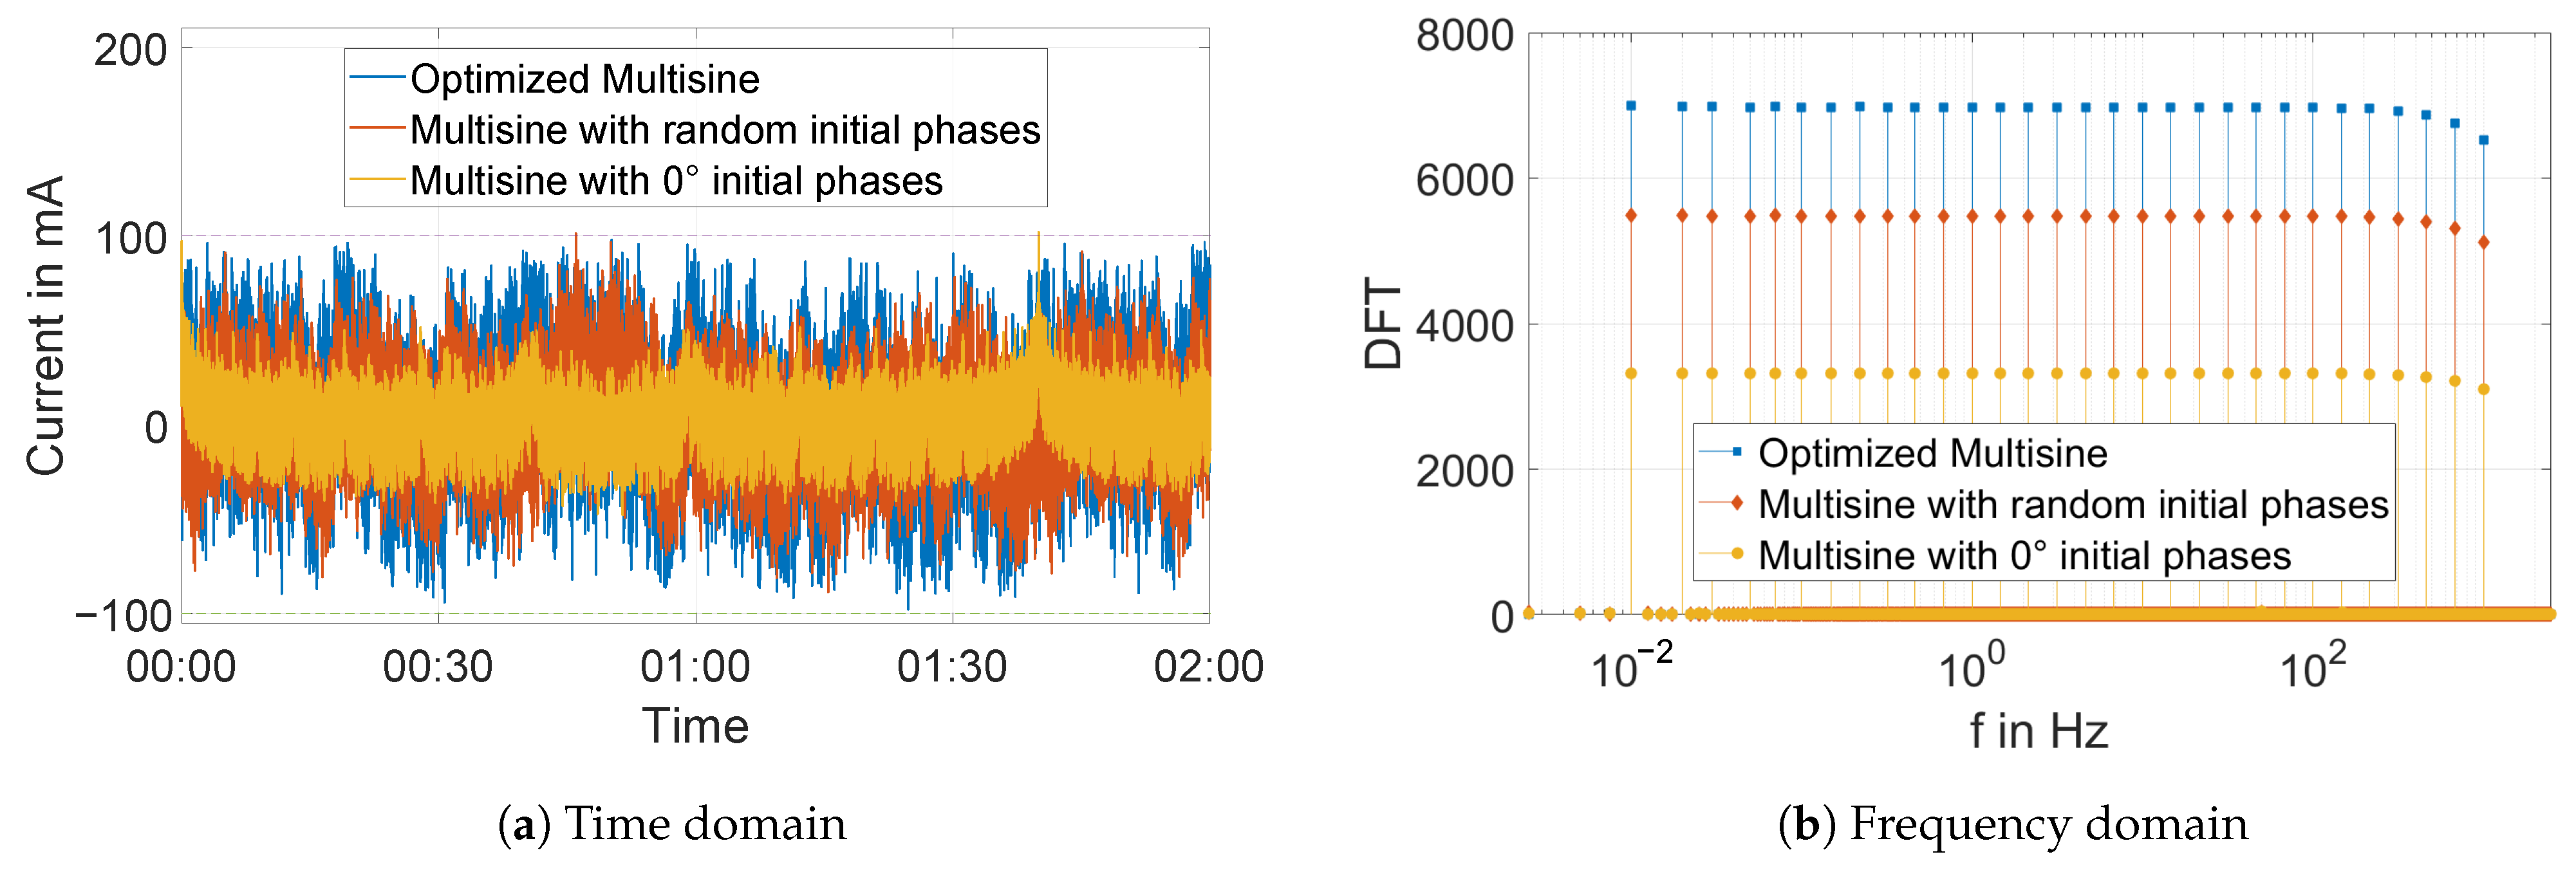
A is the global amplitude. In addition, the higher the amplitude spectrum, the less sensitive the signal is to noise, which brings the necessity of optimizing the crest factor further to avoid noise influence on the impedance spectrum. For example, taking null initial phases leads to the highest peak values in the time domain (s. Figure 1a). Using random initial phases reduces these peaks while increasing the amplitude and energy spectrum levels, as shown in Figure 1b. In this figure, only the excited frequencies have high amplitude values. The higher the amplitude spectrum, the higher the energy spectrum will be [
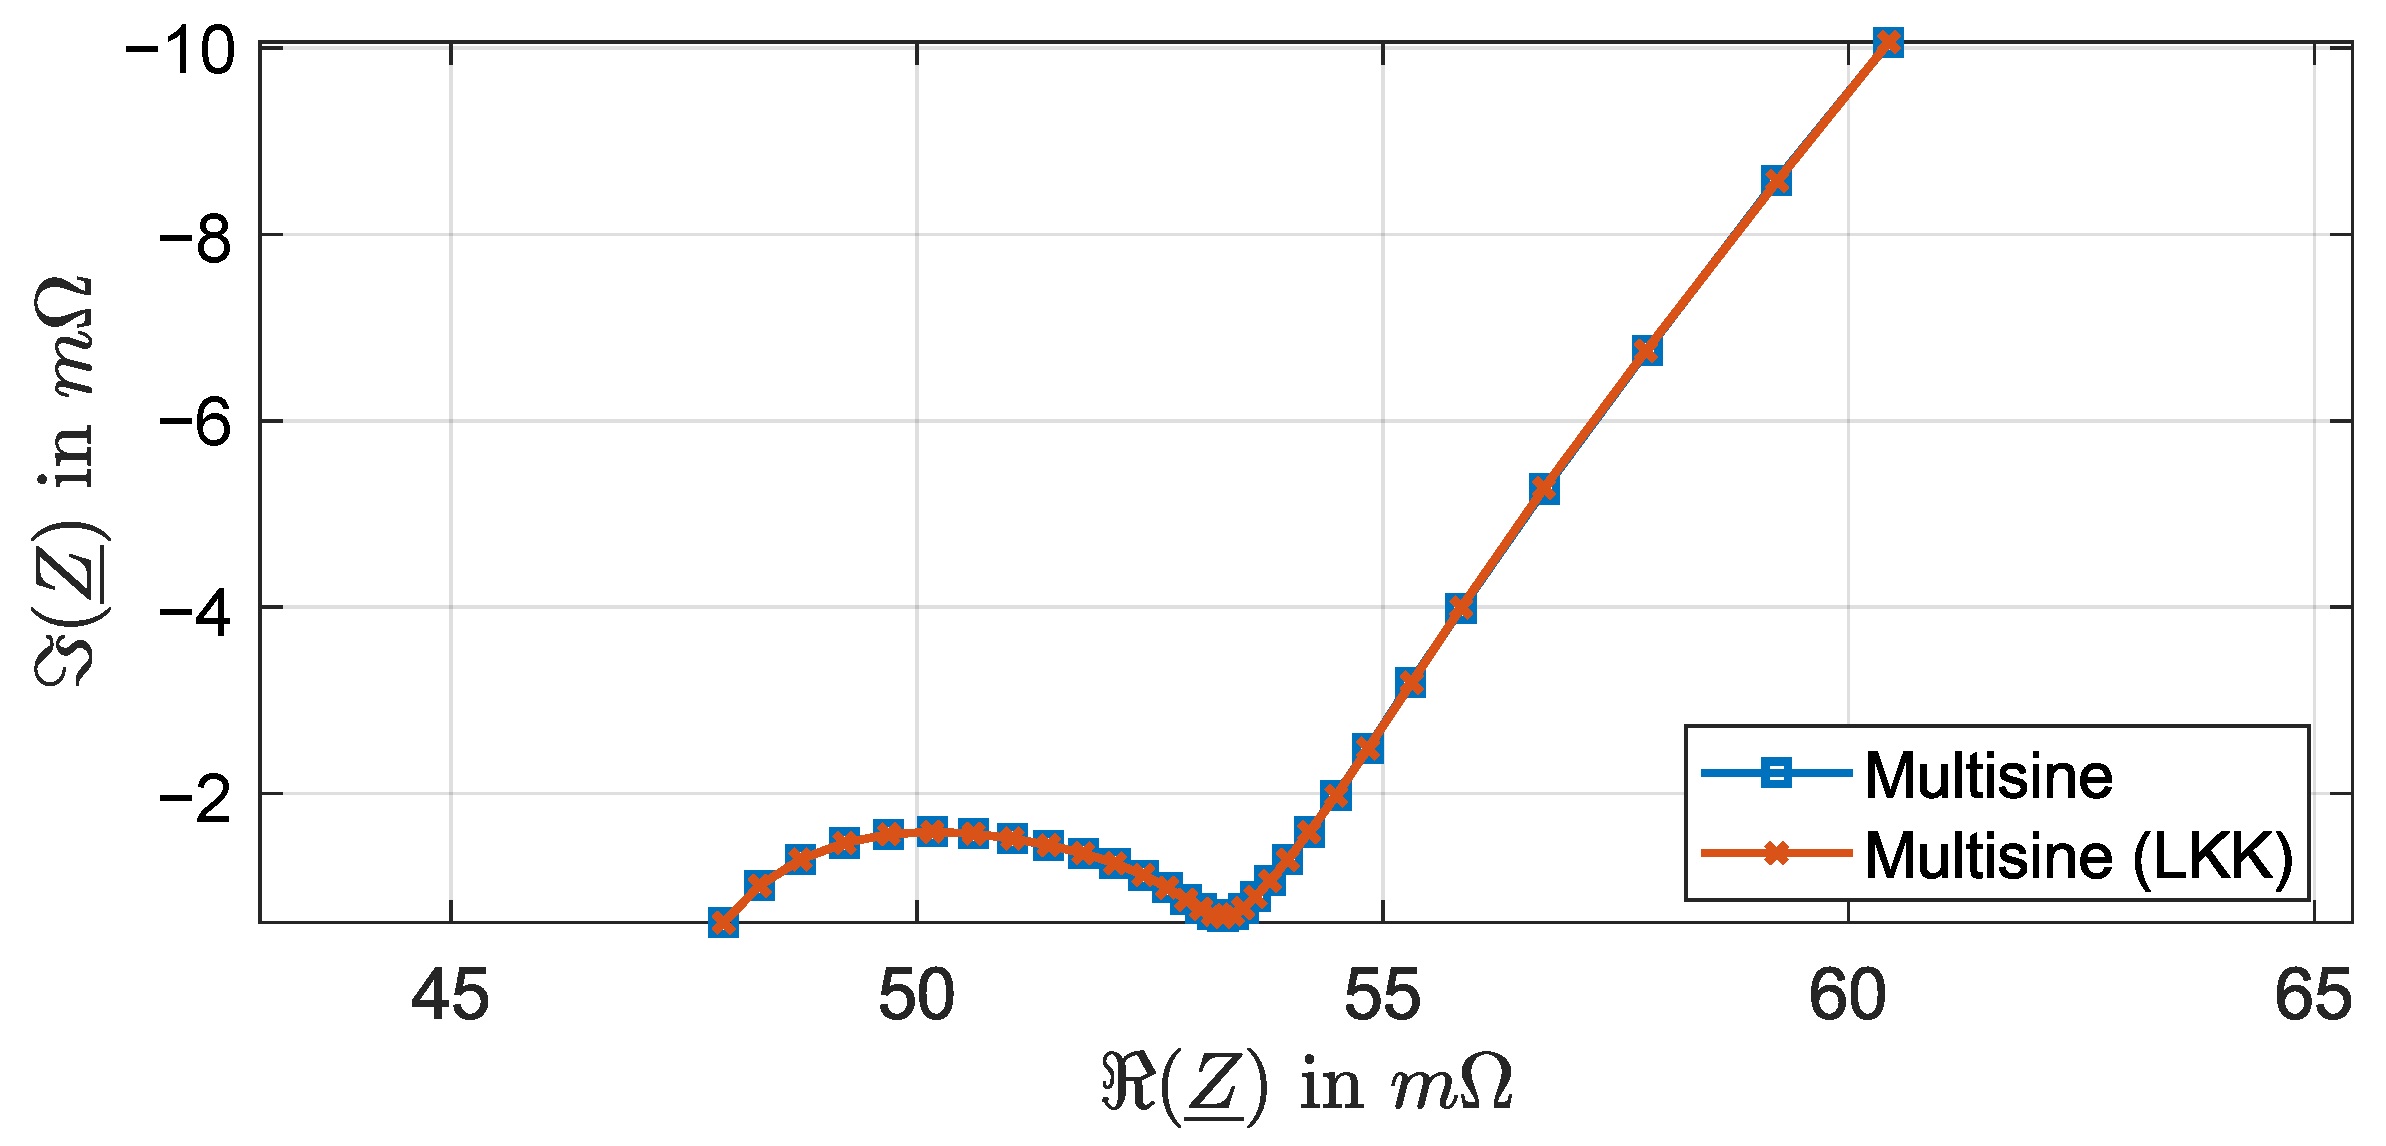
15], and therefore, the less susceptible the signal is to the noise. However, here it is practically shown that the noise can still affect the impedance spectrum associated with random initial phases multisine despite having a higher amplitude, as shown in the Nyquist curve in Figure 2a. This is further demonstrated using the Linear Kramers-Kronig consistency check, which checks for the stability, linearity, and causality of the measurement [17]. In this curve, i.e., in Figure 2b, the residual of the impedance spectrum of random phases is still higher than the impedance spectrum generated by optimized phases. Therefore, optimization is necessary in most cases to ensure a high signal-to-noise ratio.
For this purpose, so-called “crest factor optimization” methods have been developed, which optimize the initial phases of the elementary sinewaves so that the global peak amplitude values are reduced toward the effective signal value. These methods are typically used in bioimpedance spectroscopy [4], but when applied to batteries, they cause huge problems. Due to the low frequencies required for battery diagnosis, the length of the signal tends to be relatively very long. The first major problem is the dimensionality of the optimization problem, which causes the optimization method to be very slow and take hours or even days to converge. The second major problem is that the proposed methods, in the state-of-the-art, are very sensitive to the initial phases. Thereby, deterministic methods tend to converge to underwhelming local optima. In contrast, Meta-heuristics methods require considerable time and computational effort, even days, to converge to modest results, as is documented in this paper. The third major problem is the logarithmic distribution of the excited frequencies, which drastically worsens the performance of crest factor optimization techniques [15,18].
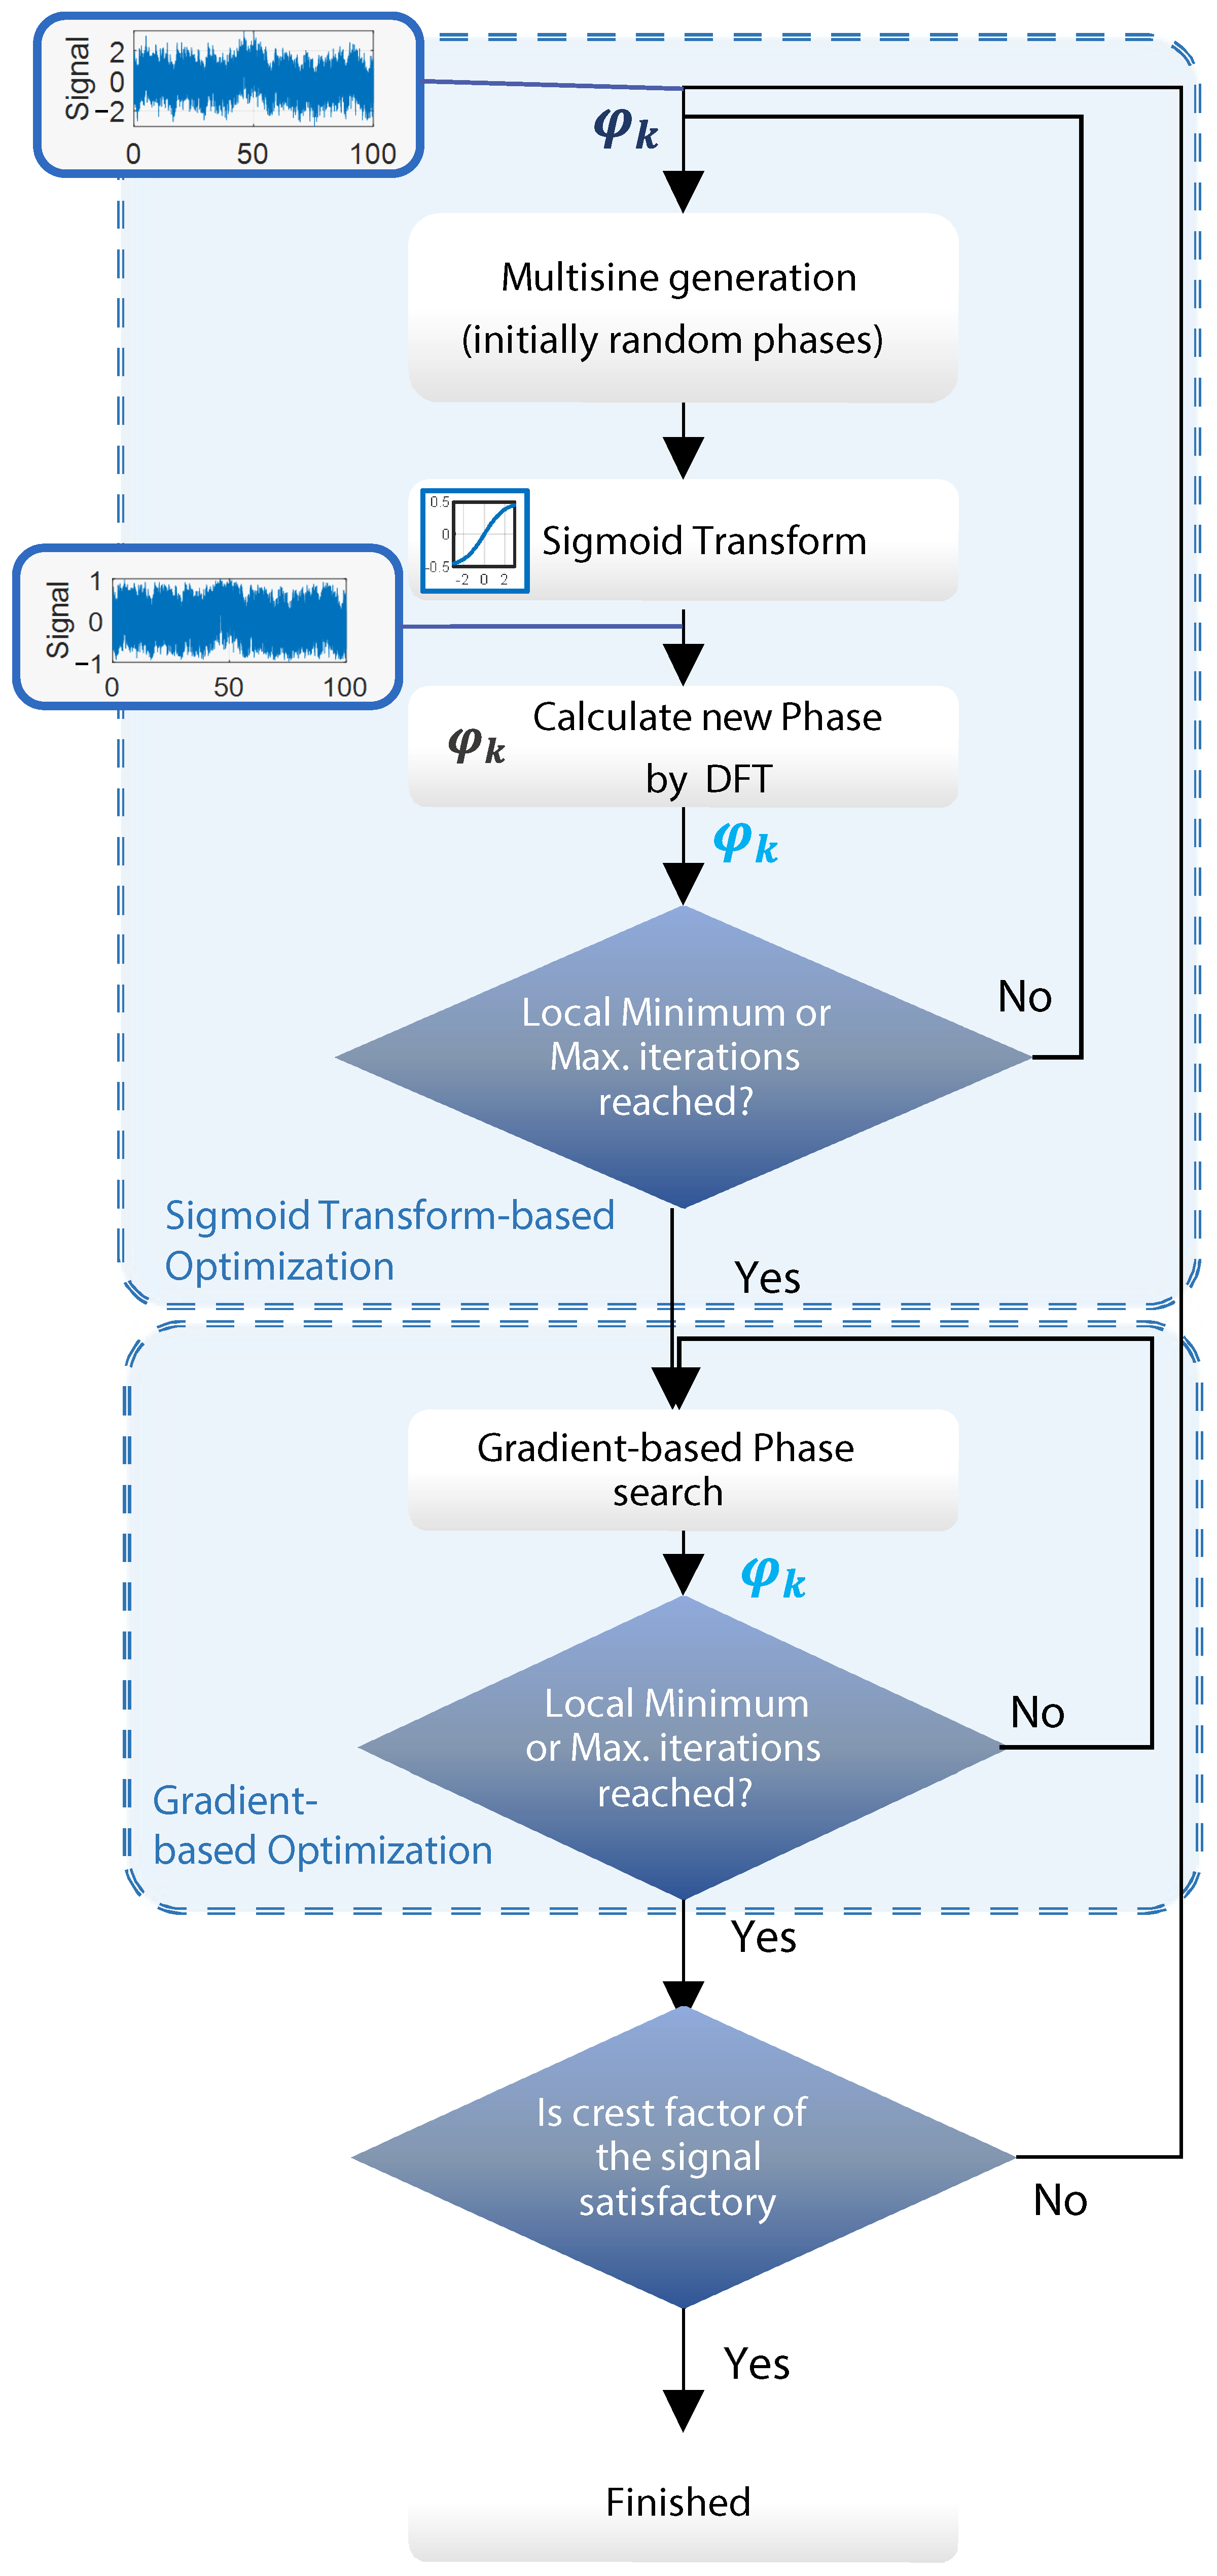
To overcome this problem, we propose a novel crest factor optimization algorithm for multisine signals with logarithmic frequency distribution in this paper. The algorithm is composed of two steps that could be run several times: Transforming the multisine into a binary-alike signal using sigmoid transform to return sub-optimal phases. Then, those phases are used as an input for Guillaume [19]’s L p norm based on the Gauss-Newton optimization algorithm for further optimization and to obtain a multisine with a lower crest factor. The proposed method returns a global sub-optimal solution, regardless of the initial phases, and is sufficient to provide good impedance measurement quality. Section two describes the state-of-the-art solution for crest factor optimization. Section three depicts the proposed method for crest factor optimization. Section four compares the proposed crest factor optimization solution to state-of-the-art methods. Finally, in section five, the proposed excitation signal is validated in a galvanostatic architecture on a lithium-ion battery cell. Throughout this manuscript, we take as a benchmark a 100-s multisine signal defined by six frequencies per decade, i.e., 31 points, with logarithmic frequency distribution between 10 mHz and 1 kHz. The frequency bins are optimized beforehand [15]. The proposed method can be directly applicable to battery and fuel cell diagnosis. Furthermore, it can be applied for other device-under-test following parameter tuning.

2. State of the Art

Crest factor optimization methods for multisine signals adjust the phases of the elementary sine waves to achieve a balance between these signals. This allows lower amplitude values for the RMS value and, thus, a lower crest factor. By definition, a crest factor is a ratio between the absolute amplitude value and the efficient value of the signal. Crest factor optimization methods can be divided into three main categories: Direct methods, iterative methods, and meta-heuristic methods, as shown in Figure 3.
Direct methods can typically return the phases directly. For example, Littlewood and Newman formulas apply to multisine signals with equidistant amplitude spectrum and are unsuitable for multisine signals with arbitrary or logarithmically distributed frequencies [20]. The Schroeder algorithm uses a phase distribution based on the power spectrum [21]. However, when confronted with a logarithmic frequency distribution, the proposed phases are likely to perform even worse than a random phase distribution [15,18].
Several iterative deterministic approaches have been proposed for crest factor optimization. Van den Bos (VDB) [22], Van der Oudera (VDO) [20], and Yang [23] are based on transformation of the multisine signal into an equivalent multifrequency signal with lower crest factor, such as non-return-to-zero binary signals. After that, the phases of the excited frequencies from this transformed signal are fed back into the multisine signal. Repeating the process several times allows the multisine to slowly transforms into a lower crest factor multisine by imitating the transformed signal. For example, VDB [22] uses signal binarization as a transformation function. The amplitudes and phases of the excited frequencies are input to the next iteration’s multisine. VDO [20], and Yang [23], on the other hand, use a clipping function to transform the signal. They do not change the amplitude spectrum but act only on the phases. All these three methods, however, may not be able to return convincing results when frequencies are logarithmically distributed [15]. Another approach is based on least-squares optimization of the L p norm of the signal [19], or of the signal directly [8]. By choosing a large L p , the obtained quantity converges to the absolute maximum of the signal. Using the Gauss-Newton algorithm, the optimization is carried out in [19]. On the other hand, [8] uses Nedler-Mead for the signal to minimize the maximum value of the signal. While these methods can converge fast, they operate locally on an initial guess and tend to return a local minimum.
The third category of crest factor optimization methods consists of meta-heuristic methods. They are based on evolutionary theory. Initially, the first generation contains a population of random initial phases. Then, a meta-heuristic tuning is done by selecting the phase shifts that provide the lowest crest factors and using these as a basis to form the next generation. On the other hand, the latest population contains sub-optimal candidates, i.e., phase shifts whose constructed multisine has the lowest crest factor. For example, genetic Algorithm [8,24] and Artificial Bee Colony (ABC) [25] have been used for optimizing the crest factors. However, when applied to a typical Li-ion impedance spectroscopy measurement scenario, where an extensive signal vector is used, the calculation becomes very computationally complex due to the need for massive memory to handle all the populations. In addition, these methods take a huge time for small signals, and it is very questionable if they can be used for large signals, such as for Li-ion battery diagnosis [25].
Nevertheless, the method by Guillaume [19] has performed as the best one for crest factor optimization of multisine signals, despite its possible convergence to local minima depending on the initial phases. Therefore, to reduce the initial phases’ influence, we propose using a pre-processed multisine signal based on the sigmoid transform algorithm, similar to the approach taken by [20,22,23]. The sigmoid transform prepares the signal by an iterative converting it to a binary-alike signal, as binary signals are known to have a low crest factor. Thereby, the signal becomes less dependent on the initial phases. In practice, the sigmoid transform is more stable and provides a better crest factor than the sign transform or clipping mentioned in [20,22,23].

3. Proposed Method

In this paper, we propose a robust method for crest factor optimization, which overcomes the high dimensionality of the optimization problem and the sensitivity to the initial phases of the single-sine signals composing the multi-sine signal. The novel method consists of two main steps. The first step consists of a non-linear transformation based on the sigmoid transform to reshape the signal into a binary-alike signal to lower the crest factor. The second phase finds a local minimum based on the phases obtained from the first step. Finally, both steps are interleaved until a constant number of iterations is reached.

3.1. Sigmoid Transform

We propose in this phase to apply a non-linear transformation to binarize the signal, as non-return-to-zero (NRZ) binary and NRZ binary-alike signals tend to have a crest factor of 1. We then reuse the phases of the transformed signal back to the multisine signal. Applying the new phases morphs the signal into a multisine signal that mimics the transformed binarized signal. In other words, more time-domain amplitude values become concentrated at the extremities, and the signal tends to have a lower crest factor. Afterward, this procedure is repeated several times. This method is already depicted in [20] based on the clipping algorithm, and similarly, in [22] using the sign function. Sign and clipping algorithms are an example of possible non-linear normalization functions.
In this paper, we propose using a sigmoid function to obtain the phases of the multisine signal, proven to be more suitable for the considered signal. The normalization is carried out using the following equation:
s n e w [ n ] = A 1 + exp ( k s [ n ] ) 0.5
where A is the gain, typically set to 1 or 2 depending on the factor k, s[n] is the original signal at time n, and k is a factor defining the slope of the sigmoid function. In our case, choosing a k factor provides a small but sufficient steepness to avoid instability is necessary. For this purpose, different steepness factors of 0.1, 0.3, 0.5, 0.7 and 1 are considered as shown in Figure 4.
The choice of the k factor was made using a statistical approach. The complete algorithm was tested using different steepness values. A steepness value of 0.5 provides sufficient conversion of the signal to binary while keeping the transformed signal very close to multisine. In Figure 4 the different steepness values are compared. Here k = 0.5 shows that the transfer function is comparable to the linear one but sufficient to transform the signal into a binary-alike and provide optimal values. Moreover, the median of the crest factor marked as a point shows the lowest value among the compared transform functions. Although the results show that choosing k = 0.7 can provide a lower crest factor in several cases, this k value tends to exaggerate the transformation process. Choosing a steepness value smaller than 0.5 results are statistically proven to be non-optimal. In contrast, values greater than 0.5 exaggerate the transformation process, and worse results than those obtained by a steepness value of 0.5 are obtained, as shown in Figure 5. Therefore, a steepness value of k = 0.5 is considered.
The complete algorithm is shown in Figure 6. Here n is the current sample of N samples. The multisine signal is defined for N f frequencies, with each frequency f k is indexed by an index k. After multisine signal generation in the time domain, a sigmoid transformation is carried out on the signal based on (2). Afterward, the phases at frequency bins of interest are calculated. Those frequency bins can be obtained after frequency bins optimization [15,16] and correspond to k = round ( f F s N ) .

3.2. Gauss-Newton L p Norm Optimization

Guillaume algorithm [19] uses a Gauss-Newton optimization algorithm based on the L p norm of the multisine signal to optimize the crest factor. Using a large and even p-norm leads to similar behavior as for L , i.e., the absolute maximum values, especially if p . Based on this assumption, it becomes possible to approximate the L as a linear function. Therefore, a gradient-based solution based on the analytical Jacobian matrix becomes possible. In practice, the choice of p = 256 ensures a sufficiently large norm without causing instability during numerical computation. For q = p / 2 = 128 , the Jacobian matrix becomes:
J [ n , k ] = q A k x [ k ] q 1 s i n ( 2 π f k n δ t + φ k )
As the residual is based on the signal itself:
r [ k ] = x [ k ] q
Finally, the phases are updated using the pseudo-matrix inverse (marked as †):
φ k φ k ( J T J + Λ ) J T r
where Λ is a positive definite matrix, which was set to ε I N f × N f

4. Comparison with the State of the Art

In this section, we propose implementing the crest factor algorithm for the impedance spectroscopy of a lithium-ion battery cell. The designed frequencies are logarithmically distributed between 10 mHz and 1 kHz. In order to assure a good spectral frequency resolution for further analysis, around 6 points per decade were chosen [26]. Therefore, 31 logarithmically distributed frequency points were taken from 10 mHz to 1 kHz. Furthermore, practically it is found that a 5-min signal ensures a correct frequency bins distribution. The frequency distribution underwent a frequency bins optimization, according to [15]. This comparison shares the same sampling rate as the measurement and signals-generating device, which is 5 kHz, as documented in the next section. This section compares the different run times, obtained crest factor, and the current amplitude spectrum of random, Yang, VDO, Guillaume, and the proposed method. ABC and GA are omitted as they did not converge within 3 h. All the algorithms were fed the same random initial phases 40 times. Due to the long optimization time, each run is limited by 400 iterations.

4.1. Run Time Comparison

In this section, we propose to compare the run duration of the considered crest factor optimization methods. For this, we use a PC running MATLAB 2021a with an Intel Core i9-11900H CPU @ 2.5 GHz, an NVIDIA GeForce RTX 3070 graphic card, 32 GB RAM, and Windows 10 as an operating system. In addition, GPU-based hardware acceleration has been used to accelerate the calculation.
All the tested methods can return an impedance spectrum of fewer than 7 min, given a maximum iteration count of 400. The run time results are plotted in a box plot in Figure 7. In this figure, the median values are presented with a blue line inside the box defined by the first and third quartile, i.e., 25% and 75% of the values. The interquartile range (IQR) defines the value fluctuations between the first and third quartile and serves as a better alternative to standard deviation in case of outliers, i.e., runs with particularly low or high values that are not consistent with other runs. The whiskers are the minimum and maximum values, which do not include exceptional cases or outliers. The outliers are represented as circles in this figure. Here sorted by fastest to slowest, choosing the best out of 400 random initial phases is proven to be the fastest method, as it requires a median time of 1 min to generate all 400 random phases. Next, VDO and Yang are the fastest actual optimization methods, as they both require a median time of 3 min to optimize the multisine with a maximum of 400 iterations. Afterward, the proposed solution has a median run time of 5 min. Finally, 400 iterations based on the Guillaume method take around 6.5 min to execute 400 iterations. It can be noted that all the methods except VDO return the results in a reasonable run duration interval.

4.2. Crest Factor Comparison

In this part, we propose to compare the efficiency of the proposed crest factor optimization methods.
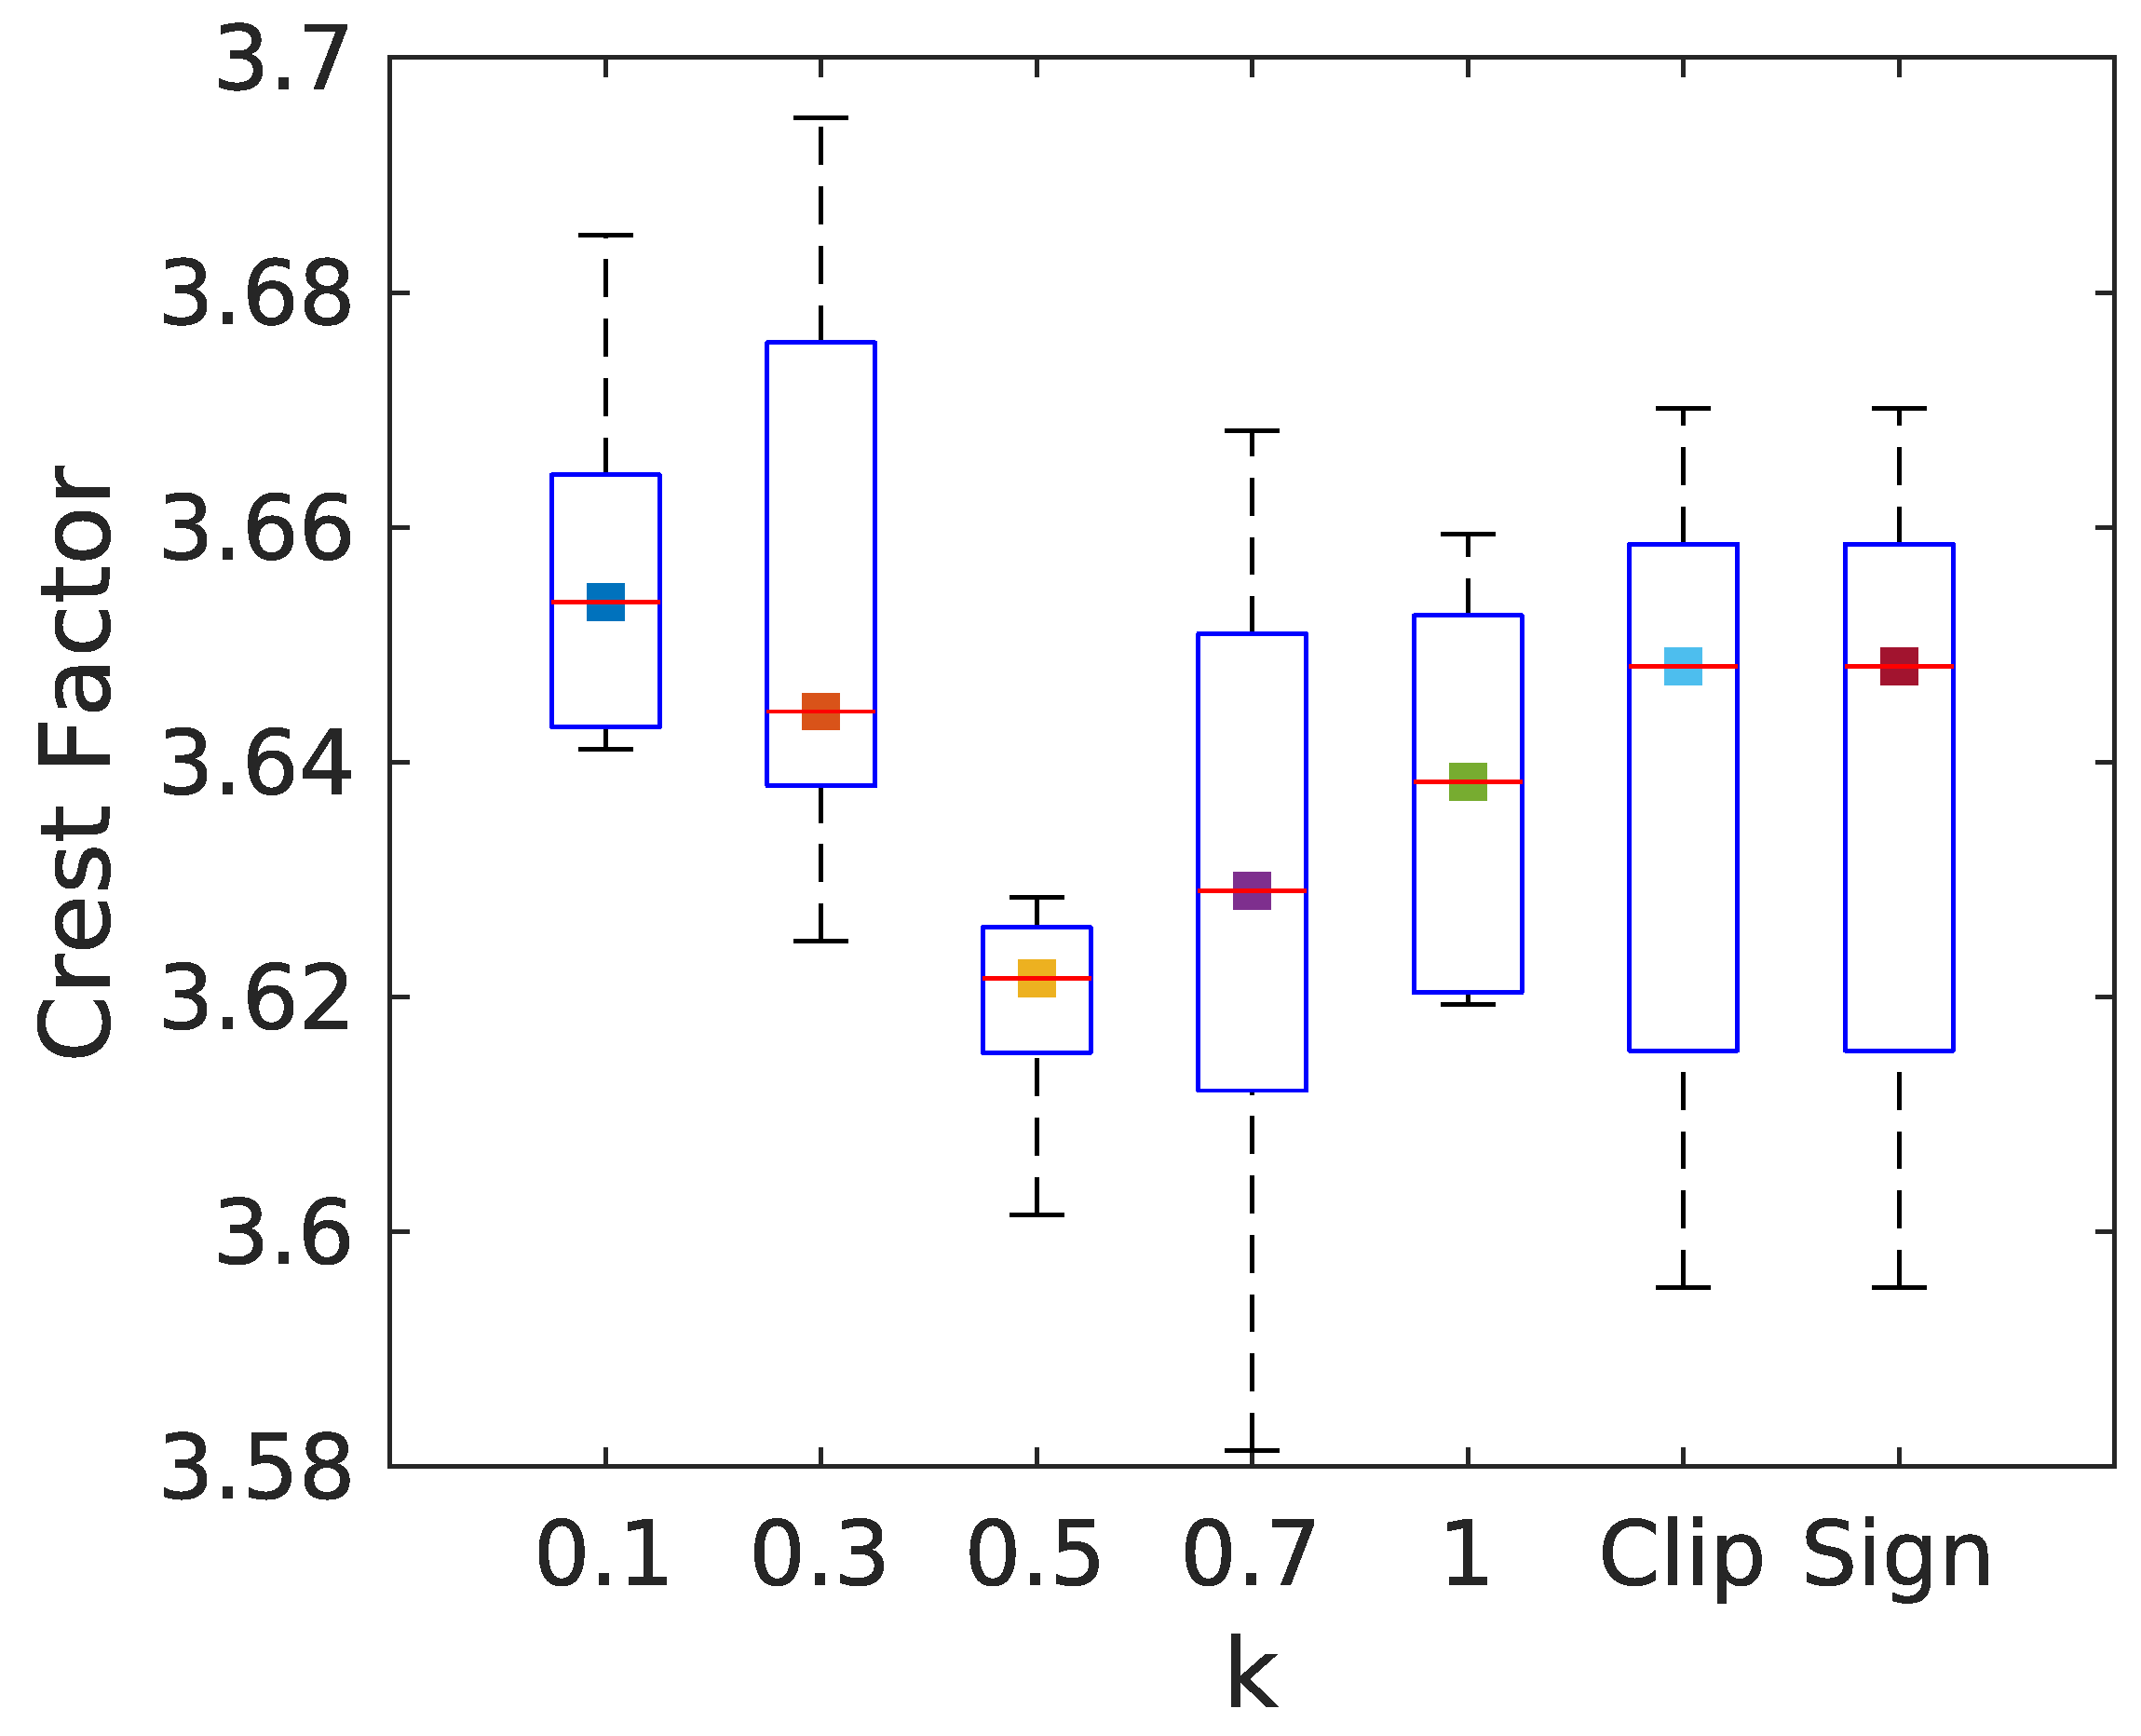
As shown in Figure 8, the clip based on the constant value method (VDO) has the lowest performance; within the 40 runs, this algorithm yields a median crest factor of 4.58. The statistical maximum and minimum of the VDO are 4.33 and 5.11. The log-clip algorithm (Yang) has better overall optimization, with a median of 4.28 and record values between 4.11 and 4.78. Next comes the best selection from 400 random initial phases, where the method has a median of 4.21 and record values between 4.12 and 4.29. This is followed by the Guillaume method, with a median crest factor of 3.85 and record values between 3.74 and 3.92. Finally, the proposed method has a median value of 3.62 and record values between 3.59 and 3.69. Therefore, the proposed method performs better crest factor optimization than the state-of-the-art methods. The minimum obtainable crest factor uses the Guillaume algorithm with a value of 3.74, which is still higher than the maximum crest factor obtainable by the proposed method at a value of 3.69. Furthermore, the proposed method’s interquartile range (IQR) is 0.1, which is lower than the direct runner-up, the random selection, at a value of 0.17. A low IQR proves that the proposed method is the least sensitive to the chosen initial phases among the compared crest factor optimization methods and is, therefore, the most reliable.

5. Implementation for Impedance Spectroscopy of Lithium-Ion Battery

5.1. Experimental Setup

This section considers a practical implementation of the proposed method on a Samsung INR-18650-25R Lithium-ion battery cell with 2500 mAh capacity. This battery cell can supply up to 100A AC and 20A DC current. As shown in Figure 9, a voltage-controlled current source is considered. The voltage-controlled current is made using Servowatt DCP130 and is controlled using a NI-cDAQ 9188 through a NI9263 DAC module. The DAC module is set at a sampling rate of 5 kHz ( δ t = 0.2   s ). To ensure measurement stability, the excitation signal is duplicated. The signal and measurement time are both 600 s.
For the measurement part, NI-9229 and NI-9239 ADC modules are used to monitor the voltage across the battery cell and the current through a shunt resistor. Here, the shunt resistor of 0.5 Ω is used. After the measurement of the voltage, the mean value is eliminated.
The signal has been implemented according to the proposed method. A time profile of the multisine optimized by the proposed method is shown in Figure 10. The signal is normalized to [−0.8 A, +0.8 A] to assure a high signal-to-noise ratio but with enough stability [14]. This allows a maximum change in SoC of 0.03% so that the stability of the battery is kept quasi-constant during the measurement, as shown in Figure 11.

5.2. Results

The voltage and current signals are measured in the time domain. They are afterward transformed using Fourier Transform to the frequency domain, where only the frequency of interest, i.e., the excited frequencies, are picked. These frequencies are distinguishable from the rest of the signal, which is affected by jitter and noise, as shown in Figure 12.
The impedance spectrum is computed following an element-wise division of the voltage and current in the frequency domain, as shown in Figure 13. In this figure, the impedance spectrum does not show apparent deformation and is visibly stable. By applying linear Kramers Kronig to check the consistency of the impedance spectrum [17], a maximum measurement non-idealities, i.e., stability of the measurement procedure, of 0.025% is detected. The RMS of the LKK magnitude residual is 55.15 ppm. The impedance spectrum of the measurement and the LKK spectrum are shown in Figure 13.
Further analysis of the residual of the measured impedance spectrum to the impedance spectrum calculated by the linear Kramers-Kronig transform shows that the most affected part is the diffusion, in which the residual peaks at the fourth lowest frequency at 0.025%, as can be seen in Figure 14. Overall, the medium and high frequencies maintain a maximum deviation of 0.01%. This fact proves the stability of the measurement overall by using the proposed multisine signal.

6. Conclusions

In this paper, we propose a novel, fast, and robust hybrid stochastic-deterministic crest factor optimization for multisine signals with wide logarithmically distributed frequencies. The proposed method combines, in an interleaved manner, stochastic crest factor optimization based on the sigmoid transform and the deterministic method based on the Gauss-Newton algorithm. The proposed method was compared to state-of-the-art methods, in which the run time is on-par with deterministic methods, is more robust, and provides a lower crest factor than the prior works in the state-of-the-art. Furthermore, the multisine signal based on the crest factor optimization method is validated on galvanostatic architecture on Lithium-ion battery. The Linear Kramers Kronig residual of the system, including the excitation signal, has a maximum of 0.025% and an RMS of 55.15 ppm.

Author Contributions

Conceptualization, methodology, investigation, and original draft: A.Y.K.; Supervision, project administration, resources, original draft, review and editing methodology: O.K. All authors have read and agreed to the published version of the manuscript.

Funding

This research was funded from Bundesministerium für Wirtschaft und Energie, within project “ImpTest—Impedanzbasierter Batterietester zum cloudbasierten Monitoring des Lebenszyklus von Batterien für die Elektromobilität und für Energiespeicher”, grant number 03EI3019B.

Institutional Review Board Statement

Not applicable.

Informed Consent Statement

Not applicable.

Data Availability Statement

Not applicable.

Conflicts of Interest

The authors declare no conflict of interest.

References

  1. Kanoun, O.; Kallel, A.Y.; Nouri, H.; Atitallah, B.B.; Haddad, D.; Hu, Z.; Talbi, M.; Al-Hamry, A.; Munja, R.; Wendler, F.; et al. Impedance Spectroscopy: Applications, Advances and Future Trends. IEEE Instrum. Meas. Mag. 2022, 25, 11–21. [Google Scholar] [CrossRef]
  2. Hu, X.; Shi, C.; Liu, X.; Zhang, J.; De Schutter, G. A review on microstructural characterization of cement-based materials by AC impedance spectroscopy. Cem. Concr. Compos. 2019, 100, 1–14. [Google Scholar] [CrossRef]
  3. Bouchaala, D.; Nouri, H.; Ben Atitallah, B.; Derbel, N.; Kanoun, O. Potential of Impedance Spectroscopy as a Manifold Non-invasive Method for Medical Applications. In Advanced Systems for Biomedical Applications; Springer: Berlin/Heidelberg, Germany, 2021; pp. 1–23. [Google Scholar]
  4. Sanchez, B.; Vandersteen, G.; Bragos, R.; Schoukens, J. Optimal multisine excitation design for broadband electrical impedance spectroscopy. Meas. Sci. Technol. 2011, 22. [Google Scholar] [CrossRef]
  5. Sabuncu, A.C.; Salifu, A.A.; Guo, S.; Miller, G.; Skorina, E.H.; Obayemi, J.D. Changes in the Dielectric Spectra of Tumors in a Xenograft Model for Colon Cancer. In Proceedings of the 2021 International Workshop on Impedance Spectroscopy (IWIS), Chemnitz, Germany, 29 September–1 October 2021; pp. 64–67. [Google Scholar]
  6. Shi, Q.; Kanoun, O. Wire fault diagnosis in the frequency domain by impedance spectroscopy. IEEE Trans. Instrum. Meas. 2015, 64, 2179–2187. [Google Scholar]
  7. Bader, O.; Haddad, D.; Kallel, A.Y.; Hassine, T.; Amara, N.E.B.; Kanoun, O. Identification of Communication Cables Based on Scattering Parameters and a Support Vector Machine Algorithm. IEEE Sens. Lett. 2021, 5, 1–4. [Google Scholar]
  8. Zappen, H.; Ringbeck, F.; Sauer, D.U. Application of time-resolved multi-sine impedance spectroscopy for lithium-ion battery characterization. Batteries 2018, 4, 64. [Google Scholar] [CrossRef] [Green Version]
  9. Tröltzsch, U.; Kanoun, O.; Tränkler, H.R. Characterizing aging effects of lithium ion batteries by impedance spectroscopy. Electrochim. Acta 2006, 51, 1664–1672. [Google Scholar] [CrossRef]
  10. Kallel, A.Y.; Petrychenko, V.; Kanoun, O. State-of-Health of Li-ion Battery Estimation Based on the Efficiency of the Charge Transfer Extracted from Impedance Spectra. Appl. Sci. 2022, 12, 885. [Google Scholar] [CrossRef]
  11. Kwiecien, M.; Badeda, J.; Huck, M.; Komut, K.; Duman, D.; Sauer, D.U. Determination of SoH of lead-acid batteries by electrochemical impedance spectroscopy. Appl. Sci. 2018, 8, 873. [Google Scholar] [CrossRef] [Green Version]
  12. Niya, S.M.R.; Hoorfar, M. Study of proton exchange membrane fuel cells using electrochemical impedance spectroscopy technique—A review. J. Power Sources 2013, 240, 281–293. [Google Scholar] [CrossRef]
  13. De Angelis, A.; Buchicchio, E.; Santoni, F.; Moschitta, A.; Carbone, P. Practical Broadband Measurement of Battery EIS. In Proceedings of the 2021 IEEE International Workshop on Metrology for Automotive (MetroAutomotive), Bologna, Italy, 1–2 July 2021; pp. 25–29. [Google Scholar]
  14. Haußmann, P.; Melbert, J. Optimized mixed-domain signal synthesis for broadband impedance spectroscopy measurements on lithium ion cells for automotive applications. J. Sens. Sens. Syst. 2017, 6, 65–76. [Google Scholar] [CrossRef] [Green Version]
  15. Kallel, A.; Bouchaala, D.; Kanoun, O. Critical implementation issues of excitation signals for embedded wearable bioimpedance spectroscopy systems with limited resources. Meas. Sci. Technol. 2021, 32, 084011. [Google Scholar] [CrossRef]
  16. Kallel, A.Y.; Hu, Z.; Kanoun, O. Comparative Study of AC Signal Analysis Methods for Impedance Spectroscopy Implementation in Embedded Systems. Appl. Sci. 2022, 12, 591. [Google Scholar] [CrossRef]
  17. Kallel, A.Y.; Kanoun, O. Regularized Linear Kramers-Kronig Transform for Consistency Check of Noisy Impedance Spectra with Logarithmic Frequency Distribution. In Proceedings of the 2021 International Workshop on Impedance Spectroscopy (IWIS), Chemnitz, Germany, 29 September–1 October 2021; pp. 7–10. [Google Scholar]
  18. Schoukens, J.; Pintelon, R.; Der Ouderaa, E.V.; Renneboog, J. Survey of Excitation Signals for FFT Based Signal Analyzers. IEEE Trans. Instrum. Meas. 1988, 37, 342–352. [Google Scholar] [CrossRef]
  19. Guillaume, P.; Schoukens, J.; Pintelon, R.; Kollái, I. Crest-Factor Minimization Using Nonlinear Chebyshev Approximation Methods. IEEE Trans. Instrum. Meas. 1991, 40, 982–989. [Google Scholar] [CrossRef]
  20. Van Der Ouderaa, E.; Schoukens, J.; Renneboog, J. Peak Factor Minimization of Input and Output Signals of Linear Systems. IEEE Trans. Instrum. Meas. 1988, 37, 207–212. [Google Scholar] [CrossRef]
  21. Schroeder, M. Synthesis of low-peak-factor signals and binary sequences with low autocorrelation (Corresp.). IEEE Trans. Inf. Theory 1970, 16, 85–89. [Google Scholar] [CrossRef]
  22. Den Bos, A.V. A new method for synthesis of low-peak-factor signals. IEEE Trans. Acoust. Speech Signal Process. 1987, 35, 120–122. [Google Scholar] [CrossRef]
  23. Yang, Y.; Zhang, F.; Tao, K.; Sanchez, B.; Wen, H.; Teng, Z. An improved crest factor minimization algorithm to synthesize multisines with arbitrary spectrum. Physiol. Meas. 2015, 36, 895–910. [Google Scholar] [CrossRef]
  24. Horner, A.; Beauchamp, J. A genetic algorithm-based method for synthesis of low peak amplitude signals. J. Acoust. Soc. Am. 1996, 99, 433–443. [Google Scholar] [CrossRef]
  25. Hu, Y.; Ramos, P.M.; Janeiro, F.M. Artificial bee colony algorithm for peak-to-peak factor minimization in periodic signals. In Proceedings of the 22nd IMEKO TC4 International Symposium and 20th International Workshop on ADC Modelling and Testing 2017: Supporting World Development Through Electrical and Electronic Measurements, Iasi, Romania, 14–15 September 2017; pp. 271–274. [Google Scholar]
  26. Boukamp, B.A. A Linear Kronig-Kramers Transform Test for Immittance Data Validation. Technical report. J. Electrochem. Soc. 1995, 142, 1885. [Google Scholar] [CrossRef]
Figure 1. Multisine excitation signals with different initial phases in (a) time domain, (b) frequency domain.
Batteries 08 00176 g001
Figure 2. Impedance spectra obtained by multisine excitation signals with different initial phases: (a) Nyquist curve, (b) Consistency check by Linear Kramers-Kronig (LKK).
Batteries 08 00176 g002
Figure 3. Overview of crest factor optimization methods for multisine signals.
Batteries 08 00176 g003
Figure 4. Characteristic of the considered transformation functions, including the sigmoid function (k = 0.1, 0.3, 0.5, 0.7, 1), the clip function, and the sign function.
Batteries 08 00176 g004
Figure 5. Boxplot of the final crest factor output as a function of the transformation functions, including the sigmoid function (k = 0.1, 0.3, 0.5, 0.7, 1), the clip function, and the sign function.
Batteries 08 00176 g005
Figure 6. Algorithm for signal transformation towards a multi-frequency signal with lower crest factor.
Batteries 08 00176 g006
Figure 7. Runtime of the crest factor optimization.
Batteries 08 00176 g007
Figure 8. Crest factor optimization results.
Batteries 08 00176 g008
Figure 9. Voltage-Controlled Current Source Schematic.
Batteries 08 00176 g009
Figure 10. Time profile of the multisine signal optimized by the proposed solution for Lithium-ion battery cell diagnosis.
Batteries 08 00176 g010
Figure 11. Time profile of the battery state-of-charge during multisine signal injection.
Batteries 08 00176 g011
Figure 12. Frequency spectrum of the measured excitation multisine signal.
Batteries 08 00176 g012
Figure 13. Measured and linear Kramers-Kronig-calculated impedance spectrum of the Lithium-ion battery cell after excitation by the multisine signal generated by the proposed method.
Batteries 08 00176 g013
Figure 14. Regularized Linear Kramers-Kronig residual analysis of the measured lithium-ion impedance spectrum.
Batteries 08 00176 g014
Publisher’s Note: MDPI stays neutral with regard to jurisdictional claims in published maps and institutional affiliations.

