Abstract
In order to meet consumer demands for electric transportation, the energy density of lithium-ion batteries (LIB) must be improved. Therefore, a trend to increase the overall size of the individual cell and to decrease the share of inactive materials is needed. The process of electrolyte filling involves the injection of electrolyte liquid into the cell, as well as the absorption of the electrolyte into the pores of the electrodes and the separator, which is known as wetting. The trend towards larger-format LIB challenges the electrolyte filling due to an increase in wetting distance for the electrolyte as well as a decrease in the void volume of the cell. The optimization of the process via numerical simulation promises to reduce costs and ensure quality during battery production. The two models developed in this study are based on a commercial computational fluid dynamics (CFD) program to study the effect of process parameters, such as pressure and temperature, on the filling process. The results were verified with neutron radiography images of the dosing process and a feasibility study for a wetting simulation is shown. For all simulations, specific recommendations are provided to set up the electrolyte filling process, based on which factors generate the greatest improvement.
1. Introduction
Due to the current transition from fossil fuels to alternative energy storage systems, lithium-ion batteries (LIB) have emerged as a crucial technology due to their potential for long service life and high energy density [1]. Although LIB have been well-established in consumer electronics for over two decades, their growth in recent years is mainly driven by the electric vehicle market [2]. One approach to increase the energy density of LIB is by reducing the share of inactive materials such as the separator, the housing and the current collector foils. This can be achieved by producing larger cell formats [3,4] or by a thicker electrode coatings [5]. However, decreasing the void volume while increasing the electrode size poses a challenge for the electrolyte filling process [6].
Before the cell can be charged for the first time, which is known as the formation, all cavities and pores of the anode, the cathode and the separator must to be filled with an electrolyte [7]. During this process, the solid electrolyte interphase (SEI), a protective layer on the surface of the anode active material composed of electrolyte solvent components and lithium, is formed [8]. If the formation begins prematurely, it could lead to inhomogeneous SEI development, capacity loss or partial layer detachments due to current fluctuations. Instead of acting as a protective layer, an inhomogeneous SEI would block the transfer of ions within the cell and decrease the capacity and lifespan of the cell [9]. Hagemeister et al. have shown the effects of a premature formation, detailing that a wetting degree of at least 98% is required before first charging the cell [10]. The mentioned trend towards a higher number of electrode layers and thicker coatings increases the surface area that needs to be covered with electrolytes during wetting [6]. Since the void volume in the cells is limited, it may require several dosing steps to fill the entire electrolyte volume into the cell. This is especially true for larger prismatic or cylindric cells, which results in process times of up to three weeks [11]. The facilities and handling steps required for the dosing, wetting and formation sub-processes of cell finalization represent an additional cost factor during large-scale LIB production [11]. Decreasing the wetting time of LIB is one method to reduce the overall production costs [12], which is commonly done by inducing a lower-than-atmospheric pressure, such as 100 mbar, in the cell [13].
The wetting degree is defined as the ratio of the electrolyte infiltrated by the cell stack’s pores to the total available pore volume. In industrial cell production, the amount of excess electrolyte is minimized since the unnecessary electrolyte decreases the specific gravimetric energy density and increase production costs [14]. Additionally, multiple dosing steps may be required to fill the entire amount of the electrolyte due to the limited void volume, especially in large-format prismatic cells [15], which motivates the optimization of each dosing step. Knoche et al. visualized the process of electrolyte filling and cell wetting by neutron radiography (NR) [16]. Electrochemical impedance spectroscopy (EIS) is another way to measure wetting [17] and could be potentially used as an inline measurement of the wetting degree of LIB [18].
Although experimental studies of the electrolyte filling process have been performed for several years, research based on a simulative approach is less common. Knoche et al. developed a process model to describe interdependencies and cause-and-effect relations, which provides a qualitative overview of the process but provides few quantitative results [19]. Another approach for modeling the electrolyte filling process is using analytical relationships such as the Lucas –Washburn equation to describe the capillary forces acting in the porous battery electrode [20,21]. An application of this approach has been explored by Günter et al. [22]. Sauter et al. [23] analytically modeled the separator gas entrapments and their effect on the ionic conductivity.
Another way to model the flow of liquid through a porous structure is by using computational fluid dynamics (CFD). The filling process is well suited for the application of CFD to simulate the electrolyte flow. One such approach is using the Lattice Boltzmann model (LBM), as first described by Lee et al. [24] and later applied to describe the effect on the electrochemical performance of the cell [25]. The simulation of laminar flow through porous media, as shown by Piller et al. [26] is applied in a variety of fields. Neumann et al. studied liquid displacing gas in thin porous layers [27] and later applied it to the electrolyte filling process of LIB [28]. Shodiev et al. [29] were the first group to apply the LBM to offer direct insights into the effects of structural parameters like porosity and share of active material on the wetting rates of LIB. The CFD work performed by the various research groups focuses almost exclusively on small sections of the porous battery components without taking a macroscopic perspective of the cell design, the dosing step or process parameters such as pressure or temperature into account. The objective of this work is to study the effects of process parameters on the electrolyte filling of LIB with a simulative approach.
2. Experimental Setup
The filling process, as detailed in the introduction, is split into the dosing and the wetting processes. Within the scope of this work, the designation of macro refers to the process of dosing the electrolyte liquid into the cell housing, and the designation of micro refers to the wetting of pore structures with the electrolyte. Due to the different time and size scales, two distinct models are set up for the simulations, respectively.
2.1. Concept of the Model
In order to develop a model of the electrolyte filling process, factors such as the cell format, material system and process parameters are considered. Figure 1 shows an overview of the concept for the model. This includes how the data for the geometries and material properties are acquired and processed, as well as the parameters considered. First, the initial situation is assessed: the cell geometry of the housing, cell stack and spacer as well as the material properties of the electrodes, the separator and the electrolyte. These are often determined by the cell design and are therefore handled as given from a production perspective. In the following step, the initial conditions are converted into a computer-aided design (CAD) model. In the macro environment (dosing), it is the empty cell volume not occupied by the cell stack. For the micro approach, the pore structure of a cathode active material is modeled. Once the geometry is set up, boundary conditions are applied and a mesh is generated. Suitable simulation parameters are determined for the dosing and wetting simulations. Since the time scales of the macro and micro simulations are significantly different (seconds vs. hours) [13], the simulation runs are carried out independently of one another. For the macro simulations, wetting is neglected and the electrode is considered a black box. For the micro simulations, the dosed volume provides an electrolyte reservoir for the micro environment. These are called the source and the sink within the simulations, as shown in Figure 1.
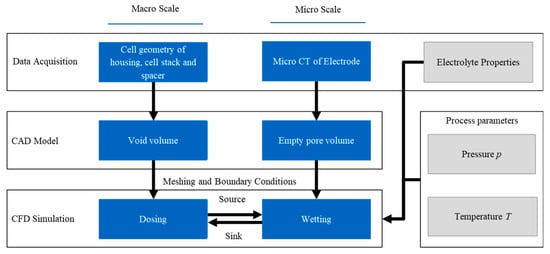
Figure 1.
Overall concept of the model showing how the macro and micro scales are built and connected to represent the entire filling process.
2.2. Data Acquisition and CAD Model
The macro and micro models were created with different types of data. In the case of the macro model of the void volume within the cell, normed specifications of a standard cell format were used. In this case, a plug-in hybrid electric vehicle (PHEV) cell according to DIN91252 [30], known shorthand as PHEV1, was the basis for these studies. The outer dimensions of the can are roughly 173 mm × 85.7 mm × 21 mm. For the macro simulation the size and location of the void volume was needed, which was determined by the cell stack, the spacer and the current collectors. A detailed overview of the cell components has been shown by Günter et al. [15]. The geometry for the corresponding void volume was then created based on the size and position of the various components.
For the geometry used in the micro simulations, X-ray micro-computed tomography (micro-CT) images were taken as a basis to virtually reconstruct the pore volume and generate a 3D model from it. Although 3D-tomography is characterized by being time-consuming and requires advanced equipment, the benefits of this method far outweigh stereological procedures [31]. The particle arrangement of an electrode takes on a unique form during the production process, which is why there is no defined norm for the structure of an electrode usable for the micro simulation. During processes such as coating and calendering, the electrode particles shift and arrange themselves in a random manner, varying the particle and pore structure throughout the electrode [32]. The electrode chosen to represent the cell stack is based on raw tomography data from Ebner et al. and was segmented to a control volume of 8.88 µm × 25.16 µm × 25.15 µm [33]. It is based on a cathode with 96 wt.% LiNi1/3Co1/3Mn1/3O2 (NMC111) and a porosity of 45% [33]. Modeling the entire stack, which consists of an anode, cathode and separator, would require additional CT-scans as well as significant computational power. For this reason, existing open-source data for the cathode material was used within the scope of this work with the potential for future expansion. In the case of a PHEV1 cell with electrode width of about 135 mm, this represents about 0.026% of the entire electrode width. For the simulation and experimental work, an LP572 electrolyte (BASF, Germany) consisting of a solution of 1 M LiPF6 in a mixture of ethylene carbonate (EC) and ethyl methyl carbonate (EMC) (ratio of 3:7) with 2 wt.% vinylene carbonate (VC) was used. The material properties for the LP572 electrolyte and nitrogen remain constant between the macro and micro simulations, for which the values are shown in Table 1.

The material properties for nitrogen were chosen based on the ANSYS database. For the studies of varying temperature, the values for the material properties were adjusted according to Table A1 and Table A2 in Appendix A. The values for dynamic viscosity were based on experimental studies, whereas the surface tension was calculated based on the material properties of the various electrolyte components [34]. The contact angle was calculated according to the method proposed by Davoodabadi et al. [36].
The boundary conditions for the micro simulations were adjusted based on the geometrical limits of the CT scan of the NMC cathode structure. Since the goal is to study the effect of the capillary forces of the porous electrode, the force due to the initial pressure (pgauge) was negated, as shown in Table 2. This was done by setting the pressure on both sides of the porous structure to zero, which meant that no forces acted on the electrolyte due to an initial difference in pressure. Any fluid flow could therefore be attributed to other factors, such as the capillary forces. The outer boundary conditions (cx, cy and cz) were also set to zero so that fluid can only flow through the defined in- and outlet (ctangential). For the macro simulations, the wall and symmetry boundary conditions were the same as for the micro simulations. Due to the variations in process parameters of the dosing, the boundary conditions for the pressure inlet and pressure outlet were set according to the experimental setup.

Table 2.
Boundary conditions for the micro simulations.
2.3. Meshing of Fluid-Carrying Volumes
2.3.1. Macro Scale: Void Volume of the Can
The goal during meshing is to find a good tradeoff between accuracy and reasonable calculation times. To achieve this, mesh complexity is added in critical regions such as the inlet port of the macro simulations. The mesh of the entire can void volume is shown in Figure 2a. A rectangular mesh was used for most of the volume, with the exception of the filling inlet port. At this specific point, the shape of the mesh was adjusted to better suit the cylindrical port, as well as increase the resolution, because this is a critical component during the fluid flow. A detailed view of the mesh in this area is shown in Figure 2a. An in-plane symmetry axis was assumed for the entire macro simulation since the void volume of the can is symmetrical, which allows for the visualization of the wetting degree within the cell.
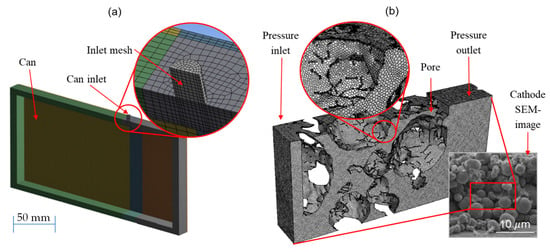
Figure 2.
Overview of half of the void volume used during simulations of the macro scale (a) including the detailed view of the critical inlet section with a modified mesh of the electrode volume and SEM image of a NMC cathode (b).
A convergence study was performed to determine the quality of the generated mesh. The goal of this study was to find the minimum number of mesh elements, after which the quality of the simulation no longer significantly improves with more elements. This method aims to find the trade-off between high resolution and reasonable calculation time. The results of the convergence study are shown in Figure A1 in the appendix. Roughly 40,000 elements are sufficient to model the dosing of a PHEV1 cell on a macro scale, and additional elements do not significantly increase the quality of the simulation results.
2.3.2. Micro Scale: Void Volume of a Porous Electrode
Although the micro simulation is physically much smaller than the macro simulation, the intricacies take a larger role in appropriate meshing. Whereas critical regions in the macro simulation could be identified and detailed quite easily, the entire micro environment is a network of cavities through which the electrolyte flows evenly. A uniform mesh with approximately 550,000 elements was chosen based on convergence studies such as those used for the macro simulation. Figure 2b shows the meshed control volume for the micro simulation, as well as a comparison with a scanning electron microscope (SEM) image of an electrode. The larger spherical regions represent the cathode active material particles, as captured by the CT scan, since the meshed area between particles represents the void volume in which the electrolyte can flow. Finally, the empty white regions characterize the contact area, either between particles or between a particle and the outer boundary condition.
2.4. Parameter Variation for the CFD-Simulation
Before the dosing begins, the cell undergoes a series of evacuation and flushing cycles [22]. A pressure difference between the void volume inside the cell and the filling port acts as one of the main driving forces during the dosing step of the electrolyte filling process. In the first process parameter study, the effect of a pressure variation was studied using the macro simulation. The absolute dosing pressure was set to either 1000 mbar or 2000 mbar and the absolute evacuation pressure was varied between 40 mbar and 400 mbar. The process parameters for the evacuation and gassing pressure were based on previous experimental studies, published by Günter et al. [22]. During the experimental filling process, the pressure applied to the cell causes elastic deformities to the housing of the cell. For the simulations within this work, the cell was assumed to be completely rigid to keep the computational complexity manageable. In the second study, the temperature of the liquid electrolyte and gaseous nitrogen was varied in a range between 0 °C and 50 °C based on the same experimental studies [22]. The volume fraction of the electrolytes was monitored throughout the simulation runs and is defined by the volume occupied by the electrolyte as a fraction of the total void volume of the cell. Next, the macro simulations were verified using NR images. NR works because the hydrogen in the chemical structure of the electrolyte absorbs the neutron beam and all other cell components allow the beam to pass through. By evaluating the greyscale values of the recorded images, the location of the electrolyte, and thus the wetting progress, was shown. Reference values from Günter et al. were used for both the simulative and the experimental setup [15]. Finally, the micro simulation neglected the process parameters pressure (p) and temperature (T) to show the effect of capillary forces acting on the porous electrode. These four studies are detailed in the following section.
3. Results and Discussion
The developed model was used to study the effects of pressure and temperature during the filling process. In the first step, the dosing of the electrolyte into the void volume of the can was examined.
3.1. Macro Simulation: Effect of Pressure and Temperature on the Dosing of Electrolyte
Figure 3 shows the simulation results of the dosing of the electrolyte into the void volume of a PHEV1 cell in selected time steps. The filled-in colored areas represent the regions where the electrolyte has taken up the void volume of the cell. The electrolyte enters the cell due to a pressure difference between the void volume and the cell inlet. The absolute pressure of the void volume (pinit) was set to 50 mbar and the absolute pressure at the inlet (pinlet) was set to 300 mbar. Thus, a pressure difference (Δp) of 250 mbar promoted the electrolyte into the cell. At t = 0.05 s, the electrolyte has entered the cell and begins to flow around the top-left corner of the cell stack. The electrolyte continues to flow through the filling port located at the top of the cell. After 0.40 s, more of the electrolyte continues to enter the cell and begins to accumulate at the bottom. Even after 1.00 s, the electrolyte continues to enter the cell as shown, which indicates that the dosing is not yet complete. At that point, the fluid has completely taken up the bottom of the cell and begins to surround the cell stack. The remaining gas in the cell, originating from the macroscopic void volume, flows to the top of the cell while the fluid continues to take up the void space. This becomes visible through streaks of the space previously occupied by the nitrogen. After 15 s, the desired electrolyte volume has been dosed into the cell and settles at the bottom of the can and the process is finished.
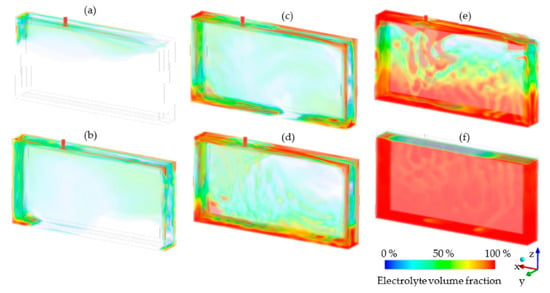
Figure 3.
Results of the macro simulation showing the electrolyte flow through the cell after dosing during time steps (a) 0.05 s, (b) 0.2 s, (c) 0.4 s, (d) 0.6 s, (e) 1 s and (f) 15 s of dosing time. The initial pressure in the void volume (= 50 mbar) and dosing pressure at the cell inlet (pinlet = 300 mbar) generated the pressure difference (Δp = 250 mbar) for the electrolyte dosing. The temperature of the cell and of the electrolyte were set to 25 °C.
The time scale of the dosing process is consistent with values found in literature such as by Günter et al. [15]. Small gas entrapments are still visible at the bottom of the cell, which are caused by the fluid rushing in and compressing these pockets. These observations are consistent with experimental studies and are shown in the validation with NR images in Section 3.2. Small gas entrapments are still seen at the bottom of the cell, which are caused by the fluid rushing into and compressing these pockets. Nonetheless, most of the residual gas accumulates at the top of the cell, as expected for this multi-phase system of gas and liquid. This type of simulation was performed for various pressure and temperature scenarios, of which the results are shown in the following sections.
3.1.1. Influence of Pressure
As shown by Weydanz et al., one of the governing factors during the filling process is the pressure difference between the mostly evacuated cell and the filling port [13]. The qualitative analysis, as shown in Figure 3, presents the fluid flowing through the cell void volume with fixed process parameters. In this study, the evacuation and dosing pressure were varied to analyze the effect on the mass flow and volume of the electrolyte filled into the cell. The evacuation pressure varied between 40 mbar and 400 mbar and the dosing pressure between 1000 mbar and 2000 mbar, as detailed in Section 2.4.
Figure 4 shows the mass flow through the filling port and electrolyte volume fraction in the void volume of the can over time. The solid lines show the electrolyte mass flow. For both cases (1000 mbar (a) and 2000 mbar (b)), the mass flow increases as the evacuation pressure decreases, which is reasonable since a larger pressure difference causes an increased flow speed. The total dosed volume was taken as the integral of the mass flow and is shown by the dashed line. Figure 4 shows that, in regard to the total dosed volume, a similar observation is made; higher pressure differences (meaning lower evacuation pressure) lead to a higher electrolyte volume fraction.
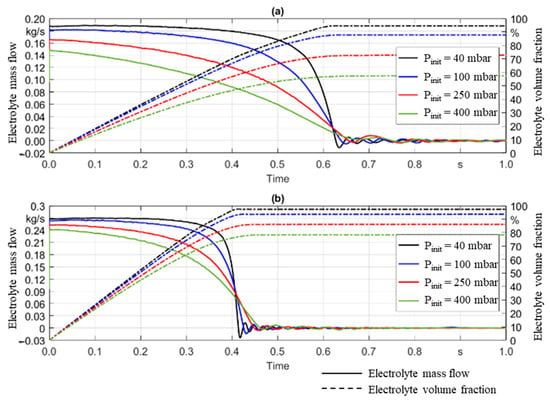
Figure 4.
Influence of pressure variation on the mass flow and volume fraction of electrolyte as a function of time is shown. (a) Gauge pressure of 1000 mbar and temperature of 25 °C were applied with varied initial evacuation pressure from 40 mbar to 400 mbar. (b) Gauge pressure is increased to 2000 mbar with the same temperature and initial evacuation pressures.
The overarching goal for the dosing process is to decrease the machine occupancy time of the cell while increasing the electrolyte quantity dosed in one single step. Decreasing process times will increase the production throughput and lead to a decrease in the fixed costs per cell. Figure 4 shows significant differences in the electrolyte volume fraction as an effect of varied evacuation and gassing pressures. By reducing the evacuation pressure from 400 mbar down to 40 mbar, the electrolyte volume fraction dosed was improved from 57% to 94%, respectively, with a gassing pressure of 1000 mbar. If the latter is increased to 2000 mbar, the described decrease in evacuation pressure leads to an improvement from 78% to 98%, respectively, with regard to electrolyte volume fraction. Based hereon, the right process design leads to a decrease in the number of required dosing steps. Even in cases where the overall number of dosing steps cannot be reduced, knowledge of which process parameters are required to fill a desired electrolyte quantity significantly helps to optimize the overall process design.
Furthermore, the relationship between the evacuation and dosing pressure was analyzed regarding the process design. By decreasing the evacuation pressure from 400 mbar to 40 mbar in the simulation (Figure 4a), the electrolyte volume fraction increases by roughly 40%. Conversely, if the evacuation pressure is set to 40 mbar and the gassing pressure varied from 1000 mbar to 2000 mbar, the electrolyte volume fraction increases by only 4%. These results are consistent with those of experimental process studies from previous works [22]. Achieving a low evacuation pressure is essential, while adding a gassing pressure provides a marginal improvement in the electrolyte volume fraction. Therefore, it is recommended to prioritize the evacuation pressure when choosing manufacturing equipment or defining a set of process parameters for electrolyte filling in LIB production.
3.1.2. Influence of Temperature
Another critical parameter is the temperature of the cell and its components during the filling process. Not only does the average temperature play an important role, but the temperature gradients between the nitrogen and the electrolyte do as well. This interrelationship was examined in Figure 5. The parameters used for the study were a gauge pressure of 1000 mbar, an evacuation pressure of 100 mbar and an initial gas temperature of 25 °C. The results of the study in Figure 5 are shown based on the electrolyte volume fraction shown on the left axis.
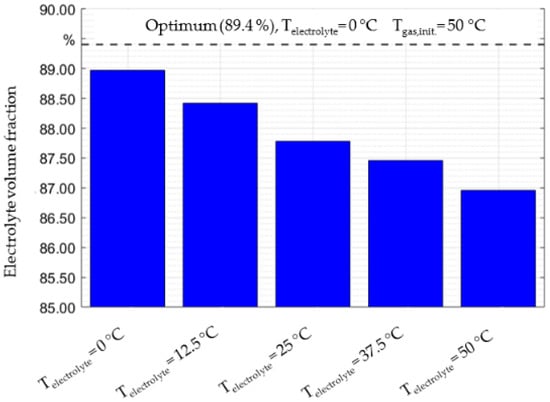
Figure 5.
Electrolyte volume fraction as a function of gas and electrolyte temperature. Dosing pressure (1000 mbar), initial evacuation pressure (100 mbar) and an initial gas temperature (25 °C) are constant.
The results of this hypothetical study show an increase of the electrolyte volume fraction as the temperature of the liquid electrolyte decreases. When the electrolyte temperature increases relative to the gas temperature, the amount of dosed electrolyte decreases. At a first glance this seems counterintuitive, since the literature shows that an increase in temperature increases wetting speeds. This is because previous studies only focused on an increase or decrease of the temperature of all components, while this study examines temperature differences only between the liquid and gaseous phases. When the liquid has a low temperature (e.g., 0 °C), it will cool down the gaseous nitrogen, which causes it to contract and leave more space for the liquid. Conversely, if the temperature of the electrolyte is elevated (e.g., 50 °C), then the temperature of the gas will increase, and the volume of the gas will consequently expand as the quantity of the dosed electrolyte decreases. The optimum parameters of the study are at the system limits when the temperature difference between the electrolyte and gas is the greatest (0 °C and 50 °C respectively), which results in a volume fraction of 89.4%. Beyond the studied temperature limits, a similar trend of the electrolyte volume fraction is expected but could damage the electrolyte and pose safety concerns, which needs to be assessed for each application individually.
These observations follow the temperature dependencies based on the ideal gas law. Additionally, the overall effects of temperature variation during dosing seem to be less significant than pressure variations. While an optimization of the filling degree through temperature variation leads to an increase of roughly 2.5% (Figure 5), properly setting up the process parameters for pressure has the potential to improve up to 40% (Figure 4). From a production standpoint, it is beneficial to focus on pressure optimizations as a first step, rather than vary the temperature, to improve the dosing step of the electrolyte filling process.
3.2. Verification of the Macro Simulations Using Neutron Radiography Measurements
The qualitative simulations of the filling process, as shown in Figure 3, illustrate how the electrolyte enters the cell through a filling port. In order to verify these simulations, the filling process was recorded using NR to highlight the areas of the cell that are filled with the electrolyte liquid. This approach is detailed by Günter et al. [15] and has been applied to the images shown in Figure 6 in order to compare the simulations to the experimental filling data. The goal of the study was to verify if the observations from the simulation correspond to experimental studies, for which the qualitative comparison is the most appropriate at the current stage.
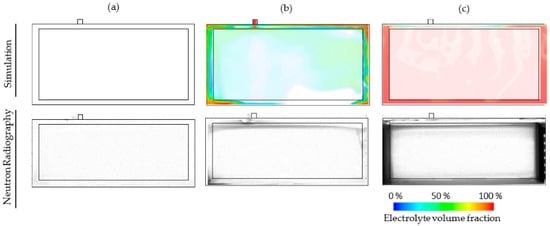
Figure 6.
Comparison of the simulation results with images taken using neutron radiography for time steps (a) before dosing, (b) 0.25 s after dosing and (c) 15 s after dosing. The initial pressure (pinit = 50 mbar), pressure difference (Δp = 250 mbar) and temperature (T = 25 °C) are set as process parameters.
The empty cell is shown at a time of 0 s in Figure 6a. The simulations show that no fluid has entered and the NR image is completely white, which indicates the same. At a time of 0.25 s in Figure 6b, the dosing has begun and the electrolyte begins to flow into the void volume of the cell. The areas with the highest electrolyte concentration, such as the filling port and bottom corners, are shown in red in the simulations. Similarly, the NR images show the electrolyte concentrations that are indicated by the darker areas, which are seen in the same regions as the simulations proposed (filling port and bottom left corner). Finally, Figure 6c shows the cell after the dosing has finished and the electrolyte is settled, after roughly 15 s. Both the simulation and NR image show similar patterns regarding the location of the electrolyte liquid. Moreover, similarities in the areas where the excess gas accumulates are shown, which verifies the validity of the simulations. It is important to note that this is a qualitative check of the simulation results of the images captured in-operando while filling a battery cell. Further tests such as NR or X-Ray tomography, which produce 2D images, are required to validate the model.
3.3. Micro Simulation: Modeling the Capillary Forces during Electrolyte Wetting
After dosing the liquid into the void volume of the cell, the wetting begins immediately. This is the most time-consuming part of the electrolyte filling process and it takes up to multiple hours based on factors such as cell geometry [15] and process parameters [22]. Due to the large size of the cell compared to the small pore volumes, a simulation of each individual pore throughout the entire wetting of an entire cell is not yet possible with current models. Therefore, a small section of electrode material has been chosen as a sample to simulate the flow of the electrolyte through the porous active material. In this work, the rendering stems from a CT scan of an NMC111 cathode, as detailed in Section 2.4. This 25 µm wide section represents approximately 1/5000th of the entire cell width. The simulation results of the liquid flow through the porous channels are presented in Figure 7.
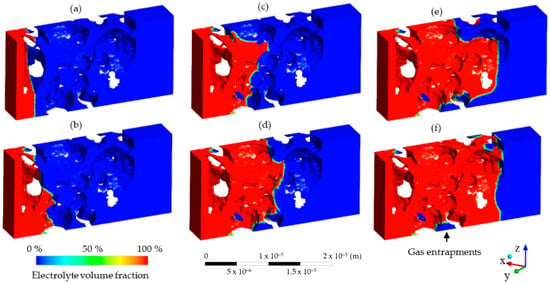
Figure 7.
Micro simulation results of the electrolyte flow during the wetting of the cell during time steps (a) 0.0 s, (b) 3.9 × 10⁻⁵ s, (c) 2.5 × 10⁻⁵ s, (d) 1.0 × 10⁻⁵ s, (e) 1.6 × 10⁻⁵ s and (f) 2.5 × 10⁻⁵ s of filling time. Each section represents a small section (3 × 10⁻⁵ m, or 30 µm) of the battery electrode. Fluid starts on the left side of the cell and slowly enters the gas-filled pores. Process parameters such as pressure and temperature are neglected, and the fluid moves purely due to the capillary forces acting on the porous media.
As the electrolyte flow progresses through the porous media, the electrolyte shown in red takes up the space of the nitrogen in blue. A small flow front is evident where the phases interact (visible in green in Figure 7). Since the pressure difference was set to zero, gravitational forces were neglected and there was no initial velocity, thus the capillary force was the only one causing the fluid to move throughout the volume. The balance of the forces then resembled a capillary rise effect, which causes fluid to flow through a tube without the effect of pressure or inertia [37]. In this case, the tube is modeled by the pore network of a battery electrode through which the electrolyte can then flow, as shown in Figure 7. The high resolution provides insight into the gas entrapments and acts as a baseline for further investigations of the effects of pressure and temperature on a micro scale. These results show that, due to the visualized gas entrapments, a wetting degree of 100% is almost impossible on the cell level. The feasibility of the approach is verified, but further scale-up and the implementation of process parameters are required to provide insight on realistic wetting conditions. For example, information such as flow speed can be used to scale up the wetting simulation by end users depending on the individual cell size, the wetting direction or the material system. The setup of the micro simulation shows that it is possible to model capillary forces acting on an electrode during electrolyte wetting using the commercially available Software ANSYS Fluent.
4. Conclusions
The electrolyte filling, as a bottleneck within the process chain of battery production, is characterized by long throughput times and a high cost of experimental studies required to ramp up stable and optimized processes. Additionally, there are limited visualization possibilities for studying the fluid flow through and into the porous cell components. Within this work, sub models for dosing and wetting were set up using CFD simulation for both processes.
During the first part of the filling process, the electrolyte is dosed into the void volume of the cell and surrounds the cell stack. Previous studies focused almost exclusively on wetting, though the dosing is a crucial part of the filling process. As new cell concepts decrease the void volume of the cell, which is necessary for dosing the electrolyte liquid, the dosing step will continue to gain importance. Any improvement to the dosing will increase the production efficiency and decrease the manufacturing costs. Therefore, the effect of pressure and temperature on the dosing process was studied in detail using the developed macro simulation. It was shown that a low evacuation pressure and a high dosing pressure are conducive to the dosing process, which was consistent with experimental findings in the literature [22]. Furthermore, process studies of the evacuation pressure provide a greater improvement to the dosing than increasing the gassing pressure. The studies of temperature showed that a low electrolyte temperature and a high gas temperature marginally improve the amount of the electrolyte that can be dosed due to the expansion and contraction of the respective phases. Finally, images from NR were used to verify the results of the model, which showed a consistency between the simulation and experimental studies. As depicted throughout the work, the developed partial models were applied to accelerate and improve the electrolyte filling process by choosing appropriate process parameters for the given cell system. As next steps, the two sub models will be combined to create a unified filling model, which allows for the performance of simulation studies and ultimately helps to further decrease the cost of ramp-up phases and series production of LIB.
Author Contributions
Conceptualization, J.H. and F.J.G.; methodology, J.H. and F.J.G.; software, J.H., T.R., F.Z. and A.P.; validation, J.H., F.J.G. and F.Z.; formal analysis, J.H. and T.R.; investigation, J.H., F.J.G., T.R. and A.P.; resources, J.H. and R.D.; data curation, J.H., T.R., F.Z. and A.P.; writing—original draft preparation, J.H.; writing—review and editing, J.H., F.J.G. and R.D.; visualization, J.H.; supervision, J.H. and R.D.; project administration, J.H.; funding acquisition, J.H. and R.D. All authors have read and agreed to the published version of the manuscript.
Funding
The authors gratefully acknowledge the support from the German Federal Ministry of Education and Research (BMBF) for their financial backing. This work stems from research performed within the scope of the projects Cell-Fill (Grant number 03XP0237B) and Sim4Pro (Grant number 03XP0242B).
Institutional Review Board Statement
Not applicable.
Informed Consent Statement
Not applicable.
Data Availability Statement
The data is contained within the article.
Conflicts of Interest
The authors declare no conflict of interest.
Abbreviations
| ANSYS | Engineering simulation software |
| BMBF | German Federal Ministry of Education and Research |
| CAD | Computer aided design |
| CFD | Computational fluid dynamics |
| CT | Computer tomography |
| DIN | German standards agency |
| EC | Ethylene carbonate |
| EMC | Ethyl methyl carbonate |
| LBM | Lattice Boltzmann methods |
| LIB | Lithium-ion batteries |
| NMC | Lithium-Nickel-Manganese-Cobalt-Oxide |
| NR | Neutron radiography |
| PHEV | Plug-in hybrid electric vehicle |
| SEI | Solid electrolyte interphase |
| SEM | Scanning electron microscope |
| VC | Vinylene carbonate |
Appendix A

Table A1.
Temperature dependent on the dynamic viscosity of the electrolyte.
Table A1.
Temperature dependent on the dynamic viscosity of the electrolyte.
| Temperature in °C | Dynamic Viscosity in kg/ms |
|---|---|
| 50.0 | 0.000821 |
| 37.5 | 0.001184 |
| 25.0 | 0.001767 |
| 12.5 | 0.002745 |
| 0 | 0.004464 |

Table A2.
Temperature dependent on the surface tension and contact angle of the electrolyte.
Table A2.
Temperature dependent on the surface tension and contact angle of the electrolyte.
| Temperature in °C | Surface Tension in mN/m | Contact Angle in Degrees |
|---|---|---|
| 50.0 | 36.49 | 41.36 |
| 25.0 | 33.54 | 35.26 |
| 0 | 30.59 | 26.45 |
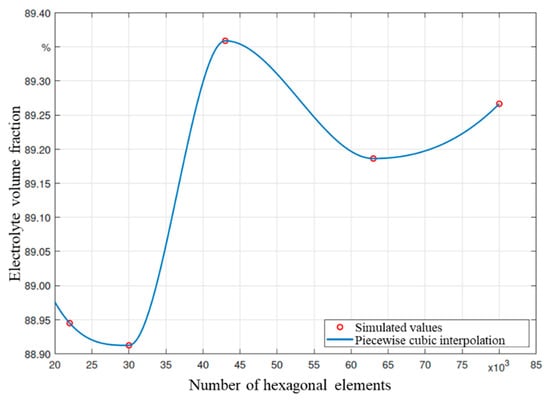
Figure A1.
Results of a convergence study of the mesh used for the macro simulations under initial pressure (pinit = 100 mbar), gauge pressure (pgauge = 1000 mbar) and temperature of the electrolyte (T = 25 °C).
References
- Schmuch, R.; Wagner, R.; Hörpel, G.; Placke, T.; Winter, M. Performance and cost of materials for lithium-based rechargeable automotive batteries. Nat. Energy 2018, 3, 267–278. [Google Scholar] [CrossRef]
- Scrosati, B.; Garche, J. Lithium batteries: Status, prospects and future. J. Power Sources 2010, 195, 2419–2430. [Google Scholar] [CrossRef]
- Andre, D.; Kim, S.-J.; Lamp, P.; Lux, S.F.; Maglia, F.; Paschos, O.; Stiaszny, B. Future generations of cathode materials: An automotive industry perspective. J. Mater. Chem. A 2015, 3, 6709–6732. [Google Scholar] [CrossRef]
- Günter, F.J.; Wassiliadis, N. State of the Art of Lithium-Ion Pouch Cells in Automotive Applications: Cell Teardown and Characterization. J. Electrochem. Soc. 2022, 169, 30515. [Google Scholar] [CrossRef]
- Sakti, A.; Michalek, J.J.; Fuchs, E.R.; Whitacre, J.F. A techno-economic analysis and optimization of Li-ion batteries for light-duty passenger vehicle electrification. J. Power Sources 2015, 273, 966–980. [Google Scholar] [CrossRef]
- Knoche, T.; Reinhart, G. Electrolyte Filling of Large-Scale Lithium-Ion Batteries: Main Influences and Challenges for Production Technology. Appl. Mech. Mater. 2015, 794, 11–18. [Google Scholar] [CrossRef]
- An, S.J.; Li, J.; Daniel, C.; Mohanty, D.; Nagpure, S.; Wood, D.L. The state of understanding of the lithium-ion-battery graphite solid electrolyte interphase (SEI) and its relationship to formation cycling. Carbon 2016, 105, 52–76. [Google Scholar] [CrossRef]
- Lanz, M.; Lehmann, E.; Imhof, R.; Exnar, I.; Novák, P. In situ neutron radiography of lithium-ion batteries during charge/discharge cycling. J. Power Sources 2001, 101, 177–181. [Google Scholar] [CrossRef]
- Wang, A.; Kadam, S.; Li, H.; Shi, S.; Qi, Y. Review on modeling of the anode solid electrolyte interphase (SEI) for lithium-ion batteries. npj Comput. Mater. 2018, 4, 359. [Google Scholar] [CrossRef]
- Hagemeister, J.; Stock, S.; Linke, M.; Fischer, M.; Drees, R.; Kurrat, M.; Daub, R. Lean Cell Finalization in Lithium-Ion Battery Production: Determining the Required Electrolyte Wetting Degree to Begin the Formation. Energy Technol. 2022, 9, 2200686. [Google Scholar] [CrossRef]
- Wood, D.L.; Li, J.; Daniel, C. Prospects for reducing the processing cost of lithium ion batteries. J. Power Sources 2015, 275, 234–242. [Google Scholar] [CrossRef]
- Kwade, A.; Haselrieder, W.; Leithoff, R.; Modlinger, A.; Dietrich, F.; Droeder, K. Current status and challenges for automotive battery production technologies. Nat. Energy 2018, 3, 290–300. [Google Scholar] [CrossRef]
- Weydanz, W.J.; Reisenweber, H.; Gottschalk, A.; Schulz, M.; Knoche, T.; Reinhart, G.; Masuch, M.; Franke, J.; Gilles, R. Visualization of electrolyte filling process and influence of vacuum during filling for hard case prismatic lithium ion cells by neutron imaging to optimize the production process. J. Power Sources 2018, 380, 126–134. [Google Scholar] [CrossRef]
- Günter, F.J.; Burgstaller, C.; Konwitschny, F.; Reinhart, G. Influence of the Electrolyte Quantity on Lithium-Ion Cells. J. Electrochem. Soc. 2019, 166, A1709–A1714. [Google Scholar] [CrossRef]
- Günter, F.J.; Rössler, S.; Schulz, M.; Braunwarth, W.; Gilles, R.; Reinhart, G. Influence of the Cell Format on the Electrolyte Filling Process of Lithium-Ion Cells. Energy Technol. 2019, 8, 1801108. [Google Scholar] [CrossRef]
- Knoche, T.; Zinth, V.; Schulz, M.; Schnell, J.; Gilles, R.; Reinhart, G. In situ visualization of the electrolyte solvent filling process by neutron radiography. J. Power Sources 2016, 331, 267–276. [Google Scholar] [CrossRef]
- Wu, M.-S.; Liao, T.-L.; Wang, Y.-Y.; Wan, C.-C. Assessment of the Wettability of Porous Electrodes for Lithium-Ion Batteries. J. Appl. Electrochem. 2004, 34, 797–805. [Google Scholar] [CrossRef]
- Günter, F.J.; Habedank, J.B.; Schreiner, D.; Neuwirth, T.; Gilles, R.; Reinhart, G. Introduction to Electrochemical Impedance Spectroscopy as a Measurement Method for the Wetting Degree of Lithium-Ion Cells. J. Electrochem. Soc. 2018, 165, A3249–A3256. [Google Scholar] [CrossRef]
- Knoche, T.; Surek, F.; Reinhart, G. A Process Model for the Electrolyte Filling of Lithium-ion Batteries. Procedia CIRP 2016, 41, 405–410. [Google Scholar] [CrossRef]
- Lucas, R. Ueber das Zeitgesetz des kapillaren Aufstiegs von Flüssigkeiten. Kolloid-Z. 1918, 23, 15–22. [Google Scholar] [CrossRef]
- Washburn, E.W. The Dynamics of Capillary Flow. Phys. Rev. 1921, 17, 273–283. [Google Scholar] [CrossRef]
- Günter, F.J.; Keilhofer, J.; Rauch, C.; Rössler, S.; Schulz, M.; Braunwarth, W.; Gilles, R.; Daub, R.; Reinhart, G. Influence of pressure and temperature on the electrolyte filling of lithium-ion cells: Experiment, model and method. J. Power Sources 2022, 517, 230668. [Google Scholar] [CrossRef]
- Sauter, C.; Zahn, R.; Wood, V. Understanding Electrolyte Infilling of Lithium Ion Batteries. J. Electrochem. Soc. 2020, 167, 100546. [Google Scholar] [CrossRef]
- Lee, S.G.; Jeon, D.H.; Kim, B.M.; Kang, J.H.; Kim, C.-J. Lattice Boltzmann Simulation for Electrolyte Transport in Porous Electrode of Lithium Ion Batteries. J. Electrochem. Soc. 2013, 160, H258–H265. [Google Scholar] [CrossRef]
- Jeon, D.H. Wettability in electrodes and its impact on the performance of lithium-ion batteries. Energy Storage Mater. 2019, 18, 139–147. [Google Scholar] [CrossRef]
- Piller, M.; Casagrande, D.; Schena, G.; Santini, M. Pore-scale simulation of laminar flow through porous media. J. Phys. Conf. Ser. 2014, 501, 12010. [Google Scholar] [CrossRef]
- Neumann, T.; Boettcher, K.; Ehrhard, P. Numerical investigation into a liquid displacing a gas in thin porous layers. Proc. Appl. Math. Mech. 2016, 16, 605–606. [Google Scholar] [CrossRef]
- Neumann, T.; Boettcher, K.; Ehrhard, P. Modelling the filling process of lithium-ion batteries. Proc. Appl. Math. Mech. 2017, 17, 659–660. [Google Scholar] [CrossRef]
- Shodiev, A.; Primo, E.; Arcelus, O.; Chouchane, M.; Osenberg, M.; Hilger, A.; Manke, I.; Li, J.; Franco, A.A. Insight on electrolyte infiltration of lithium ion battery electrodes by means of a new three-dimensional-resolved lattice Boltzmann model. Energy Storage Mater. 2021, 38, 80–92. [Google Scholar] [CrossRef]
- DIN 91252:2016-11; Elektrische Straßenfahrzeuge_- Batteriesysteme_- Anforderungen an die Gestaltung von Lithium-Ionen-Batteriezellen; Text Deutsch und Englisch. Beuth Verlag GmbH: Berlin, Germany, 2016.
- Taiwo, O.O.; Finegan, D.P.; Eastwood, D.S.; Fife, J.L.; Brown, L.D.; Darr, J.A.; Lee, P.D.; Brett, D.J.L.; Shearing, P.R. Comparison of three-dimensional analysis and stereological techniques for quantifying lithium-ion battery electrode microstructures. J. Microsc. 2016, 263, 280–292. [Google Scholar] [CrossRef]
- Günther, T.; Billot, N.; Schuster, J.; Schnell, J.; Spingler, F.B.; Gasteiger, H.A. The Manufacturing of Electrodes: Key Process for the Future Success of Lithium-Ion Batteries. Adv. Mater. Res. 2016, 1140, 304–311. [Google Scholar] [CrossRef]
- Ebner, M.; Geldmacher, F.; Marone, F.; Stampanoni, M.; Wood, V. X-ray Tomography of Porous, Transition Metal Oxide Based Lithium Ion Battery Electrodes. Adv. Energy Mater. 2013, 3, 845–850. [Google Scholar] [CrossRef]
- Stephan, P.; Kabelac, S.; Kind, M.; Mewes, D.; Schaber, K.; Wetzel, T. (Eds.) VDI-Wärmeatlas: Mit 1046 Abbildungen und 483 Tabellen; 12. Auflage; Springer Vieweg: Berlin/Heidelberg, Germany, 2019; ISBN 978-3-662-52988-1. [Google Scholar]
- ANSYS Fluent; ANSYS, Inc.: Canonsburg, PA, USA, 2013.
- Davoodabadi, A.; Li, J.; Liang, Y.; Wang, R.; Zhou, H.; Wood, D.L.; Singler, T.J.; Jin, C. Characterization of Surface Free Energy of Composite Electrodes for Lithium-Ion Batteries. J. Electrochem. Soc. 2018, 165, A2493–A2501. [Google Scholar] [CrossRef]
- Lago, M.; Araujo, M. Capillary Rise in Porous Media. J. Colloid Interface Sci. 2001, 234, 35–43. [Google Scholar] [CrossRef]
Publisher’s Note: MDPI stays neutral with regard to jurisdictional claims in published maps and institutional affiliations. |
© 2022 by the authors. Licensee MDPI, Basel, Switzerland. This article is an open access article distributed under the terms and conditions of the Creative Commons Attribution (CC BY) license (https://creativecommons.org/licenses/by/4.0/).