Article

Bi2Se3 Nanostructured Thin Films as Perspective Anodes for Aqueous Rechargeable Lithium-Ion Batteries

1
Institute of Chemical Physics, University of Latvia, Raina Blvd. 19, LV-1586 Riga, Latvia
2
Institute of Solid State Physics, University of Latvia, Kengaraga Street 8, LV-1063 Riga, Latvia
3
Faculty of Chemistry, University of Latvia, Raina Blvd. 19, LV-1586 Riga, Latvia
*
Authors to whom correspondence should be addressed.
Batteries 2022, 8(10), 144; https://doi.org/10.3390/batteries8100144
Submission received: 28 July 2022 / Revised: 29 August 2022 / Accepted: 21 September 2022 / Published: 25 September 2022

Abstract

:
In recent years, aqueous rechargeable lithium-ion batteries (ARLIBs) have attracted attention as an alternative technology for electrical storage. One of the perspective battery anode materials for application in ARLIBs is Bi2Se3, which has already shown good perspectives in the application of conventional lithium-ion batteries (LIBs) that use organic electrolytes. In this study, the electrochemical properties of Bi2Se3 thin films with two different layers on the electrode surface—the solid electrolyte interphase (SEI) and the Bi2O3 layer—were investigated. The results of this work show that the formation of the SEI layer on the surface of Bi2Se3 thin films ensures high diffusivity of Li+, high electrochemical stability, and high capacity up to 100 cycles, demonstrating the perspectives of Bi2Se3 as anode material for ARLIBs.

1. Introduction

LIBs have dominated the field of battery technology in the last few decades due to their remarkable advantages such as high energy density (>200 Wh kg−1), high Coulombic efficiency (>95%), and long cycle life (3000 cycles at the deep discharge of 20%) [1,2,3]. The disadvantages of lithium-ion batteries include the flammability of non-aqueous solvents (e.g., ethylene carbonate, dimethyl carbonate, etc.), which may lead to accidents, and the high costs of fabrication (the average LIB cell cost in 2021 was EUR 104/kWh) [4]. Alternatively, in 1994, Dahn’s group proposed aqueous rechargeable lithium-ion batteries (ARLIBs) consisting of LiMn2O4/VO2 in the 5 M LiNO3 electrolyte [5]. This battery demonstrated an average voltage of 1.5 V with an energy density of 75 Wh kg−1, which was higher than the energy density of Pb-acid batteries (30 Wh kg−1) [5].
For a long time, investigations on the development of aqua-based batteries were suspended due to several serious limitations—poor cycling performance, low voltage potential window (1.23 V), and decomposition of the water, which made these batteries commercially unviable [6]. In the last 5 years, the requirement for cheap, safe, and environmentally friendly energy storage devices has generated a great deal of interest. ARLIBs have been shown to be one of the potential candidates for the most suitable battery systems to meet these requirements. Thus, the interest in research into this battery technology has only increased [7]. Such a rapid development might allow for the production of ARLIBs with properties that are competitive in the worldwide market [8].
While significant progress has been achieved in the development of cathode materials (e.g., enhancement of mechanical stability), the research on anode materials has been limited [9]. Among a variety of material candidates for the ARLIBs anodes (e.g., Li1.2V3O8, VO2, TiP2O7) [10,11,12], the TiP2O7 is considered to be the most promising [10,13]; however, it suffers significant capacity fading during charge/discharge processes, which might be related to the deterioration of the anode material [11].
Another possible perspective anode material for ARLIBs comes from bismuth chalcogenides Bi2X3 (X = S, Te, Se), which are unique lamellar materials with high ionic conductivity that have shown great performance in organic electrolyte LIBs [12]. Among the chalcogenides, Bi2Se3 has the highest density and theoretical volumetric capacity (3667 mAh cm−3) [14], which, being coupled with its high electrical conductivity (10.6 S cm−1 at 300 K) [15], allows for the possibility of fabricating compact electrical devices [14,16].
The crystal lattice of Bi2Se3 consists of a sequential layer arrangement that is perpendicular to the trigonal C-axis [17]. Each molecule consists of five atomic planes arranged in the following pattern: Se1-Bi-Se2-Bi-Se1, where van der Waals gaps are located between Se1 atoms [18]. The thickness of such a quintuple layer is about 1 nm. The arrangement of quintuple layers provides enough space for Li+ during intercalation and deintercalation processes, which makes them suitable anode materials for LIBs [19].
While both Bi2Se3 and TiP2O7 have higher potential for Li+ intercalation than for H2 evolution, which allows for avoiding unwanted side reactions [20], Bi2Se3 is still considered a more unique material due to its quintuple layer structure. Bi2Se3 has a ~4 times higher theoretical gravimetric capacity than TiP2O7 (491 mAh g−1 [12] vs. 121 mAh g−1 [21]).
Additionally, in anode material research, special attention should be paid to the formation of the solid-electrolyte interphase (SEI) layer, which impacts the safety and stability of the anode electrode [22]. In aqueous electrolytes, the SEI layer consists of two layers: Li2O (inner layer) and Li2CO3 (outer layer), which are formed by Li+ reactions with dissolved O2 and CO2 [23,24,25,26,27]. For the ARLIBs, it is necessary to use concentrated aqueous electrolytes, which will ensure the formation of stable SEI layers as, in the diluted electrolytes, the SEI layer quickly undergoes hydrolysis and dissolves [25,27].
In this work, the electrochemical properties of Bi2Se3 thin films are investigated for the first time to evaluate their possible application as anode electrodes in ARLIBs. To examine the formation of the SEI layer and its effect on the performance of the Bi2Se3 anode, measurements were carried out in two different potential ranges. One of the potential ranges ensured the formation of the SEI layer on the surface of Bi2Se3, and the other did not. 5 M LiNO3 solution, which is electrochemically more stable than LiCl and Li2SO4 [28] and can be prepared in high concentrations (up to 9 M) [6], was used as an electrolyte.

2. Material and methods

2.1. Synthesis and Characterization of Bi2Se3

Bi2Se3 thin films were synthesized on microscope glass slides (25 × 75 mm) using the physical vapor deposition method [29,30,31]. The synthesis procedure was performed in a programmable quartz tube (length = 60 cm, diameter = 4.5 cm) furnace (GSL-1100x-S, MTI Corp.) with adjustable valves on both sides.
In total, 15 mg of raw Bi2Se3 (Sigma-Aldrich, Burlington, MA, USA, 99.999%) was weighted in ceramic boats using analytical scales (KERN “ABP 200-5DM”, ±0.01 mg, Balingen, Germany). Inside the quartz tube at certain temperature regions, microscope glass slides (330–380 °C) and raw Bi2Se3 (585 °C) were inserted. The quartz tube was connected to the N2 gas cylinder (Linde, Berlin, Germany, 99.999%) and a vacuum pump. Before the synthesis, the quartz tube was purged with N2 and vacuumed. The synthesis of Bi2Se3 thin films was performed according to the following protocol: first, linear heating of the quartz tube for 45 min up to a temperature of 585 °C; second, maintaining a constant temperature for 15 min (pressure 2–3 Torr); and third, gradual cooling down to 470 °C, reinjecting N2 gas into the tube up to atmospheric pressure, and cooling down to room temperature.
The morphology and stoichiometry of the samples were investigated with a scanning electron microscope (SEM) (Hitachi FE-SEM S-4800, Marunouchi, Tokyo, Japan) equipped with an energy-dispersive X-ray (EDX) (Bruker XFLASH 5010, Billerica, MA, USA) detector, X-ray diffraction analysis (XRD) (Bruker D8 Discover, Billerica, MA, USA), and X-ray photoelectron spectroscopy (XPS) (ThermoFisher Escalab 250Xi+, Walthman, MA, USA) with monochromatic Al-Kα X-ray source).

2.2. Electrochemical Measurements

The electrochemical measurements were performed at room temperature using a 3-electrode cell with 3 M Ag/AgCl as a reference electrode (RE), Pt wire as a counter electrode (CE)—(ItalSens, PalmSens, Houten, The Netherlands), and Bi2Se3 thin film on the glass substrate as a working electrode (WE)—(Supplementary Figure S1). 5 M LiNO3 (ThermoFisher, Walthman, MA, USA, analytical grade 99%) was used as an electrolyte. To ensure appropriate electrical contact, copper wire was fixed to the surface of the working electrode with silver conductive paint (Electrolube, Ashby-de-la-Zouch, UK). Cyclic voltammetry (CV), electrochemical impedance spectroscopy (EIS), and galvanostatic charge/discharge measurements were performed by potentiostat PalmSens4. CV curves were measured at different scan rates (0.1–1.0 mV s−1). The galvanostatic charge/discharge measurements were carried out at room temperature with a C-rate of 1 C. EIS spectra were measured in the frequency range of 0.01–10000 Hz at open circuit potential before and between the galvanostatic charge/discharge cycles (after the 1st, 2nd, 5th, 50th, and 100th cycle). After CV measurements, the Bi2Se3 samples were washed ~4–5 times with deionized water, dried, and investigated using the SEM, EDX, and XPS analysis methods.

3. Results and Discussion

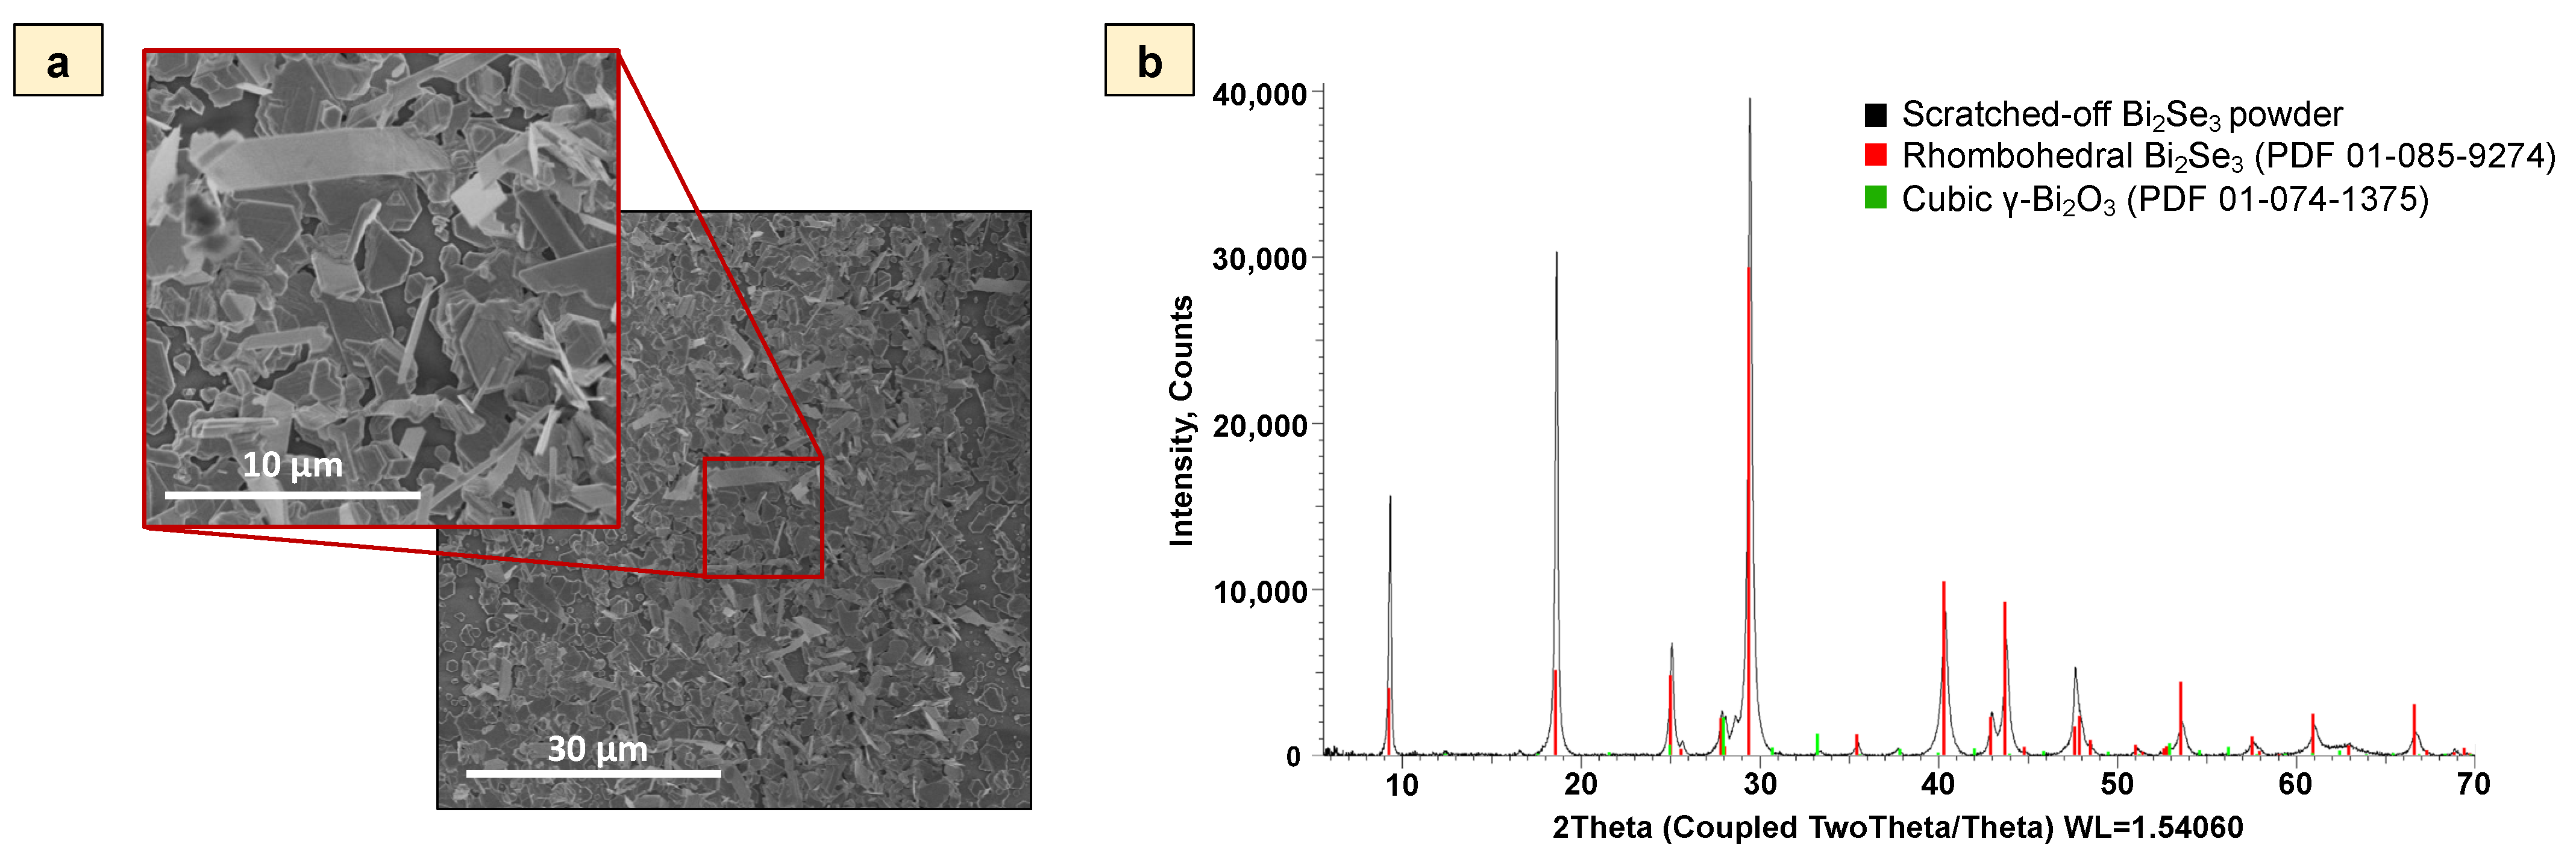
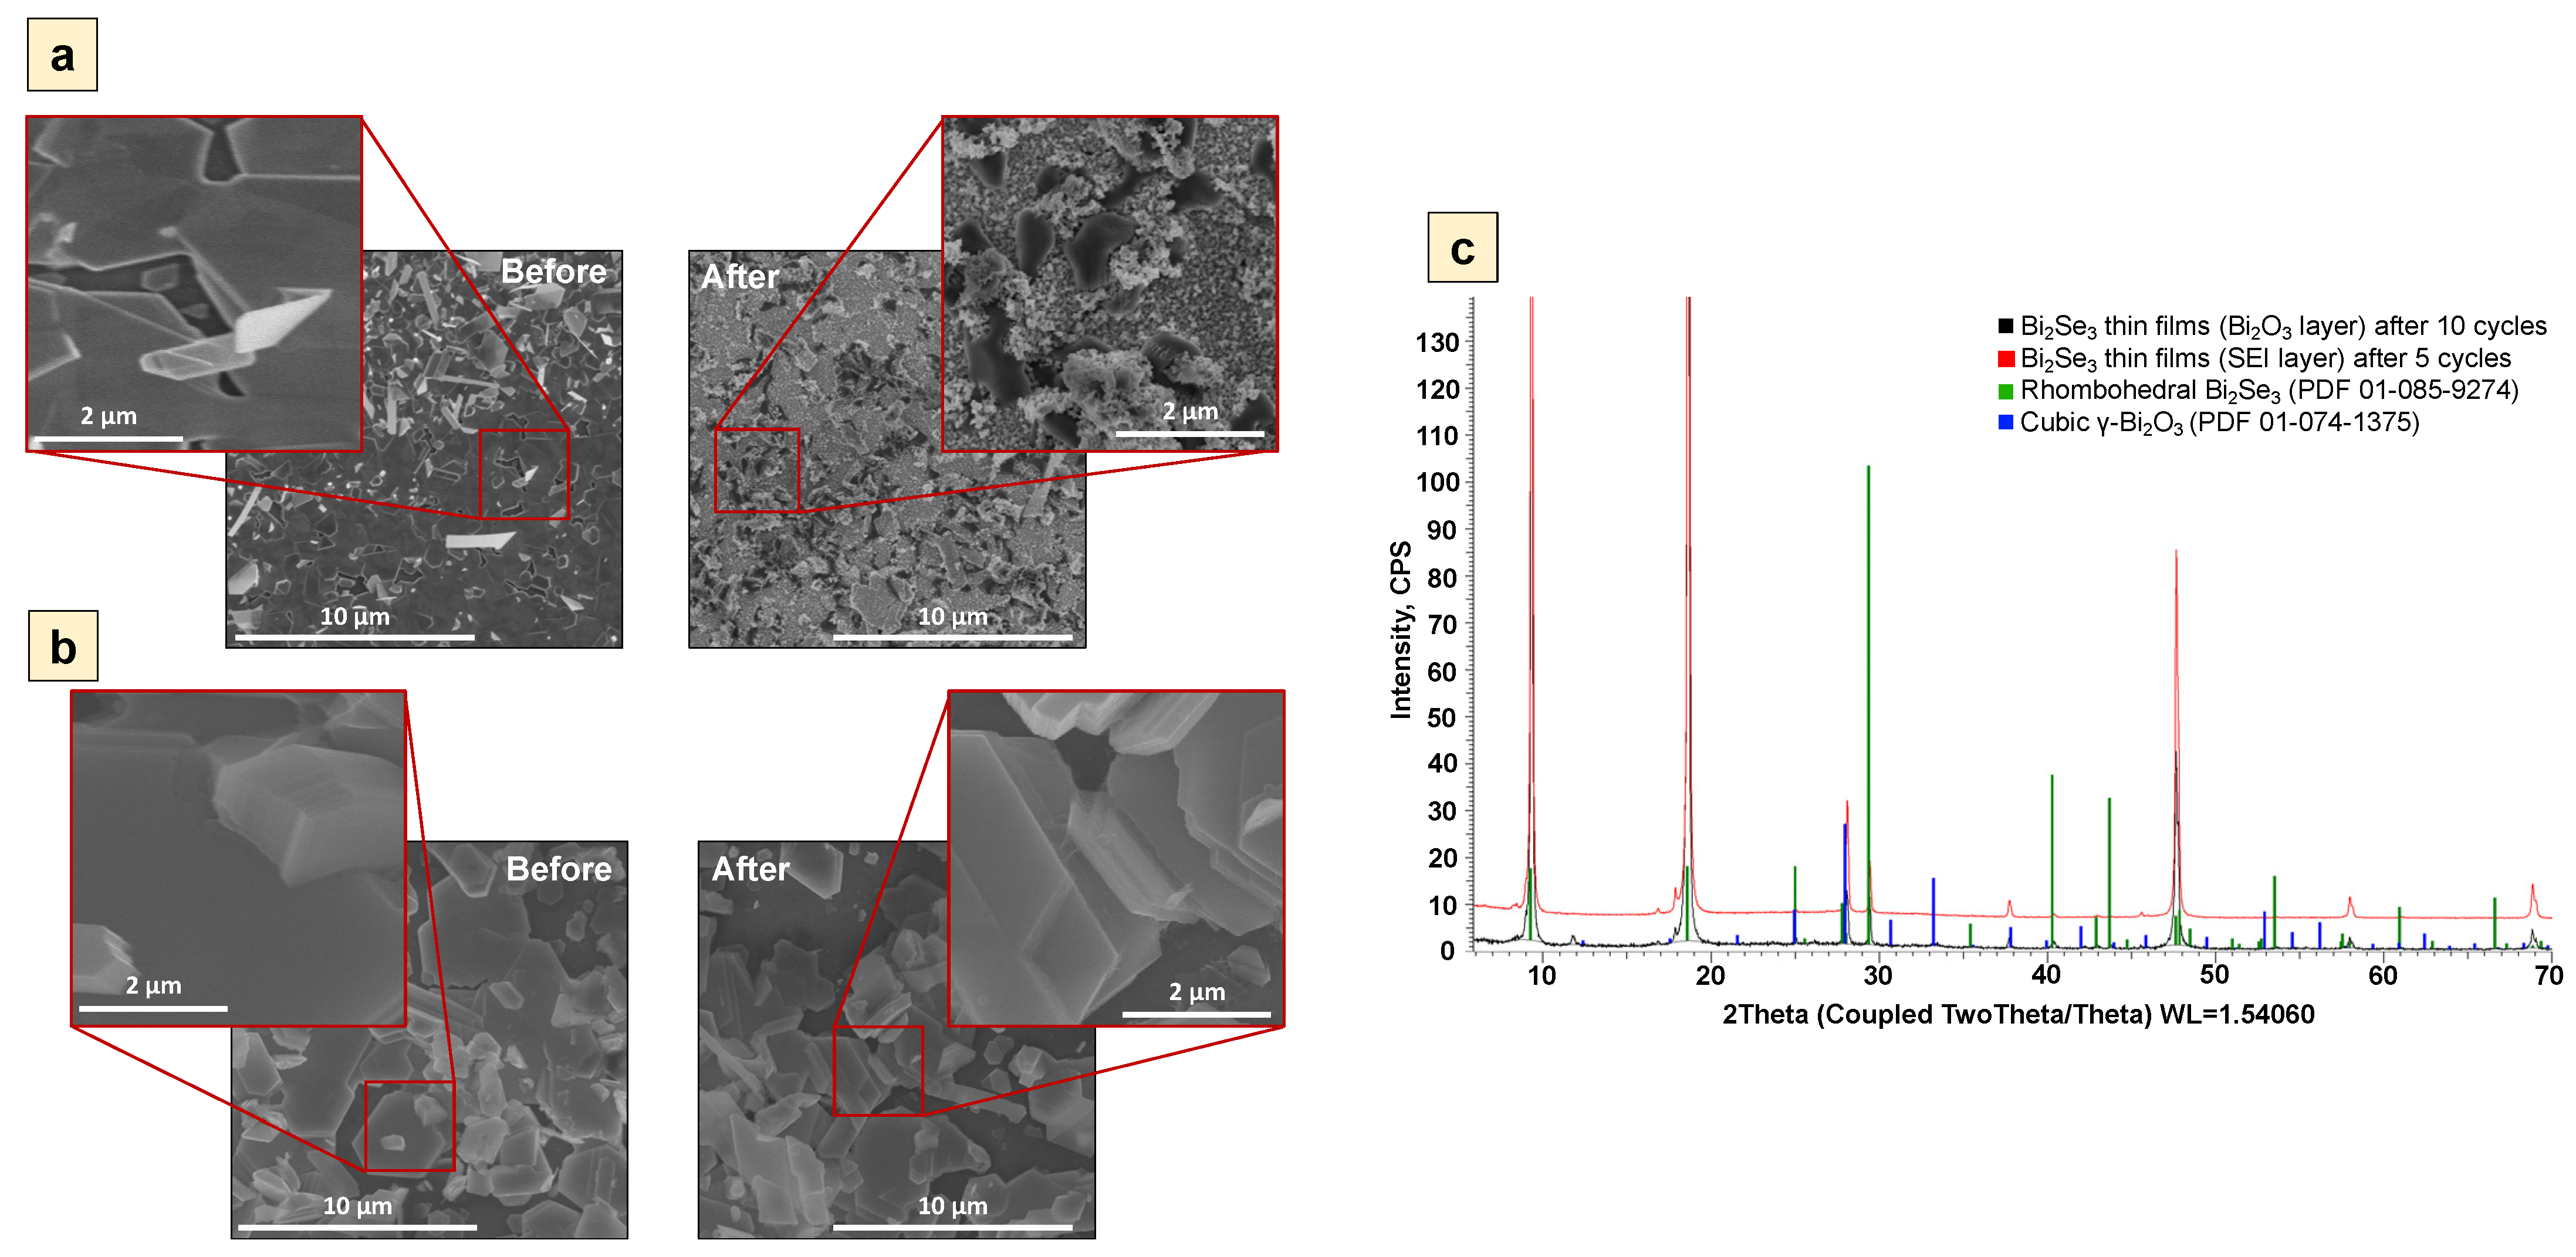
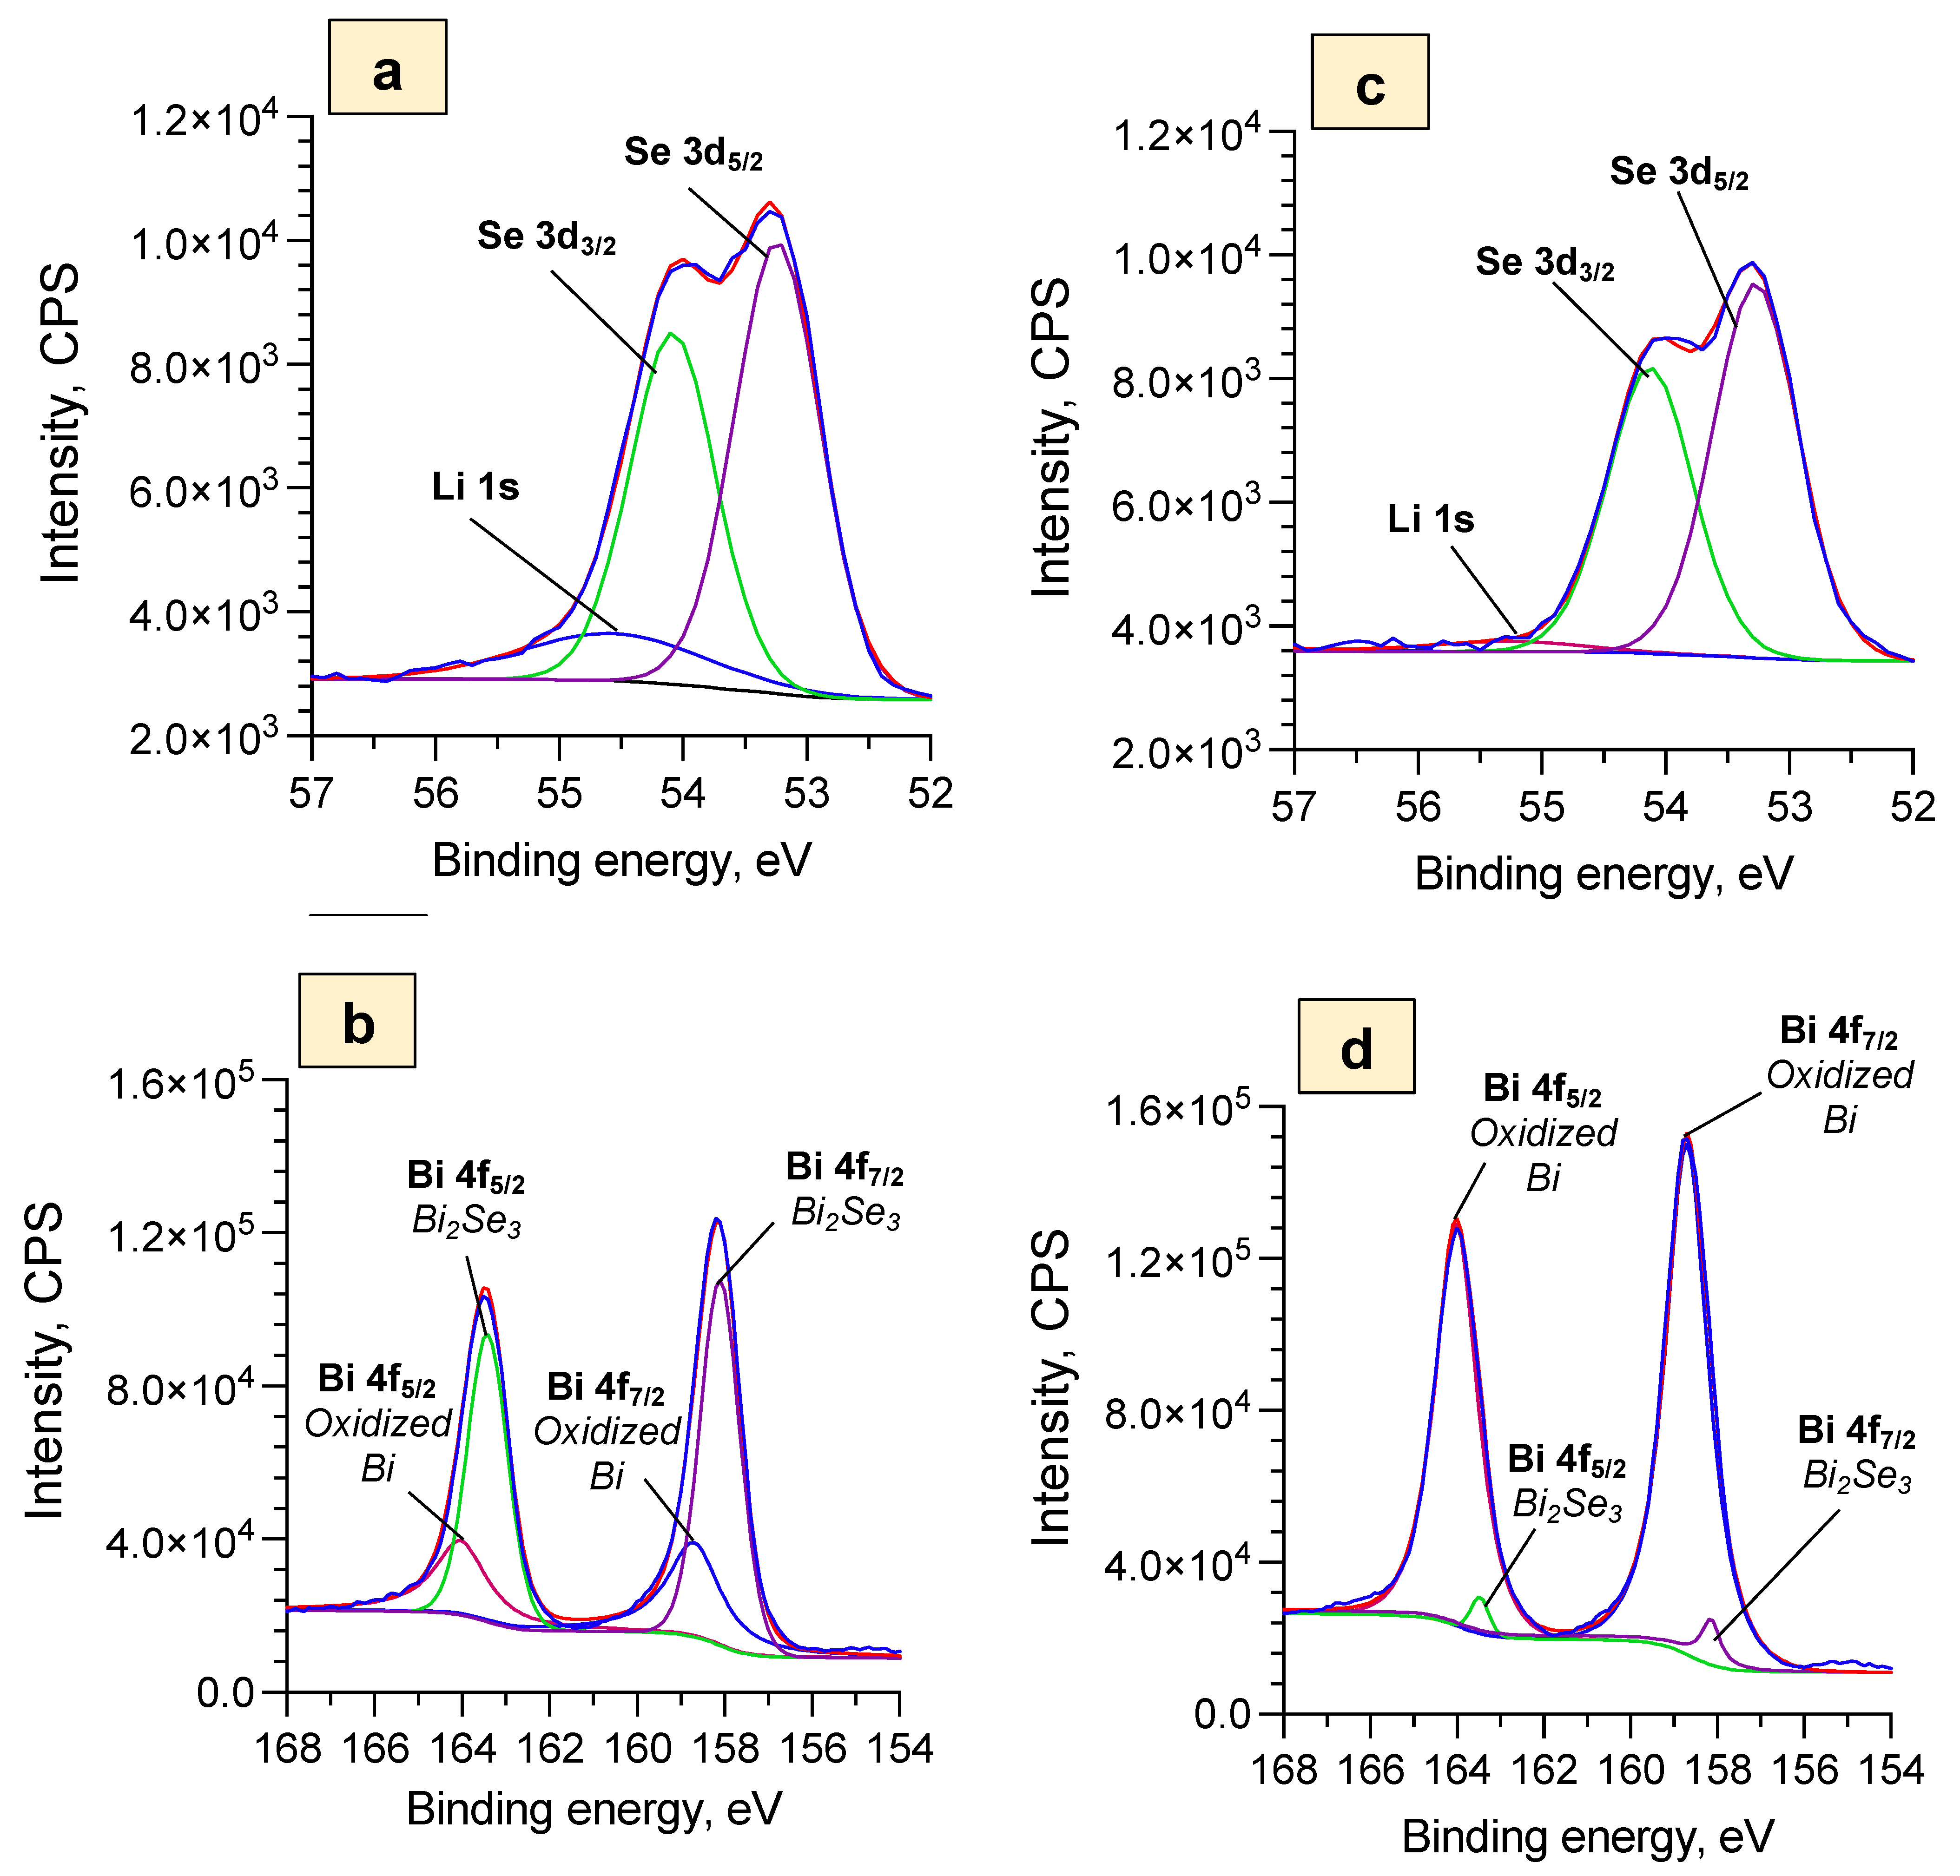
3.1. Characterization of Synthesized Bi2Se3 Thin Film

To increase the effective interaction surface between the electrode and the electrolyte, the synthesis method for Bi2Se3 thin films with nanoplates that grow at different angles (partly disordered) to the substrate surface was selected [32,33] (Figure 1a). This type of Bi2Se3 morphology has no dead volume or gap spacing shrinkage [34] which could lead to the decrease of the anode active sites, thus making it a promising candidate as anode material for ARLIBs. The size of the nanoplates varied between 1.0 and 8.0 μm. The thickness of the synthesized Bi2Se3 thin films with partly disordered nanoplates was between 350 and 500 nm. The EDX spectra (Supplementary Figure S2) showed intensive peaks of C, O, Se, Si, and Bi. Si, O, and C peaks were the background signals from the microscope glass slides on which Bi2Se3 was synthesized. The Se/Bi atomic ratio determined from the EDX spectra was 1.44 ± 0.03, which is close to the theoretical stoichiometric ratio of Bi2Se3 (1.50) and indicates a rather uniform chemical composition of the films. The XRD pattern (Figure 1b) of Bi2Se3 powder obtained by scratching the synthesized thin film off the substrate showed Bi2Se3 diffraction peaks, which refer to the rhombohedral (R-3 m) crystal system of Bi2Se3 (Ref. card No. PDF 01-085-9274): a = b = 4.13850 Å; c = 28.62400 Å, as well as cubic γ-Bi2O3 (I23) (Ref. card. No. PDF 01-074-1375) with crystal system a = b = c = 10.08000 Å. It should be noted that the difference in the peak intensity ratios between the reference cards and the actual XRD patterns obtained for the powdered Bi2Se3 thin films most likely are related to the impact of the substrate on the growth of Bi2Se3 thin films, resulting in the domination of certain crystallographic growth directions [32,33]. The formation of Bi2O3 could be explained by the oxidation of Bi2Se3 powder, which, due to its increased surface area after scratching, is more prone to oxidation in an ambient environment.

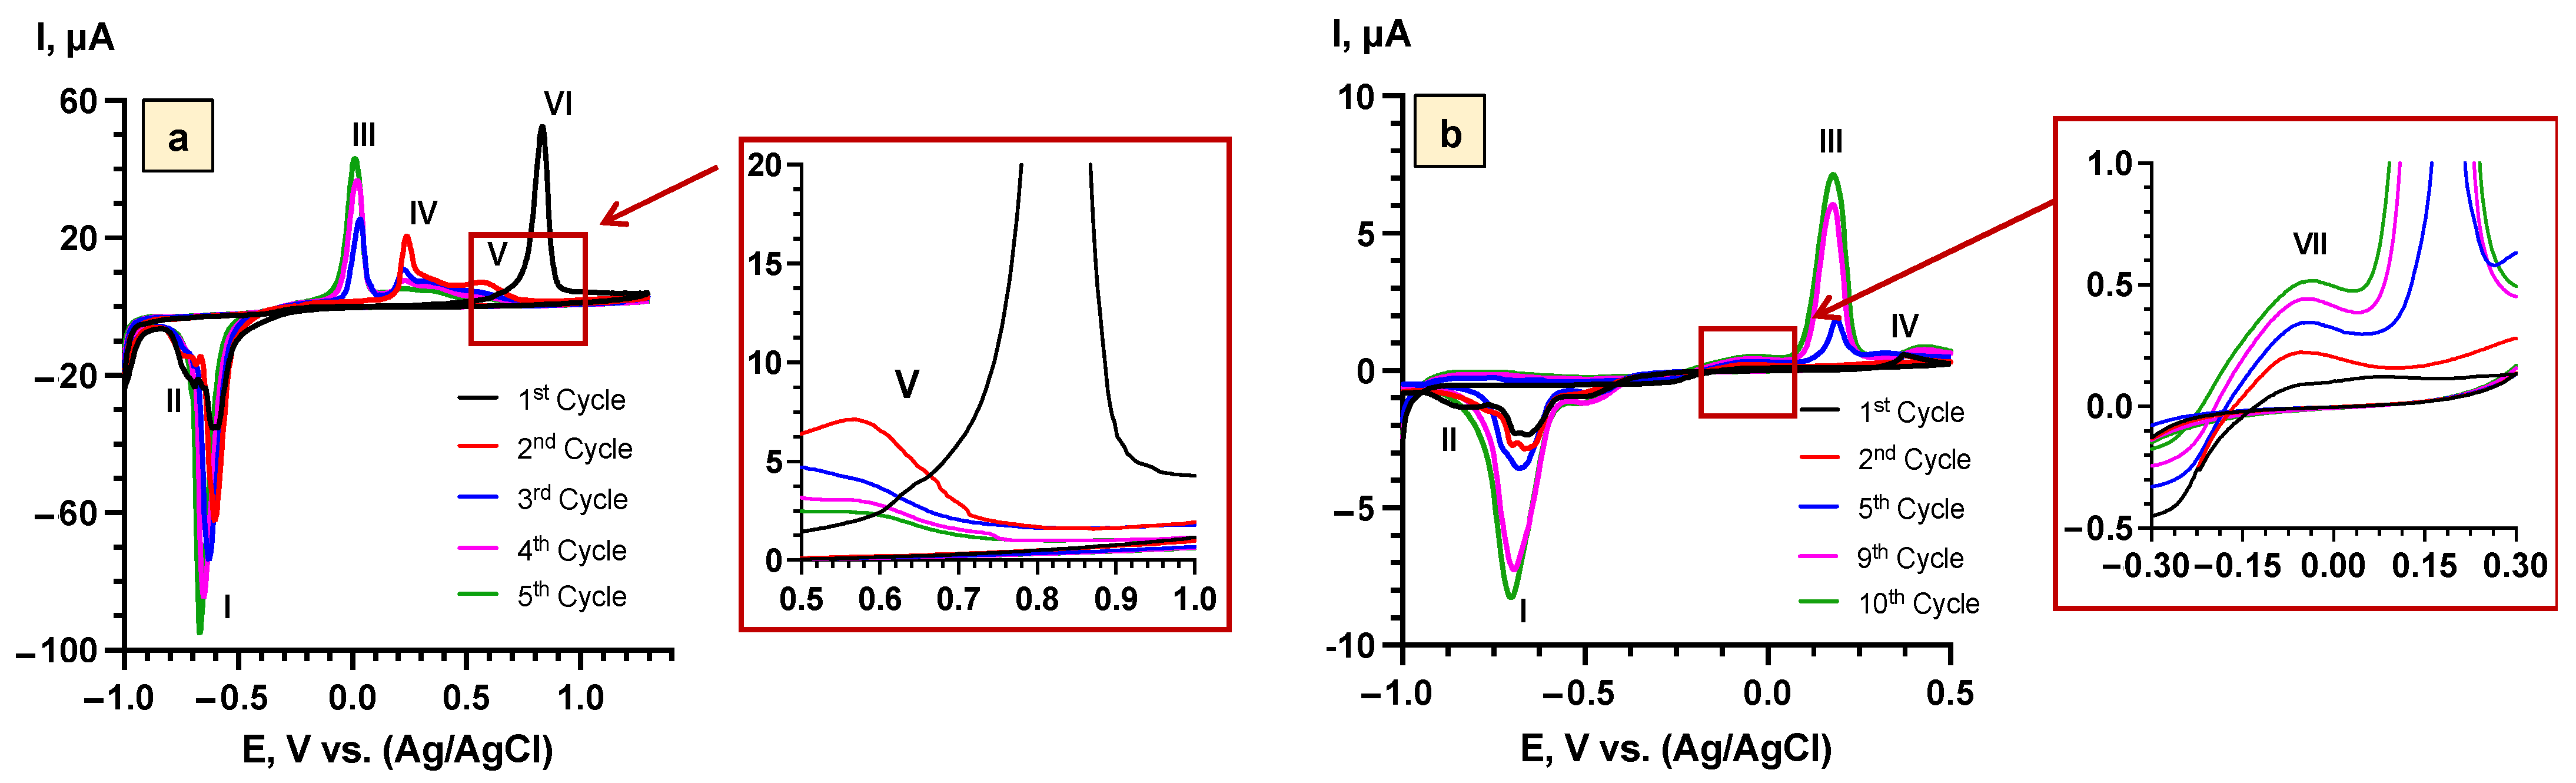
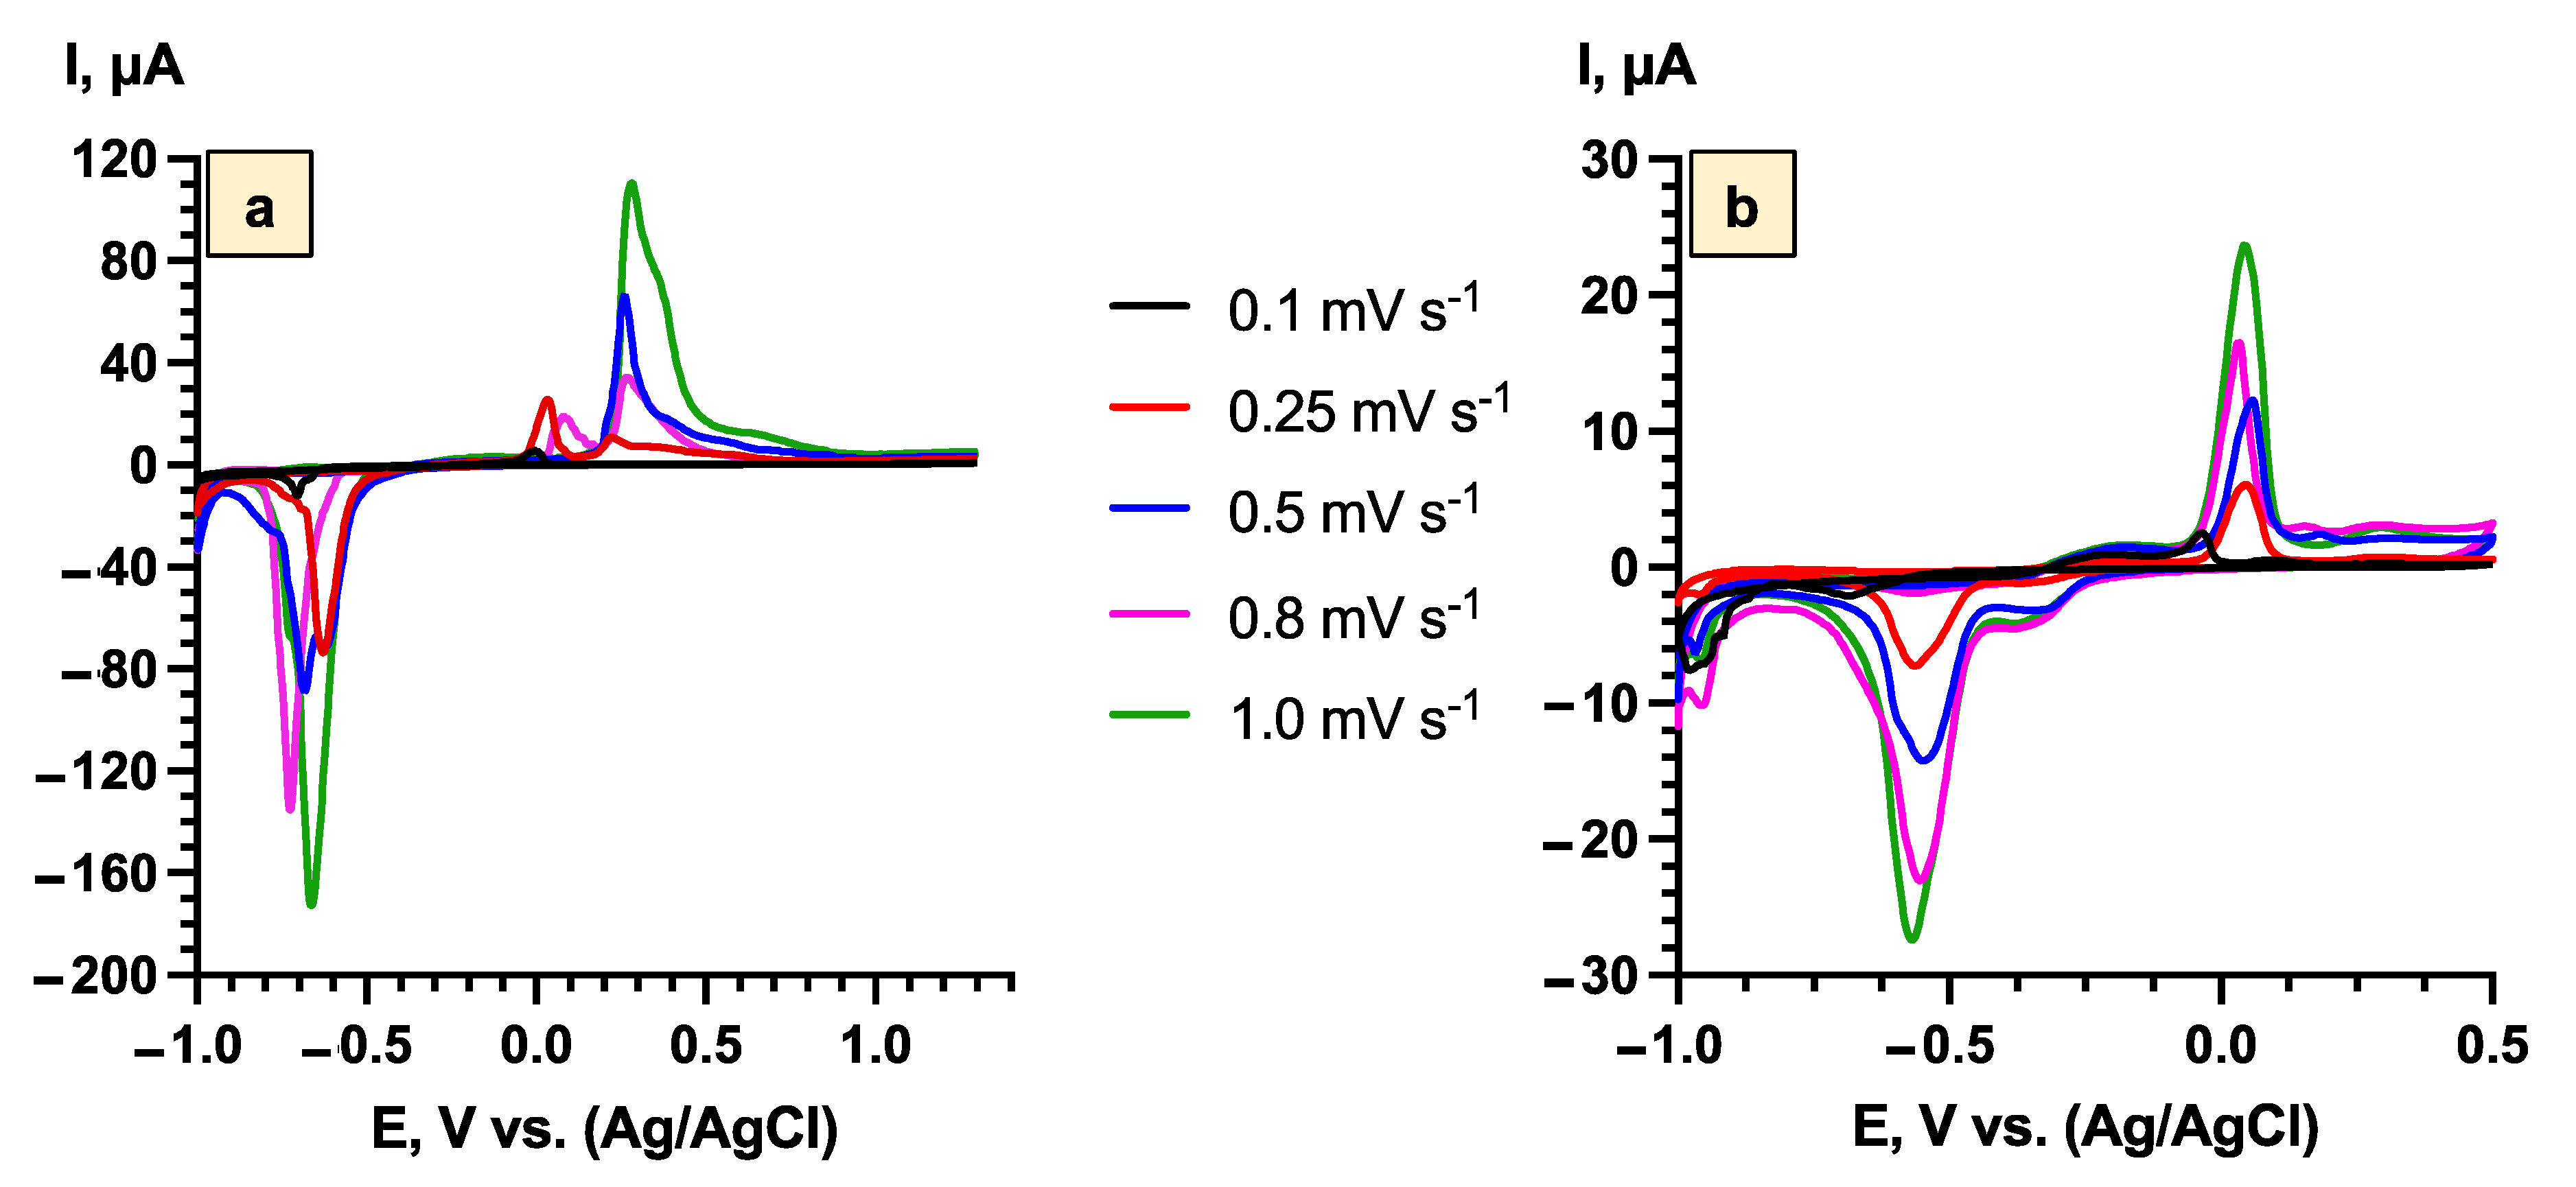
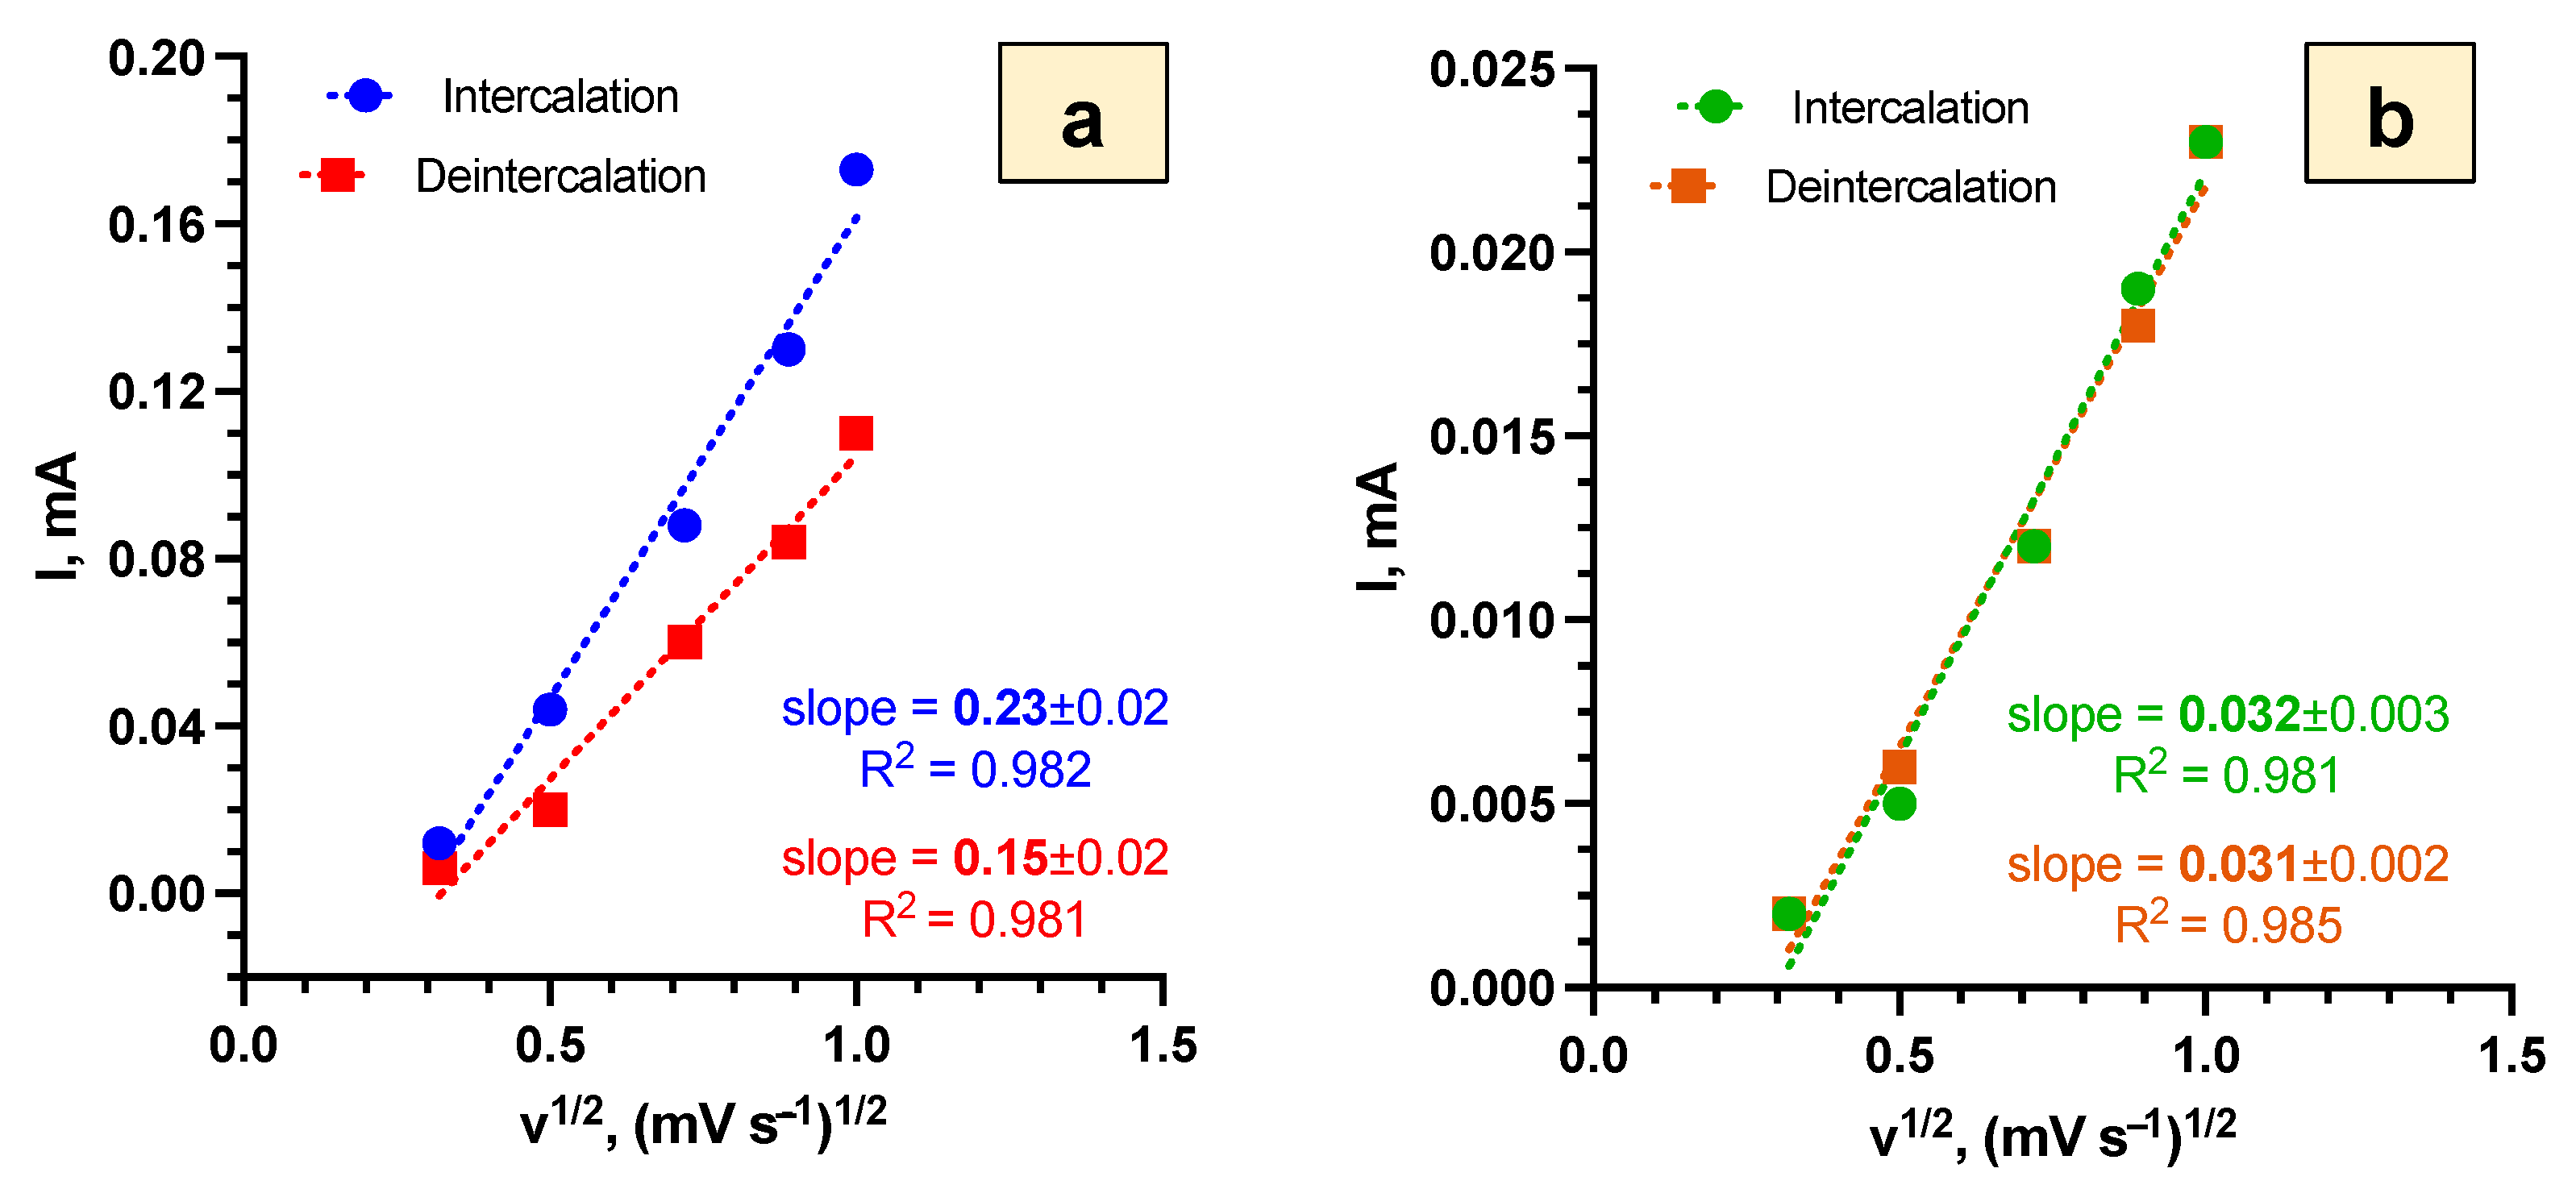
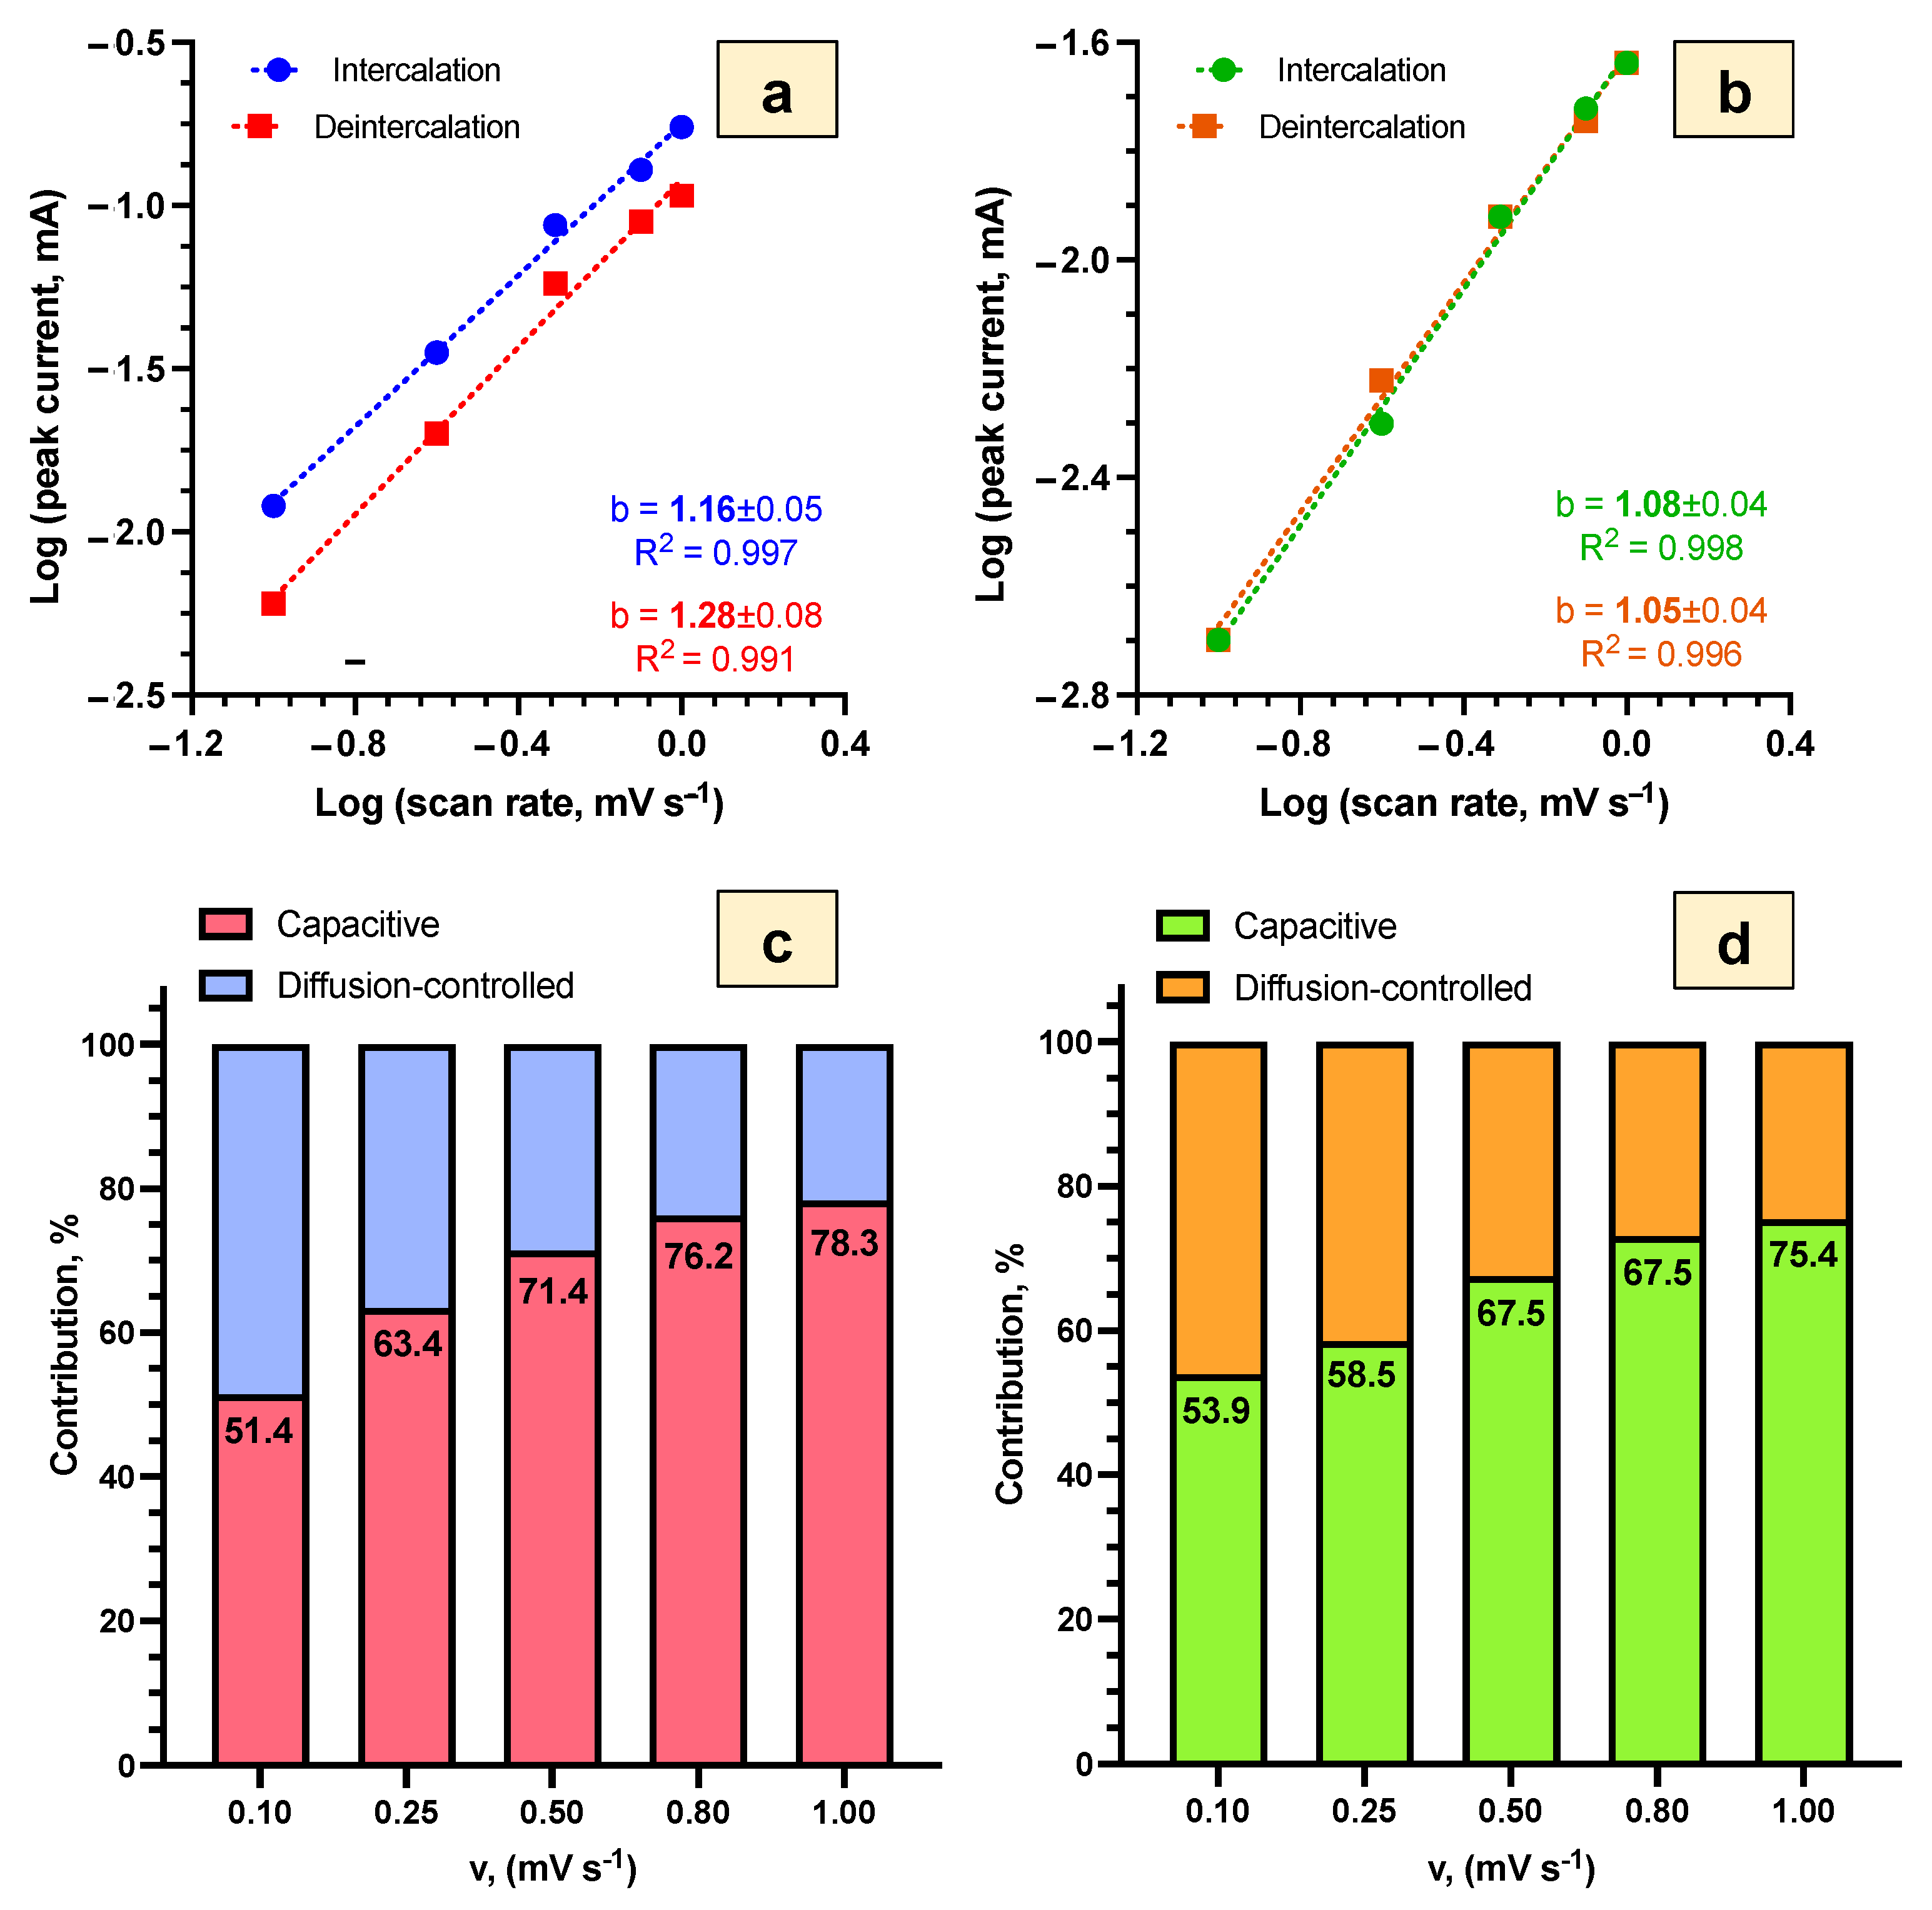
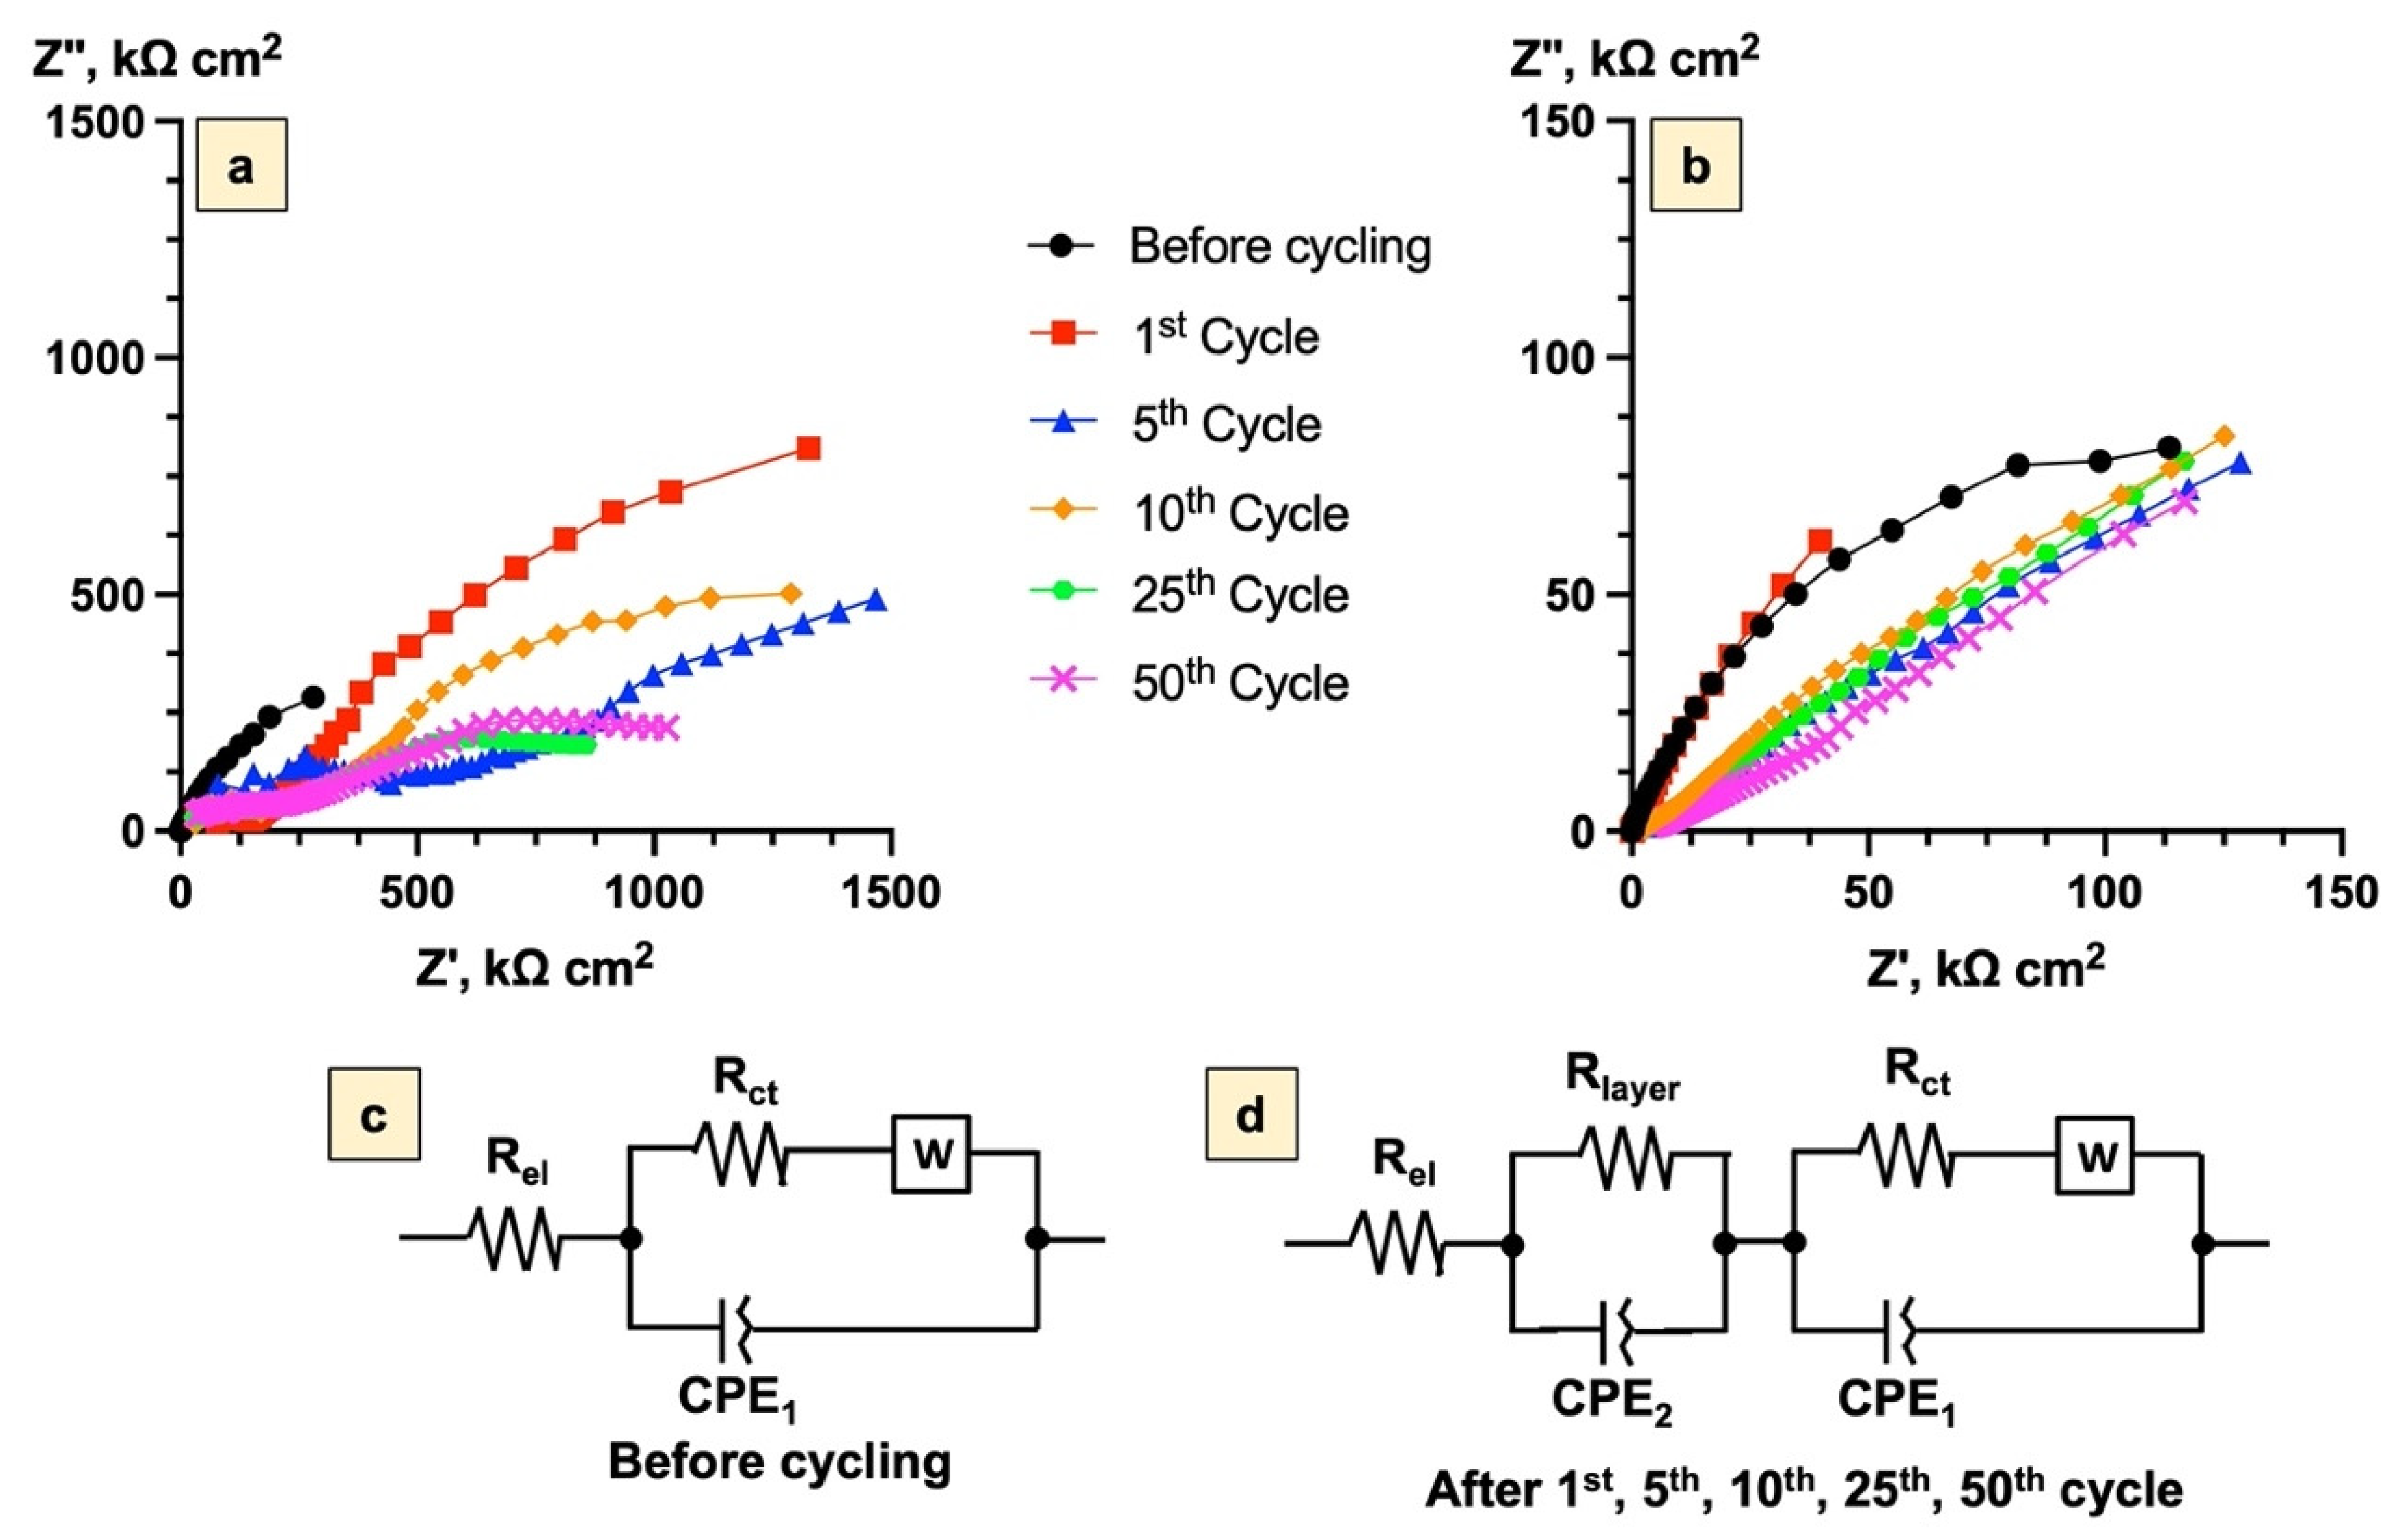
3.2. Electrochemical processes and mechanisms of Bi2Se3 thin film

Cyclic voltammetry of Bi2Se3 thin films in 5 M LiNO3 at the scan rate of 0.25 mV s−1 in the potential range (−1.0 ÷ 1.3 V vs. Ag/AgCl) showed two cathodic peaks (I, II) and four anodic peaks (III, IV, V, VI) (Figure 2a). The peaks I (−0.65 V vs. Ag/AgCl) and III (0.02 V vs. Ag/AgCl) represent the intercalation/deintercalation processes of Li+ according to the reaction in Equation (1) [19]. The peaks II (−0.71 V vs. Ag/AgCl) and IV (−0.65 V vs. Ag/AgCl) are related to the substitution reaction of Bi2Se3 and Li2Se (Equation (2)) [18,35]. Anodic peak V (0.61 V vs. Ag/AgCl) might describe a formation of NO2 from NO3 (Equation (3)) [36]. NO2 can be rapidly oxidized back to NO3 due to the presence of dissolved O2 in the electrolyte [37]. The peak VI (0.84 V vs. Ag/AgCl) appeared only in the first cycle and was attributed to the formation of the SEI layer, which, according to the literature on the other aqueous Li+ systems (Mo6S8, carbon-coated TiO2, and carbon electrodes), is most probably composed of Li2O and Li2CO3 (Equations (4) and (5)) [24,25,26,38,39].
To avoid the formation of NO2 in the solution (at 0.61 V vs. Ag/AgCl) and to investigate the impact of the SEI layer on the stability and operation of the Bi2Se3 electrode in the aqueous electrolyte, parallel experiments were performed in the narrower potential range (−1.0 ÷ 0.5 V vs. Ag/AgCl) (Figure 2b). In this case, a new low-intensity anodic peak VII (−0.05 V vs. Ag/AgCl) appeared starting from the second cycle. This peak might be related to the formation of the Bi2O3 layer on the surface of Bi2Se3 by the reaction with dissolved oxygen in the electrolyte (Equation (6)) [40,41]. For the wide potential range (−1.0 ÷ 1.3 V vs. Ag/AgCl), this peak was not observed, which indicates that, after the formation of the SEI layer on the surface of Bi2Se3, further formation of Bi2O3 was inhibited. Further in the text, both potential ranges are referred to as “samples with the SEI layer” (−1.0 ÷ 1.3 V vs. Ag/AgCl) and “samples with the Bi2O3 layer” (−1.0 ÷ 0.5 V vs. Ag/AgCl).
It is important to note that the CV peak potential values obtained in this work may differ from the values reported in the literature by 0.6–1.0 V in terms of the standard hydrogen potential scale. This is due to the fact that, in this work, the 3-electrode cell configuration was used, which allowed us to measure the properties of the anode material solely, while in the literature, the 2-electrode cell configuration was applied, thus measuring the properties of the whole cell.
Bi2Se3 + xLi+ + xe ↔ Li+x[Bi2Se3]x−,
Bi2Se3 + 6Li+ + 6e ↔ 3Li2Se + 2Bi,
NO3 + 2H+ +2e → NO2 + H2O,
O2 + 4Li+ + 4e → 2Li2O,
2Li+ + ½O2 + CO2 + 2e → Li2CO3,
4Bi3+ + 3O2 + 6e → 2Bi2O3.
For both samples with the formed SEI layer and with the Bi2O3 layer, the intensities of peaks corresponding to Li+ intercalation/deintercalation processes (I, III) in subsequent cycles increased (Figure 2a,b). The increase in the intensity of Li+ intercalation/deintercalation processes may be related to the pre-treatment of Bi2Se3. The pre-treatment involves the stabilization of the SEI (−1.0 ÷ 1.3 V vs. Ag/AgCl) and the Bi2O3 (−1.0 ÷ 0.5 V vs. Ag/AgCl) layers until their continuous coverage of the entire electrode’s surface.
Charge/discharge curves obtained for the Bi2Se3 thin films in the potential range (−1.0 ÷ 1.3 V vs. Ag/AgCl) at the C-rate 1C (Figure 3a) exhibited, in the first cycle, a plateau near 0.6 V. This confirmed the formation of the SEI layer. In the next cycles, this plateau was not observed, which confirms that the layer formation process was finished. These findings are in line with the data reported by the other groups, pointing out that the fully developed SEI layer, which is stable and ensures long-term capacity retention and high Coulombic efficiency, forms in the first cycle due to an irreversible electrochemical reaction [42]. In the subsequent cycles, charge (−0.55 V) and discharge (−0.02 V) plateaus, corresponding to Li+ intercalation and deintercalation, respectively, were observed (Figure 3a). Although the SEI layer was formed in the first cycle, the charge/discharge profiles were changing until the third cycle (samples with the SEI layer), indicating that, during the first three cycles, the surface pre-treatment took place. After the pre-treatment of the Bi2Se3, the charge/discharge profiles did not change significantly (Figure 3a).
Additionally, the voltammograms (Figure 2a) showed that after the formation of the SEI layer in the first cycle, the peaks corresponding to the processes of Li+ intercalation/deintercalation slightly shifted towards the negative potential, which might be related to the structural and textural modification of Bi2Se3 [43]. A similar tendency was also observed for the anodic peak (V) associated with NO2 formation, where, after the first cycle, the peak had shifted from 0.67 V to 0.61 V vs. Ag/AgCl (Figure 2a).
For the samples with the Bi2O3 layer, the plateau corresponding to the intercalation process was observed already in the first cycle, while the plateau corresponding to the deintercalation process was observed starting with the second cycle (Figure 3b), as there were no Li+ ions intercalated into Bi2Se3 at the beginning of the first anodic (discharge) scan from −1 V to 6 + 0.5 V vs. Ag/AgCl. The change in the charge/discharge profiles was observed up to the ninth cycle (Figure 3b), indicating slower pre-treatment of the Bi2Se3 surface in comparison to the samples with the SEI layer, as well as the formation of the Bi2O3 layer.
After pre-treatment, the formed SEI or Bi2O3 layers on the surfaces of the Bi2Se3 electrodes inhibited further substitution reaction (Equation (2)), which is characterized by decreased peak intensities (II, IV).
The comparison of the heights of the peaks corresponding to Li+ intercalation/deintercalation (I, III) showed that they were up to 10 times higher for the samples with formed SEI layers than for the samples with formed Bi2O3 layers, which could have been related to the higher transportation rate of Li+ in the samples with the SEI layer. This may mean that, while Bi2O3 has been shown as a suitable additive in Bi2Se3 water-based battery systems [44], its performance as an “SEI” layer is not optimal as its high density inhibits ion transport.
SEM images and XRD patterns acquired from the samples’ surface XPS spectra demonstrated the structural differences of the Bi2Se3 thin film surface before and after 5 cycles and 10 cycles for the samples covered with continuous SEI and Bi2O3 layers, respectively (Figure 4 and Figure 5).
According to the observation by SEM, the surface of the sample with the SEI layer after five cycles was coated with amorphous material (Figure 4a). The XPS data (Figure 5a) showed a noticeable Li 1s peak, which may indicate the presence of Li2O and Li2CO3. The water-soluble Li2O could have been preserved if the Li2CO3 had grown on top of it and had shielded it from the electrolyte (Equations (4) and (5)). While the XRD pattern of the sample with the SEI layer demonstrated pure rhombohedral Bi2Se3 (R-3 m) without the initial cubic y-Bi2O3 signal (Figure 4c), the XPS data still showed a Bi2O3 signal (Figure 5b). This indicates that the initial Bi2O3 has remained, but further growth of the Bi2O3 was inhibited by the formation of the SEI layer.
In turn, the sample with the Bi2O3 layer after 10 cycles had a smooth surface (Figure 4b), which could mean that the Bi2Se3 thin film was covered with the thin and dense Bi2O3 layer. This assumption is supported by both XRD and XPS data where a small cubic γ-Bi2O3 (I23) peak (Figure 4c) and very pronounced peaks related to the oxidized Bi (Bi 4f, Figure 5d) were detected. It should be noted that only a very small peak of Bi2Se3 is observed in the surface layer of the sample (Figure 5c), which confirms that it is mainly composed of Bi2O3 and proves the formation of continuous dense layers of Bi2O3. In addition, the representing SEI layer Li 1s peak is negligible for the samples coated with the Bi2O3 layer (Figure 5c), which proves the absence of SEI layers composed of Li2O and Li2CO3 on the surface of these samples.
These data support the claim that, during cycling in the potential window (−1.0 ÷ 0.5 V), the dense Bi2O3 layer is formed, and this layer may inhibit Li+ intercalation/deintercalation processes, which results in the decrease of the heights of the CV peaks for the samples coated with the Bi2O3 layer (Figure 2).
The stability of Bi2Se3 thin films in terms of the chemical composition of Bi and Se was checked with EDX before cycling and after the fifth (sample with the SEI layer) and ninth (sample with the Bi2O3 layer) cycles. While it is well known that Bi2Se3 tends to lose selenium during the cycling [15], the results of this study demonstrate that the dissolution of Se for both samples covered with SEI and Bi2O3 layers was negligible (Table 1), which indicates the good stability of the Bi2Se3 electrode in the LiNO3 for the first 5 (SEI layer) and 10 (Bi2O3 layer) cycles.
Charge/discharge profiles up to 100 cycles for the samples with the SEI and Bi2O3 layers demonstrated Li+ intercalation/deintercalation plateaus from the 5th to 25th cycle (Figure 3c,d). After the 25th cycle, these plateaus were not observable anymore, which might be due to the fast process of Li+ intercalation/deintercalation [45].
To investigate the mechanisms of Li+ intercalation/deintercalation processes in the Bi2Se3 thin film, the CV curves were obtained at different scan rates (0.1–1.0 mV s−1) after the surface pre-treatment was finished (the third cycle for the samples with SEI layer (Figure 6a) and ninth cycle for the samples with Bi2O3 (Figure 6b)).
The dominant stage of Li+ intercalation/deintercalation processes (diffusion-controlled or capacitive process) was determined by Equation (7) [46]:
I = a v b ,
where I is the current of the Li+ intercalation/deintercalation process (mA), v is the scan rate (mV s−1), and a, b are the adjustable fitting values.
Calculated from the linear regression slopes (Figure 7a,b), the b-values for both samples with SEI and Bi2O3 layers varied from 1.05 to 1.28, indicating the dominant contribution of the capacitive process (pseudo-capacitance and electrical double-layer capacitance) to the Li+ intercalation/deintercalation in both potential ranges. The quantitative contribution of the capacitive and diffusion-based processes in Li+ intercalation/deintercalation at different scan rates (Figure 7c,d) was determined by Equation (8):
i ( V ) = k 1 v + k 2 v 1 2 ,
where i(V) is the current of the Li+ intercalation/deintercalation process, k1v is the contribution of the capacitive process, and k2v1/2 is the contribution of the diffusion-controlled process [47,48].
At the scan rate of 0.1 mV s−1, the contribution of the capacitive process to Li+ intercalation/deintercalation was similar (51.4% and 53.9%) for the samples with SEI and Bi2O3 layers, respectively (Figure 7c,d). With the increasing scan rate, the contribution of the capacitive process increased, and at the scan rate of 1.0 mV s−1, it reached 78.3% for the samples with the SEI layer and 75.4% for the samples with the Bi2O3 layer. The higher contribution of the capacitive processes to the Li+ intercalation/deintercalation process in the scan rate range from 0.25 to 1.00 mV s−1 indicates the removal of limitations on charge transfer processes for both SEI and Bi2O3 layers.
As the capacitive processes of Li+ intercalation/deintercalation were similar for the samples with the SEI and Bi2O3 layers, and thus could not explain the differences between them, the diffusion coefficients for Li+ intercalation/deintercalation were determined. The diffusion coefficients of Li+ intercalation/deintercalation were calculated from the slope fitted values (Figure 8) using Equation (9) [49]:
D = ( s l o p e 0.446 n F A C ) 2 ( R T n F ) ,
where D is the diffusion coefficient (cm2 s−1), slope is the slope value, n is the number of electrons, F is the Faraday constant (C mol−1), A is the surface area (cm2), C is the electrolyte concentration (mol cm−3), R is the universal gas constant (J K−1 mol−1), and T is the temperature (K).
Calculated diffusion coefficient values (Table 2) show that, in the first approximation, Li+ diffusion for samples with the SEI layer was higher than for the samples with the Bi2O3 layer by an order of magnitude.
Thus, it can be assumed that the formation of less dense Li2O and Li2CO3 SEI layers ensures the faster transportation of Li+ in comparison to the Bi2O3 layer and can be the contributing factor to the difference in the peak intensities in CV curves for both samples (Figure 2).
Estimations for the Bi2Se3 thin films with SEI layer Li+ diffusion coefficients were comparable with the values reported for the Li0.3V2O5 in Li+ aqueous electrolyte while exceeding the diffusion coefficients of TiP2O7 (1 M Li2SO4), as well as the diffusion coefficients reported for other anode materials—TiNb6O17 and TiNb2O7 tested in lithium non-aqueous electrolytes (Table 2). These results demonstrate that Li+ diffusion coefficients for Bi2Se3 anodes in the 5 M LiNO3 electrolyte are sufficient for their perspective application in ARLIBs systems.
To investigate the changes in the electrochemical properties of the Bi2Se3 thin film electrode over 100 cycles for the samples with formed SEI (Figure 9a) and Bi2O3 (Figure 9b) layers, EIS measurements were carried out. The obtained impedance hodographs were described using the standard equivalent circuit schemes, which represent the electrochemical properties at the electrolyte/electrode interface. The schemes were complicated by the presence of a constant phase element (CPE1), which, in addition to the capacity of the double layer, characterized the inhomogeneity of the surface of the working electrode. The Warburg element indicated the diffusion of the reacting ions and/or molecules to the electrode surface. Rel values demonstrated not only the resistance of the electrolyte but also the penetrability of the electrolyte within the electrode [53] (Figure 9c). During the cycling, the SEI layer for the first sample and the Bi2O3 layer for the second sample were modeled as a capacitor formed by a CPE (characterizing the heterogeneity and the double-layer capacitance of the layer), with a parallel resistance for the charge transfer reaction (Figure 9d).
The resistance values of the electrochemical processes (Table 3) were calculated using the Levenberg–Marquardt algorithm [54].
The values of Rel remained almost unchanged during the cycling, indicating good stability of the electrolyte over the whole 100 cycles for both samples. The Rel values were 2.8 ± 0.3 kΩ cm2 and 1.6 ± 0.3 kΩ cm2 for the samples with the SEI layer and the Bi2O3 layer, respectively (Table 3). However, in the first five cycles, the Rel values for both cases were significantly lower, which might be related to the pre-treatment processes of the Bi2Se3 thin films, including the stabilization of the surface layer which was also confirmed by the CV curves (Figure 2). For the sample with the SEI layer, Rel was ~2 times higher than for the sample with the Bi2O3 layer, which might indicate that the processes occurring with the participation of the electrolyte are more complicated in the first case.
The semicircle at the medium-frequency range (Figure 9a,b) represents the charge-transfer resistance Rct of Bi2Se3 thin films. Starting from the first cycle, Rct values decreased ~4 times and ~9 times for the samples with SEI and Bi2O3 layers, respectively, which may be related to the beginning of textural and structural changes of the Bi2Se3 surface. After the 2nd cycle, the Rct for the sample with the Bi2O3 layer was almost constant (17 ± 5 kΩ cm2) until the 100th cycle, while, for the sample with the SEI layer, these values increased (from 154 kΩ cm2 to 1965 kΩ cm2). This might indicate the continuation of the textural and structural changes of the Bi2Se3 thin films with the formed SEI layer. The ~4 times decrease of Rct after the 100th cycle most likely corresponds to the electrochemical and mechanical degradation of the electrode.
For the samples with the SEI layer, the Rct was ~10–50 times higher than for the samples with the Bi2O3 layer, which might be related to the different structures of the SEI and Bi2O3 layers.
From the 1st to the 100th cycle, a small semicircle corresponding to Rlayer was observed in the low-frequency range (Figure 9a,b). For the sample with the formed SEI layer, Rlayer gradually decreased ~10 times from the 1st to the 100th cycle, probably indicating the mechanical and electrochemical degradation of the SEI layer by becoming more porous with cracks and cavities on the electrode surface [55,56].
For the samples with the Bi2O3 layer, the Rlayer gradually increased from the 1st to the 25th cycle. This represents the gradual formation of the Bi2O3 layer, including the pre-treatment processes (stabilization of the Bi2O3 layer) till the 9th cycle (Figure 2) and possible increase of the thickness of the Bi2O3 layer between the 10th and 25th cycles. After the 25th cycle, the Rlayer of the sample with the Bi2O3 layer started to gradually decrease from 196 kΩ cm2 (25th cycle) to 39 kΩ cm2 (50th cycle), which might be related to the degradation (formation of mechanical cracks and cavities) of the Bi2O3 layer. The comparison between the SEI and the Bi2O3 layers showed that Rlayer was ~5–20 times higher for the sample with the SEI layer. This probably indicates a higher affinity of energy for an electron of the Bi2O3 layer in comparison with the SEI layer.

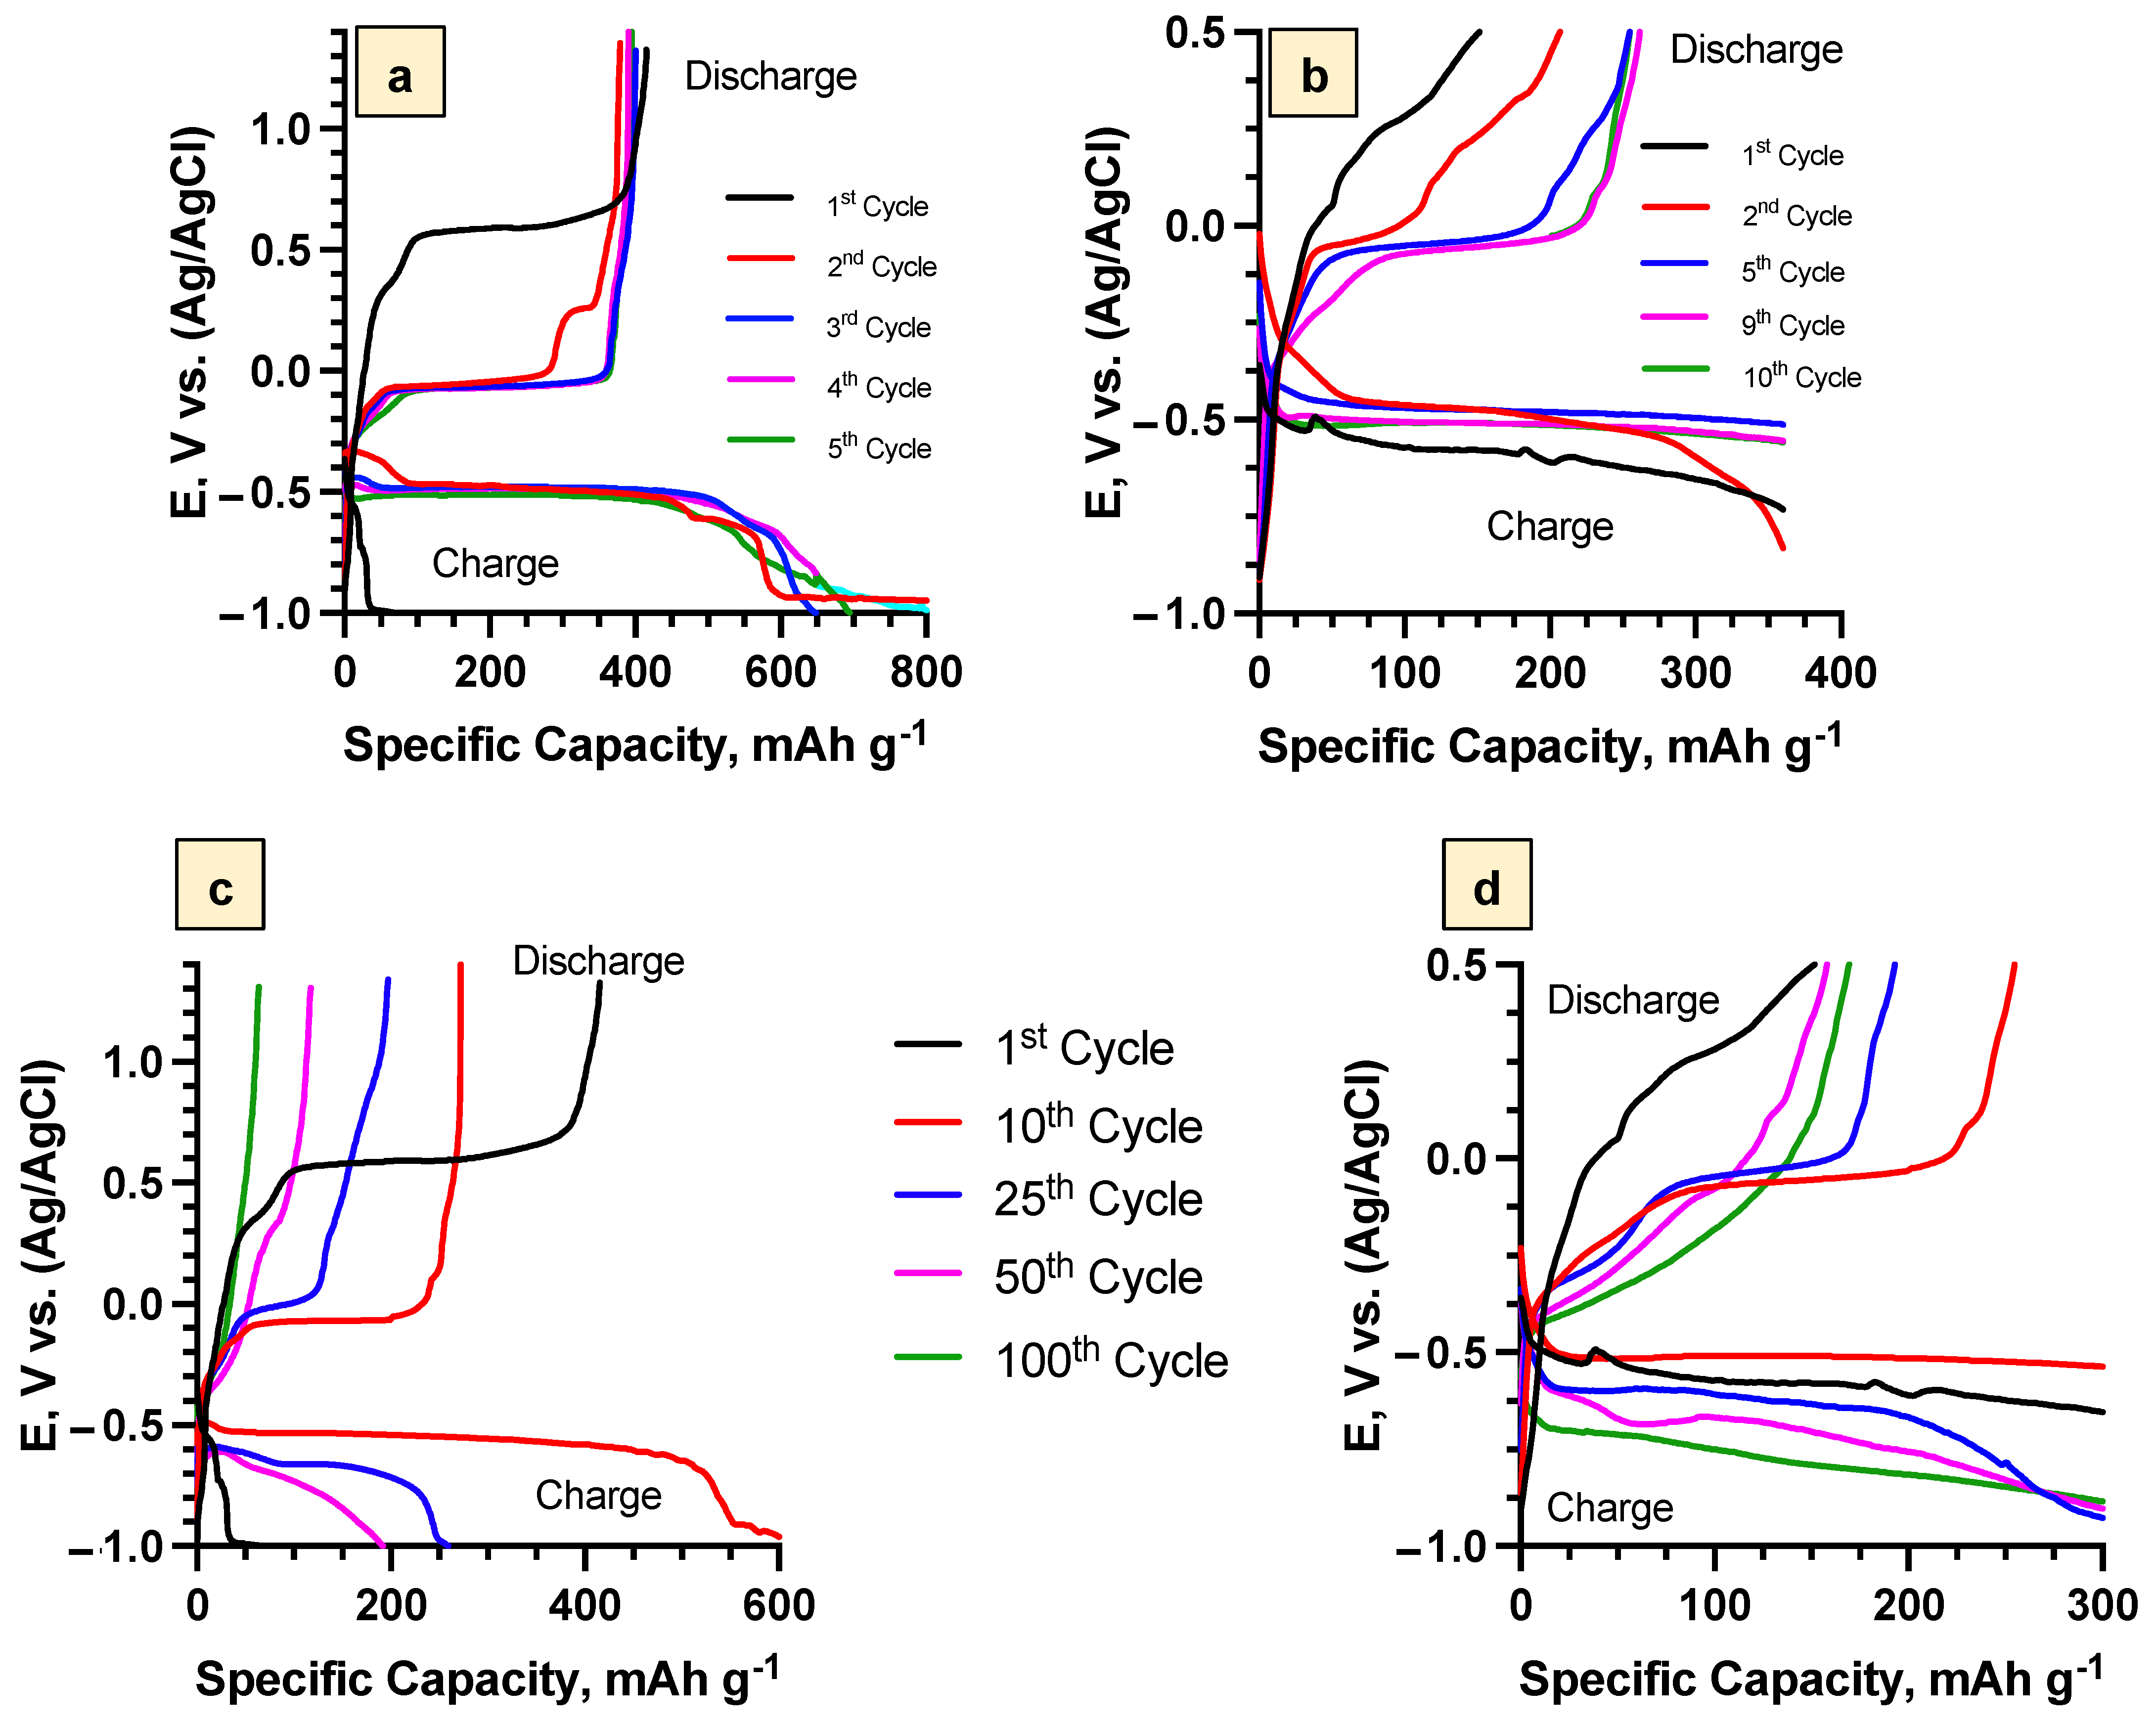
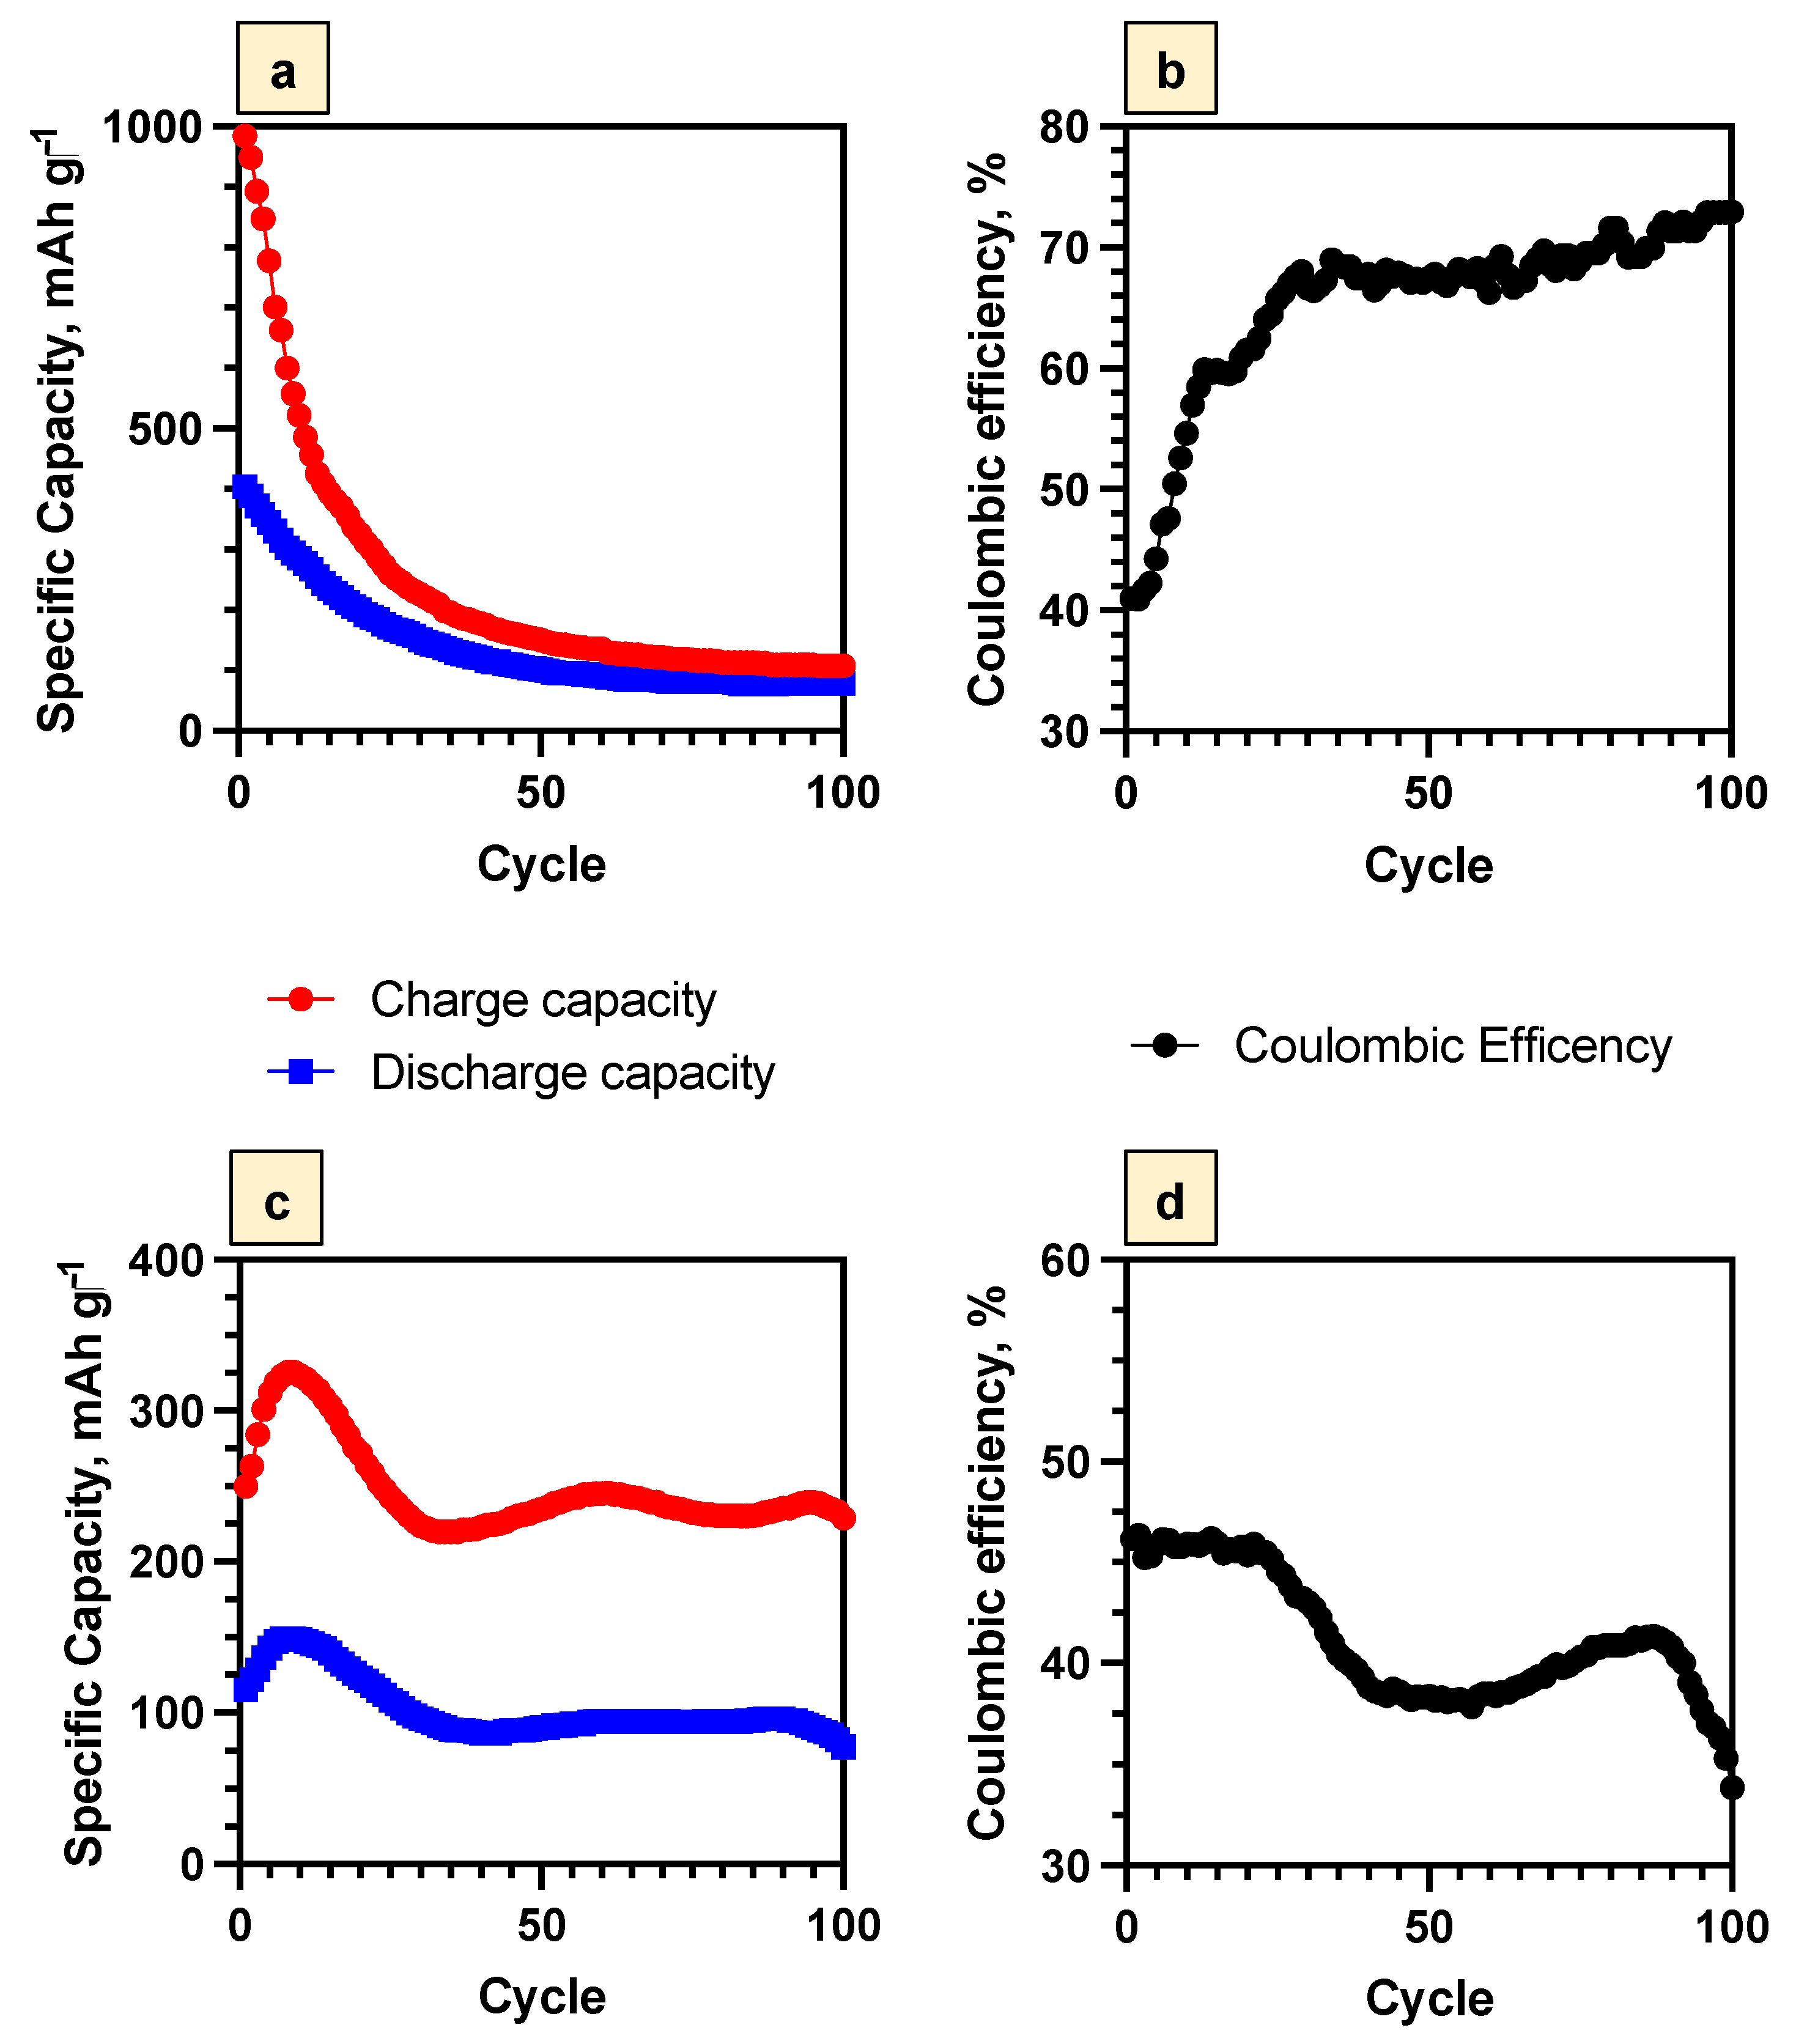
3.3. Electrochemical Performance of Bi2Se3 Thin Films

To investigate the possibility of using Bi2Se3 thin films as anodes in the ARLIBs systems, the charge/discharge capacity changes during the cycling were evaluated. After the first cycle, the initial charge and discharge capacities of the Bi2Se3 thin film in the samples with the SEI layer were 985 mAh g−1 and 404 mAh g−1 (Figure 10a). For the samples with the Bi2O3 layer, these capacities were lower at 250 mAh g−1 (charge) and 115 mAh g−1 (discharge), confirming that the formation of Bi2O3 makes the electrode less efficient in comparison with the samples covered by the SEI layer consisting of Li2O and Li2CO3 (Figure 9c). During the first 30 cycles, the charge/discharge capacities of the samples with the SEI layer decreased by ~3 times, which might be associated with the gradual degradation of the SEI layer, as Li2O and Li2CO3 are soluble in aqueous electrolyte compounds. Re-formation of the SEI layer might become more difficult due to the significant consumption of the dissolved O2 and CO2 during the first cycle of the SEI layer formation. For the sample with a Bi2O3 layer, the capacity increase (till the 10th cycle) and decrease (till the 30th cycle) were observed (Figure 10c), possibly indicating the gradual formation and degradation (the formation of mechanical cracks and cavities) of the Bi2O3 layer. Such tendencies of the re-formation of the SEI and Bi2O3 layers were also confirmed by the increment and decrement of the Rlayer values (Table 3). With the further cycling, the discharge capacities of the samples with the SEI layer also continued to decline, but not as rapidly (~2 times) as in the previous 30 cycles, from 151 mAh g−1 (30th cycle) to 79 mAh g−1 (100th cycle). For the samples with the Bi2O3 layer, the values of both charge and discharge capacities remained constant after the 30th cycle and up to the 100th cycle. The initial Coulombic efficiency for the samples with the SEI layer was 41%. However, after cycling up to the 30th cycle, it increased up to 67% and remained almost constant up to the 100th cycle (73%) (Figure 10b). For the samples with the Bi2O3 layer, the Coulombic efficiency was almost constant until the 97th cycle (~40%) and decreased down to 33% during the next three cycles (Figure 10d).
The comparison of the discharge capacities of the Bi2Se3 thin films with different previously reported anodes (TiO2, TiP2O7, L0.3V2O5, L1.2V3O8) in the lithium aqueous electrolytes studied in this work (Table 4) show that the Bi2Se3 thin films with SEI and Bi2O3 layers demonstrate the highest specific capacities at the fastest charge/discharge rate (1 C), indicating their perspective application as anode electrodes in ARLIBs.

4. Conclusions

Bi2Se3 thin films were synthesized and investigated for their application in ARLIBs in aqueous the 5 M LiNO3 electrolyte in two potential ranges which enabled two different interface layers, (−1.0 V ÷ 1.3 V—for Li2O and Li2CO3 SEI) and (−1.0 V ÷ 0.5 V—for Bi2O3). With the formed SEI layer, Bi2Se3 thin films demonstrated rapid pre-treatment (formation of stable SEI layer), high reversibility, and high transportation of Li+ during the intercalation/deintercalation processes. For both SEI and Bi2O3 layers, the capacitive process dominated (>50%) Li+ intercalation/deintercalation, which indicates the removal of limitations on charge transfer processes. In addition, the SEI layer enabled an Li+ diffusion coefficient an order of magnitude higher than the Bi2O3 layer, which was in line or higher than that reported in the literature. The EIS investigation showed relatively stable and similar electrochemical performances for both the SEI and Bi2O3 layers up to the 100th cycle for electrolyte (Rel), while charge transfer (Rct) and layer (Rlayer) resistances changed during the cycling and were significantly lower for the Bi2O3. This may be attributed to the different structures and electron affinities of the SEI and the Bi2O3 layers.
The galvanostatic charge/discharge curves obtained at an intensive rate of 1 C for 100 cycles demonstrated that the formation of the SEI layer in the first cycle plays a crucial role in the electrode stabilization, which in turn, ensures high Coulombic efficiency (73%), high charge/discharge capacity, and protection from the mechanical and electrochemical degradation up to 100 cycles. Overall, the Bi2Se3 thin films with a formed SEI layer demonstrated better electrochemical performance in comparison to the ones with a formed Bi2O3 layer. These results demonstrate that the Bi2Se3 thin films can be promising candidates for use as anode materials for ARLIBs; however, further research is needed to optimize the electrochemical properties (e.g., capacity fading) of the system.

Supplementary Materials

The following supporting information can be downloaded at: https://www.mdpi.com/article/10.3390/batteries8100144/s1, Figure S1: Laboratory-made 3-electrode electrochemical cell system; Figure S2: As-synthesized Bi2Se3 thin film on the glass substrate: a—SEM image, b—EDX spectrum.

Author Contributions

Conceptualization, V.L., Y.R. and R.M.; methodology, V.L., Y.R., R.M., J.A., V.V., A.K. and A.S.; data curation, V.L., Y.R. and R.M.; Investigation, V.L., Y.R., R.M., J.A., V.V., A.K. and A.S.; Writing – original draft, V.L., Y.R., and R.M.; Writing – review & editing, V.L., Y.R., R.M., J.A., A.S., A.V. and D.E.; Project administration, D.E.; Supervisor, A.V. and D.E. All authors have read and agreed to the published version of the manuscript.

Funding

This research was funded by the European Regional Development Fund Project (ERDF) No. 1.1.1.1/19/A/139. Y.R. acknowledges the support of post-doctoral ERDF project No. 1.1.1.2/VIAA/4/20/694. V.L. also acknowledges the support of “Strengthening of the capacity of doctoral studies at the University of Latvia within the framework of the new doctoral model”, identification No. 8.2.2.0/20/I/006. A.S. acknowledges the support from the Institute of Solid State Physics, University of Latvia, which, as the Center of Excellence, has received funding from the European Union’s Horizon 2020 Framework Programme H2020-WIDESPREAD-01-2016-2017-TeamingPhase2 under grant agreement No. 739508, project CAMART2.

Institutional Review Board Statement

Not applicable.

Informed Consent Statement

Not applicable.

Data Availability Statement

The data presented in this study are available on request from the corresponding author. The data are not publicly available as they are part of ongoing research.

Conflicts of Interest

The authors declare no conflict of interest. The funders had no role in the design of the study; in the collection, analyses, or interpretation of data; in the writing of the manuscript, or in the decision to publish the results.

References

  1. Dunn, B.; Kamath, H.; Tarascon, J.M. Electrical energy storage for the grid: A battery of choices. Science 2011, 334, 928–935. [Google Scholar] [CrossRef] [PubMed]
  2. Wang, X.; Hou, Y.; Zhu, Y.; Wu, Y.; Holze, R. An Aqueous Rechargeable Lithium Battery Using Coated Li Metal as Anode. Sci. Rep. 2013, 3, 4–8. [Google Scholar] [CrossRef]
  3. Chen, T.; Jin, Y.; Lv, H.; Yang, A.; Liu, M.; Chen, B.; Xie, Y.; Chen, Q. Applications of Lithium-Ion Batteries in Grid-Scale Energy Storage Systems. Trans. Tianjin Univ. 2020, 26, 208–217. [Google Scholar] [CrossRef]
  4. Yao, L.; Xu, S.; Tang, A.; Zhou, F.; Hou, J.; Xiao, Y.; Fu, Z. A review of lithium-ion battery state of health estimation and prediction methods. World Electr. Veh. J. 2021, 12, 113. [Google Scholar] [CrossRef]
  5. Li, W.; Dahn, J.R.; Wainwright, D.S. Rechargeable Lithium Batteries with Aqueous Electrolytes. Science 1994, 264, 1115–1118. [Google Scholar] [CrossRef]
  6. Alias, N.; Mohamad, A.A. Advances of aqueous rechargeable lithium-ion battery: A review. J. Power Sources 2015, 274, 237–251. [Google Scholar] [CrossRef]
  7. Zhang, H.; Liu, X.; Li, H.; Hasa, I.; Passerini, S. Challenges and Strategies for High-Energy Aqueous Electrolyte Rechargeable Batteries. Angew. Chem. Int. Ed. 2021, 60, 598–616. [Google Scholar] [CrossRef] [PubMed]
  8. Konarov, A.; Voronina, N.; Jo, J.H.; Bakenov, Z.; Sun, Y.K.; Myung, S.T. Present and Future Perspective on Electrode Materials for Rechargeable Zinc-Ion Batteries. ACS Energy Lett. 2018, 3, 2620–2640. [Google Scholar] [CrossRef]
  9. Cheng, C.; Li, Z.H.; Zhan, X.Y.; Xiao, Q.Z.; Lei, G.T.; Zhou, X.D. A macaroni-like Li1.2V3O8 nanomaterial with high capacity for aqueous rechargeable lithium batteries. Electrochim. Acta 2010, 55, 4627–4631. [Google Scholar] [CrossRef]
  10. Xu, T.; Zhao, M.; Duan, W.; Ding, M.; Lashari, N.u.R.; Wang, F.; Song, X. Excellent Rate Performance and Cycling Stability of TiP2O7@C/Carbon Nanotubes for the Aqueous Rechargeable Lithium-Ion Battery. Energy Technol. 2019, 7, 1900534. [Google Scholar] [CrossRef]
  11. Wang, H.; Huang, K.; Zeng, Y.; Yang, S.; Chen, L. Electrochemical properties of TiP2O7 and LiTi2(PO4)3 as anode material for lithium ion battery with aqueous solution electrolyte. Electrochim. Acta 2007, 52, 3280–3285. [Google Scholar] [CrossRef]
  12. Singh, R.; Kumari, P.; Kumar, M.; Ichikawa, T.; Jain, A. Implementation of Bismuth Chalcogenides as an Efficient Anode: A Journey from Conventional Liquid Electrolyte to an All-Solid-State Li-Ion Battery. Molecules 2020, 25, 3733. [Google Scholar] [CrossRef]
  13. Wen, Y.; Liu, Y.; Bin, D.; Wang, Z.; Wang, C.; Cao, Y.; Ai, X.; Xia, Y. High performance TiP2O7 nanoporous microsphere as anode material for aqueous lithium-ion batteries. Sci. China Chem. 2019, 62, 118–125. [Google Scholar] [CrossRef]
  14. Xie, L.; Yang, Z.; Sun, J.; Zhou, H.; Chi, X.; Chen, H.; Li, A.X.; Yao, Y.; Chen, S. Bi2Se3/C Nanocomposite as a New Sodium-Ion Battery Anode Material. Nano-Micro Lett. 2018, 10, 50. [Google Scholar] [CrossRef]
  15. Ni, J.; Bi, X.; Jiang, Y.; Li, L.; Lu, J. Bismuth chalcogenide compounds Bi2X3 (X=O, S, Se): Applications in electrochemical energy storage. Nano Energy 2017, 34, 356–366. [Google Scholar] [CrossRef]
  16. Liu, W.; Lukas, K.C.; McEnaney, K.; Lee, S.; Zhang, Q.; Opeil, C.P.; Chen, G.; Ren, Z. Studies on the Bi2Te3-Bi2Se3-Bi2S3 system for mid-temperature thermoelectric energy conversion. Energy Environ. Sci. 2013, 6, 552–560. [Google Scholar] [CrossRef]
  17. Bludská, J.; Jakubec, I.; Karamazov, S.; Horák, J.; Uher, C. Lithium ions in the van der Waals gap of Bi2Se3 single crystals. J. Solid State Chem. 2010, 183, 2813–2817. [Google Scholar] [CrossRef]
  18. Chen, X.; Tang, H.; Huang, Z.; Zhou, J.; Ren, X.; Huang, K.; Qi, X.; Zhong, J. Flexible Bismuth Selenide/Graphene composite paper for lithium-ion batteries. Ceram. Int. 2017, 43, 1437–1442. [Google Scholar] [CrossRef]
  19. Han, G.; Chen, Z.G.; Ye, D.; Yang, L.; Wang, L.; Drennan, J.; Zou, J. In-doped Bi2Se3 hierarchical nanostructures as anode materials for Li-ion batteries. J. Mater. Chem. A 2014, 2, 7109–7116. [Google Scholar] [CrossRef]
  20. Wang, G.J.; Zhang, H.P.; Fu, L.J.; Wang, B.; Wu, Y.P. Aqueous rechargeable lithium battery (ARLB) based on LiV3O8 and LiMn2O4 with good cycling performance. Electrochem. Commun. 2007, 9, 1873–1876. [Google Scholar] [CrossRef]
  21. Wen, Y.; Chen, L.; Pang, Y.; Guo, Z.; Bin, D.; Wang, Y.g.; Wang, C.; Xia, Y. TiP2O7 and Expanded Graphite Nanocomposite as Anode Material for Aqueous Lithium-Ion Batteries. ACS Appl. Mater. Interfaces 2017, 9, 8075–8082. [Google Scholar] [CrossRef]
  22. Xiong, H.; Dufek, E.J.; Gering, K.L. Batteries. Comprehensive Energy Systems. 2018, 2(5), 629–662. [Google Scholar] [CrossRef]
  23. Karkera, G.; Prakash, A.S. An Inorganic Electrolyte Li–O2 Battery with High Rate and Improved Performance. ACS Appl. Energy Mater. 2018, 1, 1381–1388. [Google Scholar] [CrossRef]
  24. Subramanya, U.; Chua, C.; He Leong, V.G.; Robinson, R.; Cruz Cabiltes, G.A.; Singh, P.; Yip, B.; Bokare, A.; Erogbogbo, F.; Oh, D. Carbon-based artificial SEI layers for aqueous lithium-ion battery anodes. RSC Adv. 2019, 10, 674–681. [Google Scholar] [CrossRef]
  25. Suo, L.; Oh, D.; Lin, Y.; Zhuo, Z.; Borodin, O.; Gao, T.; Wang, F.; Kushima, A.; Wang, Z.; Kim, H.C.; et al. How Solid-Electrolyte Interphase Forms in Aqueous Electrolytes. J. Am. Chem. Soc. 2017, 139, 18670–18680. [Google Scholar] [CrossRef]
  26. Suo, L.; Borodin, O.; Gao, T.; Olguin, M.; Ho, J.; Fan, X.; Luo, C.; Wang, C.; Xu, K. “Water-in-salt” electrolyte enables high-voltage aqueous lithium-ion chemistries. Science 2015, 350, 938–943. [Google Scholar] [CrossRef]
  27. Zhi, J.; Zehtab Yazdi, A.; Valappil, G.; Haime, J.; Chen, P. Artificial solid electrolyte interphase for aqueous lithium energy storage systems. Sci. Adv. 2017, 3, e1701010. [Google Scholar] [CrossRef]
  28. Wessells, C.; Ruff, R.; Huggins, R.A.; Cui, Y. Investigations of the electrochemical stability of aqueous electrolytes for lithium battery applications. Electrochem. Solid-State Lett. 2010, 13, 2010–2013. [Google Scholar] [CrossRef]
  29. Andzane, J.; Kunakova, G.; Charpentier, S.; Hrkac, V.; Kienle, L.; Baitimirova, M.; Bauch, T.; Lombardi, F.; Erts, D. Catalyst-free vapour–solid technique for deposition of Bi2Te3 and Bi2Se3 nanowires/nanobelts with topological insulator properties. Nanoscale 2015, 7, 15935–15944. [Google Scholar] [CrossRef]
  30. Andzane, J.; Felsharuk, A.; Sarakovskis, A.; Malinovskis, U.; Kauranens, E.; Bechelany, M.; Niherysh, K.A.; Komissarov, I.V.; Erts, D. Thickness-dependent properties of ultrathin bismuth and antimony chalcogenide films formed by physical vapor deposition and their application in thermoelectric generators. Mater. Today Energy 2021, 19, 100587. [Google Scholar] [CrossRef]
  31. Meija, R.; Lazarenko, V.; Skrastina, A.; Rublova, Y.; Andzane, J.; Voikiva, V.; Viksna, A.; Erts, D. The Electrochemical Characterization of Nanostructured Bi2Se3 Thin Films in an Aqueous Na Electrolyte. Batteries 2022, 8, 25. [Google Scholar] [CrossRef]
  32. Baitimirova, M.; Andzane, J.; Petersons, G.; Meija, R.; Poplausks, R.; Romanova, M.; Erts, D. Vapor–solid synthesis and enhanced thermoelectric properties of non-planar bismuth selenide nanoplates on graphene substrate. J. Mater. Sci. 2016, 51, 8224–8232. [Google Scholar] [CrossRef]
  33. Andzane, J.; Buks, K.; Strakova, M.N.; Zubkins, M.; Bechelany, M.; Marnauza, M.; Baitimirova, M.; Erts, D. Structure and Doping Determined Thermoelectric Properties of Bi2Se3 Thin Films Deposited by Vapour-Solid Technique. IEEE Trans. Nanotechnol. 2019, 18, 948–954. [Google Scholar] [CrossRef]
  34. Erts, D.; Katkevics, J.; Sjomkane, M.; Andzane, J.; Sarakovskis, A.; Smits, K.; Viksna, A.; Rublova, Y.; Meija, R. EIS characterization of aging and humidity-related behavior of Bi2Se3 films of different morphologies. Nano-Struct. Nano-Objects 2022, 30, 100847. [Google Scholar] [CrossRef]
  35. Kumari, P.; Singh, R.; Awasthi, K.; Ichikawa, T.; Kumar, M.; Jain, A. Highly stable nanostructured Bi2Se3 anode material for all solid-state lithium-ion batteries. J. Alloys Compd. 2020, 838, 155403. [Google Scholar] [CrossRef]
  36. Li, W.; Yao, H.; Yan, K.; Zheng, G.; Liang, Z.; Chiang, Y.M.; Cui, Y. The synergetic effect of lithium polysulfide and lithium nitrate to prevent lithium dendrite growth. Nat. Commun. 2015, 6, 7436. [Google Scholar] [CrossRef]
  37. Xin, X.; Ito, K.; Dutta, A.; Kubo, Y. Dendrite-Free Epitaxial Growth of Lithium Metal during Charging in Li–O2 Batteries. Angew. Chem. 2018, 130, 13390–13394. [Google Scholar] [CrossRef]
  38. Ahmad, Z.; Venturi, V.; Hafiz, H.; Viswanathan, V. Interfaces in Solid Electrolyte Interphase: Implications for Lithium-Ion Batteries. J. Phys. Chem. C 2021, 125, 11301–11309. [Google Scholar] [CrossRef]
  39. Kitz, P.G.; Novák, P.; Berg, E.J. Influence of Water Contamination on the SEI Formation in Li-Ion Cells: An Operando EQCM-D Study. ACS Appl. Mater. Interfaces 2020, 12, 15934–15942. [Google Scholar] [CrossRef]
  40. Chen, S.; Fang, Y.M.; Li, J.; Sun, J.J.; Chen, G.N.; Yang, H.H. Study on the electrochemical catalytic properties of the topological insulator Bi2Se3. Biosens. Bioelectron. 2013, 46, 171–174. [Google Scholar] [CrossRef]
  41. Chaolong, Y. Electrochemical Study of Bismuth Chalcogenides; H.H. Wills Physics laboratory University of Bristol: Bristol, UK, 2021. [Google Scholar]
  42. An, S.J.; Li, J.; Daniel, C.; Mohanty, D.; Nagpure, S.; Wood, D.L. The state of understanding of the lithium-ion-battery graphite solid electrolyte interphase (SEI) and its relationship to formation cycling. Carbon 2016, 105, 52–76. [Google Scholar] [CrossRef]
  43. Lv, P.; Zhao, H.; Zeng, Z.; Gao, C.; Liu, X.; Zhang, T. Self-assembled three-dimensional hierarchical NiO nano/microspheres as high-performance anode material for lithium ion batteries. Appl. Surf. Sci. 2015, 329, 301–305. [Google Scholar] [CrossRef]
  44. Meng, A.; Yuan, X.; Shen, T.; Li, Z.; Jiang, Q.; Xue, H.; Lin, Y.; Zhao, J. One-step synthesis of flower-like Bi2O3/Bi2Se3 nanoarchitectures and NiCoSe2/Ni0.85Se nanoparticles with appealing rate capability for the construction of high-energy and long-cycle-life asymmetric aqueous batteries. J. Mater. Chem. A 2019, 7, 17613–17625. [Google Scholar] [CrossRef]
  45. Chen, Z.; Liu, T.; Zhao, Z.; Zhang, Z.; Han, X.; Han, P.; Li, J.; Wang, J.; Li, J.; Huang, S.; et al. Fast anion intercalation into graphite cathode enabling high-rate rechargeable zinc batteries. J. Power Sources 2020, 457, 227994. [Google Scholar] [CrossRef]
  46. Deng, X.; Wei, Z.; Cui, C.; Liu, Q.; Wang, C.; Ma, J. Oxygen-deficient anatase TiO2@C nanospindles with pseudocapacitive contribution for enhancing lithium storage. J. Mater. Chem. A 2018, 6, 4013–4022. [Google Scholar] [CrossRef]
  47. Xiong, T.; Wang, Y.; Yin, B.; Shi, W.; Lee, W.S.V.; Xue, J. Bi2S3 for Aqueous Zn Ion Battery with Enhanced Cycle Stability. Nano-Micro Lett. 2020, 12, 8. [Google Scholar] [CrossRef]
  48. Luo, L.; Song, J.; Song, L.; Zhang, H.; Bi, Y.; Liu, L.; Yin, L.; Wang, F.; Wang, G. Flexible Conductive Anodes Based on 3D Hierarchical Sn/NS-CNFs@rGO Network for Sodium-Ion Batteries. Nano-Micro Lett. 2019, 11, 63. [Google Scholar] [CrossRef]
  49. Kim, T.; Choi, W.; Shin, H.C.; Choi, J.Y.; Kim, J.M.; Park, M.S.; Yoon, W.S. Applications of voltammetry in lithium ion battery research. J. Electrochem. Sci. Technol. 2020, 11, 14–25. [Google Scholar] [CrossRef]
  50. Bao, J.; Zhou, M.; Zeng, Y.; Bai, L.; Zhang, X.; Xu, K.; Xie, Y. Li0.3V2O5 with high lithium diffusion rate: A promising anode material for aqueous lithium-ion batteries with superior rate performance. J. Mater. Chem. A 2013, 1, 5423–5429. [Google Scholar] [CrossRef]
  51. Wu, W.; Shanbhag, S.; Wise, A.; Chang, J.; Rutt, A.; Whitacre, J.F. High Performance TiP2O7 Based Intercalation Negative lectrode for Aqueous Lithium-Ion Batteries via a Facile Synthetic Route. J. Electrochem. Soc. 2015, 162, A1921–A1926. [Google Scholar] [CrossRef]
  52. Lee, Y.S.; Ryu, K.S. Study of the lithium diffusion properties and high rate performance of TiNb6O17 as an anode in lithium secondary battery. Sci. Rep. 2017, 7, 16617. [Google Scholar] [CrossRef]
  53. Abe, Y.; Hori, N.; Kumagai, S. Electrochemical impedance spectroscopy on the performance degradation of LiFePO4/graphite lithium-ion battery due to charge-discharge cycling under different c-rates. Energies 2019, 12, 4507. [Google Scholar] [CrossRef]
  54. Moré, J.J. The Levenberg-Marquardt Algorithm: Implementation and Theory; Springer: Berlin/Heidelberg, Germany, 1978; pp. 105–116. [Google Scholar] [CrossRef]
  55. Deshpande, R.D.; Bernardi, D.M. Modeling Solid-Electrolyte Interphase (SEI) Fracture: Coupled Mechanical/Chemical Degradation of the Lithium Ion Battery. J. Electrochem. Soc. 2017, 164, A461–A474. [Google Scholar] [CrossRef]
  56. Bhattacharya, S.; Riahi, A.R.; Alpas, A.T. Electrochemical cycling behaviour of lithium carbonate (Li2CO3) pre-treated graphite anodes—SEI formation and graphite damage mechanisms. Carbon 2014, 77, 99–112. [Google Scholar] [CrossRef]
Figure 1. (a)—SEM image of Bi2Se3 thin films on the glass substrate, (b)—XRD pattern of Bi2Se3 powder obtained by scratching the as-grown thin film off the substrate.
Batteries 08 00144 g001
Figure 2. Cyclic voltammograms of Bi2Se3 thin films in 5 M LiNO3 at the scan rates 0.25 mV s−1: (a)—samples with SEI layer (−1.0 V ÷ 1.3 V vs. Ag/AgCl), (b)—samples with Bi2O3 layer (−1.0 V ÷ 0.5 V vs. Ag/AgCl).
Batteries 08 00144 g002
Figure 3. Charge/Discharge profiles of Bi2Se3 thin films in 5 M LiNO3 at 1 C: (a)—first 5 cycles for the SEI layer (−1.0 V ÷ 1.3 V), (b)—first 10 cycles for the Bi2O3 layer (−1.0 V ÷ 0.5 V), (c)—profiles up to the 100th cycle for the SEI layer (−1.0 V ÷ 1.3 V), (d)—profiles up to the 100th cycle for the Bi2O3 layer (−1.0 V ÷ 0.5 V).
Batteries 08 00144 g003
Figure 4. Scanning electron microscope images of Bi2Se3 thin films in 5 M LiNO3 before and after cyclic voltammetry measurements for: (a)—SEI layer after 5 cycles (−1.0 V ÷ 1.3 V), (b)—Bi2O3 layer after 10 cycles (−1.0 V ÷ 0.5 V), (c)—XRD pattern of samples with SEI layer after 5 cycles (−1.0 V ÷ 1.3 V) and Bi2O3 layer after 10 cycles (−1.0 V ÷ 0.5 V).
Batteries 08 00144 g004
Figure 5. XPS spectra of Bi2Se3 thin films in 5 M LiNO3 after cyclic voltammetry measurements for: (a)—SEI layer Se 3d and Li 1s data after 5 cycles (−1.0 V ÷ 1.3 V), (b)—SEI layer Bi 4f data after 5 cycles (−1.0 V ÷ 1.3 V), (c)—Bi2O3 layer Se 3f and Li 1s data after 10 cycles (−1.0 V ÷ 0.5 V), (d)—Bi2O3 layer Bi 4f data after 10 cycles (−1.0 V ÷ 0.5 V).
Batteries 08 00144 g005
Figure 6. Cyclic voltammetry curves of Bi2Se3 thin films in 5 M LiNO3 in the scan rate range from 0.1 to 1.0 mV s−1 after surface pre-treatment for: (a)—SEI layer after third cycle (−1.0 V ÷ 1.3 V vs. Ag/AgCl), (b)—Bi2O3 layer after ninth cycle (−1.0 V ÷ 0.5 V vs. Ag/AgCl).
Batteries 08 00144 g006
Figure 7. Investigation of the dominant stage and contribution of capacitive and diffusion-based processes for Li+ intercalation/deintercalation in Bi2Se3 thin films in 5 M LiNO3: (a)—log-scale plots for the SEI layer (−1.0 V ÷ 1.3 V vs. Ag/AgCl), (b)—log-scale plots for the Bi2O3 layer (−1.0 V ÷ 0.5 V vs. Ag/AgCl), (c)—the contribution of capacitive and diffusion-controlled processes for the SEI layer (−1.0 V ÷ 1.3 V vs. Ag/AgCl), (d)—the contribution of capacitive and diffusion-controlled processes for the Bi2O3 layer (−1.0 V ÷ 0.5 V vs. Ag/AgCl).
Batteries 08 00144 g007
Figure 8. Dependence of v1/2 vs. I for Bi2Se3 thin films in 5 M LiNO3 for Li+ intercalation/deintercalation with fitted slope values for: (a)—SEI layer (−1.0 V ÷ 1.3 V vs. Ag/AgCl), (b)—Bi2O3 layer ( −1.0 V ÷ 0.5 V vs. Ag/AgCl).
Batteries 08 00144 g008
Figure 9. Electrochemical impedance spectroscopy of Bi2Se3 thin films in 5 M LiNO3: (a)—Nyquist plot for the SEI layer (−1.0 V ÷ 1.3 V vs. Ag/AgCl), (b)—Nyquist plot for the Bi2O3 layer (−1.0 V ÷ 0.5 V vs. Ag/AgCl), (c)—equivalent circuit scheme before cycling, (d)—equivalent circuit scheme during the cycling.
Batteries 08 00144 g009
Figure 10. Galvanostatic charge/discharge cycling performances of Bi2Se3 thin films in 5M LiNO3 at 1 C: (a)—cycling performance for the SEI layer (−1.0 V ÷ 1.3 V), (b)—Coulombic efficiency for the SEI layer (−1.0 V ÷ 1.3 V), (c)—cycling performance for the Bi2O3 layer (−1.0 V ÷ 0.5 V), (d)—Coulombic efficiency for the Bi2O3 layer (−1.0 V ÷ 0.5 V).
Batteries 08 00144 g010
Table 1. The atomic composition of Bi2Se3 thin films in 5 M LiNO3 before and after CV measurements.
ElementBeforeAfter 5 Cycles
(SEI Layer)
After 10 Cycles
(Bi2O3 Layer)
Bi41 ± 146 ± 341 ± 1
Se59 ± 154 ± 359 ± 1
Table 2. Comparison of Li+ intercalation and deintercalation diffusion coefficients (cm2 s−1) for different anodes and electrolytes.
ElectrodeElectrolyteIntercalationDeintercalationReference
Bi2Se3 thin film
(SEI layer)
5 M LiNO33.3 × 10−122.2 × 10⁻¹²This study
Bi2Se3 thin film
(Bi2O3 layer)
5 M LiNO34.3 × 10−134.5 × 10⁻¹³This study
Li0.3V2O55 M LiNO310−11–10−12[50]
TiP2O71 M Li2SO43.80 × 10−151.77 × 10⁻¹⁵[51]
TiNb6O171 M LiPF6 EC/DMC b (1:2)3.43 × 10−133.72 × 10⁻¹³[52]
TiNb2O71 M LiPF6 EC/DMC b (1:2)1.08 × 10−143.01 × 10⁻¹⁴
a ethylene carbonate/diethyl carbonate. b ethylene carbonate/dimethyl carbonate.
Table 3. Cycle-dependent fitted resistance values of Bi2Se3 thin films with SEI and with the Bi2O3 layer.
LayerResistanceBefore Cycling1st5th10th25th50th100th
SEIRel,
kΩ cm2
0.50.92.32.82.93.03.1
Rlayer,
kΩ cm2
-21621515772252208225
Rct,
kΩ cm2
58415437927512461965490
Bi2O3Rel,
kΩ cm2
0.10.40.81.31.41.72.0
Rlayer,
kΩ cm2
-1121301701963926
Rct,
kΩ cm2
111131017251720
Table 4. Comparison of galvanostatic discharge cycling performances of different anodes in lithium aqueous electrolyte.
ElectrodeElectrolyteC-rateInitial Specific CapacityCyclesSpecific Capacity Capacity RetentionCoulombic EfficiencyReference
Bi2Se3 thin film
(SEI layer)
5 M
LiNO3
1 C404
mAh g−1
30151
mAh g−1
40%70%This
study
Bi2Se3 thin film
(Bi2O3 layer)
5 M
LiNO3
1 C115
mAh g−1
3096
mAh g−1
83%43%This
study
TiO221 M LiTFSI0.2 C115
mAh g−1
408
mAh g−1
7%70%[24]
TiP2O75 M
LiNO3
0.1 C42
mAh g−1
2515
mAh g−1
35%-[11]
Li0.3V2O55 M
LiNO3
1 C75
mAh g−1
5038
mAh g−1
51%99%[50]
Li1.2V3O81 M
Li2SO4
1 C101
mAh g−1
3070
mAh g−1
70%-[9]
Publisher’s Note: MDPI stays neutral with regard to jurisdictional claims in published maps and institutional affiliations.

