Article

Comparative Study of Kilowatt-Scale Vanadium Redox Flow Battery Stacks Designed with Serpentine Flow Fields and Split Manifolds

by
Ravendra Gundlapalli
and
Sreenivas Jayanti
*
Department of Chemical Engineering and DST-Solar Energy Harnessing Center, IIT Madras, Chennai 60036, India
*
Author to whom correspondence should be addressed.
Batteries 2021, 7(2), 30; https://doi.org/10.3390/batteries7020030
Submission received: 1 March 2021 / Revised: 21 March 2021 / Accepted: 8 April 2021 / Published: 6 May 2021
(This article belongs to the Special Issue Redox Flow Batteries for Large-Scale Energy Storage)

Abstract

:
A low-pressure drop stack design with minimal shunt losses was explored for vanadium redox flow batteries, which, due to their low energy density, are used invariably in stationary applications. Three kilowatt-scale stacks, having cell sizes in the range of 400 to 1500 cm2, were built with thick graphite plates grooved with serpentine flow fields and external split manifolds for electrolyte circulation, and they were tested over a range of current densities and flow rates. The results show that stacks of different cell sizes have different optimal flow rate conditions, but under their individual optimal flow conditions, all three cell sizes exhibit similar electrochemical performance including stack resistivity. Stacks having larger cell sizes can be operated at lower stoichiometric factors, resulting in lower parasitic pumping losses. Further, these can be operated at a fixed flow rate for power variations of ±25% without any significant changes in discharge capacity and efficiency; this is attributed to the use of serpentine flow fields, which ensure uniform distribution of the electrolyte over a range of flow rates and cell sizes.

1. Introduction

Precise compensation of balance between the electricity generation and consumption requires effective energy storage system. Several key parameters like response time, capacity, energy and power ratings, cycle life, efficiency and cost should be considered in selecting a suitable energy storage system [1]. Redox flow batteries (RFB) with their distinct features such as independent rating of power and energy, long cycling life, low levelized cost of energy and millisecond response time show great scope in accommodating intermittency in renewable energy sources and load demand. Among several RFBs, the Vanadium redox flow battery (VRFB) has seen enormous growth owing to its absence in cross-contamination of different ionic species and recyclability of the valuable vanadium content at the end of life cycles [2,3,4,5,6].
In a flow battery, the reversible cell potential is limited by activation and ohmic over-potential losses. In addition to these losses—which depend primarily on the material properties—mass transfer or concentration over-potential will become significant at low state of charge (SoC) in discharge and high SoC during charging, especially in large cells. Operation of the cell at high current densities will be severely limited under these conditions. Increase in flow rate may help in reducing the concentration over-potential, but this will also increase parasitic energy losses leading to a reduction in the overall system level efficiency. For a given flow battery cell in operation, an optimal flow rate should be identified to meet the power requirements so as to obtain good overall system efficiency with high capacity [7,8,9,10,11]. For a flow battery stack, additional considerations arise; these include uniformity of electrolyte distribution among cells, cell voltage variation, shunt current losses, manifolds, leakage and sealing. A number of studies have been reported on the performance of kilowatt (kW) scale VRFB stacks in the literature. Extensive focus has been given to the electrolyte flow rate strategies and range [9,10,11,12,13,14,15,16,17], shunt current losses [17,18,19,20,21,22] and engineering aspects of flow battery stacks [23,24,25,26].
Ma et al. [9] reported effect of electrolyte flow rate on the performance of a kW-class VRFB stack made of 15 cells of active area of 875 cm2 without having any flow channels on the active area. Constant flow rate experiments at 75 mA.cm−2 showed that the discharge capacity increased (from 10.9 to 18.4 Ah/L) with flow rate (0.25 to 0.9 mL.min−1.cm−2) with attendant decrease in system efficiency (69.3 to 58.5%). In order to maintain both the system efficiency and capacity at high level, an optimal strategy of electrolyte flow rate was proposed with step-up in flow rate. With this strategy, the study reported improved system efficiency of 66.5% at the current density of 75 mA.cm−2 while keeping the maximum obtained capacity of 18.4 Ah.L−1. Tang et al. [10], through their simulation studies for trade-off between electrolyte flow rate and system efficiency on a 5 kW/15 kWh VRFB system having 40 cells of 1500 cm2 active area (without any flow channel grooves) operating over the pre-set voltage range of 72 to 36 V (1.8 to 0.9 V at cell level), recommended that the system should operate at constant flow factor of 2 or variable (with SoC of electrolyte) flow factor of 7 in order to avail good system efficiency. For an operating current density of 40 mA.cm−2 under charging and 53 mA.cm−2 under discharging conditions, both constant flow factor and variable flow factor operations have given energy efficiency close to 76% while the system efficiency was 69% and 73% for the constant and variable flow factor operations, respectively.
An experimental demonstration of 10 kW VRFB stack by Park et al. [11], using 31 cells of 2714 cm2 active area (without any flow channel grooves) operating in the voltage range of 49.6 to 31 V (1.6 to 1.0 V at cell level), reported energy efficiencies of 76 and 70% for current densities of 60 and 90 mA.cm−2, respectively, at a constant flow rate of 1 mL.min−1.cm−2. Wu et al. [12] demonstrated a 5 kW VRFB stack with 40 cells of 1800 cm2 active area by using internal flow-frame over the electrode as manifold. At an input flow rate of 0.7 mL.min−1.cm−2 with estimated cell level pressure drop of about 154 kPa, for operating voltage range of 64 to 32V (1.6 to 0.8 V at cell level), energy efficiency of the stack was 82.8%, discharge capacity 29.6 Ah.L−1 when operated at 50 mA.cm−2 while they were reduced to 78.4% and 26 Ah.L−1, respectively, for current density of 80 mA.cm−2. Corresponding system efficiencies were not reported, but one can anticipate a reduction of about 5 to 7% based on the cell level pressure drop alone. A similar stack has been demonstrated by Enrique et al. [13] over the current densities 25 to 112 mA.cm−2 with constant and variable flow rates. A constant flow rate of 0.21 mL.min−1.cm−2 was compared with the variable flow rate (0.1 to 0.46 mL.min−1.cm−2) over these current densities and it was found that the variable operating flow rate option gave a gain of 2% in system efficiency. The reported energy density was rather low and was in the range 14 to 18 Wh.L−1 with loss of 7 to 10% energy towards pumping duty.
Li et al. [14], with their model based non-linear optimization, proposed electrolyte flow rate trajectories to obtain optimal charging current, using a 5 kW/15 kWh VRFB system made of 40 cells of 1500 cm2 active area. Ohmic over-potential losses were dominant with fast charging, while crossover of vanadium ions was dominant during slow charging. As the required flow rate and operating current are functions of SoC of electrolyte, available time and required power, it was proposed to have a combination of slow and fast charging operation. Current density of 20 to 35 mA.cm−2 with flow rate range of 0.2 to 0.5 mL.min−1.cm−2 was proposed for slow charging and 100 to 150 mA.cm−2 with flow rate in the range of 0.7 to 1.2 mL.min−1.cm−2 for fast charging. Wang et al. [15], with a transient model, reported on a dynamic control strategy for the electrolyte flow rate, using 5 kW/30 kWh VRFB stack made of 25 cells of 1800 cm2 active area. It was recommended that the flow rate optimization should consider the SoC of the electrolyte and that the system should be operated at as low flow rate as possible in order to maintain good system level efficiency.
Recently, based on experimental studies using a 9 kW/27 kWh VRFB system made of 40 cells of 600 cm2 active area having internal flow-frame over the electrode as manifold, Gaurnieri et al. [16,17,18] recommended to operate the system at variable flow rate as a function of SoC of the electrolyte. For an operating current density of 50 mA.cm−2, energy efficiency of 75.85%, energy density of 24.5 Wh.L−1 and system efficiency of 70.35% were reported for a fixed flow factor of 8 (0.63 mL.min−1.cm−2). An increase of 2% in system efficiency was obtained when operated at modulated stoichiometric flow factor compared to the constant flow factor case.
As stated earlier, shunt losses are also substantial in determining the system efficiency. Several investigations have been reported on the shunt losses in flow battery stacks with guidelines to reduce them. Shunt current losses in VRFB stack depend on the variation in voltage across the cells, number of cells and the ionic resistance of the manifold. Increase of resistance for electrolyte in the manifold, reduction in number of cells in series, increase in power of each cell and dividing large stacks into sub-stacks are the given guidelines to reduce the shunt losses [18,19,20,21,22,23]. Other engineering factors that need to be considered for commercialization of flow batteries for grid-level applications include stack designs with flow channels on active area [24], computational techniques for prediction of electrolyte distribution and pressure drop in large area cells [25], operating flow rate and current density [26], effective scale-up in cell size [27], stack layout [28,29], safety features, diagnosis and remedial actions [30,31], low cost components, simple fabrication procedures and other techno-economic assessments [32,33,34].
It can be seen that several stack studies have been reported with cell areas in the range 600 to 1800 cm2. Average current density of operation used in these stack studies is about 75 to 90 mA.cm−2 with flow rate of about 0.7 mL.min−1.cm−2 [9,10,11,12,13,14,15,16,17,18]. Single-cell operation at much higher current densities (in the range of 40 to 400 mA.cm−2) has been reported in the literature; however, these studies have been conducted on small cells (typical active area in the range 4 to 25 cm2), at high flow rates (of about 1 to 12 mL.min−1.cm−2) and using sophisticated chemical/thermal/physical treatments to the electrode and/or the membrane [35,36,37,38,39,40,41,42]. For example, Pezeshki et al. [35] reported a gain of 13% in energy efficiency and two-fold increment in usable capacity with heated electrodes in an oxygen environment compared to untreated felt for an operating current density of 200 mA.cm−2 on a single cell of active area of 5 cm2. Similarly, Monteiro et al. [36] reported a three-fold increase in discharge capacity and 30% increases in energy efficiency using thermally activated carbon felt compared to untreated carbon felt for an operating current density of 40 mA.cm−2 on a single cell of active area of 25 cm2. Zhou et al. [39] reported on comparative cell performance with treated and raw carbon felts. For an operating current density of 320 mA.cm−2 at electrolyte circulation rate of 7 mL.min−1.cm−2, the cell with treated felt gave energy efficiency of 85% whereas it was only 63% with raw felt. In addition to the loss in efficiency, the raw felt gave discharge capacity of only 25% of the cell with treated felt due to its much lower window of operating voltage. This was attributed to the decreased overall cell resistance with the treated felt. Such high operating flow rates cannot be sustained in large cells because of the high pressure drop. The cost of activation of electrode and membrane, the possible degradation of active elements in long service also need to be studied for implementation in grid-scale storage applications.
None of the stacks mentioned above [9,10,11,12,13,14,15,16,17,18] have flow channels on bipolar plate for electrolyte distribution; the bipolar plate in these cases is a thin sheet and the flow of electrolyte in the electrode is in the conventional flow-through mode. There is abundant recent literature on the beneficial effect of flow channels on the performance of single cells, although many of them are in cell areas less than 100 cm2 and a few on cell size of 900 cm2 and above [43,44,45,46,47,48,49,50,51,52,53,54,55,56,57,58]. Very few studies have been reported on stacks with flow channels [59,60,61]. Reed et al. [59,60], through their experimental investigation of kW-scale VRFB stacks made of 3 and 20 cells of active area 780 cm2, using thermally treated felts and mixed acid electrolytes, reported an increase in energy efficiency of 4% with interdigitated flow patterns on porous electrode and 9% with interdigitated flow-frame fastened on thin bipolar plate compared to flow-through design. Bhattarai et al. [61] demonstrated performance of 1 kW VRFB stack built with 20 cells of area 625 cm2, using interdigitated flow slots on the thermally treated porous electrode. An energy efficiency (without pump losses) of 80%, discharge capacity of 29 Ah.L−1, energy density of 37 Wh.L−1 at an operating current density of 80 mA.cm−2 were reported for the flow rate of 0.64 mL.min−1.cm−2 with charge–discharge operation over cell voltage range of 1.65 to 1.1 V. A cell level pressure drop of about 47 kPa was reported at this flow rate.
As the major portion of weight of the VRFB system comes from external electrolyte reservoirs in large-scale stationary storage applications, dimensions and weight of the stack are not a big concern. Fabrication of thick graphite plates with flow channels and feeding arrangement is very simple and it allows more control over the electrolyte distribution over the cell. Serpentine flow fields have been demonstrated to have superiority over interdigitated flow fields when compared in cells in the size range of 900 to 1500 cm2 [57]. The principal focus of the present study is on the performance characteristics of the kW-scale VRFB stacks equipped with serpentine flow fields and cell sizing for application in large-scale energy storage. To this end, three stacks made of 410, 918 and 1500 cm2 cell nominal active areas have been studied to obtain data of electrochemical parameters including cell/stack resistivity and pressure drop while operating at current densities from 45 to 120 mA.cm−2 and over a range of electrolyte flow rates. Results show that these stacks have the advantage of low pressure drop and negligible shunt losses compared to the flow frame design. Details of the design, materials, methods, characterization and results are discussed below.

2. Details of Materials and Methods

The method of construction and characterization of the stacks is illustrated in Figure 1. A redox flow battery requires the circulation of negative and positive electrolytes through respective electrodes which are separated by an ion-exchange membrane. Uniform circulation of electrolyte species across the active area of electrode can be achieved by using serpentine flow channels in large area cells [56], which can be engraved on graphite bipolar plates. Graphite plates (SGL Carbon of grade R7510) of dimensions 30 cm × 30 cm × 1.5 cm, 40 cm × 40 cm × 1.5 cm and 40 cm × 60 cm × 1.5 cm (width × length × thickness) were engraved with serpentine flow field of geometry (5 mm × 2 mm × 3 mm) (channel width × rib width × channel depth) [54] over the active areas of 20.5 cm × 20 cm, 30.6 cm × 30 cm and 30 cm × 50 cm, respectively, leaving approximately 5 cm runoff width on each side as shown in Figure 1C to overlay a silicone gasket (Figure 1F) to prevent leakage and mixing of the electrolytes. The serpentine area over which the electrolyte flows through was overlaid with graphitized felt (GFA 6EA from SGL Carbon), and this constitutes the nominal active area of the cell (Figure 1G). The same felt was used as cathode and anode electrode material without any further activation treatment. Based on previous studies [55], the electrode was compressed by 35% after assembly of the stack. Nafion 117 is used as ion-exchange membrane as well as physical separator for cathode and anode. The membrane was hydrated in de-ionized water for about 24 h and the stack was assembled with these wet membranes. As shown in Figure 1C, each graphite plate was fabricated with inlet/outlet tubes across thickness of the plate from which the electrolyte enters/leaves the reaction zone (porous electrode) via the serpentine flow path (Figure 1D) without requiring further manifold arrangement over the electrode. These feed tubes (Viton rubber) were fitted to the graphite plates by drilling at the mid-section of plate thickness (Figure 1E) and fastened with adhesive Loctite-418 glue for leak proof joint. The end graphite plates are in direct contact with current carrying copper plates and have the flow channels engraved only on one side whereas the middle plates act as bipolar plates with flow channels engraved on both sides. An assembled single cell is shown in Figure 1J. The cell was made leak proof by tightening the battery materials between two metallic (aluminum) end-plates, using bolts. The bolts were used to connect only the end-plates, which were insulated from the battery materials, using Silicone/Viton gaskets. This process is expanded to the assembly of stack by piling single cells in series and a photograph of an assembled 8-cell stack is shown in Figure 1K. A separate manifold is required to distribute the electrolyte from reservoir to each cell equally. This was done by using a T-split manifold of the type shown in Figure 1B. Equal average velocity along the length of manifold branch can be maintained to minimize pressure losses by having the diameters of feeding tube and those of the branching T’s in the ratio of √2:1 [27]. The actual values of the diameters used are based on available stock of Teflon and Polyethylene fittings and the ones chosen are listed in Table 1. Electrolyte inlet/outlet tubes of the graphite plates are connected to the T-split manifold as shown in Figure 1K.

2.1. Stacks Fabricated

Two small stacks with 4 cells in series were initially fabricated, each with cells of size 410 and 918 cm2. Corresponding T-split manifold was fabricated and tested for feeding of electrolyte. Mechanical arrangements, leak testing and preliminary electrochemical tests were performed to verify implementation in bigger stacks. The instantaneous cell voltage across the cells of stack was measured and was found to give equal voltage up to second decimal which can be attributed to equal split of electrolyte across the cells. Bigger stacks of kW power rating were then fabricated by using 16, 8 and 8 cells of electrode sizes of 410, 918 and 1500 cm2, respectively, with nominal power rating of about one kW, one kW and two kW, respectively. Cell voltage variation in these stacks also was found to be uniform over a range of testing conditions. Details of materials are summarized in Table 1.
A recent study by the present authors [56] on the effect of electrolyte velocity on electrochemical performance shows that a sufficiently high circulation rate is required for optimal performance, and this was obtained at different stoichiometric flow factors (defined based on stoichiometric flow rate at a nominal current density of 60 mA.cm−2) for different cell areas (due to varying fractional split to the porous zone). The optimal flow rate was found to be in the range of stoichiometric flow (SF) 7 to 9, SF 5 to 7 and SF 3 to 5 for the cell sizes of 410, 918 and 1500 cm2, respectively. In view of this, electrochemical measurements of the present stack level studies were conducted for area-specific flow rates between 0.24 and 0.81 mL.min−1.cm−2 for the small cell (SF 4 to 9), between 0.24 and 0.50 mL.min−1.cm−2 (SF 4 to 7) for the medium size cell, and in the narrower range between 0.12 and 0.36 mL.min−1.cm−2 (SF 2 to 5) for the large cell. The results at these flow rates on the stacks are presented and discussed in Section 3.

2.2. Electrochemical Studies

Electrolyte of concentration 1.61 M of vanadyl sulfate in 5 M of sulfates was prepared by dissolving VOSO4·xH2O (99.5% wt. purity, x = 2~2.3, Noah Technologies) in H2SO4. The anolyte (V2+/V3+) and catholyte (VO2+/VO2+) redox couples were then prepared by the two-step charging method [31]. In view of equal voltage across the cells of stack, pre-set voltage cutoff was maintained at 1.75 and 0.9 V per cell (stack voltage limits are proportional to number of cells) for charging and discharging, respectively. Configurations of the stacks and the electrolyte volume on each side of reservoir for different stacks are reported in Table 2. The anolyte solution was maintained in inert atmosphere by purging nitrogen gas through it and the electrolyte temperature was maintained constant at 26 ± 2 °C. All the electrochemical data were measured by using a Bitrode battery tester with voltage and current limits of 72 V and 200 A, respectively. Life-cycle tests were conducted at fixed current densities of 60, 75 and 90 mA.cm−2, at different flow rates and at a fixed flow rate, with current density varying in steps from 45 to 120 mA.cm−2. At each operating condition defined by current density and electrolyte flow rate which were held constant during that test, three charge–discharge cycles were conducted and the average of the three is reported here.

2.3. Pressure Drop Studies

Pressure drop was measured separately in the single cells and stacks for the circulation of electrolyte (in VO2+ form) at various flow rates, using inverted U-tube manometer. A simple schematic of pressure drop measurement in a stack is shown in Figure 1B. The pressure drop between points A and B comprises the losses for the flow in the inlet and the outlet manifold and the cell itself for one side of the stack. The measured stack pressure drop between A and B was subtracted from the pressure drop obtained in single-cell measurements to get the pressures losses attributable to flow in the manifolds. Since identical flow rates and flow arrangements are made on the anode and the cathode sides, the total pumping losses are taken to be twice those measured as per the above scheme.

3. Results and Discussions

This section presents the choice of flow rates used to investigate the performance of configured stacks and corresponding results with discussions.

3.1. Operating Flow Rate

Our previous studies with serpentine flow fields on cells of 400 and 900 cm2 area [54,55,56] reported standard electrochemical performance for flow rate in the range 0.18 to 0.80 mL.min−1.cm−2 for current densities up to 120 mA.cm−2. The serpentine flow field, when attached to a porous substrate, exhibits certain desirable flow features that are beneficial for an electrochemical reaction occurring in the porous substrate [44,54]. The electrolyte, when introduced into the serpentine flow field, will split into two streams: one passing through the flow channels and the other passing through the porous substrate. Detailed computational fluid dynamics (CFD) simulations show that this split happens right at the inlet channel itself and the part going through the substrate will flow towards the outlet channel with partial mixing with the electrolyte flowing in the channels. The fractional flow split between the two parallel pathways depends on the flow resistances in each path and may vary in the range of 25 to 75% [45,51,54,56]. A predictive lumped parameter model was proposed based on CFD simulations and validated by using the experimentally measured pressure drop in single-cell studies of the similar sizes [54,56]. The velocity of the electrolyte in the electrode predicted by using this lumped parameter model [54] is shown in Figure 2 for the three cell areas as a function of area-specific flow rate, i.e., flow rate per unit active area of the cell. It may be noted that for the same area-specific flow rate, a large cell requires higher volumetric flow rate compared to a small cell. For example, for an area-specific flow rate of 0.3 mL.min−1.cm−2, cells of size 410, 918 and 1500 cm2 require electrolyte circulation rates of 123, 275 and 450 mL.min−1, respectively. Since the channel dimensions are the same for all three cell sizes, the pressure difference between adjacent channels will be higher and as a result higher amount of flow will go through the porous substrate for higher cell sizes at the same area-specific flow rate or for the same cell as the flow rate increases. Thus, we see from Figure 2 that electrode electrolyte velocity of about 0.2 cm.s−1 would be obtained at 0.66, 0.42 and 0.30 mL.min−1.cm−2 for the small, medium and large size cells, respectively.

3.2. Performance of 4-Cell Stacks

Preliminary stacks with 4 cells in series were developed with cell sizes 410 cm2 and 918 cm2 of power rating 0.25 and 0.5 kW, respectively. Typical charge–discharge curves obtained for a current density of 75 mA.cm−2 and electrolyte circulation rate of 0.37 mL.min−1.cm−2 in the two stacks are compared in Figure 3. When the SoC of electrolyte is high, the ohmic over-potentials of the two stacks are nearly the same showing that scaling-up the cell area by a factor 2.25 does not change the local performance. The charge–discharge behavior of the two stacks is however different towards the end of the charging and discharging sections. One can see that the smaller cell stack having cell active area of 410 cm2 has earlier onset of mass transfer polarization leading to a discharge capacity of only 23 Ah.L−1 compared to about 26.5 Ah.L−1 for the larger cell stack having cell active area of 918 cm2. This is attributed to the fractional split of electrolyte between the porous path and serpentine path. Although the serpentine flow field has proved to be providing uniform circulation over the electrode cross-section for large cell sizes [56], the flow rate of electrolyte through the porous zone is lower for a smaller cell for the same area specific flow rate. For good electrochemical performance sufficient local convective velocity in the electrode is essential, and to obtain this, smaller cells need to be operated at high stoichiometric flow factor or area-specific flow rate compared to a large cell. The choice of electrolyte circulation rate of 0.37 mL.min−1.cm−2 is close to the optimal flow condition for the larger cell (0.36) and is too low for the smaller cell optimum (0.67) for the operated current density of 75 mA.cm−2 [56]. Higher velocity in the electrode in the larger cell (see Figure 2) would have delayed the onset of mass transfer polarization, leading to higher discharge capacity. Round-trip life-cycle efficiencies for the energy, voltage and coulombs are determined by using instantaneous and simultaneously measured values of current and voltage during testing (the equations are described in detail elsewhere [58]). Based on average over three successive charge–discharge cycles, it is found that both the stacks show coulombic efficiency of ~96.5% and energy efficiency of ~76.5% with marginal differences between the two. As expected, there is more difference in the discharge energy, with it being 30.1 and 34.2 Wh.L−1, respectively, for the stacks fabricated with smaller and the larger cell size.

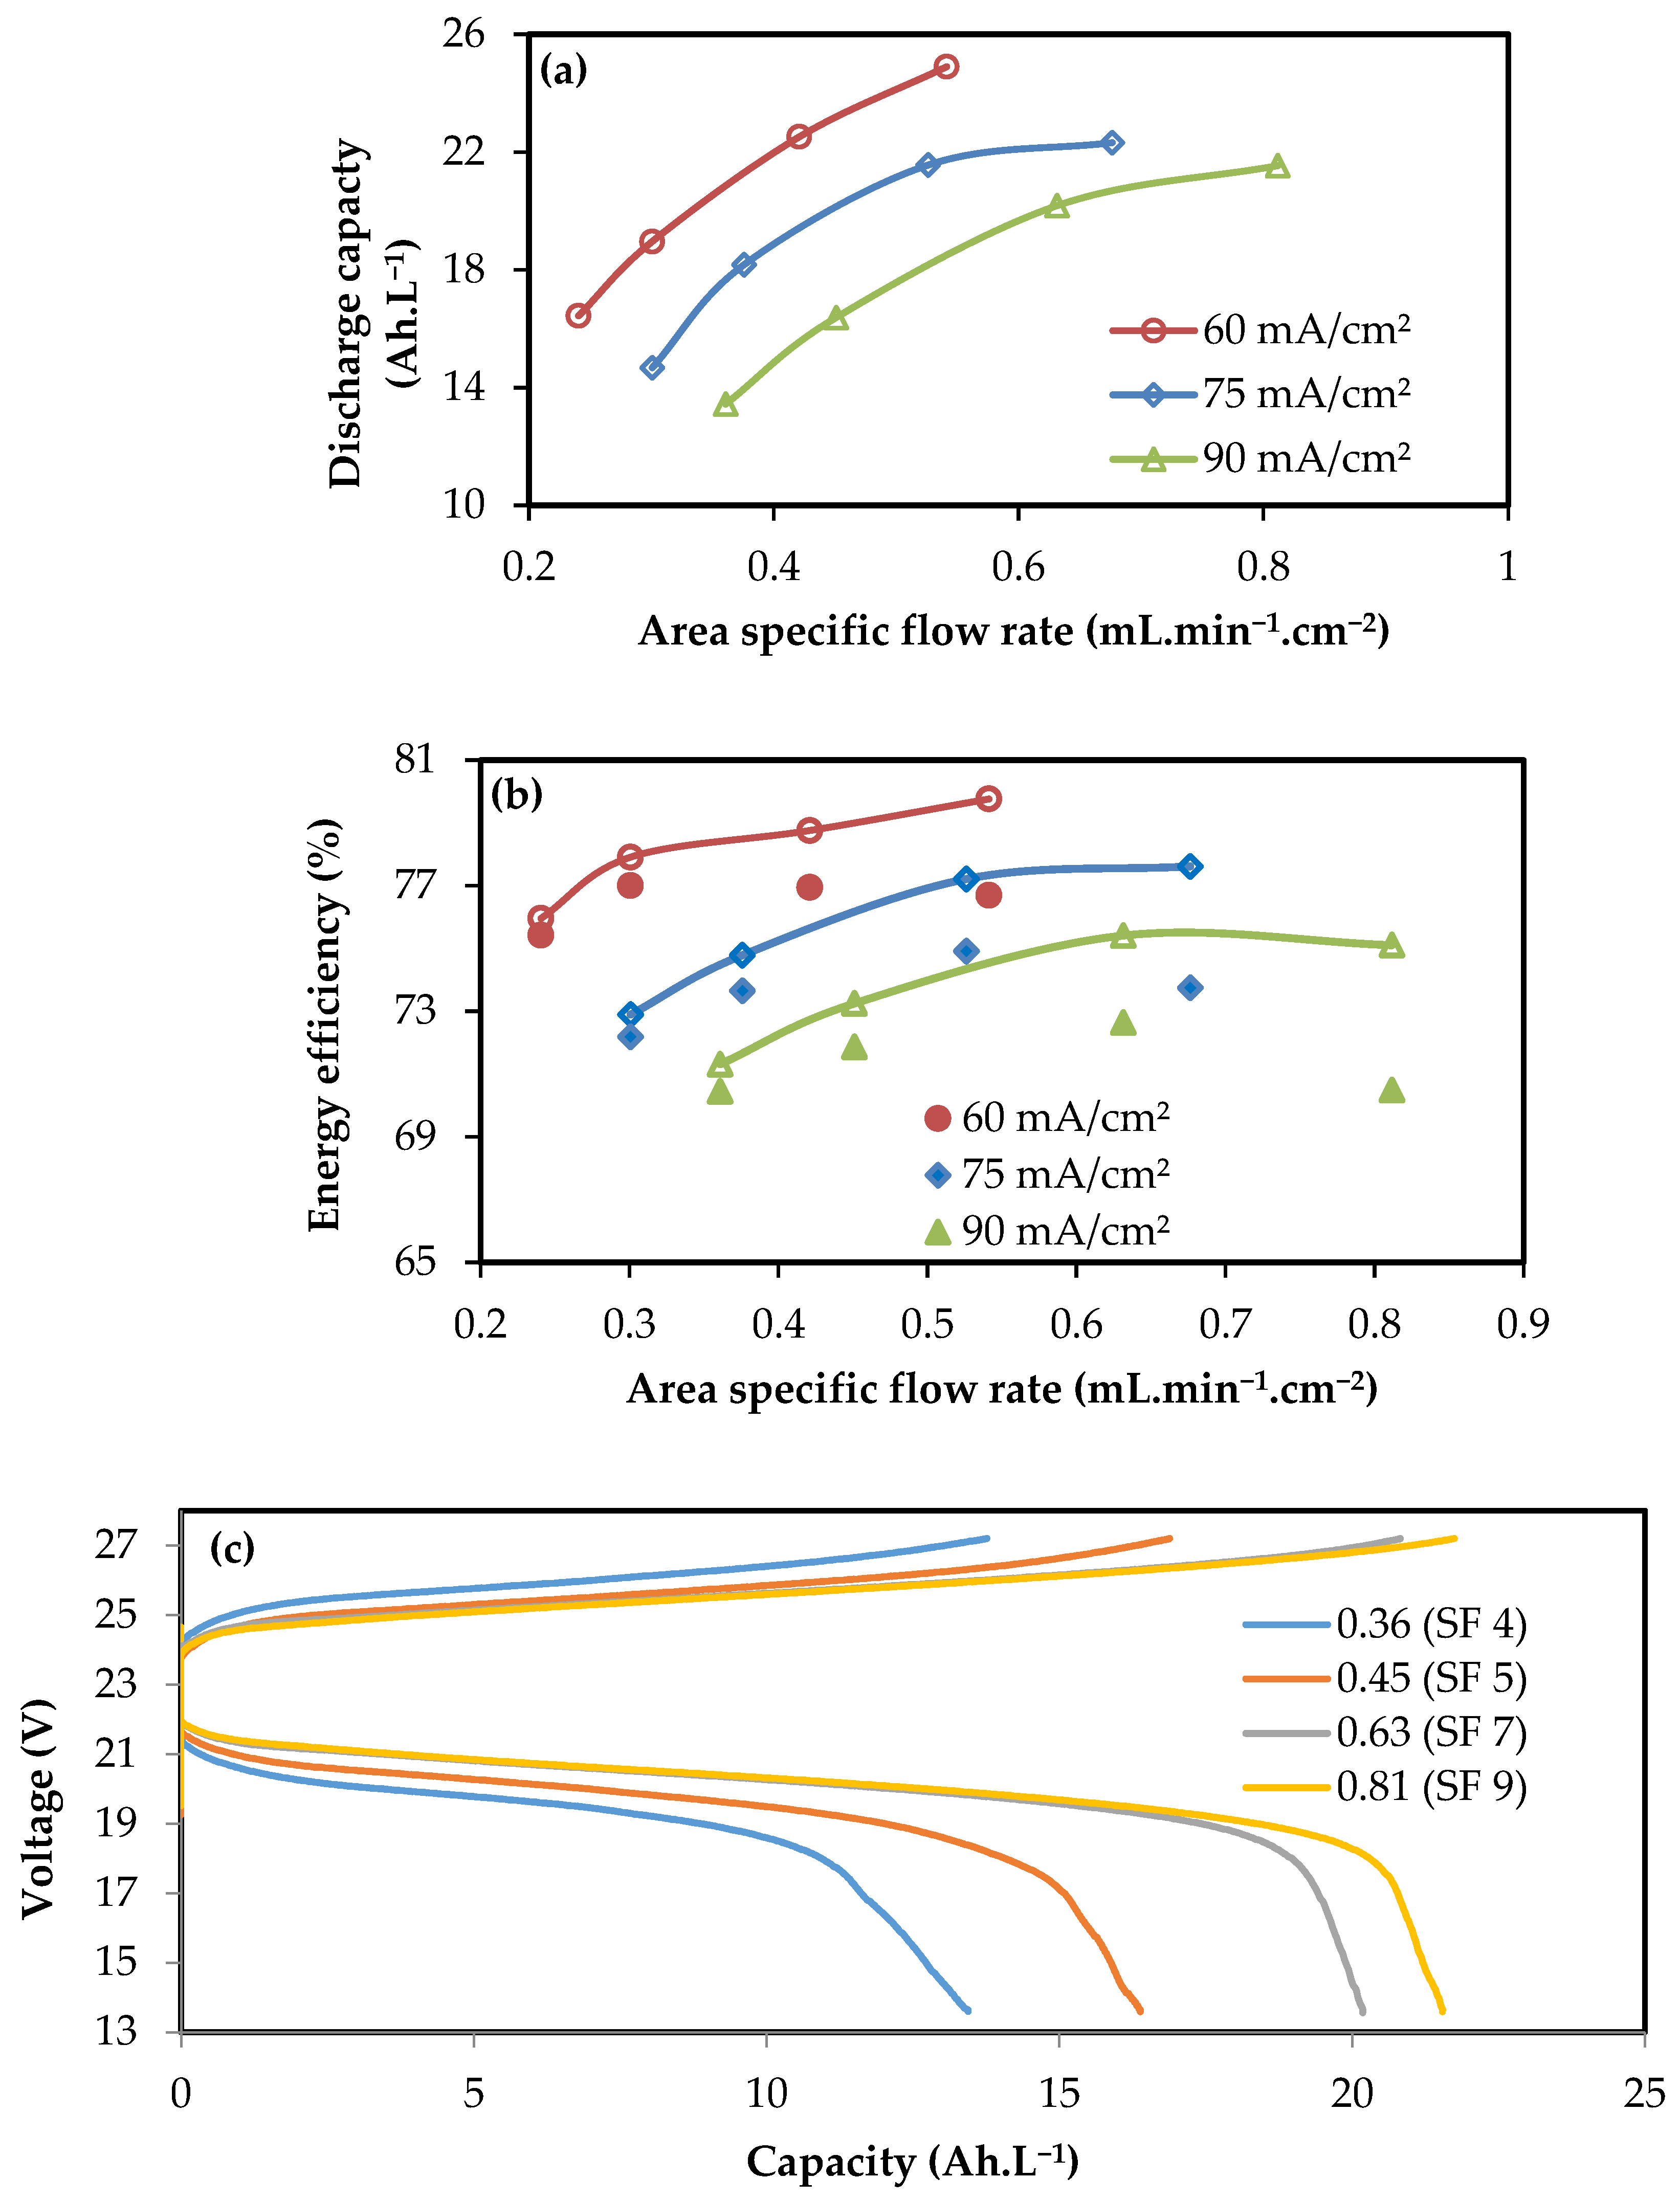
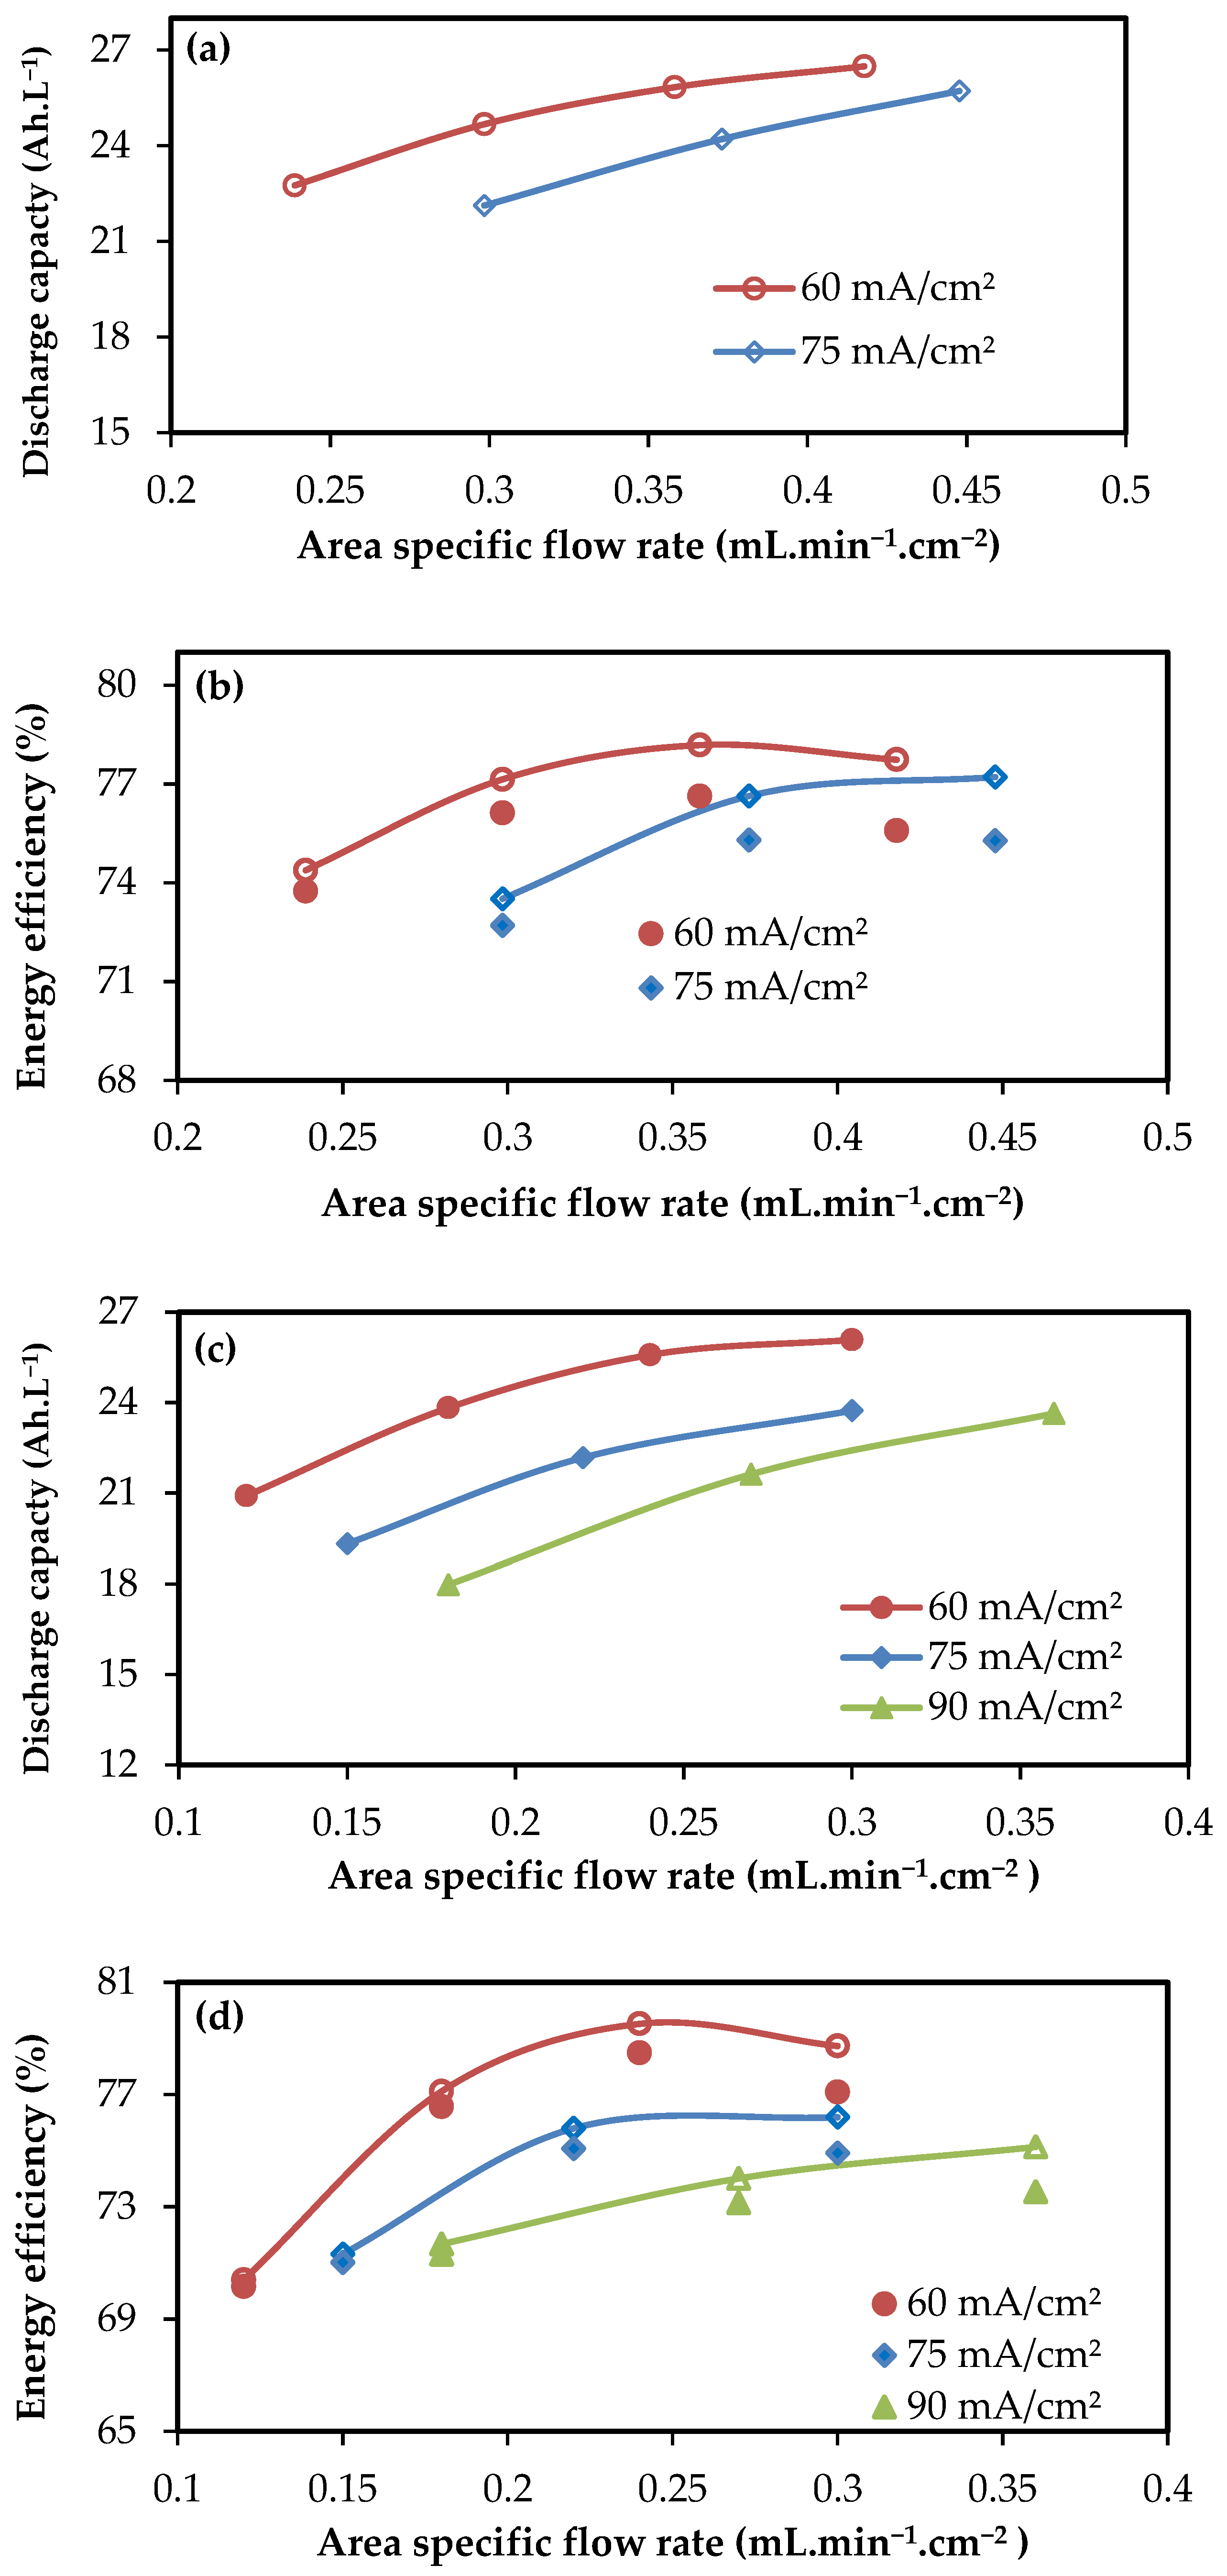
3.3. Performance of kW Scale Stacks

Three stacks, namely, 16 cell—410 cm2, 8 cell—918 cm2 and 8 cell—1500 cm2, were fabricated and tested for the performance. Pressure-drop studies were also conducted on these stacks to determine the pumping power requirement. Results of pressure drop measurements are plotted in Figure 4 as a function of area-specific flow rate for each stack. The contributions of the cell and the manifolds are shown separately. One can see that the stack pressure drop is increasing with cell size at the same area-specific flow rate. However, the increase is not commensurate with the flow rate through the serpentine channel. For example, for an area specific flow rate of 0.29 mL.min−1.cm−2, the total pressure drops in the smallest, medium and the largest cell stacks are 26.9, 32.2 and 45.7 kPa, even though the flow rates are in the proportion 1.00:2.24:3.66. This is due to the existence of a parallel flow path through the electrode that the flow can take [54]. As the pressure drop increases, the bypass flow rate increases reducing the channel flow rate and hence channel pressure drop. Another observation that can be made is that the contribution of the manifold pressure drop is much higher than the cell pressure drop for the smallest stack while the case is reversed for the larger stacks. The contribution of T-split manifolds is about 70% of the total pressure drop for the 16-cell small stack while it is about 40% of the total for the 8-cell larger stacks. Higher contribution in the 16-split manifold is attributed to increased branching and high velocity in the last elbow which feeds electrolyte to the inlet of the graphite plate. Careful dimensioning is therefore required to minimize pressure losses in the manifolds. Finally, even though the overall pressure drop is the lowest in the smallest stack at the same area-specific flow rate, smaller cell stacks need to be run at a higher stoichiometric flow factor than larger cell stacks to get the similar electrochemical performance [56]. Thus, there are several contributing factors that determine the stack pressure drop. A comparison of the stack pressure drops will be made later after establishing the optimal flow condition for each stack.
Several electrochemical life-cycle tests were conducted at a fixed current density of 60 mA.cm−2 for electrolyte circulation rate in the range of 0.24 to 0.54 mL.min−1.cm−2, at 75 mA.cm−2 for circulation rate in the range of 0.30 to 0.68 mL.min−1.cm−2 and at 90 mA.cm−2 for circulation rate in the range of 0.36 to 0.81 mL.min−1.cm−2 (each flow rate window corresponds to SF 4 to SF 9 at the respective current density), using the stack of configuration 16 cell—410 cm2. Discharge performance over these respective optimal flow rate conditions is plotted in Figure 5a,b in terms of capacity and energy efficiency with (closed symbols) and without (open symbols) including pumping losses. Supplementary Material has been provided with procedure to calculate the pumping losses in the battery life cycle operation for a known electrolyte flow rate and the pressure drop. It also gives the electrochemical data of the kW-scale stacks described in this paper at typical operating range of current densities and electrolyte flow rates. It can be seen that the capacity (Figure 5a) and energy efficiency (Figure 5b) increases monotonically with the flow rate at all the current densities although there seems to be some saturation or even slightly lower performance at high flow rates. Different explanations have been given in the literature [36,56,62,63] for the saturated/decreased performance at very high flow rates, including the intrinsic mass transport limitation of the electrode, accumulation of product species in the electrode region, electrolyte imbalance resulting from higher osmotic pressure and removal of surface functional groups from the electrode.
Typical charge–discharge life cycles of the stack (16 cell—410 cm2) are presented in the Figure 5c for various electrolyte circulation rates. It can be seen that the capacity of the cycle increases with increase in flow rate, and this can be attributed to the decrease in concentration over-potentials with increase in electrolyte velocity in the electrode. Our earlier studies [56,57] on the effect of electrolyte velocity and electrolyte distribution pattern on the electrochemical performance of the single-cell VRFBs found that the velocity of electrolyte corresponding to a Reynolds number of 2 gives optimal electrochemical performance and the flow rate far from this will results in poor performance due to high mass transport resistance. As shown in the Figure 5c, flow rates of 0.63 and 0.81 mL.min−1.cm−2 are close to the optimal electrolyte flow rate range [56] and other flow rates are far from the recommended range and therefore gave low capacity. Although the capacity and the energy content of the cycle increases with flow rate, the pressure drop and corresponding pumping power consumption increases parallelly. Therefore, when pumping losses are taken into account, the overall system efficiency shows a distinct peak indicating the existence of an optimal flow rate. For a fixed current density operation, the energy efficiency without considering the pumping losses shows only a small increase with flow rate unlike discharge capacity and discharge energy. For example, with increase in flow rate from 0.24 to 0.54 mL.min−1.cm−2 at 60 mA.cm−2, the increase in capacity and energy amount to about 60% whereas the increase in energy efficiency is just 4%. Similar results were reported by Ma et al. [9] who found a capacity increase of 60% but energy efficiency increase of only 5% when the flow rate is increased from 0.25 to 0.9 mL.min−1.cm−2 at current density of 75 mA.cm−2. Similarly, Kim et al. [20] reported increase of 20% for discharge energy but only 3% for energy efficiency when the circulation rate is increased from 0.17 to 0.51 mL.min−1.cm−2 for a current density of 80 mA.cm−2. However, as the flow rate increases, the pressure drop increases and this may negate some of the gains in efficiency. Indeed, as can be seen in Figure 5b, the system efficiency, i.e., energy efficiency after accounting for pumping power (estimated here as 2Q∆P/ƞp, where Q is the volumetric flow rate on one side of the cell, ∆P is the stack pressure drop on one side and ƞp is the pump efficiency (taken here to be 75%)) decreases at high circulation rates. In addition to system energy efficiency, one needs to take account of discharge energy while determining the optimal flow rate condition. In summary, for this 16 cell—410 cm2 stack, optimal circulation rate is in the range of 0.5 to 0.6 mL.min−1.cm−2 for current density range of 60 to 90 mA.cm−2. These values are similar to those obtained in single-cell studies [56].
Similar experiments have been conducted in the stacks of configuration 8 cell—918 cm2 and 8 cell—1500 cm2, but in a lower flow rate window, and the results are plotted in Figure 6a–d. The trends of discharge capacity and energy efficiency with increasing flow rates are similar to those for the 16 cell—410 cm2 stack. Optimal circulation rate is found to be in the range of 0.4 to 0.5 and 0.25 to 0.35 mL.min−1.cm−2 for current density range of 60 to 90 mA.cm−2, respectively for the stacks fabricated with cell sizes of 918 and 1500 cm2. The good performance at lower area-specific flow rates in large cells is attributed to increased split of electrolyte to electrode resulting in sufficient velocity in the electrode at low specific flow rates itself [56]. The coulomb and voltage efficiencies of the investigated stacks are presented in Table 3 for the chosen operating conditions.
In addition to the characterization of stacks at various flow rates and current densities, long-term performance testing was also conducted for over 125 charge–discharge cycles on the stack 8 cell—1500 cm2 at current density of 60 mA.cm−2 and flow rate of 0.24 mL.min−1.cm−2. The results are shown in Figure 7 for the loss in capacity and energy efficiency. It can be seen that the efficiency is constant throughout but that the capacity fades at the rate of about 0.2% per cycle which is within the limits of values reported in the literature [36,64]. Similar results were reported in our previous studies on a single cell [55]. Stability in the performance of a VRFB can be affected by several parameters like crossover of vanadium species leading to imbalance of active reactants, precipitation of vanadium ions, differential rates of gas evolutions and changes that can happen to activity of materials (membrane/electrode/solution) [36,64]. There are methods reported to recover the lost capacity like periodic remixing of electrolytes [65] and auto-rebalancing by creating hydraulic shunt between electrolyte reservoirs [61].
Comparison of these three stacks at an operating current density 60 mA.cm−2 at their respective optimal conditions is shown in Table 4 It can be seen that the discharge performance in terms of specific capacity, energy density and energy efficiency is nearly the same at the respective optimal conditions. The difference can be seen only in terms of system efficiency and the power traded. The energy consumed for pumping element in a duty of one kW power trading is about 3% of its discharge energy in the smaller cell size (410 cm2) stack while the larger cell size (1500 cm2) stack consumed less than 1% of its discharge energy. When the power is compared for stacks having equal number of cells connected in series, the 8 cell—1500 cm2 stack configuration has discharged nearly twice the power of the 8 cell—918 cm2 stack configuration at equal expense of pressure drop. In this way, the stacks assembled with our optimized serpentine flow field geometry on graphite bipolar plates benefited in terms of low pressure drop, marginal loss in capacity and gain in system efficiency while scaling-up the cell size from 400 to 1500 cm2.

3.4. Cell and Stack Resistance

Cell resistivity is a useful parameter of an electrochemical cell; it is an overall characteristic that reflects the choice of the materials used, the design of the cell (including electrode thickness, compression and its interaction with the flow channels, if any) and the operating conditions such as the temperature and state of charge (SoC). The cell resistance, Rcell, can be measured from the following relation [10,66]:
ɳ = I·Rcell
where ɳ is the cell over-potential (i.e., the difference between the cell voltage and its open circuit voltage), and I is the cell current. Since the current density rather than the cell current is a more intrinsic quantity in an electrochemical reaction, the cell resistance is often expressed in the more comparable form of area specific resistance (ASR) defined as ASR = Rcell × nominal electrode surface area, which, for a planar electrode of length, L, and width, W, is given by the following:
ASR = (ɳ × L × W)/j
where j is the cell current density [10]. For a stack, the overall ASR can be determined from assuming that all cells are operating uniformly so that Equation (2) can be applied on a per cell basis. ASR determined from Equation (2) can be expected to vary, for a given cell, with both flow rate and the state of charge (SoC). However, careful experimental studies [55] show that for SoC in the range of 40 to 60% and for flow rates under near optimal conditions, ASR is not sensitive to these parameters. Thus, in the present study, ASR at the cell-level and stack-level were calculated from power density measurement data for cells [55,56] and stacks [31,67]. In these experiments, the cell was operated for a brief period (30 to 60 s) at a current density and the cell voltage was measured. At the end of each such short-duration experiment, the open circuit voltage (OCV) was measured for 60 s; this duration was found to be sufficient for the OCV to reach a steady value. Another way to calculate the ASR is from a plot of the voltage vs. capacity curves obtained during charging and discharging of the type shown in Figure 3 and Figure 5c. The voltage difference between charging and discharging part of the curves at half-capacity is a good measure of (2ɳ), where ɳ is the average overpotential at the current density and at intermediate values of SoC. The ASR estimated this way based on the voltage window at half-capacity is found to agree very well (within ±10%) with that obtained from direct measurement of the over-potential. Table 5 lists the data of ASR obtained for the three cells and five stacks discussed in the present study.
It can be seen that, since all the cells and stacks use the same materials and same cell design and are operated at their respective optimal flow rate conditions, the ASR values vary in the narrow range of 1.8 to 2.4 mΩ.cm2 with smaller cells showing lower ASR. The slightly lesser values of ASR for the stacks may be attributed to the losses in the end plates which are shared among the cells in the case of stacks. The ASR values are broadly in agreement with those reported in the literature. Zhang et al. [68] reported an ASR of about 1.8 mΩ.cm2 for the cell of area 5 cm2 fabricated with high compression ratio of 75% of an electrode thickness 6 mm (SGL), Nafion 115 membrane by circulating electrolyte of concentration 1 M vanadyl sulfate in 4 M sulfuric acid.

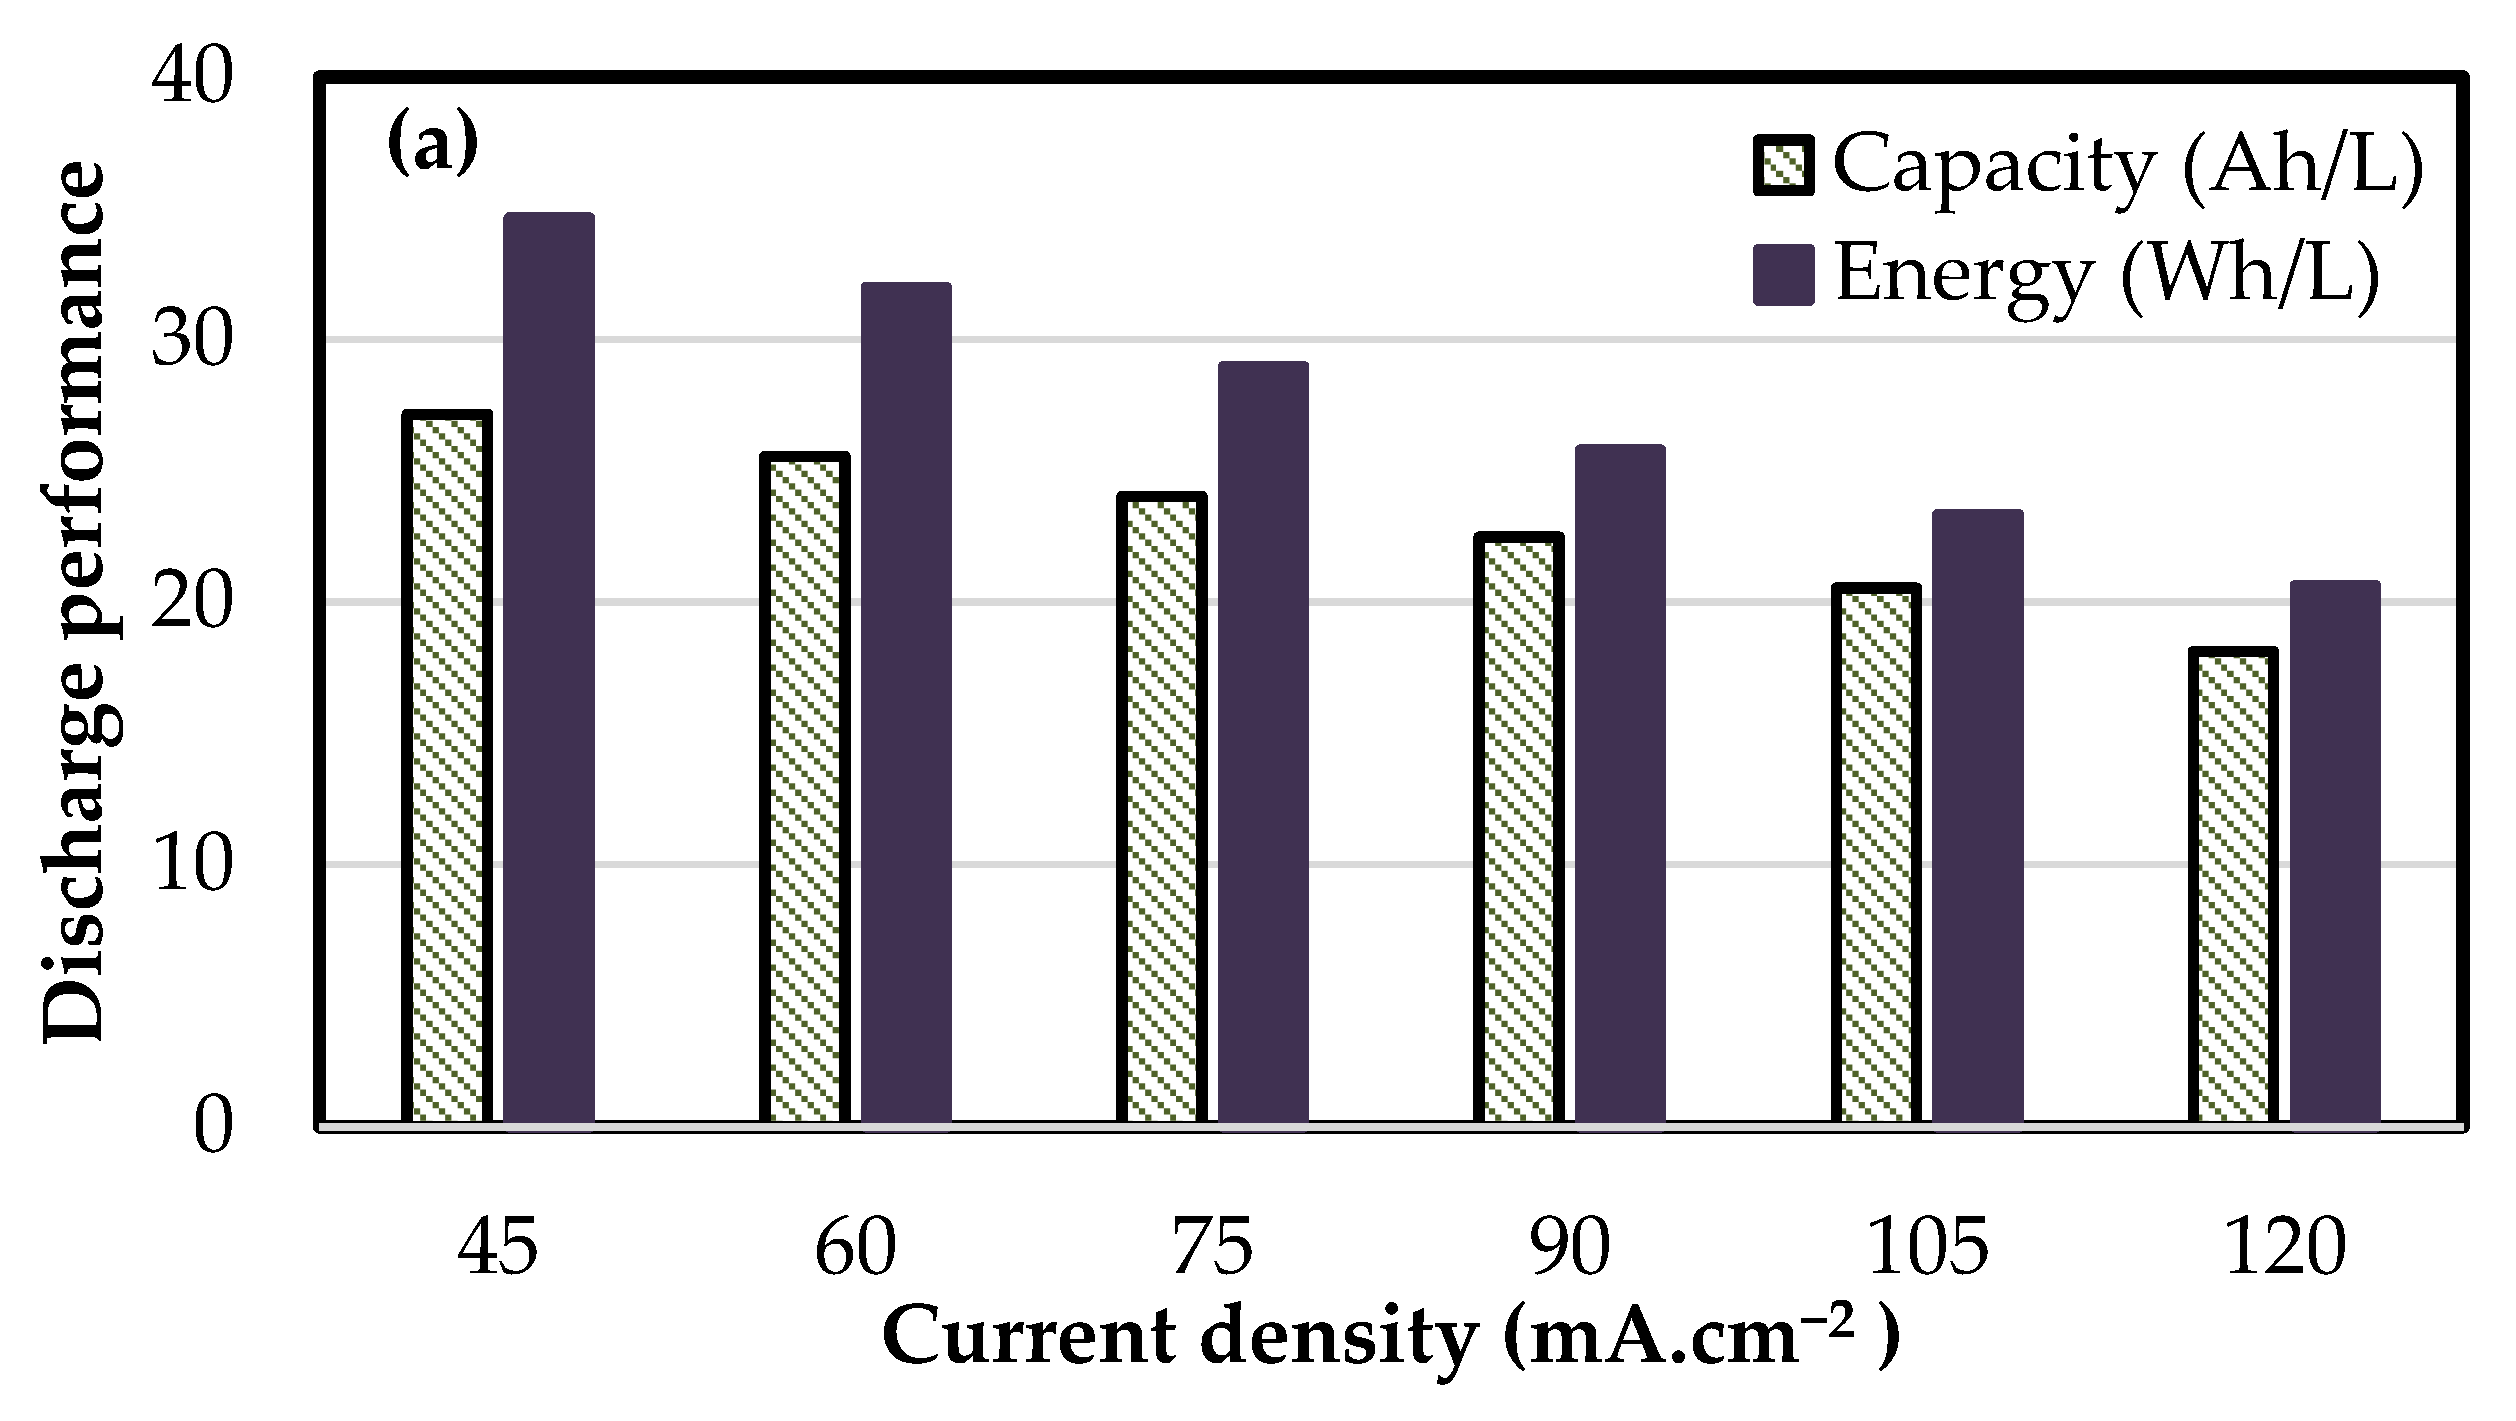
4. Fixed Flow Rate Operation

Irrespective of the cell size, the optimal flow rate is found to change with current density to some extent. This would imply that in a dynamic situation where the power at which the battery needs to be charged or discharged changes with time, there is a need to dynamically vary the circulation rate even if the battery was to be operated at a constant stoichiometric factor. Variable flow rate strategy requires dynamic measurement of changes in power levels and SoC of electrolyte. In addition, most pumps have a limited range of parameters in which the pumps operate at high efficiency. If there is a fixed flow rate which can give good performance for a range of current densities, the life of the pump can be increased and complexity in online measurement of dynamic power and SoC can be reduced. In view of this, charge–discharge tests were conducted in the stacks (8 cell—918 cm2 and 8 cell—1500 cm2) at a fixed flow rate of 0.36 and 0.30 mL.min−1.cm−2, respectively, for various current densities in the range of 45 to 120 mA.cm−2. At each current density, three charge–discharge cycles were conducted and the average of the three is reported in Figure 8 and Figure 9. The stack 8 cell—918 cm2 exhibited specific discharge capacity in the range of 27 to 20 Ah.L−1, energy density in the range of 35 to 24 Wh.L−1 with system efficiency in the range of 77 to 69% for current density in the range of 45 to 120 mA.cm−2 at a fixed flow rate of 0.36 mL.min−1.cm−2. The corresponding values for the stack 8 cell—1500 cm2 are 27 to 18 Ah.L−1, 35 to 21 Wh.L−1 and 79 to 67% at the lower fixed flow rate of 0.30 mL.min−1.cm−2. For current densities of up to 75 mA.cm−2, both the stacks have given equal performance, but at higher current densities, the large cell stack gave marginally lower performance due to higher ohmic over-potentials arising from high current values and high rate of depletion of active reactant with low replenishment compared to 918 cm2 cell size. Taken together, these results show that at close to the optimal flow rate conditions, a stack can be operated at ±25% rated power without affecting the electrochemical performance in a significant way. For variations of ±50% from the rated power, there is an appreciable change; however, the degradation in performance is not too severe in terms of efficiency. In a low pressure drop stack such as the present one, constant flow rate operation is therefore possible for integration with renewable energy sources and dynamic power demands.
Comparison of the performance characteristics of the VRFB stacks designed with serpentine flow fields on thick bipolar plates of the present study with those using conventional flow through mode on thin bipolar plates is shown in Table 6 For current densities up to 120 mA.cm−2, stack pressure drop of about 30 to 50 kPa at operated flow rate range over the cell sizes 900 and 1500 cm2 is low compared to that in stacks with thin graphite plates [12,13,60]. This leads to a relatively small loss of efficiency of only about 1 to 2% because of low pumping power compared to about 5% or higher for thin graphite plate stacks. Pressure drop can be further reduced by improving the design of split manifold or using other designs such as a tapered manifold. Preliminary measurements indicate that a reduction of about 40% in manifold pressured drop can be obtained by using a tapered design. This helps in improving the overall system efficiency marginally in large stacks. As stated earlier, enhancement in electrochemical performance also can be achieved by using thermally treated felts [35,36,59,60,61], mixed acid electrolytes [20,59] and other activation techniques.

5. Conclusions

Three kilowatt-scale vanadium redox flow battery stacks, one having 16 cells with cell area of 410 cm2 each, one having 8 cells of area of 918 cm2 each and another having 8 cells of area of 1500 cm2 each, were built with thick graphite plates grooved with serpentine flow fields. The individual cells were provided with inlets and outlets on the sides which were connected to a T-split manifold to ensure uniform feeding of all cells. The stacks were tested for electrochemical performance over a range of current densities and flow rates. The following conclusions can be drawn from these studies.
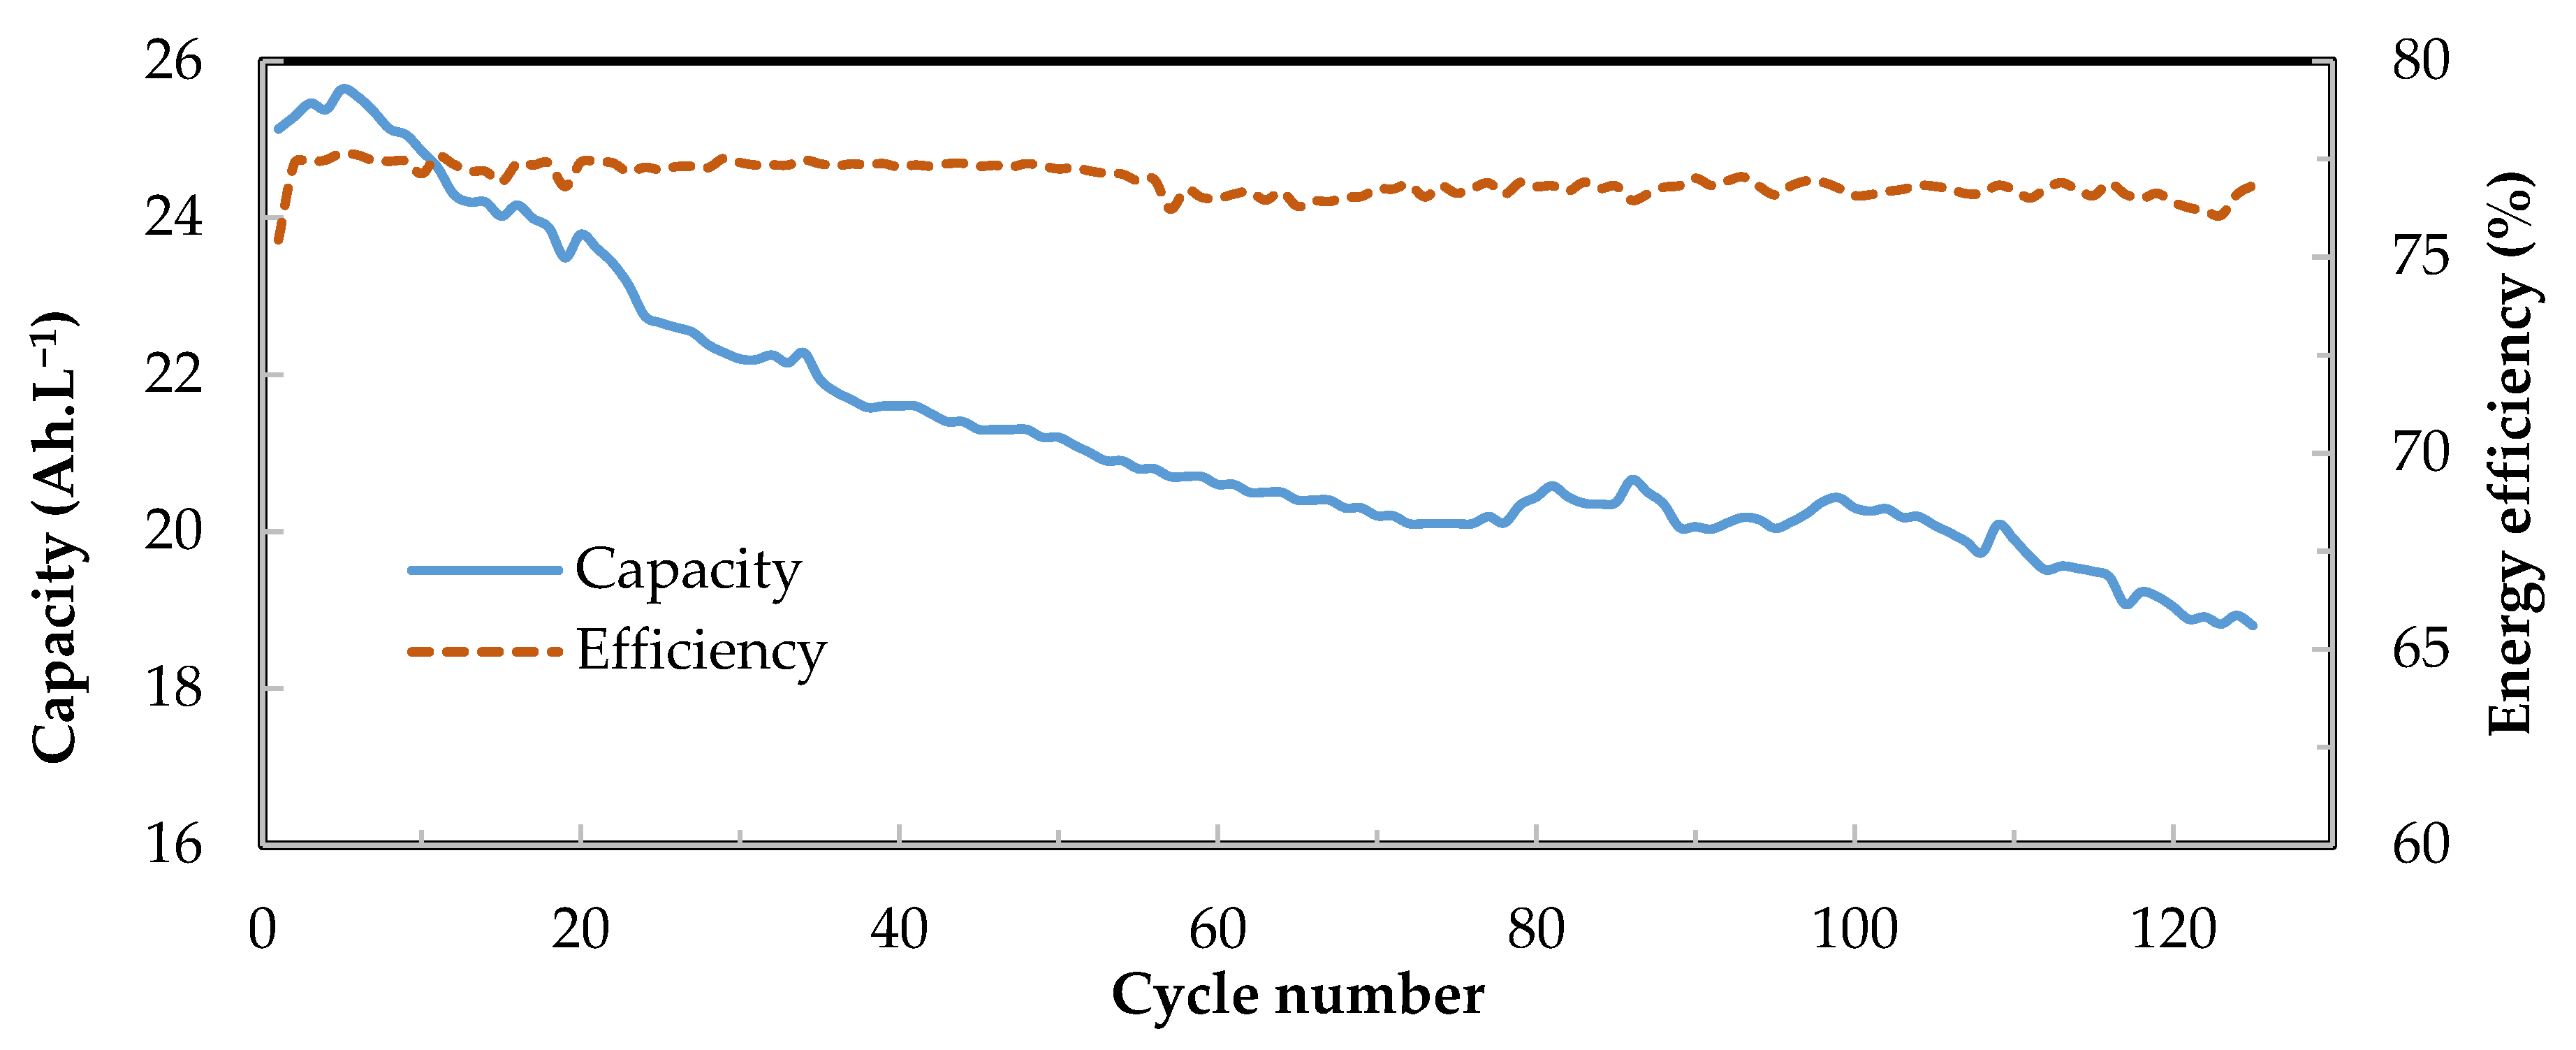
  • Stacks of different cell sizes have different optimal flow rate conditions. Under their optimal flow conditions, stacks of all three cell sizes exhibit good and similar electrochemical performance of discharge energy density >30 Wh per liter and energy efficiency >75%. This can be attributed to the use of optimized serpentine flow field.
  • Manifold pressure losses constitute a significant part of the total pumping power consumption. Careful design of split manifolds can reduce pressure losses, while maintaining uniform distribution to all cells.
  • Stacks having larger cell sizes have the advantage of being able to operate at lower stoichiometric flow factors in obtaining good electrochemical performance. This reduces the power spent on pumping compared to smaller cell size stacks.
  • Stacks designed with serpentine flow fields can be operated at a fixed flow rate for power variations of ±25%, with no significant changes in discharge capacity and efficiency. A wider window of operation of up to ±50% can be executed with minor changes in the electrochemical perfor-mance.
  • Stacks of the present design can be operated at considerably lower pressure drops for a 2 kW stack, resulting in efficiency loss of 1 to 2% only when pumping power is considered. This is in contrast to a loss of 5 to 7% for flow frame-supported thin graphite sheet design.
  • Cells of 1500 cm2 active area can be used to develop kilowatt-scale VRFB stacks with serpentine flow fields.

Supplementary Materials

The following are available online at https://www.mdpi.com/article/10.3390/batteries7020030/s1, Figure S1: Polarization study of the stack 8 cell—1500 cm2 (a) charging at constant current density of 60 mA/cm2 followed by discharge at intervals of current density and (b) broad visualization of the discharge curves with OCV measured between the discharge steps, Table S1: Pump loss calculations for the stack 16 Cell—410 cm2, Table S2: Electrochemical characteristics of the stack 16 Cell—410 cm2, Table S3: Electrochemical characteristics of the stack 8 cell—900 cm2, Table S4: Pump loss calculations for the stack 8 Cell—1500 cm2, Table S5: Electrochemical characteristics of the stack 8 cell—1500 cm2.

Author Contributions

R.G., conceptualization, methodology, software, data curation, visualization and writing—original draft. S.J., conceptualization, data curation, validation, writing—review and editing, supervision and funding acquisition. All authors have read and agreed to the published version of the manuscript.

Funding

This research was funded by grants from MHRD (grant reference no. F.NO.41-2/2015-T.S.-I (Pt.)) and DST-Solar Energy Harnessing Centre (grant reference no. DST/TMD/SERI/HUB/1(C)), both of Government of India.

Data Availability Statement

Exclude the statement as the required data is already given as a supplementary document with this manuscript.

Acknowledgments

Financial supports from the Ministry of Human Resource Department and Department of Science and Technology, both of the Government of India, are gratefully acknowledged.

Conflicts of Interest

The authors declare no conflict of interest.

References

  1. Guney, M.S.; Tepe, Y. Classification and assessment of energy storage systems. Renew. Sustain. Energy Rev. 2017, 75, 1187–1197. [Google Scholar] [CrossRef]
  2. Weber, A.Z.; Mench, M.M.; Meyers, J.P.; Ross, P.N.; Gostick, J.T.; Liu, Q. Redox flow batteries: A review. J. Appl. Electrochem. 2011, 41, 1137–1164. [Google Scholar] [CrossRef] [Green Version]
  3. Skyllaskazacos, M.; Chakrabarti, M.H.; Hajimolana, S.A.; Mjalli, F.S.; Saleem, M. Progress in flow battery research and development. J. Electrochem. Soc. 2011, 158, R55–R79. [Google Scholar] [CrossRef]
  4. Alotto, P.; Guarnieri, M.; Moro, F. Redox flow batteries for the storage of renewable energy: A review. Renew. Sustain. Energy Rev. 2014, 29, 325–335. [Google Scholar] [CrossRef]
  5. Aneke, M.; Wang, M. Energy storage technologies and real life applications—A state of the art review. Appl. Energy 2016, 179, 350–377. [Google Scholar] [CrossRef] [Green Version]
  6. Rychcik, M.; Skyllas-Kazacos, M. Characteristics of a new all-vandium redox flow battery. J. Power Sources 1988, 22, 59–61. [Google Scholar] [CrossRef]
  7. Kear, G.; Shah, A.A.; Walsh, F.C. Development of the all-vanadium redox flow battery for energy storage: A review of technological, Financial and policy aspects. Int. J. Energy Res. 2012, 36, 1105–1120. [Google Scholar] [CrossRef]
  8. Skyllas-Kazacos, M.; Menictas, C.; Lim, T. Redox flow batteries for medium- to large-scale energy storage. In Electricity Transmission, Distribution and Storage Systems; Melhem, Z., Ed.; Woodhead Publishing: Cambridge, UK, 2013; pp. 398–441. Available online: http://dx.doi.org/10.1533/9780857097378.3.398 (accessed on 29 April 2021).
  9. Ma, X.; Zhang, H.; Sun, C.; Zou, Y.; Zhang, T. An optimal strategy of electrolyte flow rate for vanadium redox flow battery. J. Power Sources 2012, 203, 153–158. [Google Scholar] [CrossRef]
  10. Tang, A.; Bao, J.; Skyllas-Kazacos, M. Studies on pressure losses and flow rate optimization in vanadium redox flow battery. J. Power Sources 2014, 248, 154–162. [Google Scholar] [CrossRef]
  11. Park, D.-J.; Jeon, K.-S.; Ryu, C.-H.; Hwang, G.-J. Performance of the all-vanadium redox flow battery stack. J. Ind. Eng. Chem. 2017, 45, 387–390. [Google Scholar] [CrossRef]
  12. Wu, X.; Yuan, X.; Wang, Z.; Liu, J.; Hu, Y.; Deng, Q.; Yin, X.; Zhou, Q.; Zhou, W.; Wu, Y. Electrochemical performance of 5 kW all-vanadium redox flow battery stack with a flow frame of multi-distribution channels. J. Solid State Electrochem. 2017, 21, 429–435. [Google Scholar] [CrossRef]
  13. García-Quismondo, E.; Almonacid, I.; Martínez, M.; Ángeles, C.; Miroslavov, V.; Serrano, E.; Palma, J.; Salmerón, J.P.A. Operational experience of 5 kW/5 kWh all-vanadium flow batteries in photovoltaic grid applications. Batteries 2019, 5, 52. [Google Scholar] [CrossRef] [Green Version]
  14. Li, Y.; Zhang, X.; Bao, J.; Skyllas-Kazacos, M. Studies on optimal charging conditions for vanadium redox flow batteries. J. Energy Storage 2017, 11, 191–199. [Google Scholar] [CrossRef]
  15. Wang, T.; Fu, J.; Zheng, M.; Yu, Z. Dynamic control strategy for the electrolyte flow rate of vanadium redox flow batteries. Appl. Energy 2018, 227, 613–623. [Google Scholar] [CrossRef]
  16. Guarnieri, M.; Trovo, A.; Picano, F. Enhancing the efficiency of kW-class vanadium redox flow batteries by flow factor modulation: An experimental method. Appl. Energy 2020, 262, 114532. [Google Scholar] [CrossRef]
  17. Guarnieri, M.; Trovò, A.; Marini, G.; Sutto, A.; Alotto, P. High current polarization tests on a 9 kW vanadium redox flow battery. J. Power Sources 2019, 431, 239–249. [Google Scholar] [CrossRef]
  18. Trovò, A.; Picano, F.; Guarnieri, M. Comparison of energy losses in a 9 kW vanadium redox flow battery. J. Power Sources 2019, 440, 227144. [Google Scholar] [CrossRef]
  19. Xing, F.; Zhang, H.; Ma, X. Shunt current loss of the vanadium redox flow battery. J. Power Sources 2011, 196, 10753–10757. [Google Scholar] [CrossRef]
  20. Kim, S.; Thomsen, E.; Xia, G.; Nie, Z.; Bao, J.; Recknagle, K.; Wang, W.; Viswanathan, V.; Luo, Q.; Wei, X.; et al. 1 kW/1 kWh advanced vanadium redox flow battery utilizing mixed acid electrolytes. J. Power Sources 2013, 237, 300–309. [Google Scholar] [CrossRef]
  21. Yin, C.; Guo, S.; Fang, H.; Liu, J.; Li, Y.; Tang, H. Numerical and experimental studies of stack shunt current for vanadium redox flow battery. Appl. Energy 2015, 151, 237–248. [Google Scholar] [CrossRef]
  22. Ye, Q.; Hu, J.; Cheng, P.; Ma, Z. Design trade-offs among shunt current, pumping loss and compactness in the piping system of a multi-stack vanadium flow battery. J. Power Sources 2015, 296, 352–364. [Google Scholar] [CrossRef]
  23. Fink, H.; Remy, M. Shunt currents in vanadium flow batteries: Measurement, modelling and implications for efficiency. J. Power Sources 2015, 284, 547–553. [Google Scholar] [CrossRef]
  24. Arenas, L.; de León, C.P.; Walsh, F. Engineering aspects of the design, construction and performance of modular redox flow batteries for energy storage. J. Energy Storage 2017, 11, 119–153. [Google Scholar] [CrossRef] [Green Version]
  25. Chalamala, B.R.; Soundappan, T.; Fisher, G.R.; Anstey, M.R.; Viswanathan, V.V.; Perry, M.L. Redox flow batteries: An engineering perspective. Proc. IEEE 2014, 102, 976–999. [Google Scholar] [CrossRef]
  26. Ke, X.; Prahl, J.M.; Alexander, J.I.D.; Wainright, J.S.; Zawodzinski, T.A.; Savinell, R.F. Rechargeable redox flow batteries: Flow fields, stacks and design considerations. Chem. Soc. Rev. 2018, 47, 8721–8743. [Google Scholar] [CrossRef]
  27. Gundlapalli, R.; Kumar, S.; Jayanti, S. Stack design considerations for vanadium redox flow battery. INAE Lett. 2018, 3, 149–157. [Google Scholar] [CrossRef]
  28. Moro, F.; Trovò, A.; Bortolin, S.; Del Col, D.; Guarnieri, M. An alternative low-loss stack topology for vanadium redox flow battery: Comparative assessment. J. Power Sources 2017, 340, 229–241. [Google Scholar] [CrossRef]
  29. Gurieff, N.; Cheung, C.; Timchenko, V.; Menictas, C. Performance enhancing stack geometry concepts for redox flow battery systems with flow through electrodes. J. Energy Storage 2019, 22, 219–227. [Google Scholar] [CrossRef]
  30. Whitehead, A.; Rabbow, T.; Trampert, M.; Pokorny, P. Critical safety features of the vanadium redox flow battery. J. Power Sources 2017, 351, 1–7. [Google Scholar] [CrossRef]
  31. Gundlapalli, R.; Jayanti, S. Case studies of operational failures of VRFB stacks, diagnosis and remedial actions. J. Energy Storage 2020, 33, 102078. [Google Scholar] [CrossRef]
  32. Schreiber, M.; Harrer, M.; Whitehead, A.; Bucsich, H.; Dragschitz, M.; Seifert, E.; Tymciw, P. Practical and commercial issues in the design and manufacture of vanadium flow batteries. J. Power Sources 2012, 206, 483–489. [Google Scholar] [CrossRef]
  33. Minke, C.; Kunz, U.; Turek, T. Techno-economic assessment of novel vanadium redox flow batteries with large-area cells. J. Power Sources 2017, 361, 105–114. [Google Scholar] [CrossRef]
  34. Li, M.-J.; Zhao, W.; Chen, X.; Tao, W.-Q. Economic analysis of a new class of vanadium redox-flow battery for medium- and large-scale energy storage in commercial applications with renewable energy. Appl. Therm. Eng. 2017, 114, 802–814. [Google Scholar] [CrossRef]
  35. Pezeshki, A.M.; Clement, J.T.; Veith, G.M.; Zawodzinski, T.A.; Mench, M.M. High performance electrodes in vanadium redox flow batteries through oxygen-enriched thermal activation. J. Power Sources 2015, 294, 333–338. [Google Scholar] [CrossRef] [Green Version]
  36. Monteiro, R.; Leirós, J.; Boaventura, M.; Mendes, A. Insights into all-vanadium redox flow battery: A case study on components and operational conditions. Electrochim. Acta 2018, 267, 80–93. [Google Scholar] [CrossRef]
  37. Wang, Q.; Qu, Z.; Jiang, Z.; Yang, W. Experimental study on the performance of a vanadium redox flow battery with non-uniformly compressed carbon felt electrode. Appl. Energy 2018, 213, 293–305. [Google Scholar] [CrossRef]
  38. Zhang, X.; Wu, Q.; Lv, Y.; Li, Y.; Zhou, X. Binder-free carbon nano-network wrapped carbon felt with optimized heteroatom doping for vanadium redox flow batteries. J. Mater. Chem. A 2019, 7, 25132. [Google Scholar] [CrossRef]
  39. Zhou, X.; Zhang, X.; Lv, Y.; Lin, L.; Wu, Q. Nano-catalytic layer engraved carbon felt via copper oxide etching for vanadium redox flow batteries. Carbon 2019, 153, 674–681. [Google Scholar] [CrossRef]
  40. Wu, Q.; Lv, Y.; Lin, L.; Zhang, X.; Liu, Y.; Zhou, X. An improved thin-film electrode for vanadium redox flow batteries enabled by a dual layered structure. J. Power Sources 2019, 410–411, 152–161. [Google Scholar] [CrossRef]
  41. Jiang, H.; Sun, J.; Wei, L.; Wu, M.; Shyy, W.; Zhao, T. A high power density and long cycle life vanadium redox flow battery. Energy Storage Mater. 2020, 24, 529–540. [Google Scholar] [CrossRef]
  42. Zhang, L.; Ling, L.; Xiao, M.; Han, D.; Wang, S.; Meng, Y. Effectively suppressing vanadium permeation in vanadium redox flow battery application with modified Nafion membrane with nacre-like nanoarchitectures. J. Power Sources 2017, 352, 111–117. [Google Scholar] [CrossRef]
  43. Xu, Q.; Zhao, T.; Zhang, C. Performance of a vanadium redox flow battery with and without flow fields. Electrochim. Acta 2014, 142, 61–67. [Google Scholar] [CrossRef]
  44. Jyothi Latha, T.; Jayanti, S. Hydrodynamic analysis of flow fields for redox flow battery applications. J. Appl. Electrochem. 2014, 44, 995–1006. [Google Scholar] [CrossRef]
  45. Knudsen, E.; Albertus, P.; Cho, K.; Weber, A.; Kojic, A. Flow simulation and analysis of high-power flow batteries. J. Power Sources 2015, 299, 617–628. [Google Scholar] [CrossRef] [Green Version]
  46. Kumar, S.; Jayanti, S. Effect of flow field on the performance of an all-vanadium redox flow battery. J. Power Sources 2016, 307, 782–787. [Google Scholar] [CrossRef]
  47. Kumar, S.; Jayanti, S. High energy efficiency with low-pressure drop configuration for an all-vanadium redox flow battery. J. Electrochem. Energy Convers. Storage 2016, 13, 041005. [Google Scholar] [CrossRef]
  48. You, X.; Ye, Q.; Cheng, P. Scale-up of high power density redox flow batteries by introducing interdigitated flow fields. Int. Commun. Heat Mass Transf. 2016, 75, 7–12. [Google Scholar] [CrossRef]
  49. Bhattarai, A.; Wai, N.; Schweiss, R.; Whitehead, A.; Lim, T.M.; Hng, H.H. Advanced porous electrodes with flow channels for vanadium redox flow battery. J. Power Sources 2017, 341, 83–90. [Google Scholar] [CrossRef]
  50. Maurya, S.; Nguyen, P.T.; Kim, Y.S.; Kang, Q.; Mukundan, R. Effect of flow field geometry on operating current density, capacity and performance of vanadium redox flow battery. J. Power Sources 2018, 404, 20–27. [Google Scholar] [CrossRef]
  51. Ke, X.; Prahl, J.M.; Alexander, J.I.D.; Savinell, R.F. Redox flow batteries with serpentine flow fields: Distributions of electrolyte flow reactant penetration into the porous carbon electrodes and effects on performance. J. Power Sources 2018, 384, 295–302. [Google Scholar] [CrossRef]
  52. Zeng, Y.; Li, F.; Lu, F.; Zhou, X.; Yuan, Y.; Cao, X.; Xiang, B. A hierarchical interdigitated flow field design for scale-up of high-performance redox flow batteries. Appl. Energy 2019, 238, 435–441. [Google Scholar] [CrossRef]
  53. Sun, J.; Zheng, M.; Yang, Z.; Yu, Z. Flow field design pathways from lab-scale toward large-scale flow batteries. Energy 2019, 173, 637–646. [Google Scholar] [CrossRef]
  54. Gundlapalli, R.; Jayanti, S. Effect of channel dimensions of serpentine flow fields on the performance of a vanadium redox flow battery. J. Energy Storage 2019, 23, 148–158. [Google Scholar] [CrossRef]
  55. Gundlapalli, R.; Jayanti, S. Effect of electrode compression and operating parameters on the performance of large vanadium redox flow battery cells. J. Power Sources 2019, 427, 231–242. [Google Scholar] [CrossRef]
  56. Gundlapalli, R.; Jayanti, S. Effect of electrolyte convection velocity in the electrode on the performance of vanadium redox flow battery cells with serpentine flow fields. J. Energy Storage 2020, 30, 101516. [Google Scholar] [CrossRef]
  57. Gundlapalli, R.; Jayanti, S. Performance characteristics of several variants of interdigitated flow fields for flow battery applications. J. Power Sources 2020, 467, 228225. [Google Scholar] [CrossRef]
  58. Gundlapalli, R.; Jayanti, S. Dataset on performance of large-scale vanadium redox flow batteries with serpentine flow fields. Data Brief 2021, 35, 106835. [Google Scholar] [CrossRef] [PubMed]
  59. Reed, D.; Thomsen, E.; Li, B.; Wang, W.; Nie, Z.; Koeppel, B.; Kizewski, J.; Sprenkle, V. Stack developments in a kW class all vanadium mixed acid redox flow battery at the pacific northwest national laboratory. J. Electrochem. Soc. 2016, 163, A5211–A5219. [Google Scholar] [CrossRef] [Green Version]
  60. Reed, D.; Thomsen, E.; Li, B.; Wang, W.; Nie, Z.; Koeppel, B.; Sprenkle, V. Performance of a low cost interdigitated flow design on a 1 kW class all vanadium mixed acid redox flow battery. J. Power Sources 2016, 306, 24–31. [Google Scholar] [CrossRef] [Green Version]
  61. Bhattarai, A.; Wai, N.; Schweiss, R.; Whitehead, A.; Scherer, G.G.; Ghimire, P.C.; Lim, T.M.; Hng, H.H. Vanadium redox flow battery with slotted porous electrodes and automatic rebalancing demonstrated on a 1 kW system level. Appl. Energy 2019, 236, 437–443. [Google Scholar] [CrossRef]
  62. Xu, Q.; Zhao, T.; Leung, P. Numerical investigations of flow field designs for vanadium redox flow batteries. Appl. Energy 2013, 105, 47–56. [Google Scholar] [CrossRef]
  63. Dennison, C.R.; Agar, E.; Akuzum, B.; Kumbur, E.C. Enhancing Mass Transport in Redox Flow Batteries by Tailoring Flow Field and Electrode Design. J. Electrochem. Soc. 2016, 163, A5163–A5169. [Google Scholar] [CrossRef]
  64. Park, S.-K.; Shim, J.; Yang, J.H.; Jin, C.-S.; Lee, B.S.; Lee, Y.-S.; Shin, K.-H.; Jeon, J.-D. The influence of compressed carbon felt electrodes on the performance of a vanadium redox flow battery. Electrochim. Acta 2014, 116, 447–452. [Google Scholar] [CrossRef]
  65. Skyllas-Kazacos, M.; Kazacos, M. State of charge monitoring methods for vanadium redox flow battery control. J. Power Sources 2011, 196, 8822–8827. [Google Scholar] [CrossRef]
  66. Kim, J.; Park, H. Electrokinetic parameters of a vanadium redox flow battery with varying temperature and electrolyte flow rate. Renew. Energy 2019, 138, 284–291. [Google Scholar] [CrossRef]
  67. Jayanti, S.; Gundlapalli, R.; Chetty, R.; Jeevandoss, C.R.; Ramanujam, K.; Monder, D.S.; Rengaswamy, R.; Suresh, P.V.; Swarup, K.S.; Varadaraju, U.V.; et al. Characteristics of an indigenously developed 1 kW vanadium redox flow battery stack. In Proceedings of the 7th International Conference on Advances in Energy Research. Springer Proceedings in Energy; Bose, M., Modi., A., Eds.; Springer: Singapore, 2021. [Google Scholar]
  68. Zhang, C.; Zhao, T.; Xu, Q.; An, L.; Zhao, G. Effects of operating temperature on the performance of vanadium redox flow batteries. Appl. Energy 2015, 155, 349–353. [Google Scholar] [CrossRef]
Figure 1. Details of the stack construction: (A) schematic of a redox flow battery, (B) manometer arrangement for in situ pressure-drop measurement in the stack, (C) graphite plate with serpentine flow field and inlet/outlet feed tubes, (D,E) details of arrangement of flow feed through a Viton tube inserted into the side of the graphite plate, (F) overlaying of silicone gasket overlaid on the graphite overheads, (G) filling of flow channel with carbon felt, (H) placing membrane over the plate and the electrode, (I) placing of another silicone gasket over the membrane to house the adjacent electrode felt, (J) assembled single cell and (K) integrated 8-cell stack with split manifold.
Batteries 07 00030 g001aBatteries 07 00030 g001b
Figure 2. Predicted electrolyte velocity in the electrode over the cell areas 410, 918 and 1500 cm2.
Batteries 07 00030 g002
Figure 3. Voltage-capacity curves obtained during charge–discharge cycle test at operating current density of 75 mA.cm−2, flow rate of 0.37 mL.min−1.cm−2 on 4-cell stacks made with cells of size 410 cm2 and 918 cm2.
Batteries 07 00030 g003
Figure 4. Measured pressure drop as a function of the area specific flow rate for (a) 16 cell—410 cm2 stack, (b) 8 cell—918 cm2 stack and (c) 8 cell—1500 cm2 stack. The contributions of pressure drop in cell and manifolds are marked separately. Note that the flow rate range for each stack is different.
Batteries 07 00030 g004
Figure 5. Electrochemical performance data for the 16 cell—410 cm2 stack as a function of area specific flow rate and current density: (a) discharge capacity and (b) energy efficiency, including pumping energy consumption (closed symbols) and excluding pumping energy consumption (open symbols). (c) Charge–discharge life-cycle behavior of the stack for various flow rates in mL.min−1.cm−2 (with corresponding stoichiometric flow (SF) factors) at fixed current density of 90 mA.cm−2.
Batteries 07 00030 g005
Figure 6. Discharge performance of 8-cell stack of 918 cm2 cell area (a,b) and 8-cell stack of 1500 cm2 cell area (c,d) at various electrolyte flow rates and current densities. The filled symbols in (b,d) correspond to energy efficiency, including energy consumption by pumps, and the open symbols correspond to energy efficiency, without considering the pumping power losses.
Batteries 07 00030 g006
Figure 7. Capacity fade and energy efficiency of the 8 cell—1500 cm2 stack over 125 cycles at current density of 60 mA.cm−2 and flow rate of 0.24 mL.min−1.cm−2.
Batteries 07 00030 g007
Figure 8. Electrochemical performance of 8 cell—918 cm2 stack at different current densities at a constant electrolyte flow rate of 0.36 mL.min−1.cm−2: (a) discharge capacity and energy density and (b) system energy efficiency.
Batteries 07 00030 g008
Figure 9. Electrochemical performance of 8 cell—1500 cm2 stack at different current densities at a constant electrolyte flow rate of 0.30 mL.min−1.cm−2: (a) discharge capacity and energy density and (b) system energy efficiency.
Batteries 07 00030 g009aBatteries 07 00030 g009b
Table 1. Details of materials used in stack fabrication.
ComponentDescription
ElectrodeGraphite felt (GFA 6EA SGL Carbon)
Electrolyte1.61 M Vanadyl sulfate in 5 M Sulfuric acid
MembraneNafion 117
GasketSilicone
TubingSilicone, Viton and Tygon
Graphite plateSGL Carbon (R7650), Thickness-1.5 cm
Current collectorCopper pates of thickness 3 mm
Diameter (cm) of manifold componentsT1-19.05, T2-12.7, T3-9.53 and T4-6
E1-12.7, E2-7.4, E3-4.5 and E4-3.5 (E-Elbow, T-split)
Table 2. Details of stacks configured.
Preliminary Stacks
Average Power Rating (kW)Number of CellsElectrode Area (cm2)Volume of Electrolyte (L)
0.254410 (20.5 × 20)1
0.504918 (30.6 × 30)2.25
Kilowatt-scale stacks
116410 (20.5 × 20)8
18918 (30.6 × 30)8
281500 (30 × 50)8
Table 3. Coulombic efficiency (CE) and voltaic efficiency (VE) of the life cycles of stacks operated at various fixed current densities (J) and flow rates.
Stack16 Cell—410 cm28 Cell—918 cm28 Cell—1500 cm2
J (mA/cm2)Flow Rate (mL/min/cm2)CE (%) VE (%)Flow Rate (mL/min/cm2)CE (%) VE (%)Flow Rate (mL/min/cm2)CE (%) VE (%)
600.2497.278.20.2495.478.00.1293.975.0
600.3097.180.20.3096.779.80.1895.980.4
600.4295.282.70.3695.681.80.2495.183.6
600.5495.183.10.4296.280.80.3095.682.3
750.3097.175.10.3095.876.70.1595.774.5
750.3897.077.10.3796.079.80.2295.579.4
750.5396.380.10.4596.580.00.3096.778.8
750.6896.480.5
900.3697.773.0 0.1897.373.6
900.4597.075.5 0.2797.176.2
900.6396.977.8 0.3697.577.0
900.8196.677.8
Table 4. Performance of the kW scale stacks at operating current density of 60 mA/cm2 for optimal flow rate conditions with 8 L of electrolyte solution on each side of the stack.
Stack ConfigurationPower Rating (kW)Optimal Flow Rate (mL/min/cm2)Pressure Drop (kPa)Coulombic Efficiency (%)Energy Efficiency (%)Discharge
Without PumpWith PumpCapacity (Ah/L)Energy (Wh/L)
16 cell—410 cm210.5451.694.879.876.726.332.8
8 cell—918 cm210.3639.495.678.276.625.833.4
8 cell—1500 cm220.2438.795.179.578.525.633.0
Table 5. Estimated area specific resistance (ASR) in mΩ.cm2.
ConfigurationCell Area (cm2)ASR from Polarization DataASR from Voltage at 50% Capacity
Single-cell studies4102.081.83
9182.322.08
15002.412.25
Stack-level studies4 cell—410 cm21.901.95
4 cell—918 cm21.862.08
16 cell—410 cm22.171.93
8 cell—918 cm22.142.05
8 cell—1500 cm22.102.02
Table 6. Comparison of serpentine configured Vanadium redox flow battery (VRFB) stacks with that configured with conventional flow through mode and others.
Stack ConfigurationFlow FieldOperating Flow Rate (mL/min/cm2)Total Pressure Drop (kPa)Current Density (mA/cm2)Discharge Capacity (Ah/L)EE (%)System Efficiency (%)
15 Cell—875 cm2 [9]NoConstant-0.90 7518.477.958.5
Step-up flow rate 18.473.766.5
40 Cell—1500 cm2 [10]NoConstant-0.6010850 76.069.0
Variable 76.073.0
31 Cell—2714 cm2 [11]NoConstant-1.0 60 76.0
40 Cell—1800 cm2 [12]NoConstant-0.70154
(Cell level)
5029.682.8
8026.078.4
40 Cell—1800 cm2 [13]NoConstant-0.21 75 73.764.0
Variable 73.765.5
40 Cell—600 cm2 [16,17,18]NoConstant-0.63 5024.575.870.3
Variable 68.3
3 Cell—780 cm2 [61] *Interdigitated on bipolar plateConstant-0.511516017.578.0
20 Cell—625 cm2 [62] *Interdigitated on electrodeConstant-0.6447
(Cell level #)
8029.080.0
8 Cell—1500 cm2 (Present)Serpentine on bipolar plateConstant-0.30496025.578.676.9
9022.572.671.6
EE—energy efficiency, *—electrode is thermally treated, #—pressure drop is reported for water circulation and for electrolyte circulation it is approximately twice that of with water [45].
Publisher’s Note: MDPI stays neutral with regard to jurisdictional claims in published maps and institutional affiliations.

