
A Flexible Model for Benchmarking the Energy Usage of Automotive Lithium-Ion Battery Cell Manufacturing


Abstract
1. Introduction
2. Methodology
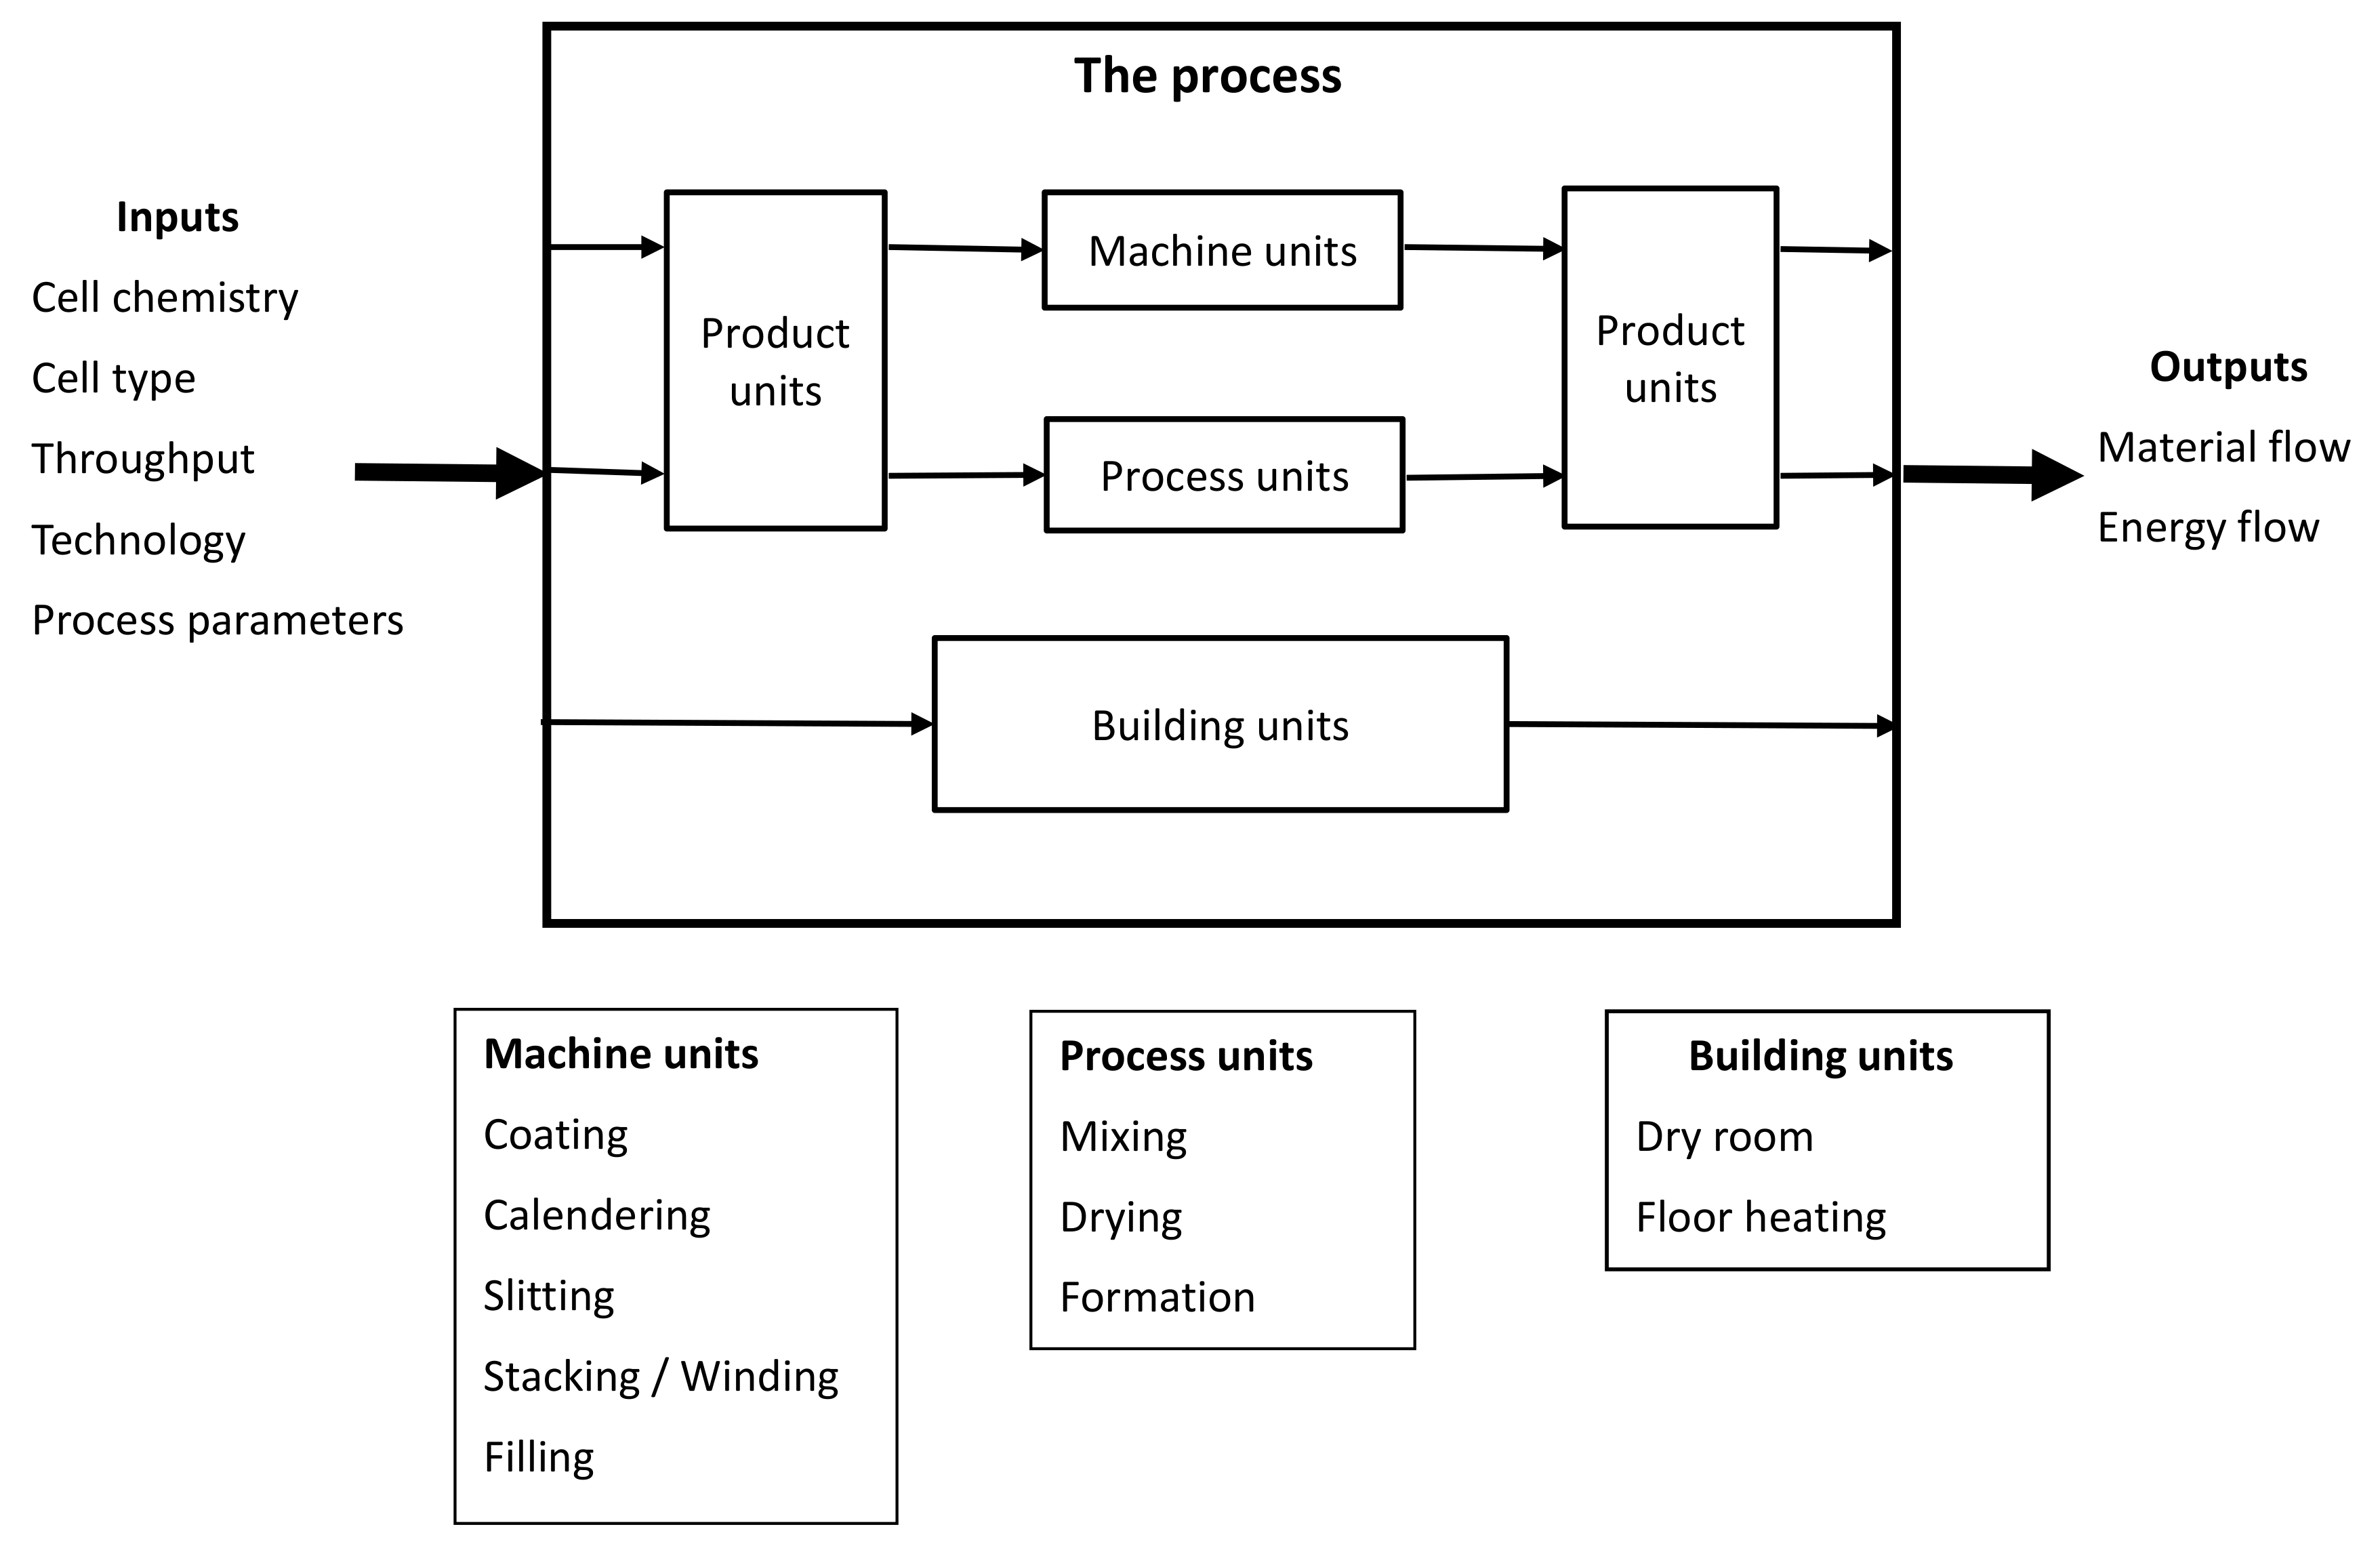
2.1. Model Structure and System Description
2.1.1. Inputs and Outputs
- LiMn2O4 (LMO)
- LiFePO4 (LFP)
- LiNi0.5Mn0.3Co0.2O2 (NMC532)
- LiNi0.6Mn0.2Co0.2O2 (NMC622)
- LiNi0.8Mn0.1Co0.1O2 (NMC811)
- LiNi0.3Mn0.3Co0.3O2 (NMC333 or NMC111)
- LiNi0.8Co0.15Al0.05O2 (NCA)
- Graphite or hard carbon (G)
- Li4Ti5O12 (LTO)
- Silicon (Si)
2.1.2. Product Units
2.1.3. Machine Units
2.1.4. Process Units
Mixing
Drying
Formation
2.1.5. Building Units
Dry Room
Floor Heating
2.1.6. Tuning Parameters
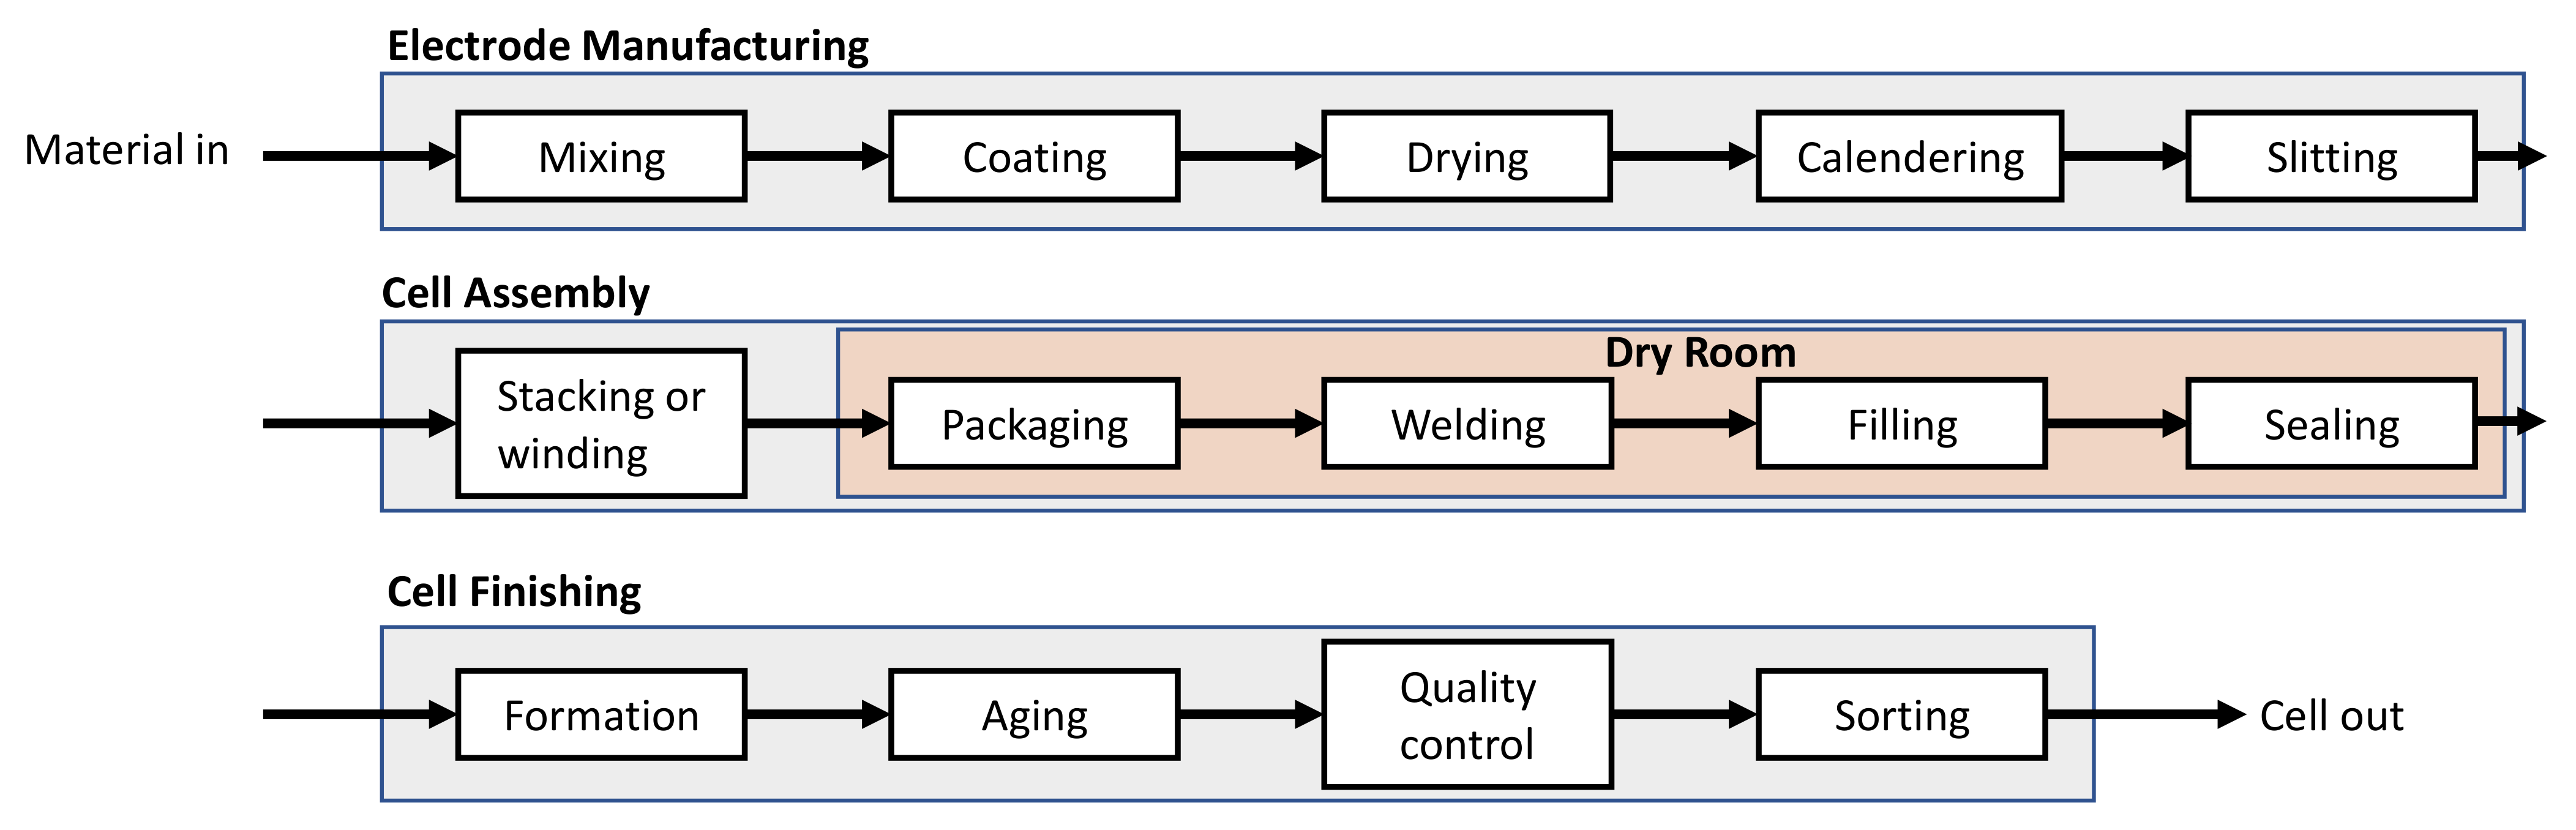
2.2. Detailed Process Description and Operating Parameters
2.2.1. Mixing
2.2.2. Coating
2.2.3. Drying
2.2.4. Calendering
2.2.5. Slitting
2.2.6. Stacking or Winding
2.2.7. Packing
2.2.8. Electrolyte Filling and Final Sealing
2.2.9. Formation and Aging
2.2.10. Quality Control and Sorting
2.2.11. Additional Systems and Utilities
3. Results and Discussion
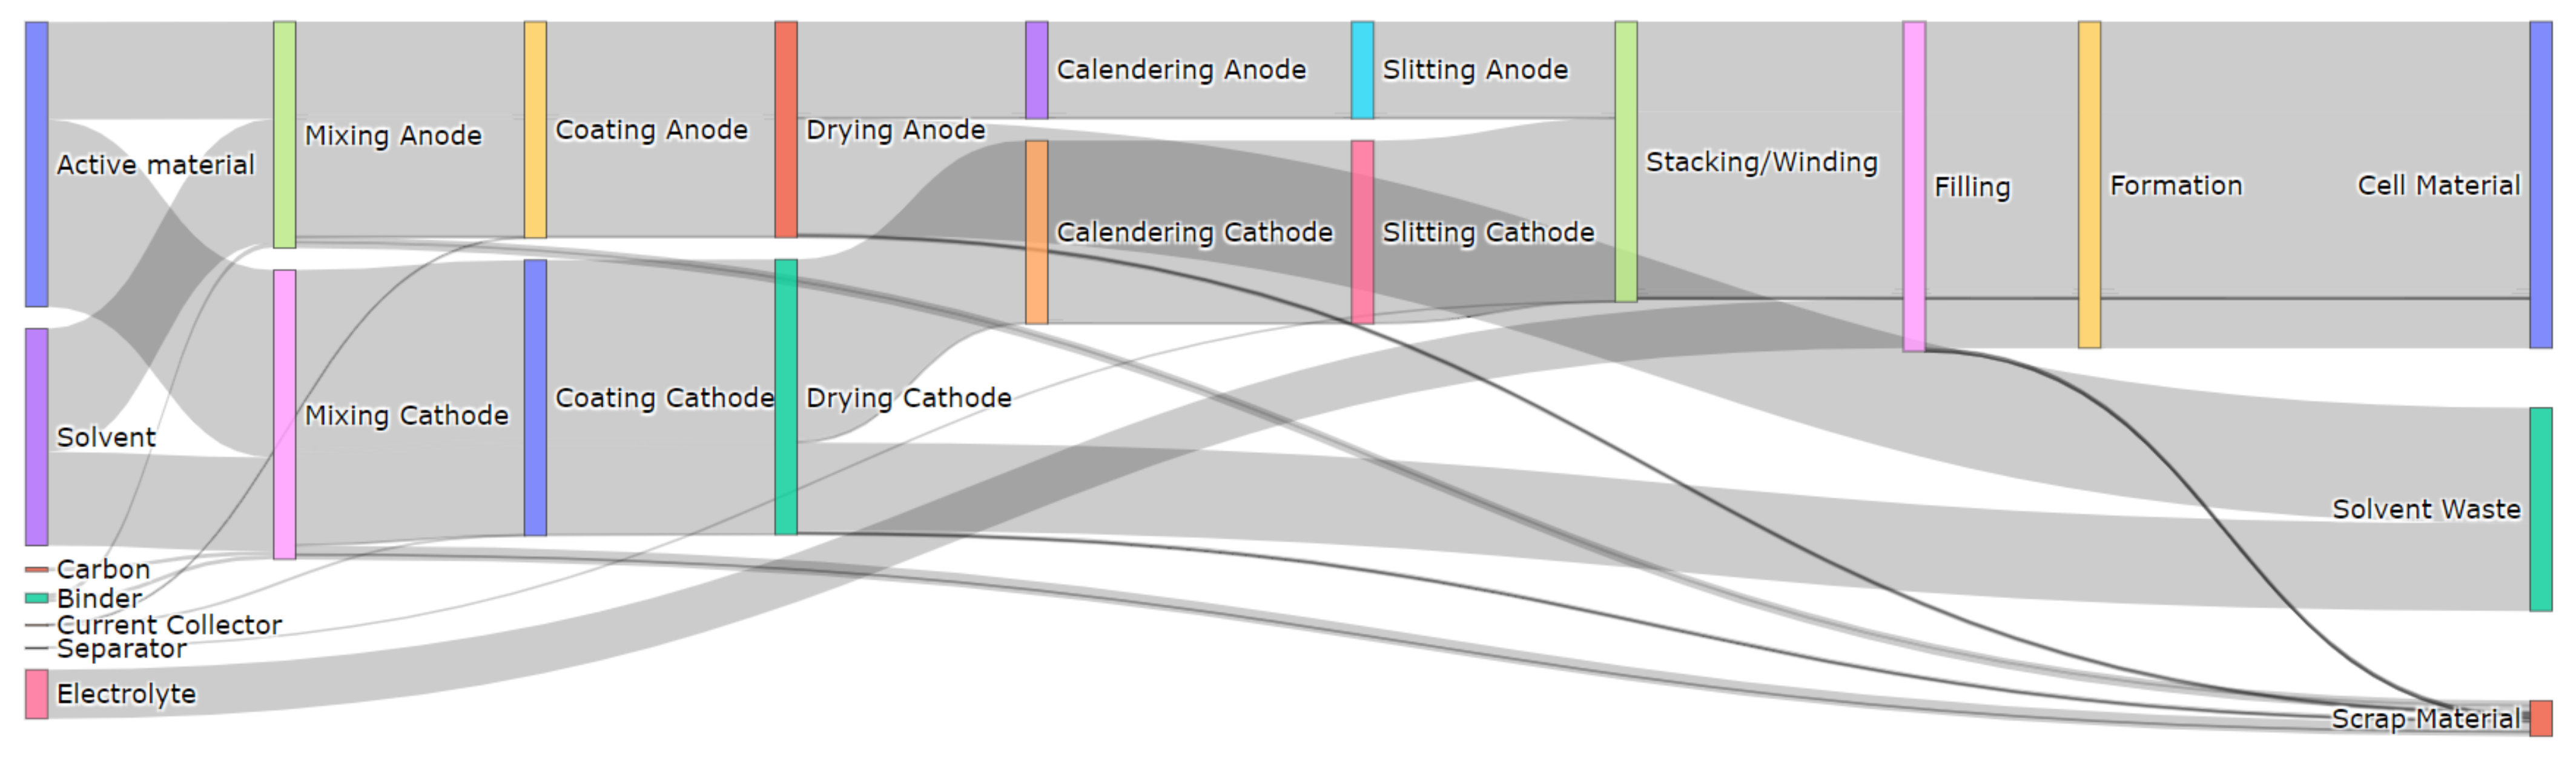
3.1. A Typical Material Flow for the Cell Production
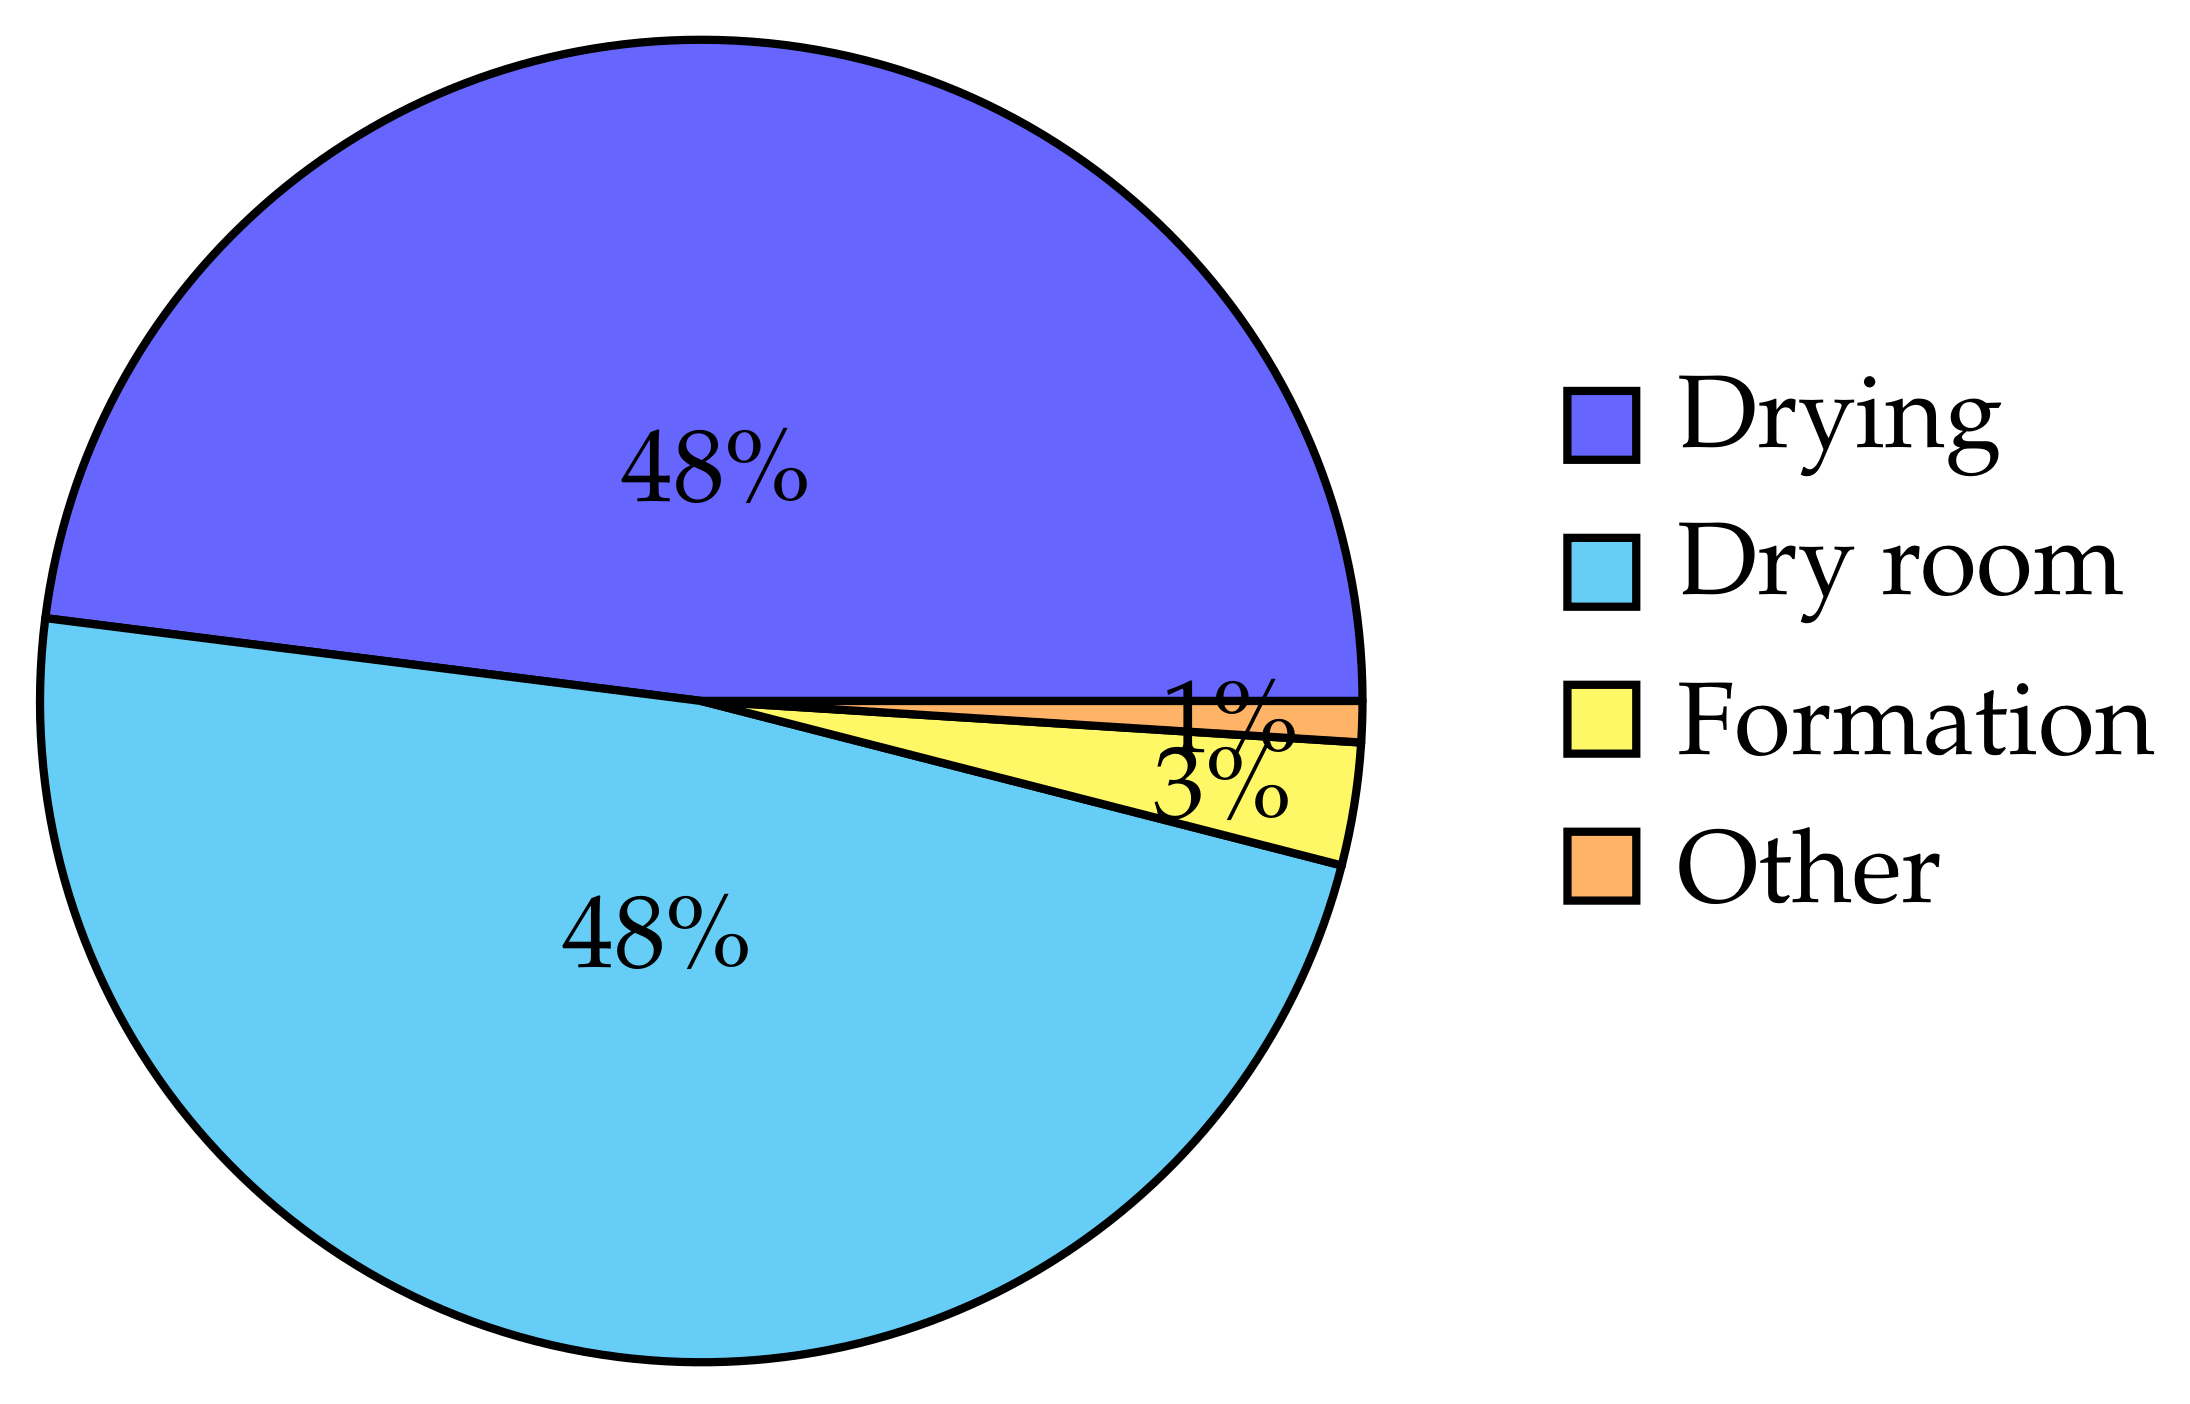
3.2. A Typical Energy Flow for the Cell Production
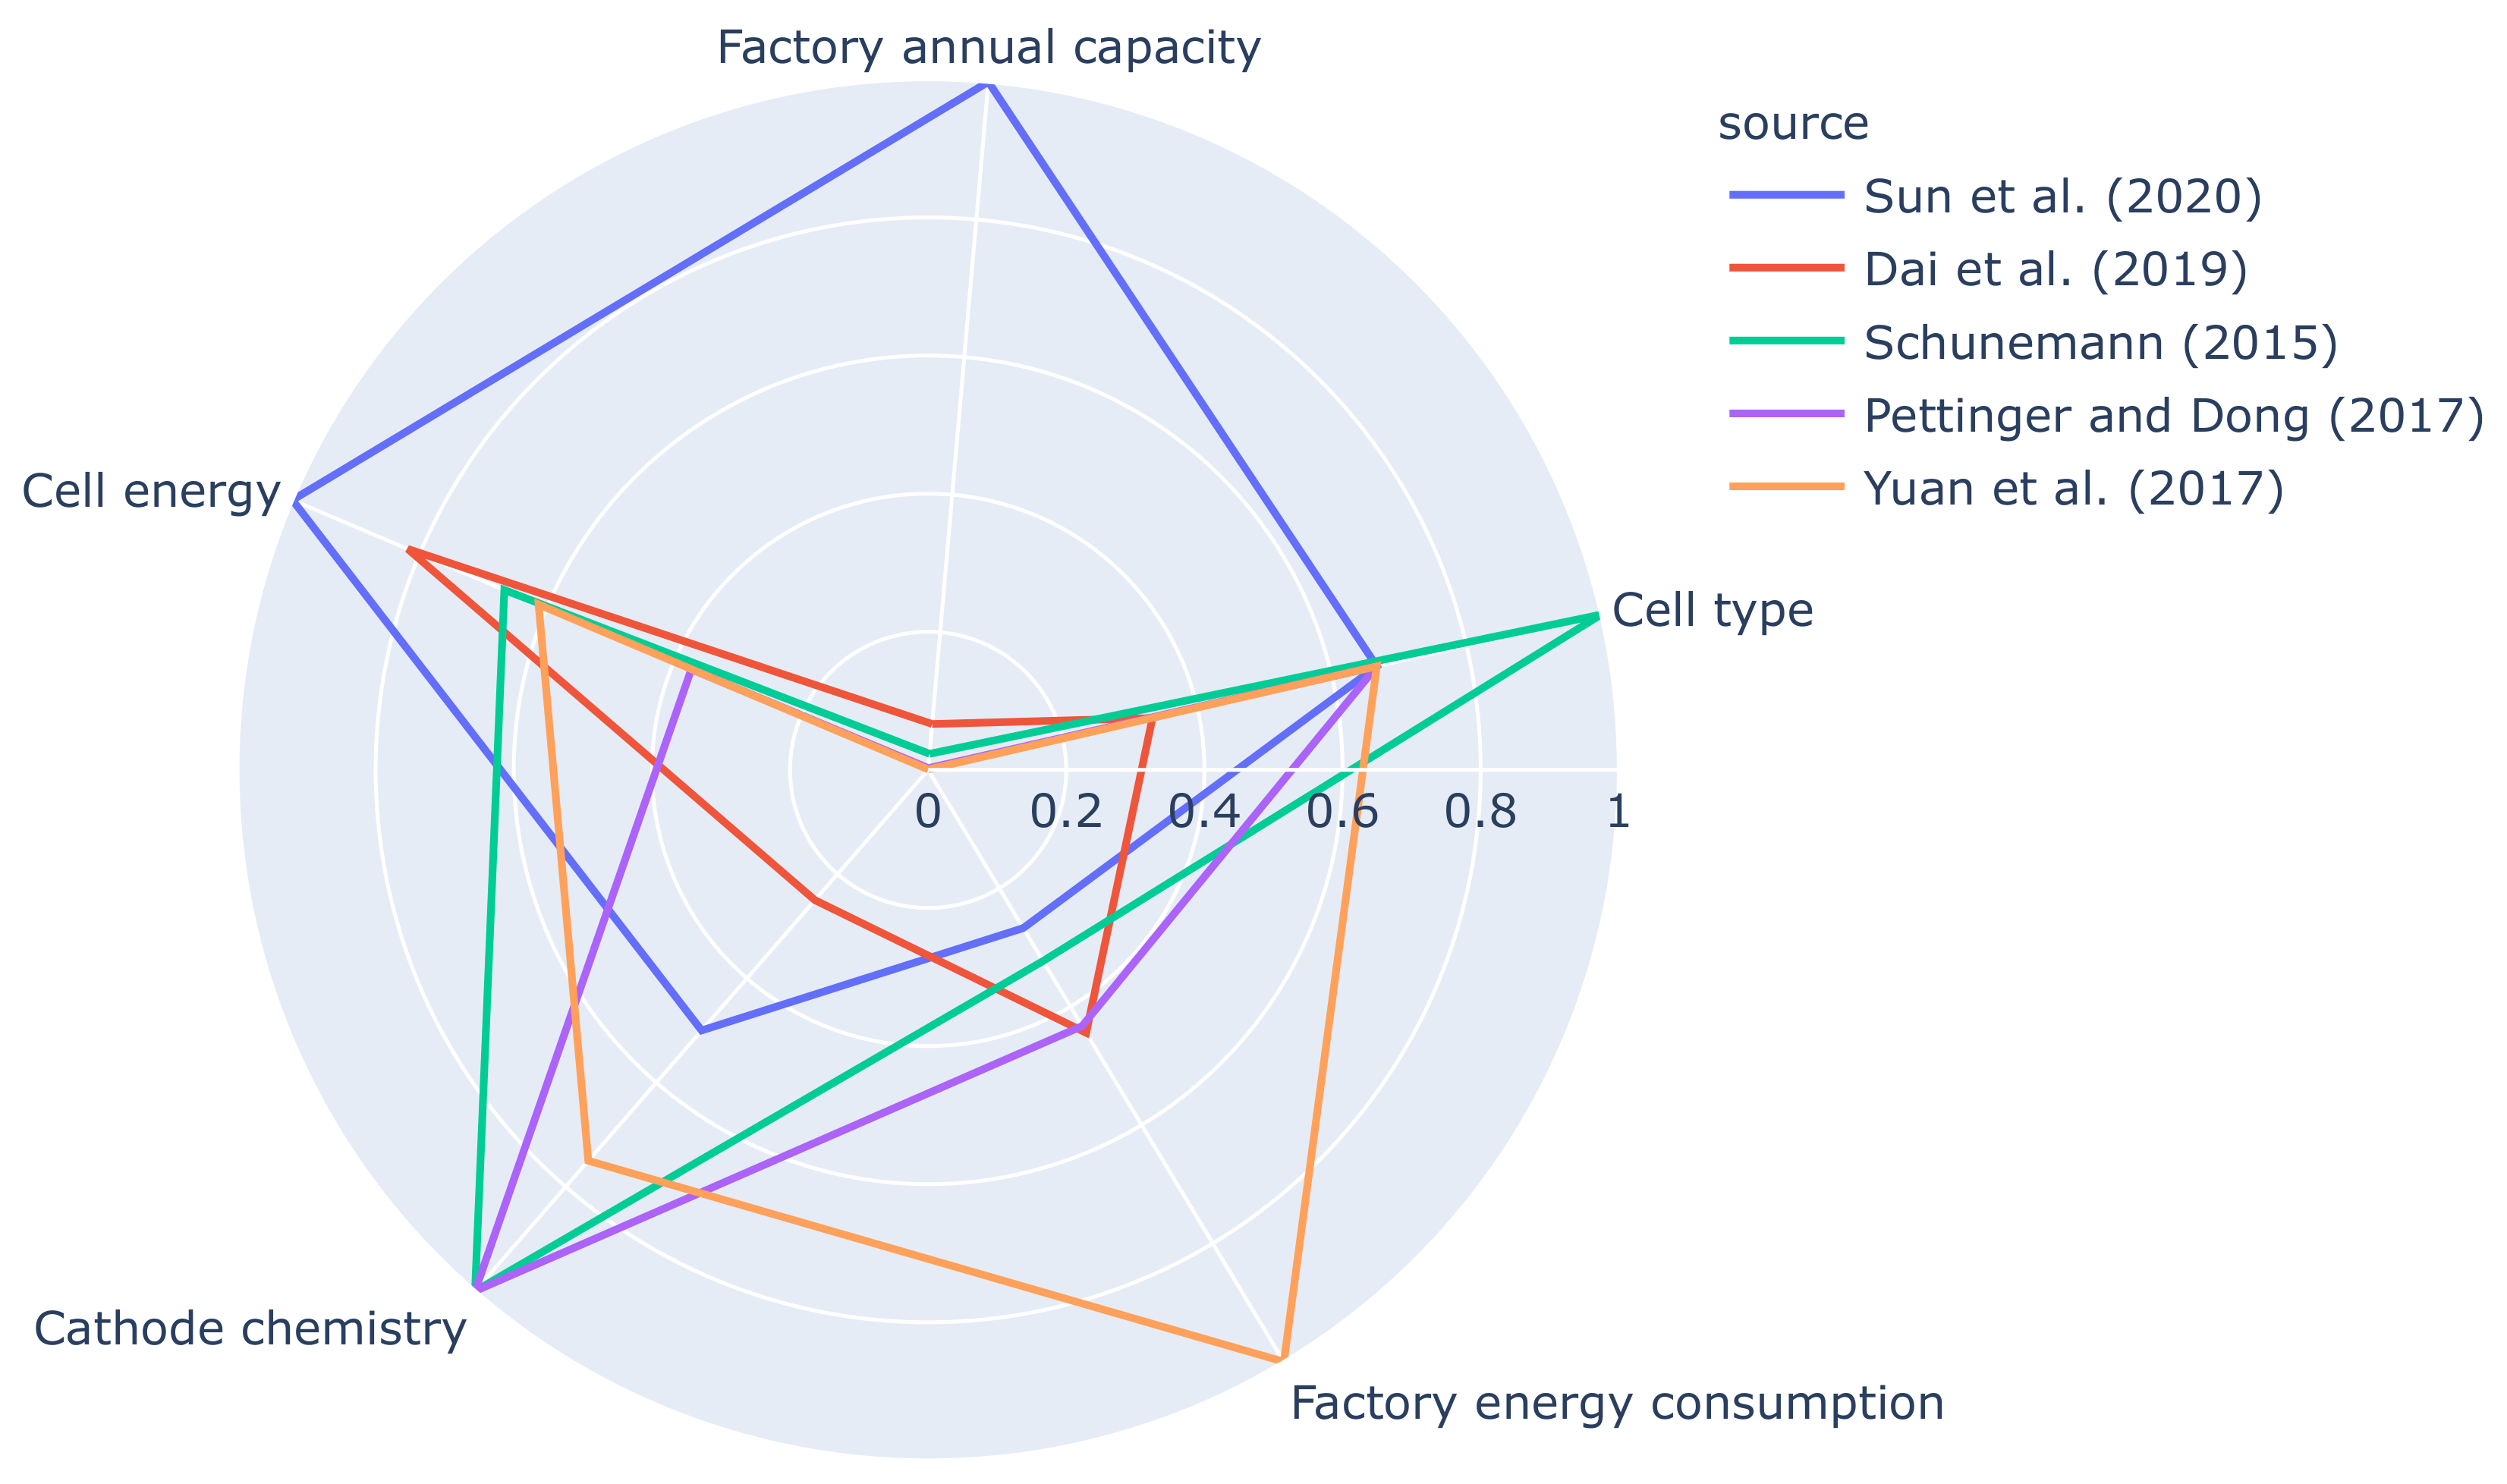
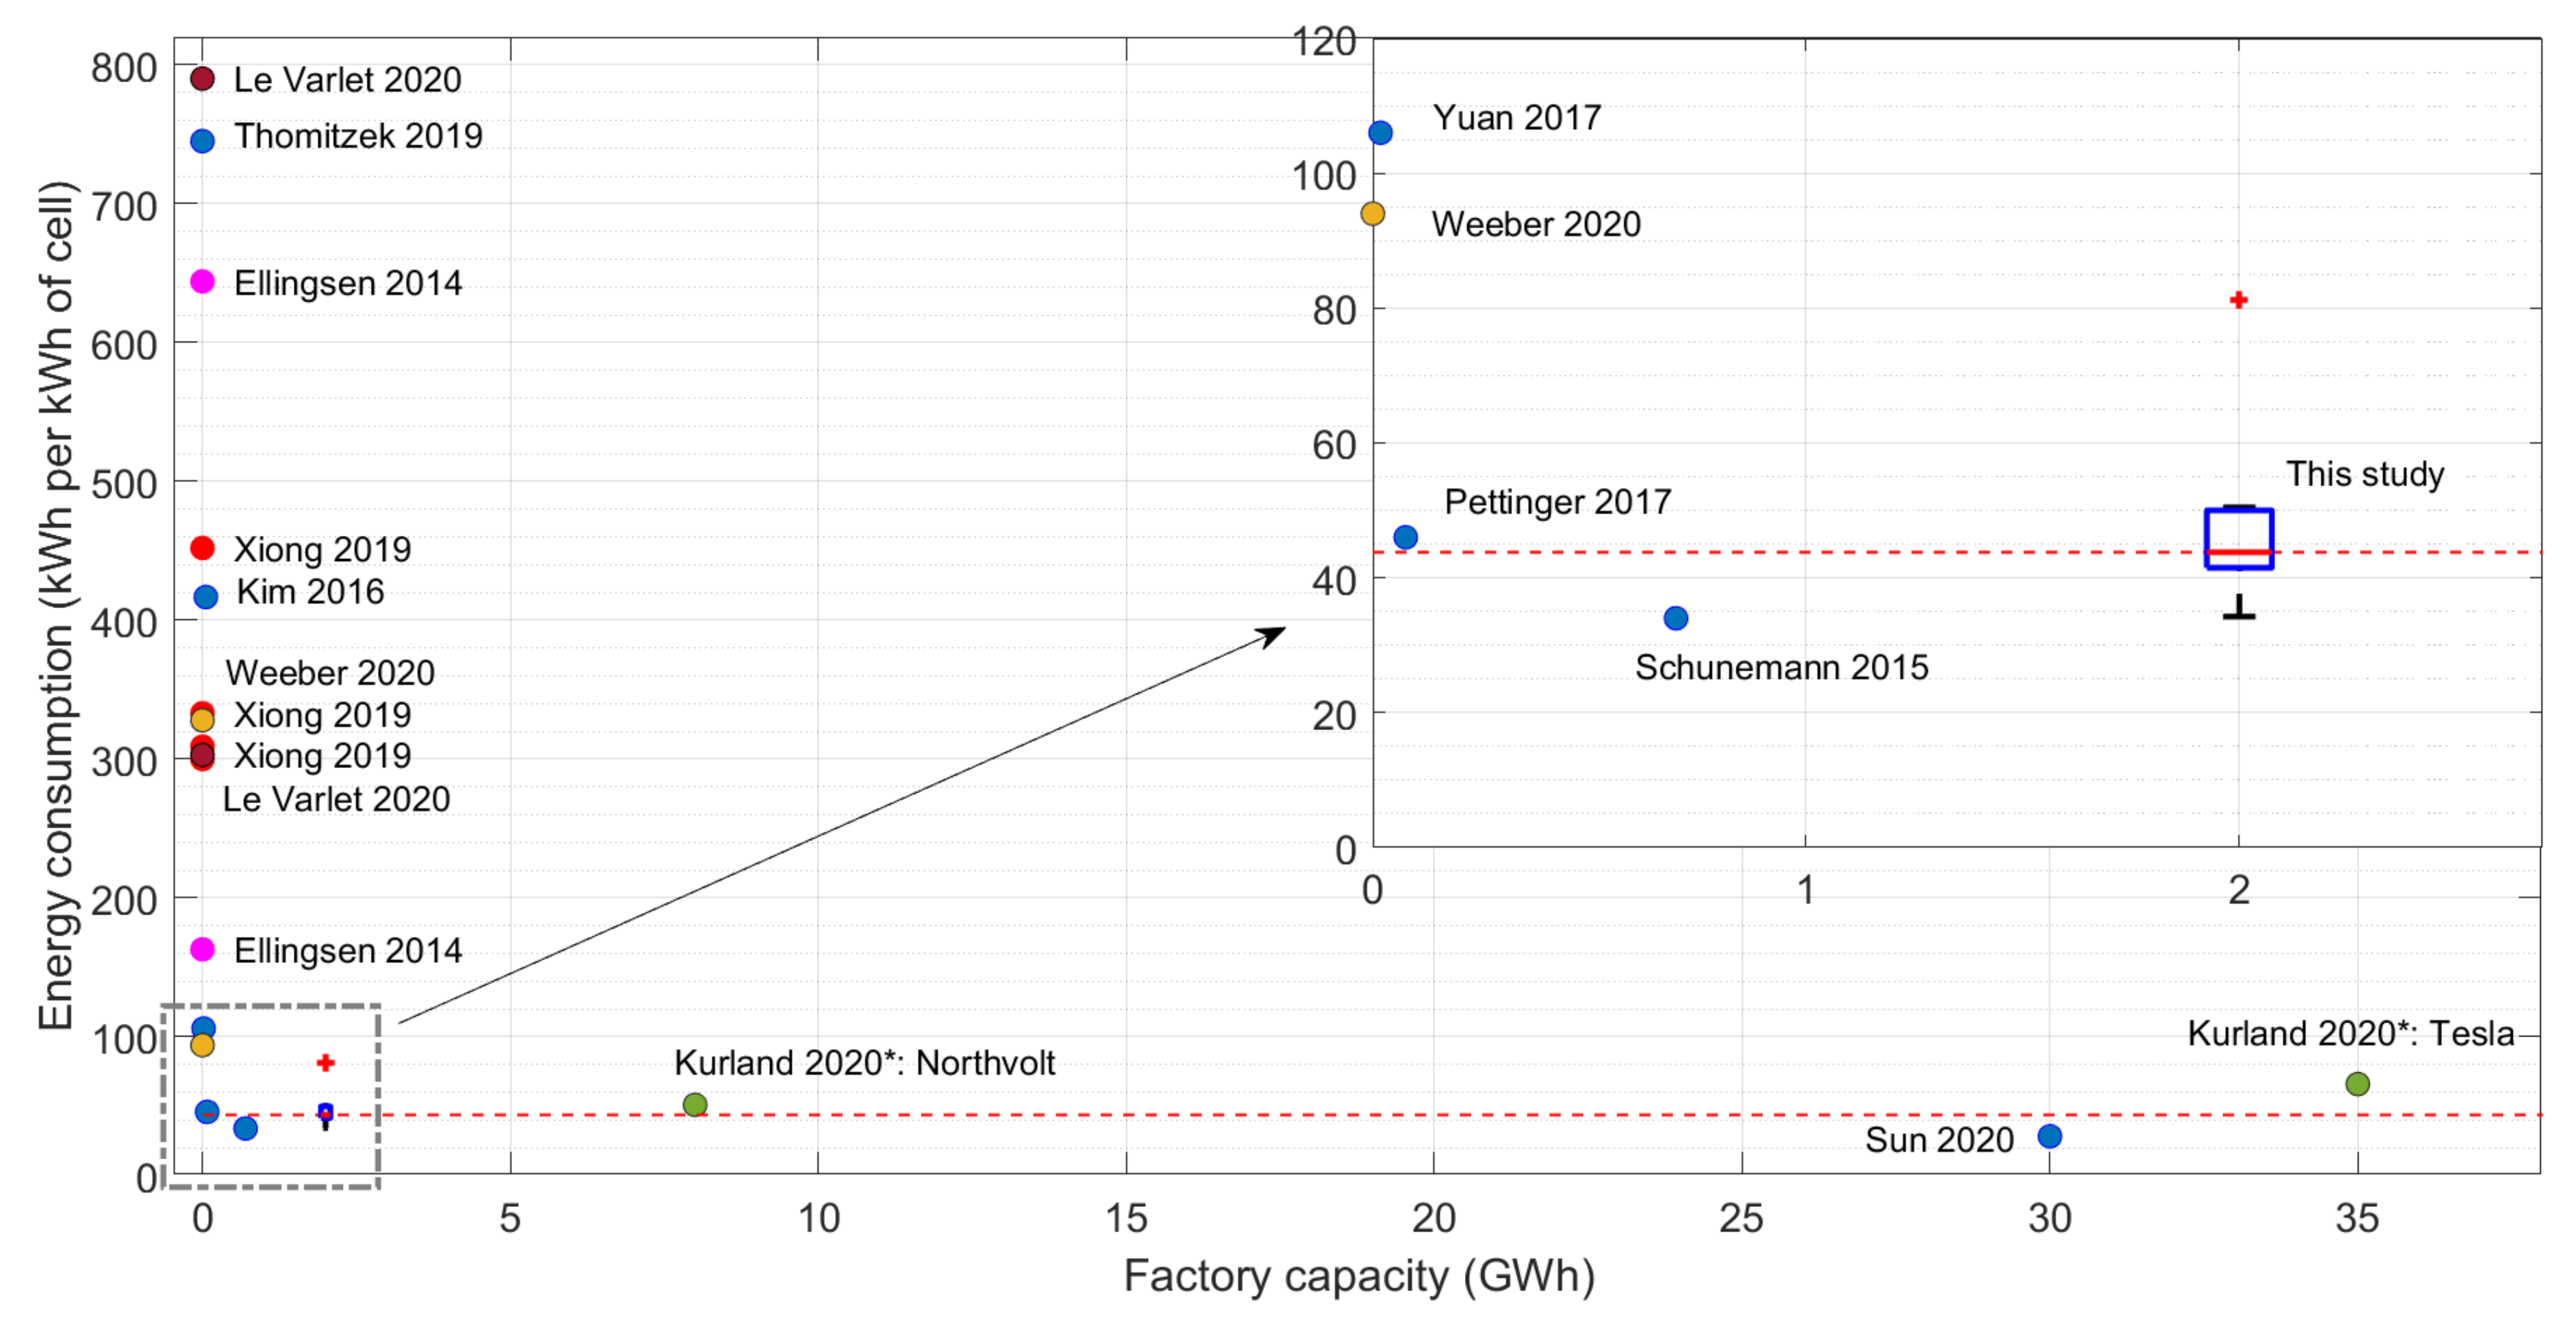
3.3. Comparison of the Case Study Results with the Available Literature Values
3.4. Sensitivity Analysis
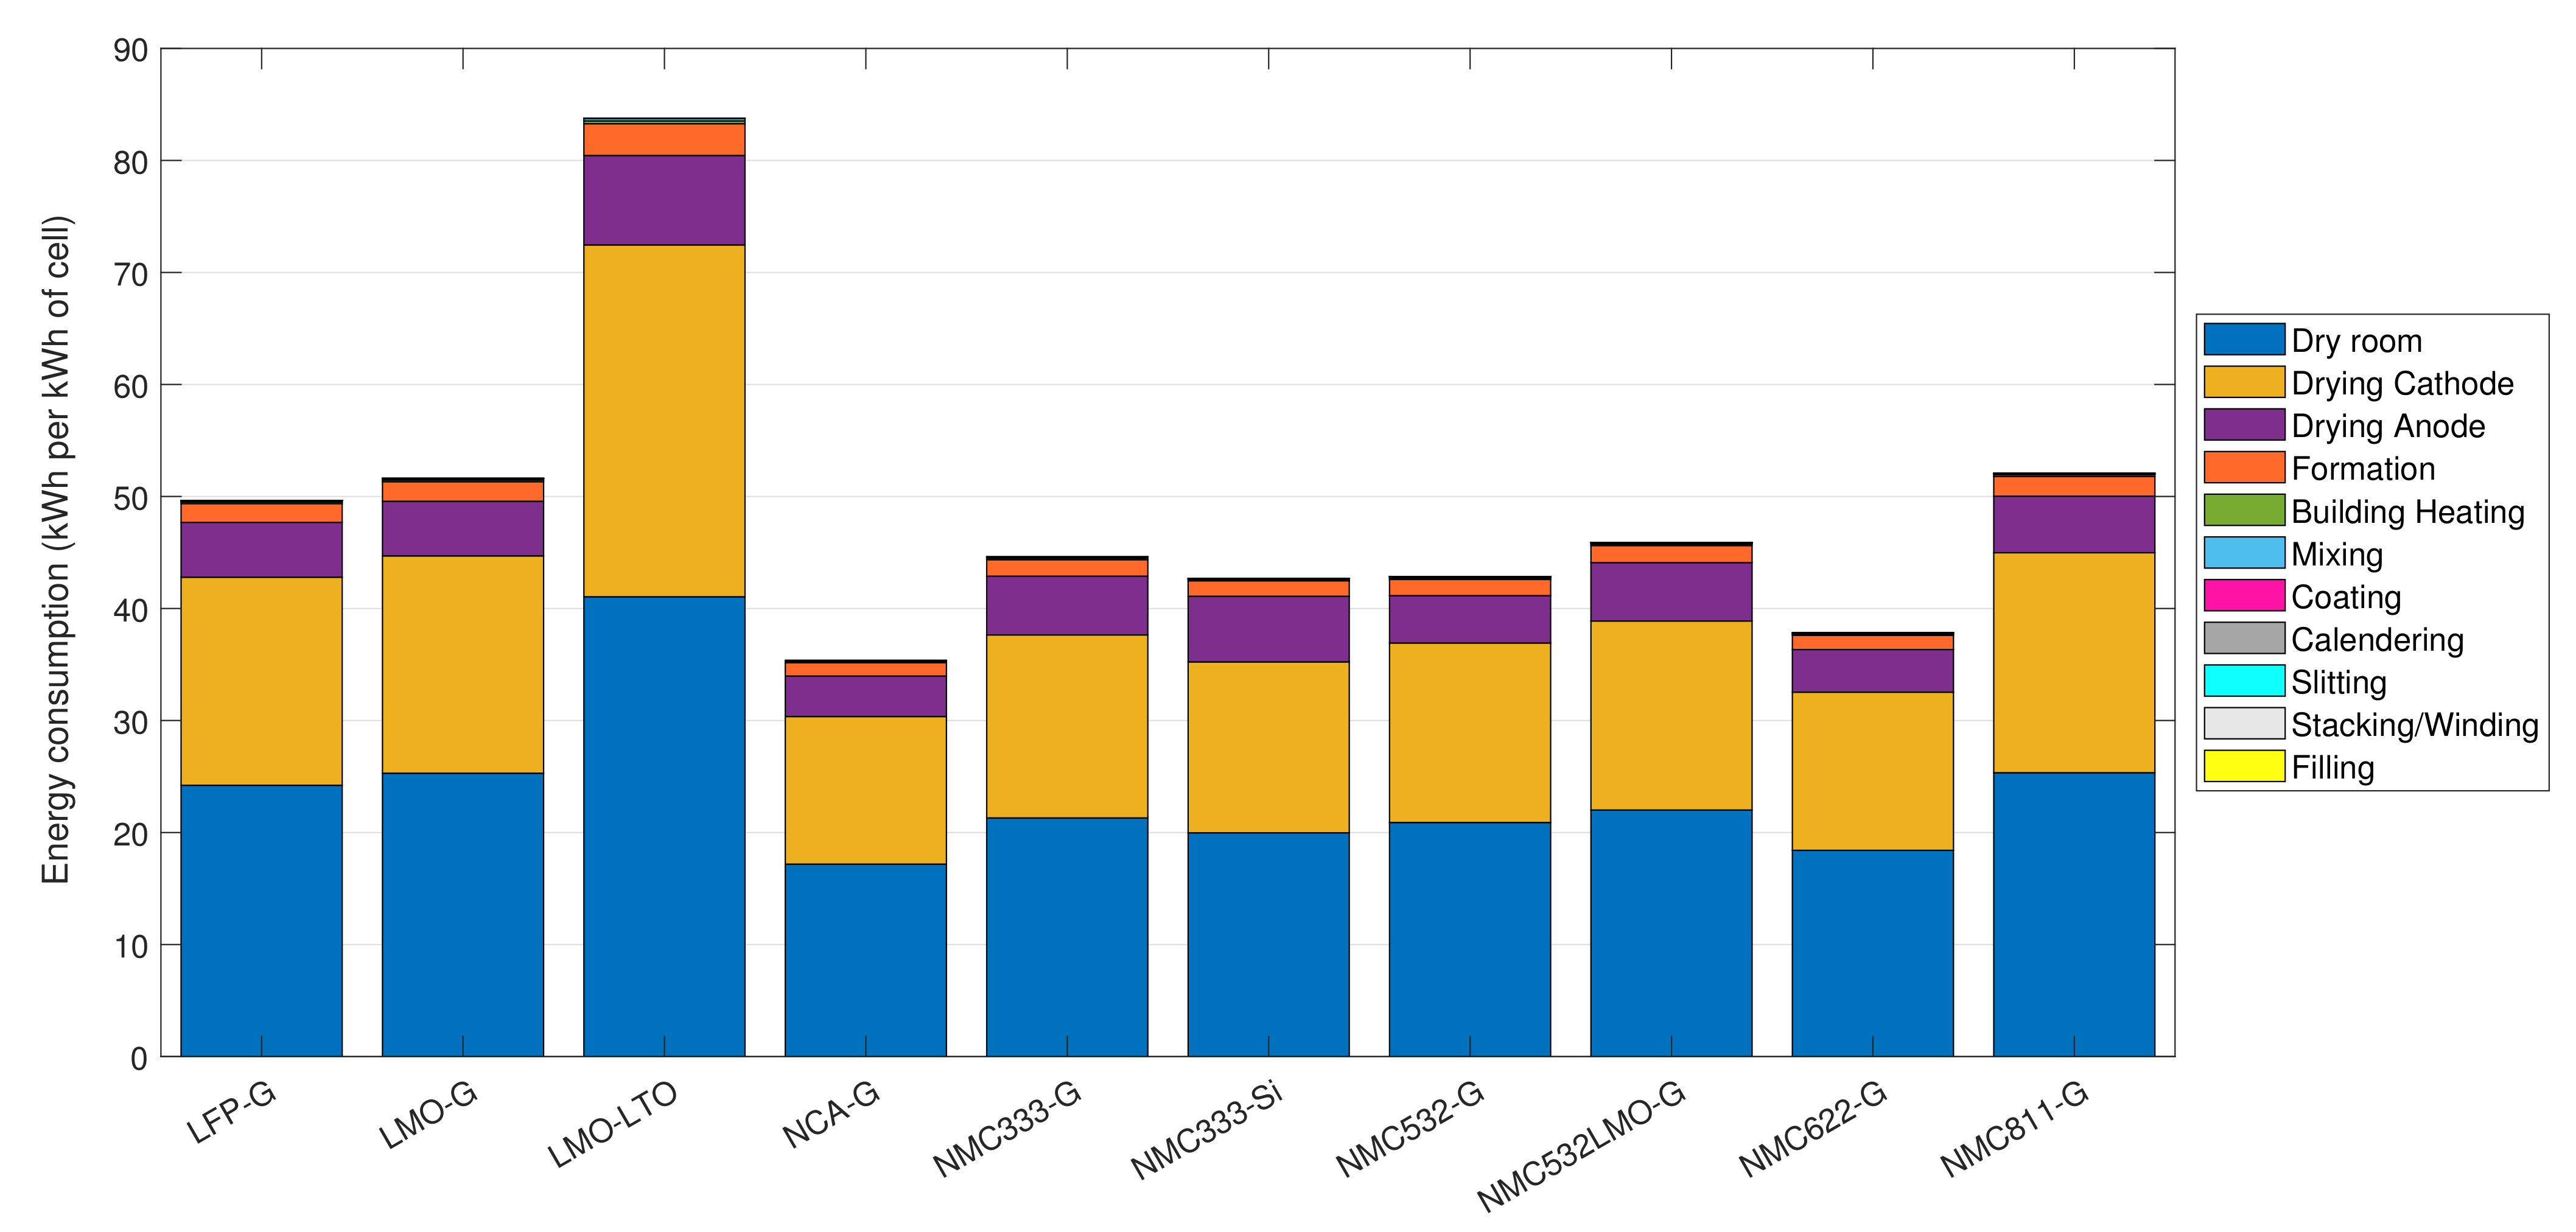
3.4.1. Influence of Cell Chemistry on the Energy Usage
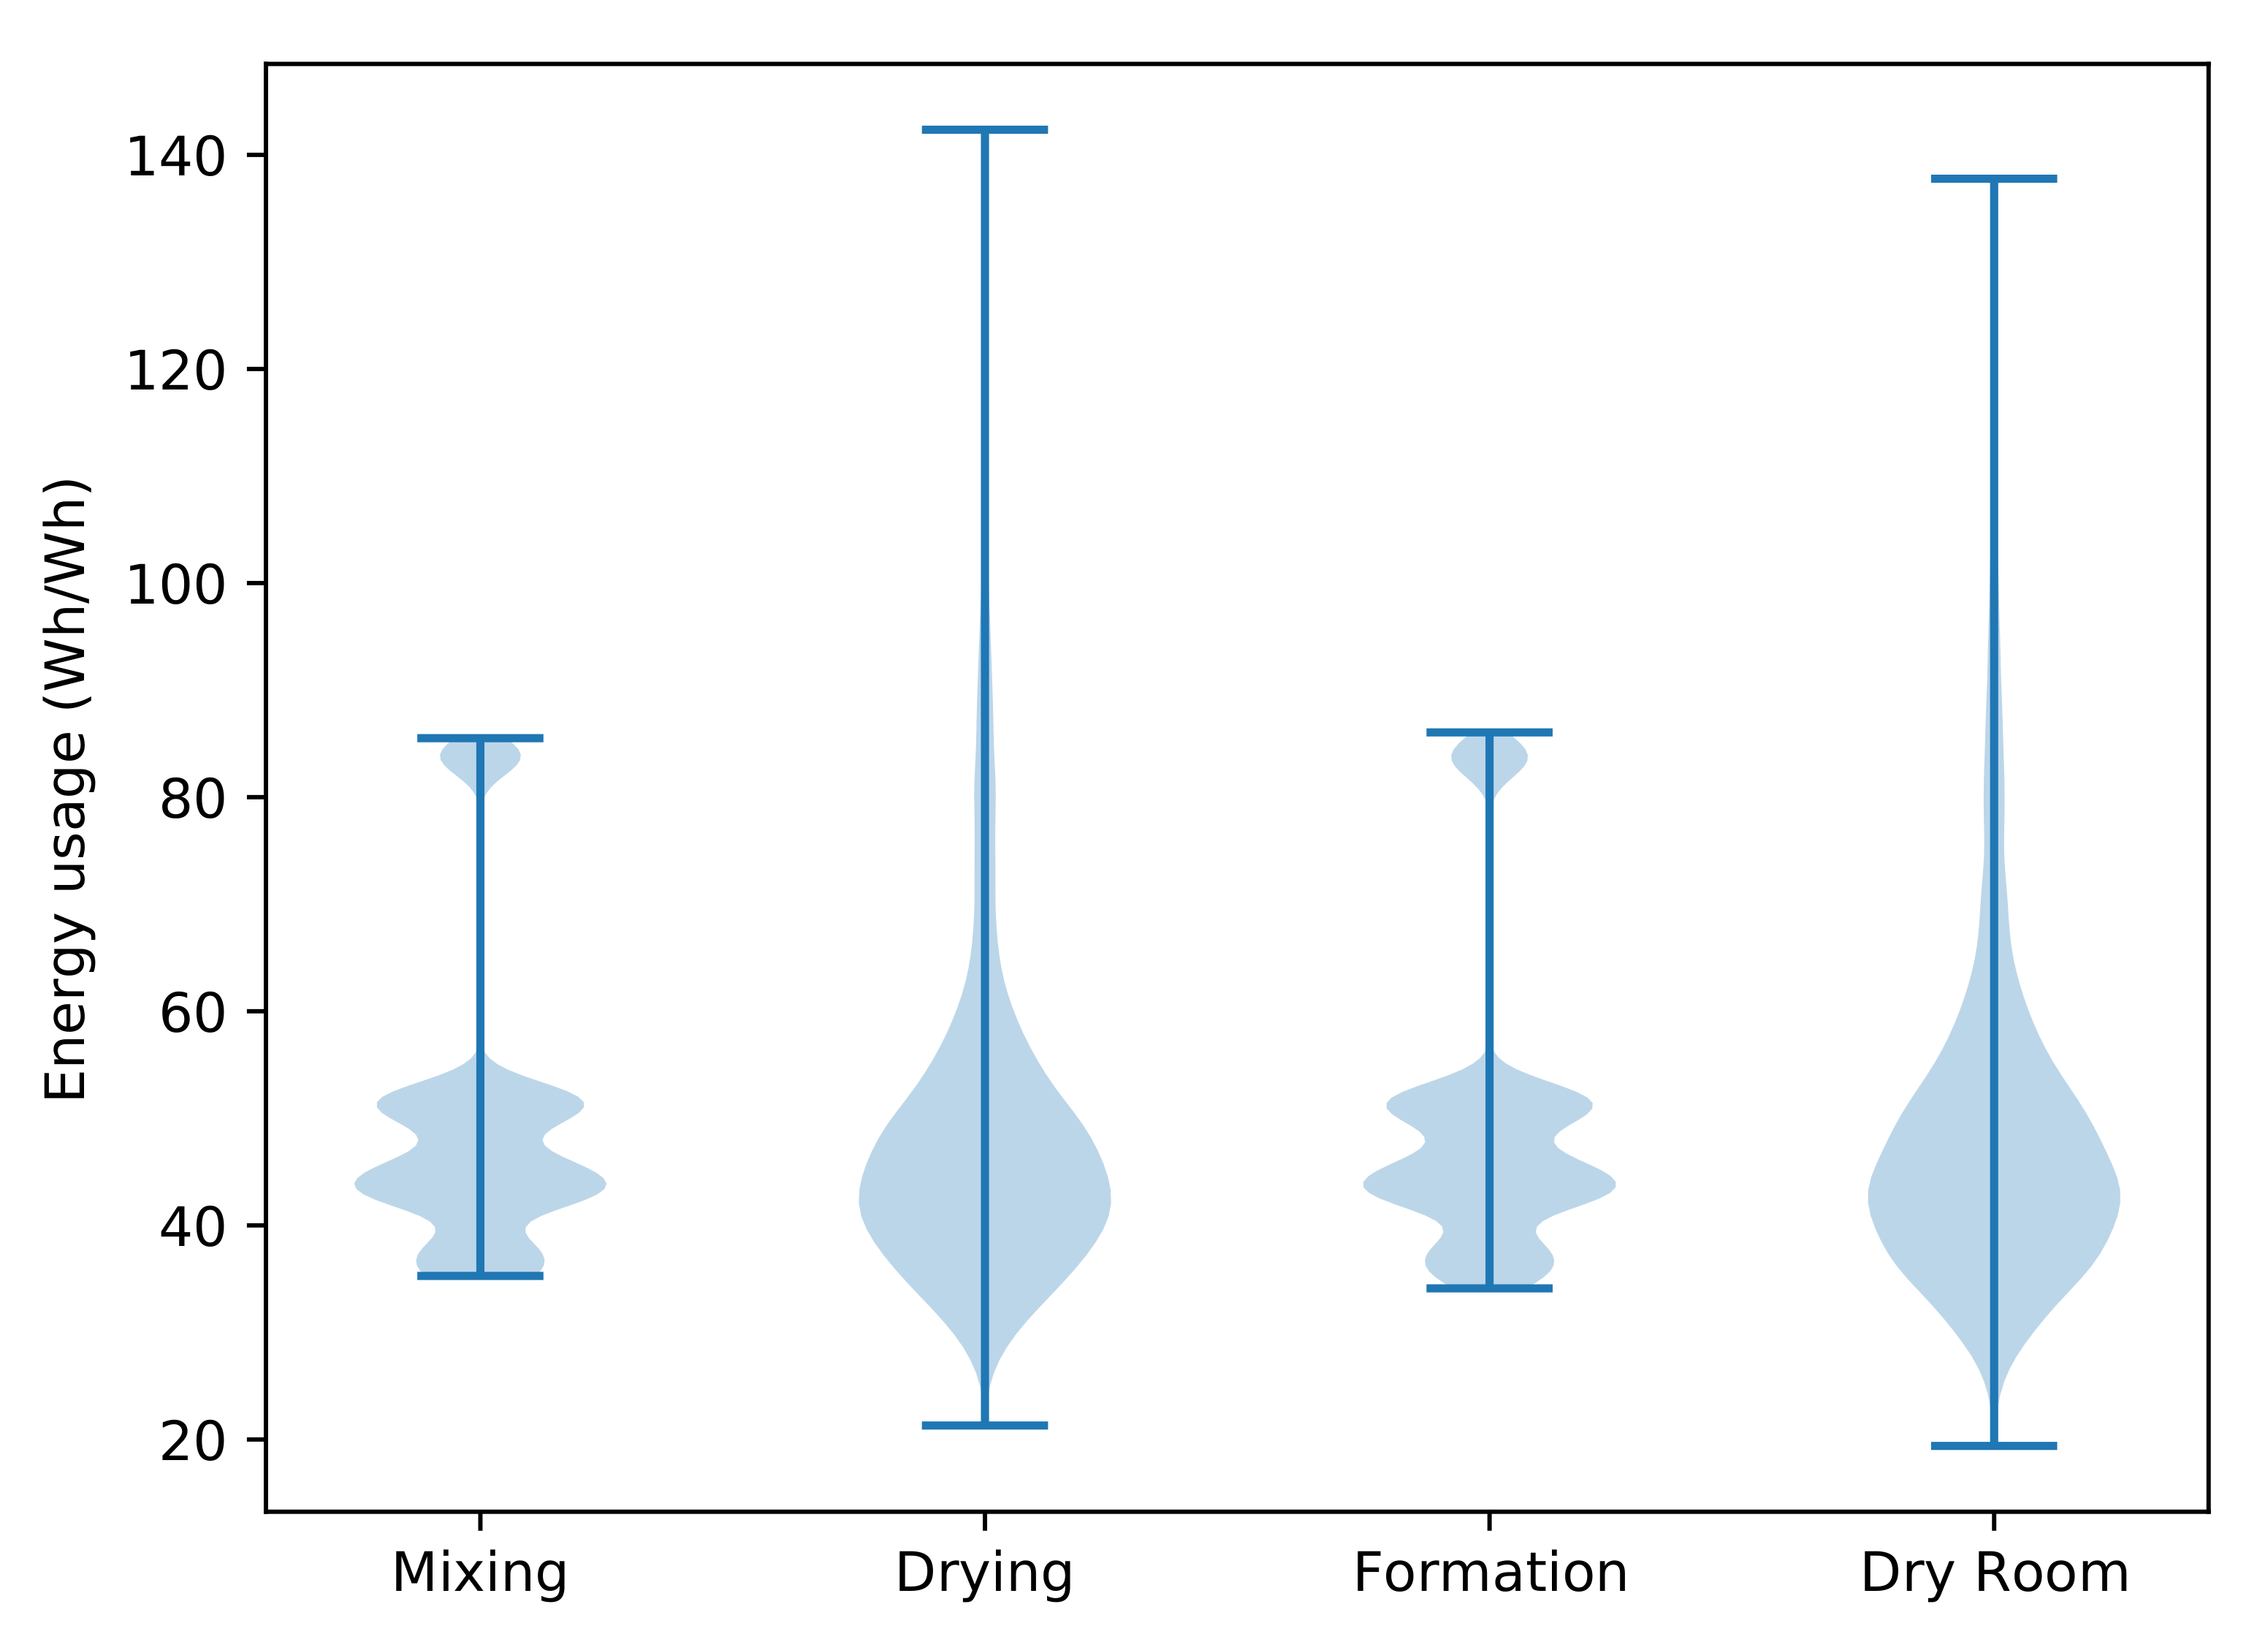
3.4.2. Influence of the Process Parameters on the Energy Usage
3.5. Limitations
4. Conclusions
Author Contributions
Funding
Institutional Review Board Statement
Informed Consent Statement
Data Availability Statement
Acknowledgments
Conflicts of Interest
Abbreviations
| BEV | Battery Electric Vehicle |
| EV | Electric Vehicle |
| G | Graphite |
| GWP | Global Warming Potential |
| LCA | Life-Cycle Assessment |
| LFP | Lithium iron phosphate (LiFePO4) |
| LMO | LiMn2O4 |
| LTO | Li4Ti5O12 |
| NCA | LiNi0.8Co0.15Al0.05O2 |
| NCO | Lithium nickel cobalt oxides |
| NMC | Lithium nickel manganese cobalt oxides |
| NMC532 | LiNi0.5Mn0.3Co0.2O2 |
| NMC622 | LiNi0.6Mn0.2Co0.2O2 |
| NMC811 | LiNi0.8Mn0.1Co0.1O2 |
| NMC333 or NMC111 | LiNi0.3Mn0.3Co0.3O2 |
| NMP | N-Methyl-2-Pyrrolidone |
| PHEV | Plug-In Hybrid Electric Vehicle |
| SEI | Solid Electrolyte Interface |
| Si | Silicon |
References
- International Energy Agency. Global EV Outlook 2020: Entering the Decade of Electric Drive; Technical Report; International Energy Agency: Paris, France, 2020. [Google Scholar] [CrossRef]
- Korthauer, R. Lithium-Ion Batteries: Basics and Applications; Springer: Berlin, Germany, 2018; pp. 1–413. [Google Scholar] [CrossRef]
- Kallitsis, E.; Korre, A.; Kelsall, G.; Kupfersberger, M.; Nie, Z. Environmental life cycle assessment of the production in China of lithium-ion batteries with nickel-cobalt-manganese cathodes utilising novel electrode chemistries. J. Clean. Prod. 2020, 254, 120067. [Google Scholar] [CrossRef]
- Notter, D.A.; Gauch, M.; Widmer, R.; Wäger, P.; Stamp, A.; Zah, R.; Althaus, H.J. Contribution of Li-ion batteries to the environmental impact of electric vehicles. Environ. Sci. Technol. 2010, 44, 6550–6556. [Google Scholar] [CrossRef] [PubMed]
- Ellingsen, L.A.W.; Majeau-Bettez, G.; Singh, B.; Srivastava, A.K.; Valøen, L.O.; Strømman, A.H. Life Cycle Assessment of a Lithium-Ion Battery Vehicle Pack. J. Ind. Ecol. 2014, 18, 113–124. [Google Scholar] [CrossRef]
- Weeber, M.; Wanner, J.; Schlegel, P.; Birke, K.P.; Sauer, A. Methodology for the Simulation based Energy Efficiency Assessment of Battery Cell Manufacturing Systems. Procedia Manuf. 2020, 43, 32–39. [Google Scholar] [CrossRef]
- Sun, X.; Luo, X.; Zhang, Z.; Meng, F.; Yang, J. Life cycle assessment of lithium nickel cobalt manganese oxide (NCM) batteries for electric passenger vehicles. J. Clean. Prod. 2020, 273, 123006. [Google Scholar] [CrossRef]
- Thomitzek, M.; Von Drachenfels, N.; Cerdas, F.; Herrmann, C.; Thiede, S. Simulation-based assessment of the energy demand in battery cell manufacturing. Procedia CIRP 2019, 80, 126–131. [Google Scholar] [CrossRef]
- Kurland, S.D. Energy use for GWh-scale lithium-ion battery production. Environ. Res. Commun. 2020, 2, 012001. [Google Scholar] [CrossRef]
- Philippot, M.; Alvarez, G.; Ayerbe, E.; Mierlo, J.V.; Messagie, M. Eco-efficiency of a lithium-ion battery for electric vehicles: Influence of manufacturing country and commodity prices on ghg emissions and costs. Batteries 2019, 5, 23. [Google Scholar] [CrossRef]
- Dai, Q.; Kelly, J.C.; Gaines, L.; Wang, M. Life cycle analysis of lithium-ion batteries for automotive applications. Batteries 2019, 5, 48. [Google Scholar] [CrossRef]
- Schünemann, J.H. Modell zur Bewertung der Herstellkosten von Lithiumionenbatteriezellen, 1st ed.; Sierke: Braunschweig, Germany, 2015; p. 208. [Google Scholar]
- Pettinger, K.H.; Dong, W. When does the operation of a battery become environmentally positive? J. Electrochem. Soc. 2017, 164, A6274–A6277. [Google Scholar] [CrossRef]
- Yuan, C.; Deng, Y.; Li, T.; Yang, F. Manufacturing energy analysis of lithium ion battery pack for electric vehicles. CIRP Ann. Manuf. Technol. 2017, 66, 53–56. [Google Scholar] [CrossRef]
- Kremer, L.S.; Hoffmann, A.; Danner, T.; Hein, S.; Prifling, B.; Westhoff, D.; Dreer, C.; Latz, A.; Schmidt, V.; Wohlfahrt-Mehrens, M. Manufacturing Process for Improved Ultra-Thick Cathodes in High-Energy Lithium-Ion Batteries. Energy Technol. 2019, 8, 1900167. [Google Scholar] [CrossRef]
- Bockholt, H.; Haselrieder, W.; Kwade, A. Intensive Dry and Wet Mixing Influencing the Structural and Electrochemical Properties of Secondary Lithium-Ion Battery Cathodes. ECS Trans. 2013, 50, 25–35. [Google Scholar] [CrossRef]
- Lenze, G.; Bockholt, H.; Schilcher, C.; Froböse, L.; Jansen, D.; Krewer, U.; Kwade, A. Impacts of Variations in Manufacturing Parameters on Performance of Lithium-Ion-Batteries. J. Electrochem. Soc. 2018, 165, A314–A322. [Google Scholar] [CrossRef]
- Meyer, C.; Kosfeld, M.; Haselrieder, W.; Kwade, A. Process modeling of the electrode calendering of lithium-ion batteries regarding variation of cathode active materials and mass loadings. J. Energy Storage 2018, 18, 371–379. [Google Scholar] [CrossRef]
- Schreiner, D.; Oguntke, M.; Günther, T.; Reinhart, G. Modelling of the Calendering Process of NMC-622 Cathodes in Battery Production Analyzing Machine/Material–Process–Structure Correlations. Energy Technol. 2019, 7, 1900840. [Google Scholar] [CrossRef]
- Mayer, J.K.; Almar, L.; Asylbekov, E.; Haselrieder, W.; Kwade, A.; Weber, A.; Nirschl, H. Influence of the Carbon Black Dispersing Process on the Microstructure and Performance of Li-Ion Battery Cathodes. Energy Technol. 2020, 8, 1900161. [Google Scholar] [CrossRef]
- Cunha, R.P.; Lombardo, T.; Primo, E.N.; Franco, A.A. Artificial Intelligence Investigation of NMC Cathode Manufacturing Parameters Interdependencies. Batteries Supercaps 2020, 3, 60–67. [Google Scholar] [CrossRef]
- Thiede, S.; Turetskyy, A.; Kwade, A.; Kara, S.; Herrmann, C. Data mining in battery production chains towards multi-criterial quality prediction. CIRP Ann. 2019, 68, 463–466. [Google Scholar] [CrossRef]
- Komas, T.; Daub, R.; Karamat, M.Z.; Thiede, S.; Herrmann, C. Data-and expert-driven analysis of cause-effect relationships in the production of lithium-ion batteries. In Proceedings of the IEEE International Conference on Automation Science and Engineering, Vancouver, BC, Canada, 22–26 August 2019; pp. 380–385. [Google Scholar] [CrossRef]
- Chouchane, M.; Rucci, A.; Lombardo, T.; Ngandjong, A.C.; Franco, A.A. Lithium ion battery electrodes predicted from manufacturing simulations: Assessing the impact of the carbon-binder spatial location on the electrochemical performance. J. Power Sources 2019, 444, 227285. [Google Scholar] [CrossRef]
- Schneider, S.F.; Bauer, C.; Novák, P.; Berg, E.J. A modeling framework to assess specific energy, costs and environmental impacts of Li-ion and Na-ion batteries. Sustain. Energy Fuels 2019, 3, 3061–3070. [Google Scholar] [CrossRef]
- Ahmed, S.; Nelson, P.A.; Gallagher, K.G.; Dees, D.W. Energy impact of cathode drying and solvent recovery during lithium-ion battery manufacturing. J. Power Sources 2016, 322, 169–178. [Google Scholar] [CrossRef]
- Oppegård, E.; Jinasena, A.; Strømman, A.H.; Suul, J.A.; Burheim, O.S. Study of an Industrial Electrode Dryer of a Lithium-Ion Battery Manufacturing Plant: Dynamic Modeling. In Proceedings of the 61st Conference on Modelling and Simulation (SIMS 61); Linköping University Electronic Press: Oulu, Finland, 2020; in press. [Google Scholar]
- Herrmann, C.; Thiede, S. Process chain simulation to foster energy efficiency in manufacturing. CIRP J. Manuf. Sci. Technol. 2009, 1, 221–229. [Google Scholar] [CrossRef]
- Alvandi, S.; Bienert, G.; Li, W.; Kara, S. Hierarchical modelling of complex material and energy flow in manufacturing systems. Procedia CIRP 2015, 29, 92–97. [Google Scholar] [CrossRef]
- Schönemann, M.; Bockholt, H.; Thiede, S.; Kwade, A.; Herrmann, C. Multiscale simulation approach for production systems. Int. J. Adv. Manuf. Technol. 2019, 102, 1373–1390. [Google Scholar] [CrossRef]
- Thomitzek, M.; Schmidt, O.; Röder, F.; Krewer, U.; Herrmann, C.; Thiede, S. Simulating Process-Product Interdependencies in Battery Production Systems. Procedia CIRP 2018, 72, 346–351. [Google Scholar] [CrossRef]
- Schmidt, O.; Thomitzek, M.; Röder, F.; Thiede, S. Modeling the impact of manufacturing uncertainties on lithium-ion batteries. J. Electrochem. Soc. 2020, 167, 1–15. [Google Scholar] [CrossRef]
- Miao, Y.; Hynan, P.; Von Jouanne, A.; Yokochi, A. Current li-ion battery technologies in electric vehicles and opportunities for advancements. Energies 2019, 12, 1074. [Google Scholar] [CrossRef]
- Hawley, W.B.; Li, J. Electrode manufacturing for lithium-ion batteries—Analysis of current and next generation processing. J. Energy Storage 2019, 25, 100862. [Google Scholar] [CrossRef]
- Li, B.; Gao, X.; Li, J.; Yuan, C. Life cycle environmental impact of high-capacity lithium ion battery with silicon nanowires anode for electric vehicles. Environ. Sci. Technol. 2014, 48, 3047–3055. [Google Scholar] [CrossRef]
- Nelson, P.A.; Ahmed, S.; Gallagher, K.G.; Dees, D.W. Cost savings for manufacturing lithium batteries in a flexible plant. J. Power Sources 2015, 283, 506–516. [Google Scholar] [CrossRef]
- Coulson, J.M.; Richardson, J.F.; Backhurst, J.R.; Harker, J.H. Chemical Engineering Volume 1: Fluid Flow, Heat Transfer and Mass Transfer, 6th ed.; Butterworth-Heinemann: Oxford, UK, 1999; p. 895. [Google Scholar]
- Richardson, J.F.; Harker, J.H.; Backhurst, J.R. Chemical Engineering Volume 2: Particle Technology and Separation Processes, 5th ed.; Butterworth-Heinemann: Oxford, UK, 2002; p. 1183. [Google Scholar]
- ISO 14644-1:2015. Cleanrooms and Associated Controlled Environments—Part 1: Classification of Air Cleanliness by Particle Concentration; Standard ISO 14644-1:2015(E); International Organization for Standardization: Geneva, Switzerland, 2015. [Google Scholar]
- Sinnott, R. Chemical Engineering Design, 4th ed.; Elsevier: Oxford, UK, 2005; Volume 6, p. 1038. [Google Scholar]
- Kwade, A.; Haselrieder, W.; Leithoff, R.; Modlinger, A.; Dietrich, F.; Droeder, K. Current status and challenges for automotive battery production technologies. Nat. Energy 2018, 3, 290–300. [Google Scholar] [CrossRef]
- Kendrick, E. Advancements in Manufacturing. In Future Lithium-ion Batteries; Eftekhari, A., Ed.; The Royal Society of Chemistry: Croydon, UK, 2019; Chapter 11; pp. 262–289. [Google Scholar] [CrossRef]
- Jaiser, S.; Müller, M.; Baunach, M.; Bauer, W.; Scharfer, P.; Schabel, W. Investigation of film solidification and binder migration during drying of Li-Ion battery anodes. J. Power Sources 2016, 318, 210–219. [Google Scholar] [CrossRef]
- Font, F.; Protas, B.; Richardson, G.; Foster, J.M. Binder migration during drying of lithium-ion battery electrodes: Modelling and comparison to experiment. J. Power Sources 2018, 393, 177–185. [Google Scholar] [CrossRef]
- Heimes, H.; Kampker, A.; Lienemann, C.; Locke, M.; Offermanns, C. Lithium-Ion Battery Cell Production Process; VDMA Battery Production: Frankfurt, Germany, 2019; p. 23. [Google Scholar]
- Tagawa, K.; Brodd, R.J. Production Processes for Fabrication of Lithium-Ion Batteries. In Lithium-ion Batteries: Science and Technologies; Yoshio, M., Brodd, R.J., Kozawa, A., Eds.; Springer: New York, NY, USA, 2009; Chapter 8; p. 452. [Google Scholar] [CrossRef]
- Das, A.; Li, D.; Williams, D.; Greenwood, D. Joining technologies for automotive battery systems manufacturing. World Electr. Veh. J. 2018, 9, 22. [Google Scholar] [CrossRef]
- Xiong, S.; Ji, J.; Ma, X. Comparative life cycle energy and GHG emission analysis for BEVs and PHEVs: A case study in China. Energies 2019, 12, 834. [Google Scholar] [CrossRef]
- Kim, H.C.; Wallington, T.J.; Arsenault, R.; Bae, C.; Ahn, S.; Lee, J. Cradle-to-Gate Emissions from a Commercial Electric Vehicle Li-Ion Battery: A Comparative Analysis. Environ. Sci. Technol. 2016, 50, 7715–7722. [Google Scholar] [CrossRef]
- Le Varlet, T.; Schmidt, O.; Gambhir, A.; Few, S.; Staffell, I. Comparative life cycle assessment of lithium-ion battery chemistries for residential application. J. Energy Storage 2020, 28, 101230. [Google Scholar] [CrossRef]
- Qiao, Q.; Zhao, F.; Liu, Z.; Jiang, S.; Hao, H. Cradle-to-gate greenhouse gas emissions of battery electric and internal combustion engine vehicles in China. Appl. Energy 2017, 204, 1399–1411. [Google Scholar] [CrossRef]
- Marques, P.; Garcia, R.; Kulay, L.; Freire, F. Comparative life cycle assessment of lithium-ion batteries for electric vehicles addressing capacity fade. J. Clean. Prod. 2019, 229, 787–794. [Google Scholar] [CrossRef]
- Dunn, J.B.; Gaines, L.; Sullivan, J.; Wang, M.Q. Impact of recycling on cradle-to-gate energy consumption and greenhouse gas emissions of automotive lithium-ion batteries. Environ. Sci. Technol. 2012, 46, 12704–12710. [Google Scholar] [CrossRef]
- Majeau-Bettez, G.; Hawkins, T.R.; Strømman, A.H. Life cycle environmental assessment of lithium-ion and nickel metal hydride batteries for plug-in hybrid and battery electric vehicles. Environ. Sci. Technol. 2011, 45, 4548–4554. [Google Scholar] [CrossRef]
- Westphal, B.G.; Bockholt, H.; Günther, T.; Haselrieder, W.; Kwade, A. Influence of convective drying parameters on electrode performance and physical electrode properties. ECS Trans. 2015, 64, 57–68. [Google Scholar] [CrossRef]


| Cell Component | Electrode Component | Mass (g) | % of Produced Cell |
|---|---|---|---|
| Anode | Active material | 101.29 | 27.64 |
| Carbon | 0.00 | 0 | |
| Binder | 5.33 | 1.45 | |
| Solvent | 2.10 | - | |
| Current collector | 0.92 | 0.25 | |
| Cathode | Active material | 194.63 | 53.11 |
| Carbon | 4.05 | 1.11 | |
| Binder | 4.05 | 1.11 | |
| Solvent | 1.60 | - | |
| Current collector | 0.92 | 0.25 | |
| Separator | 0.07 | 0.02 | |
| Electrolyte | 55.20 | 15.06 |
| Component | Process Step | Energy | % of Total |
|---|---|---|---|
| Anode | Mixing | 0.036 | 0.081 |
| Coating | 0.008 | 0.018 | |
| Drying | 5.246 | 11.760 | |
| Calendering | 0.001 | 0.002 | |
| Slitting * | 0.0 | 0.0 | |
| Cathode | Mixing | 0.066 | 0.148 |
| Coating | 0.008 | 0.018 | |
| Drying | 16.337 | 36.620 | |
| Calendering | 0.001 | 0.002 | |
| Slitting * | 0.0 | 0.0 | |
| Cell | Winding † | 0.0 | 0.001 |
| Filling | 0.001 | 0.002 | |
| Formation | 1.473 | 3.301 | |
| Dry room | 21.305 | 47.757 | |
| Floor heating | 0.128 | 0.288 | |
| Cell | Total | 44.611 | 100.0 |
| Study | Energy W h/Wh | % of Total GWP Emissions | Battery GWP (kg CO2-eq./k Wh) | Battery Type | Description |
|---|---|---|---|---|---|
| Xiong et al. [48] | 308.98 | 28.76 | 73.65 | LFP BEV | Database on base studies. Qin 300, 80, 450, and 100 vehicle batteries |
| 333.07 | 38.26 | 79.39 | LFP PHEV | ||
| 300.09 | 13.43 | 81.88 | NMC BEV | ||
| 452.06 | 21.58 | 123.34 | NMC PHEV | ||
| Kim et al. [49] | 416.67 | 45 | 64 | NMC/LMO BEV | Manufacturing data from a plant of 55 MWh. Ford Focus BEV |
| Weeber et al. [6] | 93–328 | - | 8.9–170.3 | - | Process model result. 21700-G1 cell |
| Kurland [9] | 50 | - | - | - | Predicted electricity usage for Northvolt 8 GWh plant, Sweden |
| 65 | - | - | - | Assumed electricity usage for Tesla 35 GWh plant, USA | |
| Le Varlet et al. [50] | 303.1–789.9 | 4.7–6 | 10–25 | LFP, NMC, LMO, NCA, NCO | Database on base studies. 5 residential battery chemistries |
| Qiao et al. [51] | 117.1 | 19.3 | 120.67 | NMC BEV | Database on base studies. Values for entire battery production |
| 139.6 | 20.2 | 127.75 | LFP BEV | ||
| Kallitsis et al. [3] | 173.18 | 57 | 102.43 | NMC333-SiG | Database on base studies. Values for electricity only. |
| 154.15 | 56 | 89.71 | NMC622-SiG | ||
| 134.24 | 56 | 78.57 | NMC811-SiG | ||
| Marques et al. [52] | 281.3 | 4.8 | 69.16 | LMO | Database on base studies. Values for manufacturing in the European Union. |
| 846.1 | 13.3 | 313.5 | LFP | ||
| Main base studies | |||||
| Ellingsen et al. [5] | 162.8–643.9 | 62 | 107–424 | NMC BEV | Monthly electricity usage of a plant, lower value and average value is given. dry room energy is dominated. |
| Notter et al. [4] | 1.07 | 1.7 | 1.14 | LMO BEV | Author’s own estimates |
| Dunn et al. [53] | 3.38 | 5.4 | 2.62 | LMO BEV | Extrapolated for industrial scale using measurements from a research facility |
| Majeau-Bettez et al. [54] | 101.2–164.2 | 27.6 | 54.5–87.5 | NMC BEV, PHEV | Top-down approach |
| Source | Sun et al. [7] | Dai et al. [11] | Schuneman [12] (cited in [8]) | Pettinger and Dong [13] | Yuan et al. [14] | Thomitzek et al. [8] | |
|---|---|---|---|---|---|---|---|
| Process Step | |||||||
| Mixing | 1 | - | 0.15 | 2.64 | 0.88 | 10.5 | |
| Coating/drying | - | 15.6–19.7 | 11.44 | 15.42 | 51.20 | 133.6 | |
| Calendering | - | - | 0.15 | 5.97 | 3.04 | 20.7 | |
| Stacking | - | - | 1.17 | 5.97 | 6.16 | 1.4 | |
| Final/vacuum drying | 12.7 | - | 16.57 | 5.97 | - | 6.0 | |
| Electrolyte fillin | - | - | 0.88 | 1.53 | 4.72 | 8.7 | |
| Formation | 3 | 1.11 | 0.88 | 2.92 | 0.56 | 26.1 | |
| Dry room | * 11.7 | 17.5–26.9 | 2.56 | - | 31.20 | 448.7 | |
| Other | - | - | 0.51 | 5.56 | 8.48 | 88.9 | |
| Total | 28.4 | 34.2–47.2 | 34.31 | 45.98 | 106.24 | 744.6 | |
| Annual capacity | 30 GWh | 2 GWh | 0.7 GWh | 76 MWh | 18.2 MWh | 48 kWh | |
| Cell energy | 204 | 167 | 136 | 76 | 125 | 33 | |
| Cell type | pouch | prismatic | no data | pouch | pouch | pouch | |
| Cathode chemistry | NMC622 | NMC333 | no data | no data | LMO | no data | |
| Process | Parameter | Mean | Standard Deviation | Output Energy Distribution (Wh/Wh) |
|---|---|---|---|---|
| Mixing | Impeller diameter () | 0.5 | 0.125 | (multimodal distribution) |
| Mixing | Power factor | 7.0 | 1.75 | |
| Dry mixing | Impeller speed () | 17.7 | 4.425 | |
| Wet mixing | Impeller speed () | 8.8 | 2.2 | |
| Anode drying | Hot air temperature (°C) | 100.0 | 25.0 | |
| Anode drying | Drying time () | 15.0 | 3.75 | |
| Cathode drying | Hot air temperature (°C) | 100.0 | 25.0 | |
| Cathode drying | Drying time () | 65.0 | 16.25 | |
| Formation | Formation time () | 20.0 | 5.0 | (multimodal distribution) |
| Dry room | Air flow rate () | 0.4 | 0.1 | |
| Dry room | Ambient air temperature (°C) | 8.0 | 2.0 | |
| Dry room | Ambient air relative humidity (%) | 75.0 | 18.75 | |
| Dry room | Dry air dew point (°C) | −60.0 | 15.0 | |
| Dry room | Time () | 35.0 | 8.75 |
Publisher’s Note: MDPI stays neutral with regard to jurisdictional claims in published maps and institutional affiliations. |
© 2021 by the authors. Licensee MDPI, Basel, Switzerland. This article is an open access article distributed under the terms and conditions of the Creative Commons Attribution (CC BY) license (http://creativecommons.org/licenses/by/4.0/).
Share and Cite
Jinasena, A.; Burheim, O.S.; Strømman, A.H. A Flexible Model for Benchmarking the Energy Usage of Automotive Lithium-Ion Battery Cell Manufacturing. Batteries 2021, 7, 14. https://doi.org/10.3390/batteries7010014
Jinasena A, Burheim OS, Strømman AH. A Flexible Model for Benchmarking the Energy Usage of Automotive Lithium-Ion Battery Cell Manufacturing. Batteries. 2021; 7(1):14. https://doi.org/10.3390/batteries7010014
Chicago/Turabian StyleJinasena, Asanthi, Odne Stokke Burheim, and Anders Hammer Strømman. 2021. "A Flexible Model for Benchmarking the Energy Usage of Automotive Lithium-Ion Battery Cell Manufacturing" Batteries 7, no. 1: 14. https://doi.org/10.3390/batteries7010014
APA StyleJinasena, A., Burheim, O. S., & Strømman, A. H. (2021). A Flexible Model for Benchmarking the Energy Usage of Automotive Lithium-Ion Battery Cell Manufacturing. Batteries, 7(1), 14. https://doi.org/10.3390/batteries7010014