Article

Comprehensive Hazard Analysis of Failing Automotive Lithium-Ion Batteries in Overtemperature Experiments

1
VIRTUAL VEHICLE Research GmbH, Inffeldgasse 21a, 8010 Graz, Austria
2
Graz Centre for Electron Microscopy, Steyrergasse 17, 8010 Graz, Austria
3
Institute of Electron Microscopy and Nanoanalysis, NAWI Graz, Graz University of Technology, Steyrergasse 17, 8010 Graz, Austria
4
Dr. Ing. h.c. F. Porsche Aktiengesellschaft, Porschestr. 911, 71287 Weissach, Germany
*
Author to whom correspondence should be addressed.
Batteries 2020, 6(2), 30; https://doi.org/10.3390/batteries6020030
Submission received: 6 April 2020 / Revised: 30 April 2020 / Accepted: 4 May 2020 / Published: 18 May 2020
(This article belongs to the Special Issue Lithium-Ion Batteries: Latest Advances and Prospects)

Abstract

:
Lithium-ion batteries (LIBs) are gaining importance in the automotive sector because of the potential of electric vehicles (EVs) to reduce greenhouse gas emissions and air pollution. However, there are serious hazards resulting from failing battery cells leading to exothermic chemical reactions inside the cell, called thermal runaway (TR). Literature of quantifying the failing behavior of modern automotive high capacity cells is rare and focusing on single hazard categories such as heat generation. Thus, the aim of this study is to quantify several hazard relevant parameters of a failing currently used battery cell extracted from a modern mass-produced EV: the temperature response of the cell, the maximum reached cell surface temperature, the amount of produced vent gas, the gas venting rate, the composition of the produced gases including electrolyte vapor and the size and composition of the produced particles at TR. For this purpose, overtemperature experiments with fresh 41 Ah automotive lithium NMC/LMO—graphite pouch cells at different state-of-charge (SOC) 100%, 30% and 0% are performed. The results are valuable for firefighters, battery pack designers, cell recyclers, cell transportation and all who deal with batteries.

Graphical Abstract

1. Introduction

The market of battery electric vehicles (BEV) and hybrid electric vehicles (HEV) increases, especially in China, the U.S. and the EU [1,2]. LIBs are significantly used in the automotive sector. However, there are still challenging requirements for LIBs in the automotive sector such as costs, fast charging, lifetime, increasing energy density and safety.
It is known that battery failures can lead to critical situations inside the vehicle. The worst case is the uncontrollable exothermic chemical reaction—the TR. TR caused most of EV fires according to Sun and Huang et al., who published a review about EV fire incidents in [3]. TR is a self-accelerating exothermic reaction inside the cell which can be started by a hot spot produced inside the cell (hot spot, particle short circuit) or by a heat source outside the cell (electrical failure) [4,5,6,7]. Current methods to characterize possible battery failures are battery abuse tests like overcharge, overtemperature, over-discharge, nail penetration and fire tests. These abuse tests show the influence of cell chemistry on the failing behavior and the thermal stability of the cell [4].
Thus, the cell chemistry is an important parameter for battery safety. State-of-the-art battery chemistries used in BEVs and HEVs are based on Li-ion technology. Currently used materials are: LiNiMnCoO2 (NMC), LiNiCoAlO2 (NCA), LiMn2O4 (LMO), LiFePO4 (LFP) and LiCoO2 (LCO) as cathode; graphite and carbonaceous materials as anode; regular electrolyte mixtures of ethylene carbonate (EC), diethylene carbonate (DEC), dimethyl carbonate (DMC), ethyl methyl carbonate (EMC); a Li-salt such as LiPF6 and a separator between the electrodes [8]. The cells are encased with sealed laminated foils (pouch cells) or metallic casings. During the first charge of the LIB an organic passivation layer—the so-called solid electrolyte interface (SEI)—develops on the anode.
Several decomposition stages of those cell materials in overheated LIBs have been published [9,10,11,12]. Main reactions according to literature include for the listed cell chemistries in general:
>70 °C
The conducting salt starts to decompose and reacts with solvents and the SEI [13,14,15,16].
>120 °C
Reaction between intercalated lithium in the anode and electrolyte occur initiated by the SEI breakdown (90–130 °C [17]). Heat is generated [7,17]. Li and electrolyte reaction can occur between 90–230 °C [17] and produces gases like C2H4, C2H6 and C3H6 [5].
>130 °C
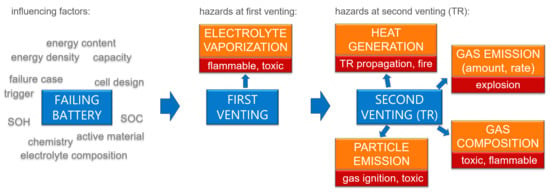
Further gas develops and electrolyte vaporizes. The cell internal pressure increases until the cell casing opens at the weakest point. Accumulated gas vents from inside the cell into the battery pack (first venting). It can occur at about 120–220 °C cell surface temperature [18,19]. Separator melts between 130 °C–190 °C [6,20].
~160 °C
Starting at about 160 °C the exothermic process inside the cell accelerates the self-heating and results in a TR. The TR is accompanied by violent gas and particle release (second venting). Electrolyte decomposes exothermally [5,21] between 200–300 °C [17]. At the TR, the cell temperature increases enormously due to chemical reactions inside the cell. Metal oxide cathodes decompose and produce oxygen (O2) [22,23]. O2 further reacts with electrolyte and produces CO2 and H2O [21,23].
During battery failures, like the TR, violent reactions inside the cell produce significant amounts of hot, toxic and flammable gas and the cell ejects hot particles. The released gas and particles may cause serious safety and health risks, like fire, explosion and toxic atmosphere.
These critical situations need to be analyzed in order to minimize the risks from failing LIBs and to increase safety. To reach an acceptable level of safety in EVs and to enable early failure detection, the Electrical Vehicle Safety—Global Technical Regulation (EVS-GTR) aims to harmonize vehicle regulations worldwide. These regulations discuss suitable tests to characterize safety risks [24].
It is essential to identify comparable hazards and safety parameters to evaluate the failing behavior of different cell types reliably and in order to set necessary safety measures. But which hazards need to be addressed, which safety relevant parameters need to be quantified and which methods are suitable for a comprehensive hazard analysis of a cell?

1.1. Categorized Hazards from LIBs

In literature several important hazards from failing state-of-the-art batteries are reported resulting in main five hazards, which may lead to safety and health risks (Figure 1): electrolyte vaporization, heat generation, gas emission, gas concentration and particle emission. Hazards based on high voltage and current are not considered in this study. The first venting and the TR of the cell can cause the following hazards:

1.1.1. Electrolyte Vaporization

Electrolyte vaporizes starting at the first venting of the cell. Contemporary electrolytes for LIBs are known to be flammable, irritant, toxic, and/or corrosive depending on the exact composition of the electrolyte mixture [4,25,26] and need to be considered as a safety and health risk. Electrolytes are assumed to be a major source of poor safety with high volume gas decomposition, large combustion enthalpy and flammability of solvent vapor [27].

1.1.2. Heat Generation

Heat generation [4,19,28,29,30] and significant temperature increase is one safety hazard of the TR, which may lead to TR propagation to neighboring cells or battery fire [31]. Safety relevant parameters are the cell temperature at the first venting of the cell, the TR onset temperature, the maximum reached cell surface temperature and the vent gas temperature. The temperature of the produced vent gas and the ejected particles out of the cell can reach critical high temperatures up to 1000 °C [19] and may damage the cell surrounding materials irreversibly.

1.1.3. Gas Emission

Gas emission [4,23,32,33] is another hazard with the possible consequence of explosion and rapid destruction of the pack. At the TR significant amount of gas [34,35] is produced within seconds. Safety relevant parameters are the amount of produced gas (in mol or liter) and the venting rate (in mol/s or L/s). The gas emission at TR for current state-of-the-art batteries with regular electrolytes is expected in the range of 1.3 L/Ah up to 2.5 L/Ah (at STP: 298.15 K, 100 kPa) [34]. Characteristic venting rates are (0.8 ± 0.3) mol/s at heat ramp TR experiments of 50 Ah prismatic LMO cells [19].

1.1.4. Gas Composition

Main gas compounds at TR are carbon dioxide (CO2), carbon monoxide (CO), hydrogen (H2) and hydrocarbons [31,32]. The produced gas is toxic and flammable [25,36]. Except for CO2 and H2O all produced gases are flammable, explosive and deflagration of the produced vent gas in contact with O2 is possible. In addition, small amounts of toxic gases like hydrogen fluoride (HF) can be produced by decomposition of fluorine compounds as LiPF6 [31,37].

1.1.5. Particle Emission

At TR solid hot particles of active materials and aerosols can be released by the failing cell, which are critical to ignite the combustible vent gas [4,38]. Particles should be considered as additional toxic hazard [4] and health risk. The ejected material is a mixture of solid particles, aerosols of active material, parts of current collector foil and electrolyte from the cell.
Figure 1 presents these five hazards assigned to the first venting and the second venting, the TR. The battery failing behavior on cell level and the resulting hazards are influenced by: the energy content of the cell (capacity and the energy density) [34,35,39], the chemistry/active material and separator [4,40], the electrolyte composition and additives [27,41], the failure case/trigger [4,42], the design of the cell housing (pouch versus metal can) [28], the SOC [17,23,43,44] and the state-of-health (SOH)/aging history [18,45]. Additionally, the presence of surrounding gases like O2 changes the resulting hazards [42] due to additional chemical reactions.
Many researchers have studied single hazard categories from failing LIBs for different cell types and different chemistries [19,28,32,33], but mainly for small capacity cells with <5 Ah [32,33,42,43]. Since NMC/graphite composites are currently one of the preferred LIB chemistries in EVs and higher cell capacities and higher energy densities lead to more severe TR reaction [34,46], this study focuses on the failing behavior of modern high capacity NMC and NMC/LMO cells.
Single hazard categories from NMC and NMC/LMO cells with >20 Ah are published in [13,25,34,38,46,47,48]: Fang and Gao et al. concentrate on the heat generation during heat triggered TR for 25 Ah NMC [13], 1–50 Ah NMC and NMC/LMO [46] and TR propagation of 42 Ah prismatic BEV [48] cells. Ren et al. evaluate heat generation at different SOH [18]. Koch et al. focus on gas emission (amount), gas composition and mass loss at overtemperature experiments in an atmosphere of air (present O2) [34]. Nedjalkov et al. analyze the gas composition in air (present O2) with a nail trigger to force TR [25]. Zhang et al. focus on particle emission [38] and gas composition [47] after heating the cell.
Beside valuable information on single hazard categories, to the best of the authors knowledge, only little information is available in literature on the following hazards and safety relevant parameters of high capacity NMC or NMC/LMO cells. Nevertheless, this information is of relevance for various R&D activities towards significant safety improvements of batteries:
  • The vent gas amount: Koch et al. measured an average 1.96 L/Ah at 20‒81 Ah NMC cells in air (present O2) and refer to a gas emission in the range between 1.3 L/Ah up to 2.5 L/Ah for current batteries with regular electrolytes [34] for mainly small capacity cells. Zhao et al. [35] measured for 2 Ah NMC cells at extended volume accelerating rate calorimeter (EV-ARC) abuse 1.4 L/Ah. A detailed analysis of the gas amount produced at failing high capacity NMC/LMO cells in N2 is missing in current literature.
  • The venting rate: Golubkov et al. published a characteristic venting rate of (0.8 ± 0.3) mol/s at heat ramp TR experiments of 50 Ah prismatic LMO cells [19]. A relevant analysis of the venting rate of NMC and NMC/LMO pouch cells is not available in accessible literature.
  • A comprehensive gas composition analysis at heat triggered TR: Koch et al. conduct the experiments in air (present O2) [34] and does not quantify electrolyte components and H20. Zhang et al. set huge effort to quantify higher hydrocarbons (1.63% of total gas amount) [47] and does not analyze electrolyte components, HF and O2. A comprehensive gas analysis at heat triggered TR in N2 atmosphere including electrolyte quantification is missing.
  • Vent particles emission at TR: published by Zhang et al. for a prismatic 50 Ah NMC cells in N2 atmosphere [38,47]. Since the investigated cells by Zhang et al. have a different cell design (metal can), electrolyte composition and energy density there is a need to further investigate the size and content of particles produced at TR with a nondestructive analysis method.
Additionally, a contribution of the following parameters at failing high capacity NMC or NMC/LMO cells in N2 atmosphere would be relevant for the scientific community in this field:
  • A study of the five mentioned hazards including quantification of the safety relevant parameters for the same specific cell.
  • Comprehensive gas composition analysis at the first venting or at abuse experiments of cells with low SOC, where no self-heating into TR can be triggered.
Therefore, for a comprehensive hazard analysis a study on relevant parameters and measurement principles need to be addressed for all five mentioned hazards. In this study, these five hazards are characterized, safety relevant parameters are quantified, and measurement principles are provided from a large capacity NMC/LMO cell currently used in modern EV. Overtemperature experiments are conducted on three cells with different SOCs (100%, 30% and 0%). The investigated hazards (and quantified safety relevant parameters) are:
  • Gas composition at first venting (gas concentrations including electrolyte vapor)
  • Heat generation at TR (cell surface temperatures including maximum reached temperature)
  • Gas emission at TR (amount of produced gas and venting rate)
  • Gas composition at TR (gas concentrations)
  • Particle emission at TR (particle size distribution and composition)
Hazards from this automotive NMC/LMO pouch cells have, to the authors’ knowledge, not been the subject of any scientific publication, but, as will be shown, are important to investigate.

1.2. Structure of the Study

This study describes a comprehensive hazard analysis, safety parameter quantification and TR measurement principles of a fresh 41 Ah automotive Li-ion pouch cell. It starts with a brief investigation of initial cell material in Section 2, an introduction of the TR test bed and the applied methods in Section 3, presenting the failing behavior and hazards from the heat triggered cell in Section 4 and ending with comparing the results with existing literature in Section 5. The TR experiments of the same cell at different SOC (100%, 30% and 0%), but same TR trigger are compared to evaluate the influence of SOC to the failing behavior.

2. Investigated Cell

The investigated cell is a fresh high energy density 41 Ah Li-ion pouch cell designed for EV applications and used in a currently available EV. We extracted the cells from an EV.
The total mass of the fresh pouch cell is 865 g (Table 1). The cell consists of an electrode stack which is sealed in laminated foil. This electrode stack has 22 anode layers, 21 cathode layers and 42 separator layers. The anode layers consist of Copper (Cu) foils (current collector of the anode), which are coated with graphite on both sides. Likewise, the cathode layers consist of aluminum (Al) foils, which were coated on both sides with a mixture of NMC and LMO (spinel). The graphite particles have an average size of 25 µm and the NMC/LMO particles 12–15 µm [49]. The separator has an Al2O3 coating facing the cathode side. Fluorine (F) was detectable in the anode and cathode material [49].
The electrolyte consists of a mixture of EC, DEC and DMC solvents with 1 mol LiPF6 per liter. The following molar ratios, namely 48% EC, 48% DEC and 4% DMC were determined by 1H NMR and 13C NMR analysis. No FEC and VC electrolyte additives were found by this investigation (Table 1).
The mass split of the discharged cell presented in Figure 2 is estimated based on the investigations of the cell material and considers the cell design and data from literature for NMC cells [32,43]. The mass of SEI, binder and carbon black are omitted. It is assumed that 14% of the initial mass of the cell is electrolyte and conducting salt. This corresponds to 121.5 g of electrolyte, consisting of 44 g of EC, 59 g of DEC, 3.7 g of DMC and 14.8 g of LiPF6.

3. Experimental Setup and Test Methods
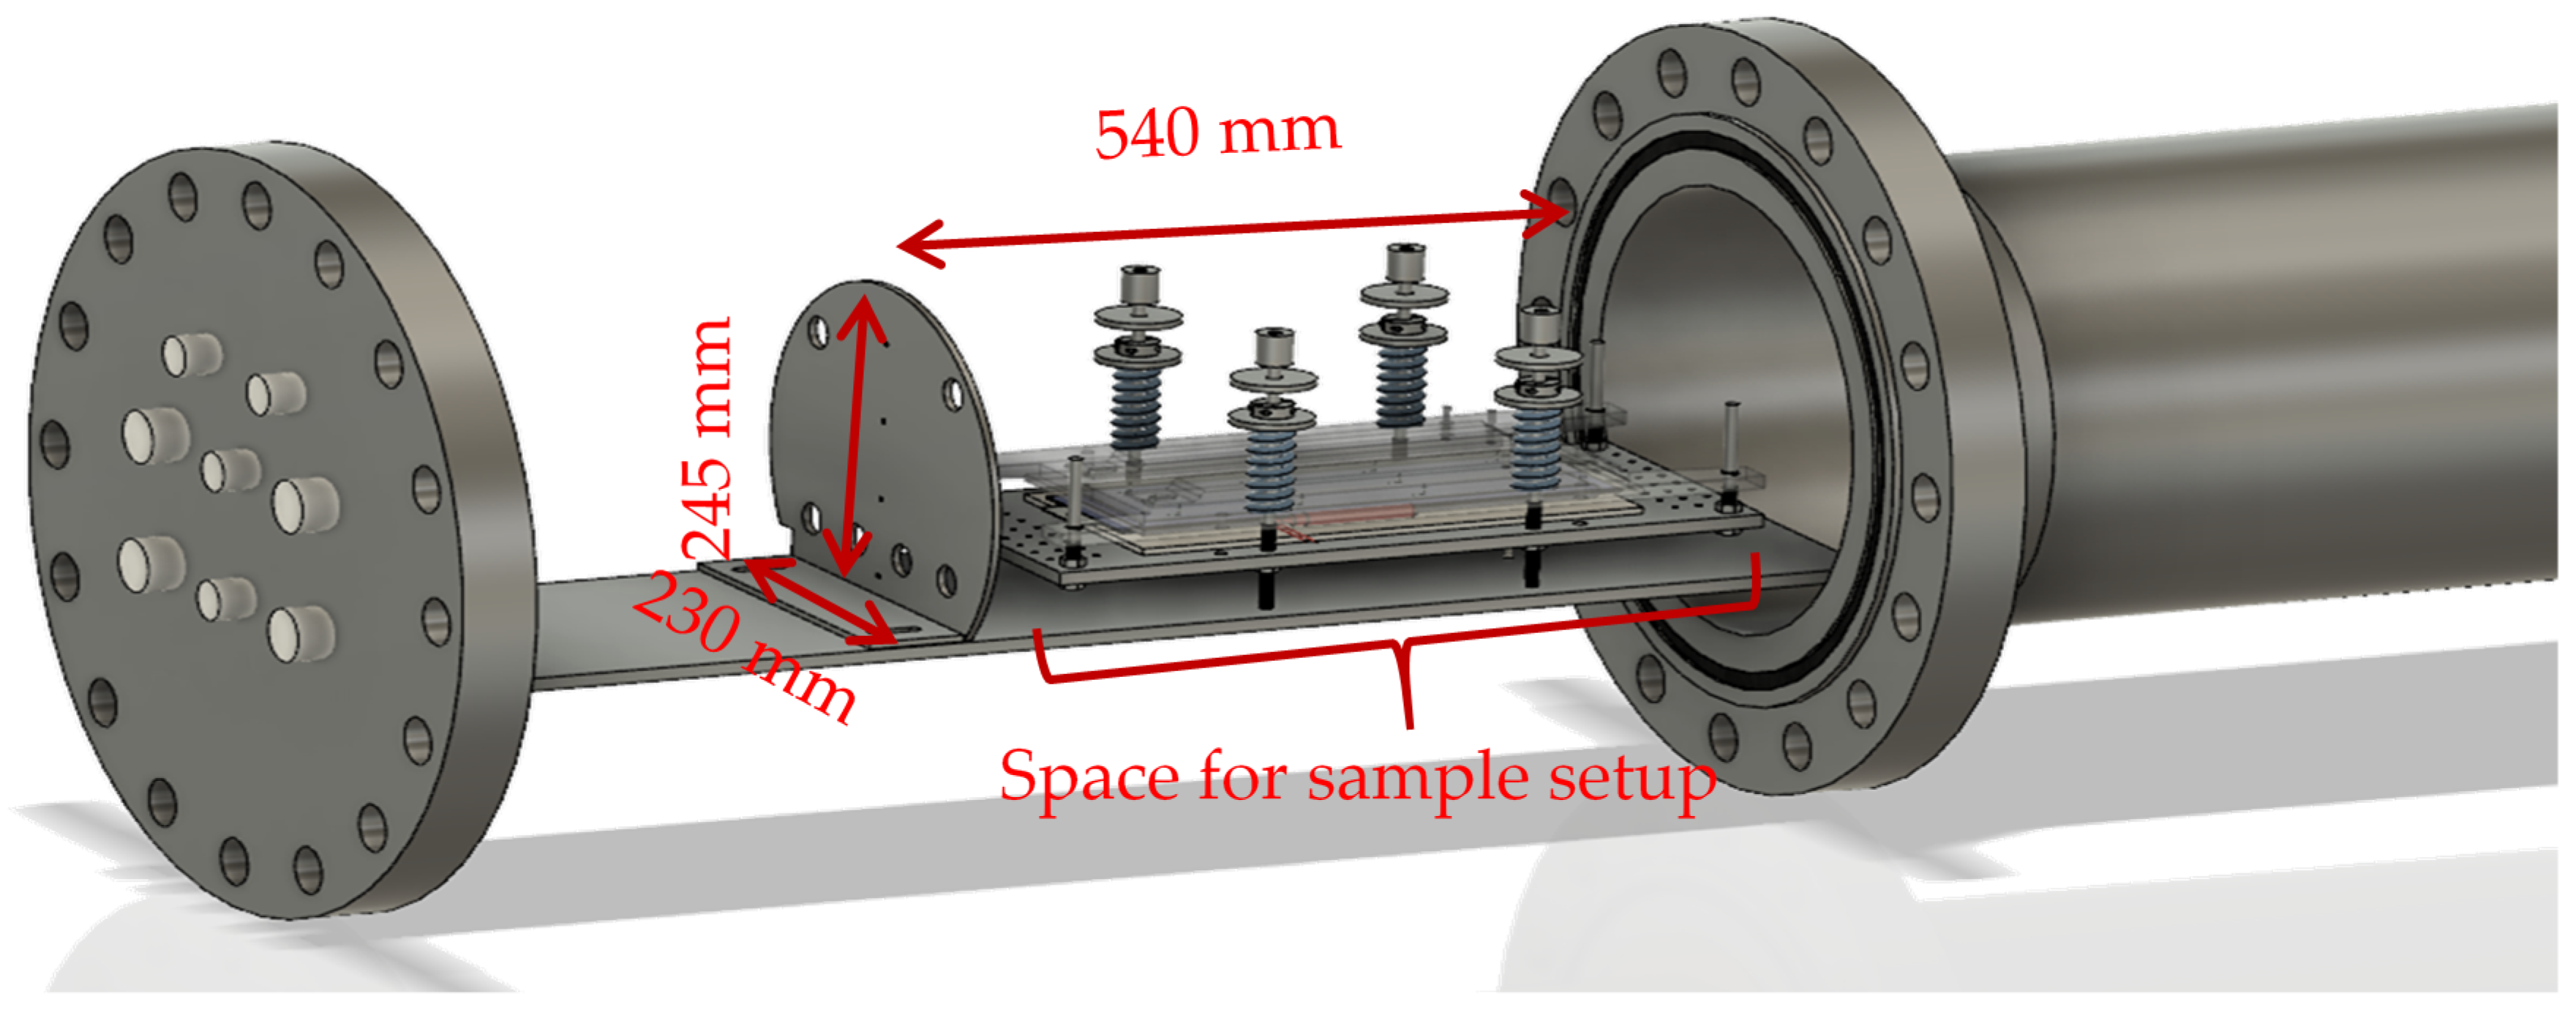
Three experiments with fresh automotive pouch cells are conducted. In the first experiment the cell is charged to 100%. In the second experiment the cell is charged to 30% and in the third to 0%. Each single cell is triggered into the failing behavior separately by heat. During the heating phase, temperatures at several positions on the cell surface and inside the test reactor, the voltage of the cell and the pressure inside the reactor are measured.

3.1. Reactor Setup

TR experiments are carried out inside a gastight 40 bar pressure resistant stainless-steel reactor. The test-rig is published in [19,37,50] and is shown in Figure 3. The stainless-steel reactor with the implemented sample holder has a free volume of 121.5 L. The experiments can be done in N2 atmosphere or in air. For safety reasons most experiments are done in N2 atmosphere, as are the presented ones.

3.2. Experimental Method:

In the experiments the response of each cell (mounted inside a sample holder) to heat is measured and safety relevant parameters are quantified. The sample holder presented in Figure 4 is heated by two heater stripes (max. 500 W each) on the top stainless-steel plate and two heater stripes (max. 500 W each) on the bottom stainless-steel plate. To minimize the thermal coupling between the stainless-steel plates and the cell, insulating mica sheets (thermal conductivity of 0.23 W/mK) with 2 mm are placed between the cell and the stainless-steel plates. The mica sheets also provide channels for the thermocouple wires. Each mica sheet has positions for thermocouples. The tips of the thermocouples protrude through the mica sheets and are squeezed between the mica sheet and the cell surface. Because the mica sheets are thermal insulators, the thermocouple tips measure the cell surface temperature.
The heater increases the temperature of the cell (also compare Figure 6 heater output, black line). Though with the presented setup it is not possible to define the exact heating rate before the experiment, the average heating rate is calculated after the experiment. The heating rate is defined as the increase of the average cell surface temperature per minute between 30 °C and 200 °C.
The experiment method consists of several subsequent steps:
Sample and experiment preparation:
1.
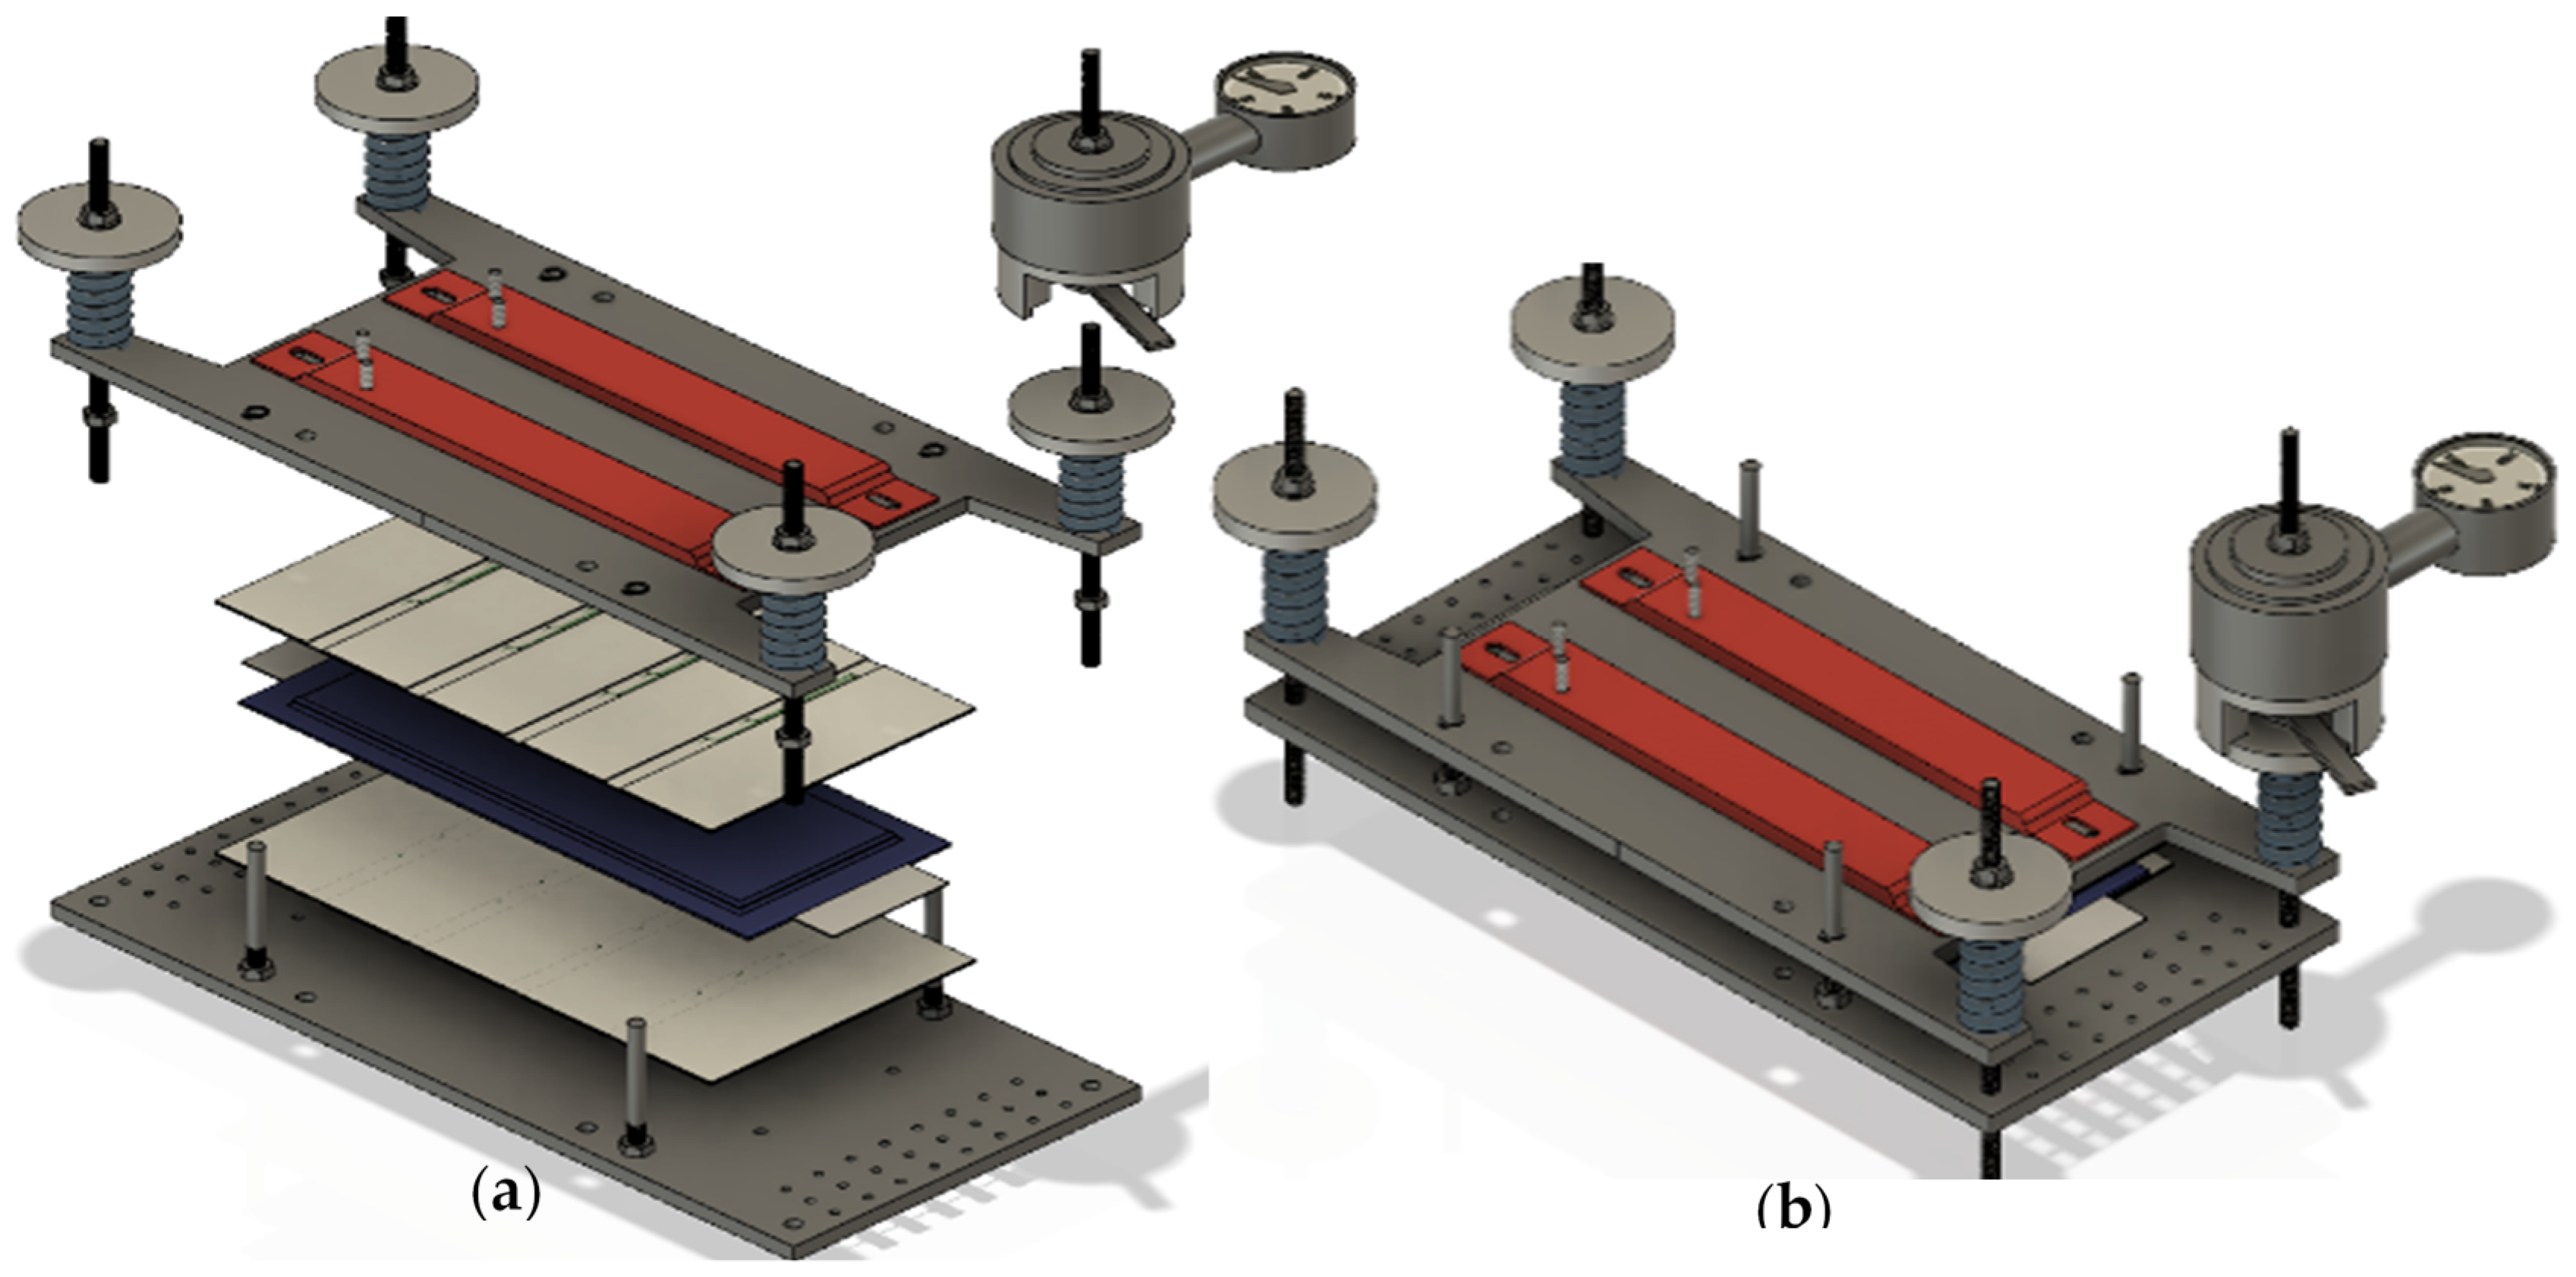
Insulating mica plates with thermocouples for temperature measurement are placed on the top and the bottom side of the cell (beige plates in Figure 4a).
2.
The sample is fixed in the sample holder with a defined force of 3000 N (54 kPa).
3.
Reactor is closed and evacuated.
4.
N2 is added until ambient pressure. Step 3 and 4 are repeated at least 2 times.
5.
All gas valves are closed (the reactor is hermetically sealed).
6.
Sample is charged to the desired SOC (0%, 30% and 100%).
Experimental steps:
7.
The data acquisition system is started: measurement of cell surface temperature, cell voltage, temperature and pressure inside the reactor. The cell is pulsed with a battery cycler (±1 A pulses) in order to get information on the cell resistance.
8.
The desired TR trigger is chosen. Here: the cell is heated by the sample holder with a constant rate of temperature increase from both sides with a specified heat ramp (0.39 °C/min at 100% SOC; 0.36 °C/min at 30% SOC until 38,000 s, then increased rate; 0.33 °C/min at 0% SOC).
9.
The sample exhibits the first venting and, after being heated to the critical temperatures, the TR.
10.
After reaching the maximum temperature during the exothermic reaction, the TR, the heating is switched off. The cell starts to cool down. Wait 5 min to start the experiment after-treatment.
Experiment after-treatment:
11.
The valves to the gas analysis section are opened. The gas composition analysis is started.
12.
After finishing the gas measurement series, the data acquisition is stopped.
13.
Reactor is heated, evacuated and flushed with N2 several times before opening. Ejected particles are sampled, and the test cell is removed.

3.3. Heat Generation Analysis/Temperature Measurement

Up to 30 thermocouples type k inside the reactor are used in each TR experiment. The temperature of the pouch cell surface is measured with twelve thermocouples on the cell top and twelve on the cell bottom positioned in defined regular distances (50 mm, arrangement 4 × 3, see Figure 5). T c e l l V 1 describes the average measured cell surface temperature of all thermocouples at the first venting. T c e l l V 2 describes the average measured cell surface temperature of all thermocouples at the second venting. The onset temperature T c e l l o n s e t is the temperature when the temperature of the cell heating rate is faster than the heating rate of the heat ramp. The critical temperature T c e l l c r i t describes when the temperature rate of the selected sensor exceeds 10 °C/min (detailed description in [19]). The maximal cell surface temperature T c e l l m a x is the maximum recorded temperature of one of the thermocouples (depends on the position of the origin of the TR). The gas temperature is measured inside the reactor at four different positions. The average reactor temperature is used to calculate the vent gas amount produced at the battery failure.

3.4. Gas Emission Analysis

The pressure inside the reactor is measured with a GEMS 3300B06B0A05E000 sensor. The pressure and the average gas temperature measured at equilibrium state, 5 min after the TR, are used to calculate the amount of released vent gas. The amount of released gas nv (mol) is calculated with the ideal gas equation and is presented in liter at standard temperature and pressure (STP: 298.15 K, 100 kPa, Vmol = 24.465 L/mol). The amount of gas produced starting at T c e l l V 1 and ending at the T c e l l V 2 is defined as nv1. nv2 is the gas produced after T c e l l V 2 and during the TR. The characteristic venting rate n ˙ ch (mol/s) is calculated with the minimal duration ∆t50% (s) to produce 50% of the venting gas nch50% (mol). For the calculation of the safety relevant parameters (amount of released gas and characteristic venting rate) the same calculation is used as described in [19]).

3.5. Gas Composition Analysis

The gas composition is quantified with two complementary methods in parallel: A Fourier transform infrared spectrometer (FTIR) and a gas chromatograph (GC). In contrast to [40,43] the gas analysis is enhanced with FTIR spectroscopy. The results of the two methods are combined for each measurement and—depending on expected gas components and their concentration range—the measured results of a method, either FTIR or GC, can be chosen.
The downstream connection from the reactor to the gas analysis is heated to ~130 °C. Thus, all gases with a condensation temperature below 130 °C will stay gaseous and will be detected. One converse example is the commonly used electrolyte component EC with a boiling point of 246 °C. Hence, it is very unlikely to measure EC absorbance peaks in the used test setup. The reactor gas consists of N2 and the vent gas, which is added by the cell. Since the produced vent gas does not contain N2, the amount of N2 can be subtracted to calculate the concentration of each component of the vent gas only. The concentration of any gas component (cv/%) in the vent gas is calculated with the measured concentration of this gas component in the reactor gas (cm) and the measured N2 concentration (cN2) in the reactor gas:
cv = ((cm × 100)/(100 − cN2))

3.5.1. FTIR Spectrometer (FTIR)

A Bruker MATRIX-MG01 FTIR is used with 0.5 cm−1 wavenumber resolution. The MCT detector is N2 (l) cooled. The FTIR measurement chamber itself is heated to 190 °C. The interior space of the FTIR spectrometer is purged with N2 (g) for at least 2 h to reduce the influence of surrounding gases to the measurement. For the background measurement 100 scans are averaged. A number of 40 scans are used for each data point. To avoid contamination a cold trap and a particle filter are added in front of the FTIR gas measurement chamber. The quantification of the gas compounds is done with the software OPUS GA by Bruker. For each gas analyzed with FTIR a certain absorbance wavenumber region is chosen and compared with a reference spectrum. The setting of the software OPUS GA is optimized for the expected gases and concentrations and validated with the test gas. The FTIR spectrometer is currently optimized for: CO, CO2, CH4, C2H6, C2H4, C2H2, DEC, DMC, EC, EMC, H2O, C6H14, HF, C4H10 and C3H8.

3.5.2. Gas Chromatograph (GC)

For gas analysis with GC the 3000 Micro GC (G2802A) is used with three columns and TCD detectors. The three-channel system includes Molsieve (10 m × 320 µm × 12 µm), Plot U (8 m × 320 µm × 30 µm) and OV1 (8 m × 150 µm × 2.0 µm). The injector temperature and the sample inlet temperature are set to 100 °C for all three channels. The column temperature of the Molsieve channel is 80 °C (at 30 psi) and 60 °C for the Plot U and OV1 channel (40 psi each). Injection time for Molsieve and Plot U is 15 ms and 10 ms for the OV1 channel.
Since the GC uses corrosion sensitive columns, the gas is washed in water washing bottles at room temperature before entering the GC. These washing bottles are directly applied after passing the FTIR gas measurement chamber. Gases that do not dissolve or condensate in the water can be measured. The GC is calibrated for: H2, O2, N2, CH4, CO, CO2, C2H6, C2H4, C2H2.

3.5.3. Accuracy of the Gas Quantification

The accuracy of the gas analysis for the presented experiments is validated with test gas of different concentrations and the systematic and statistic uncertainties for FTIR and GC analyzed gas components are added up (Table 2). The FTIR measures spectra continuously over time with a low standard deviation of the measured value (dependent on gas compound <0.2% of the measured value). The GC is calibrated with test gas at a specific uncertainty of each component ∆test gas = ±1%.
The gas quantification method of the FTIR measured spectra is optimized for the expected gas concentrations produced at first venting and during TR. FTIR measurements have advantages at low gas concentrations like for gaseous and toxic HF, but disadvantages in symmetric molecules without change of dipole moment like H2 and if the absorption peaks of gases are at similar wavelengths. The GC has its benefits at high concentrations of permanent gases, especially H2, N2 and O2 which cannot be measured with FTIR spectrometer.
From the gas compounds quantified with both methods the result of one method, either FTIR or GC, is chosen depending on expected gas components and their concentration range. For small concentrations of CO, CO2, CH4, C2H6, C2H4, C2H2 the measured FTIR concentration values are chosen because of the lower LOD. If the measured concentration of C2H4 is significantly higher than the LOD, the GC measured value is chosen because of the higher accuracy compared to the FTIR.

3.6. Particle Collection and Particle Analysis

The ejected particles are sampled after the TR and investigated using scanning electron microscopy (SEM) at the Institute of Electron Microscopy and Nanoanalysis (FELMI) at Graz University of Technology. The analysis is focused on particle size distribution (PSD) and particle composition. A ZEISS Sigma 300 VP (Variable Pressure) and a FEI Quanta 200 ESEM (Environmental SEM) are used for the investigation of the released particles after TR. The following SEM detection modes are used:
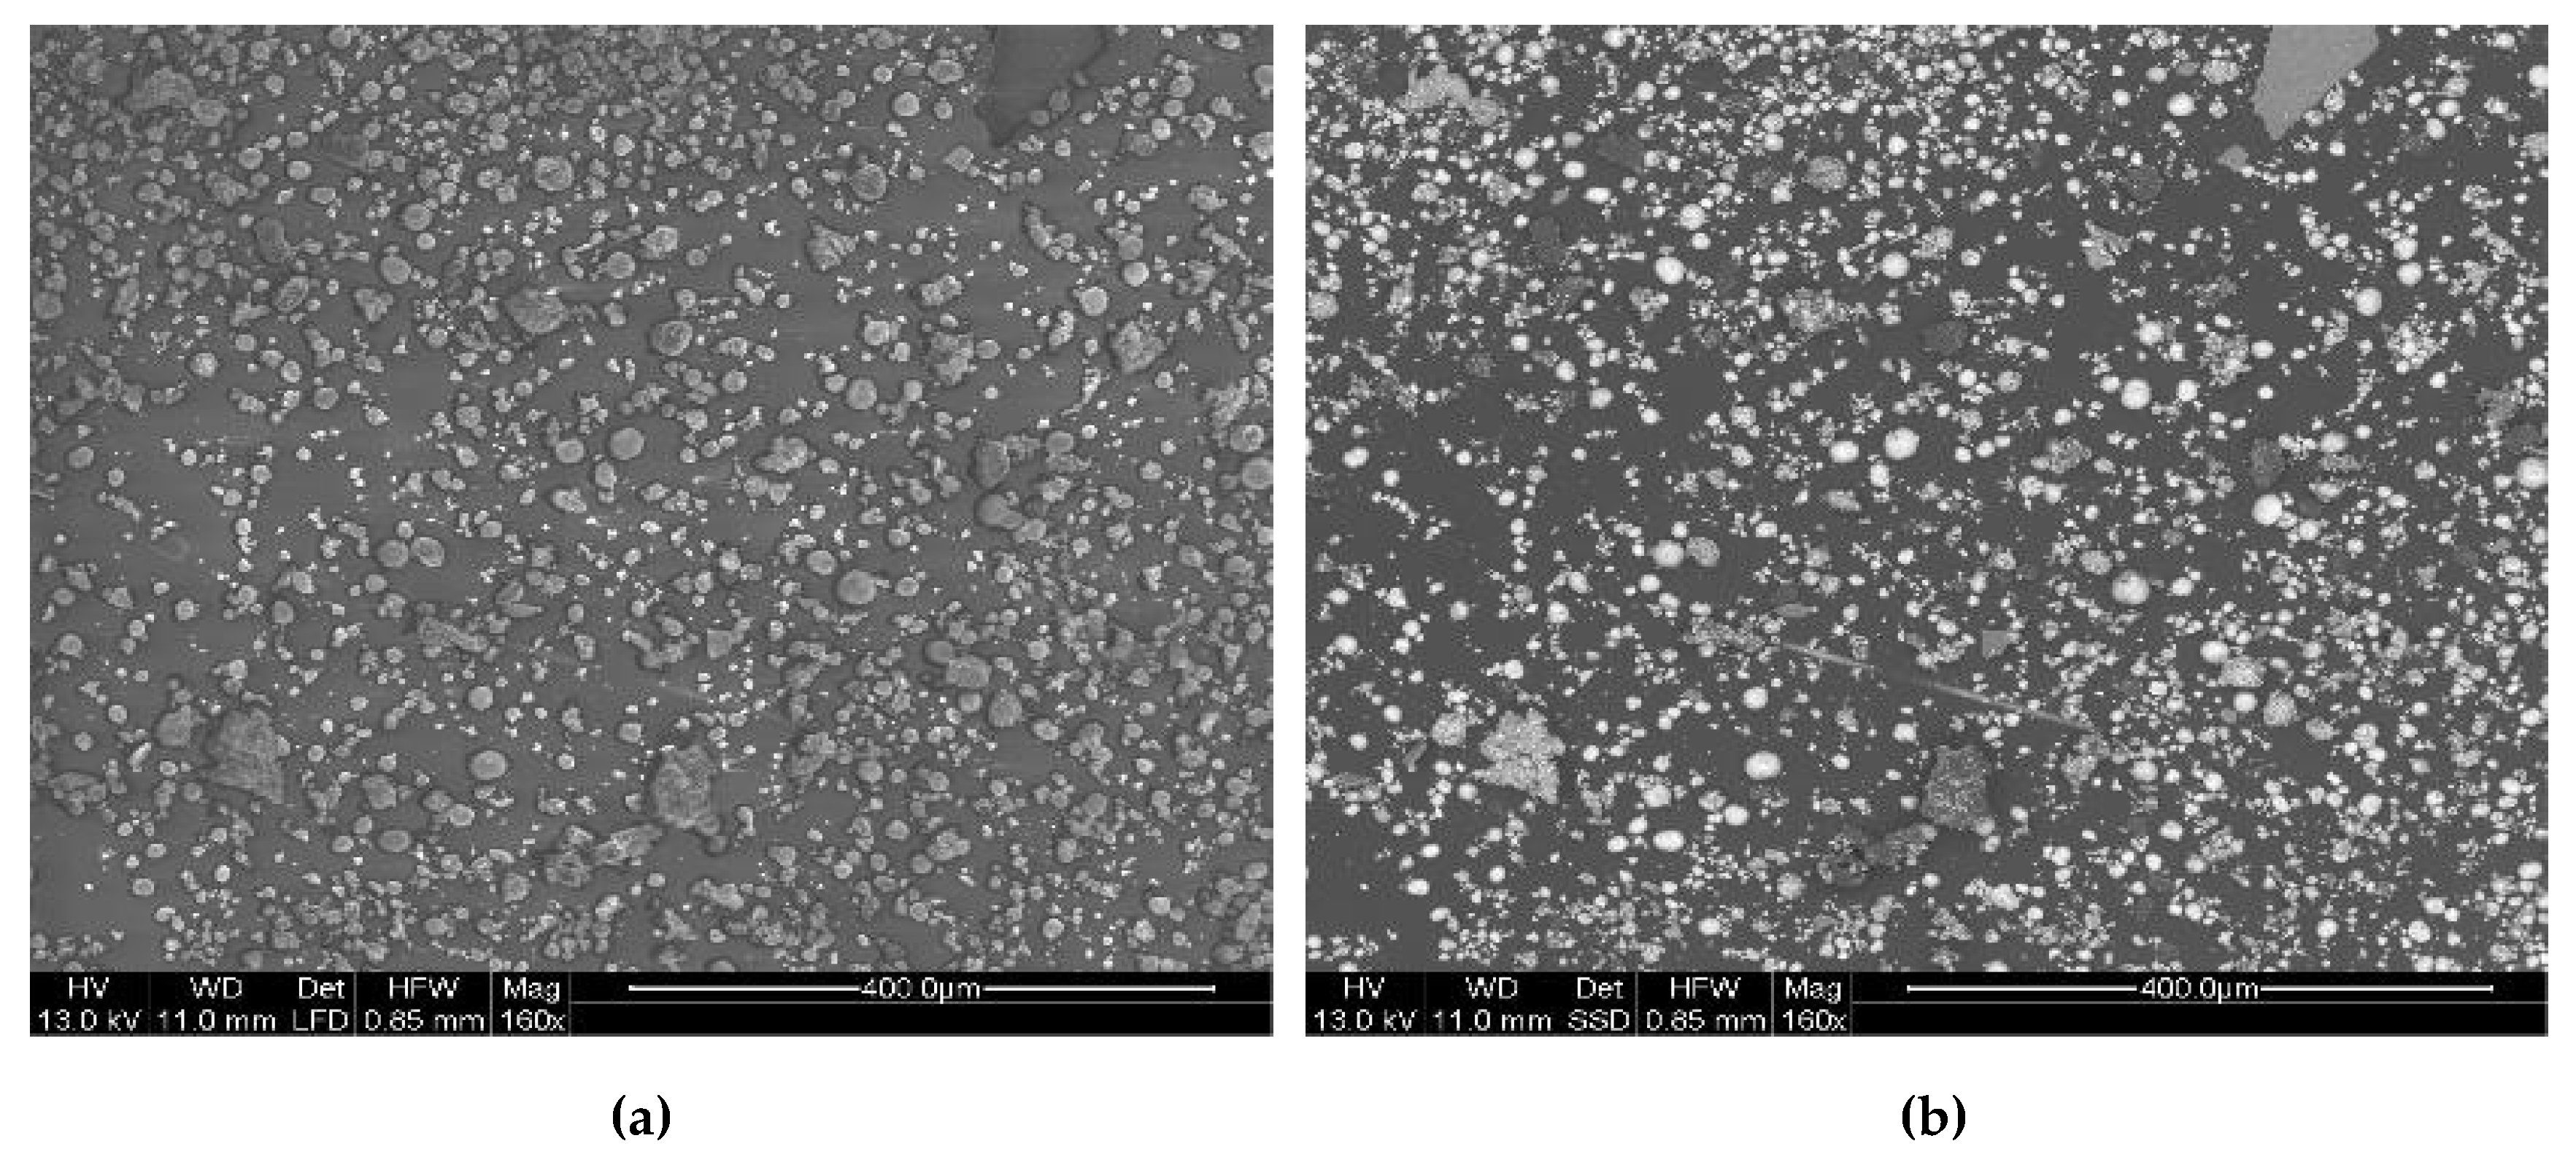
  • For material contrast: imaging with backscattered electron (BSE);
  • For topographic contrast: imaging with secondary electrons (SE);
  • For elemental analysis: energy dispersive X-ray spectroscopy (EDX).
For the SEM investigations the particles have to be fixed on a sample holder. The fixation must enable a homogeneous distribution without agglomeration of the particles. Gasser showed that the most reliable sampling method is to collect particles from inside the reactor with a spatula and spraying them by a jet of air on a double-sided adhesive carbon tape [51]. This method is used for the sample preparation and subsequently the particles are analyzed with SEM/EDX to measure particle size and particle elemental composition.
Prior to the investigation, EDX simulations are performed with the public access program NIST DTSA-II [52]. Therewith the electron beam interaction was simulated, to be able to assess the best beam energy for SEM-EDX measurements of particles with the measured particle sizes [51].

3.7. Mass Reduction Analysis

The weight of the test sample is measured before and after the experiment using a scale (KERN K8) with a measurement uncertainty of ±0.01 g. After the experiment after-treatment including the heating of the reactor, the vacuum and the N2 flushing the weight of the remaining cell and large parts (>30 mm length) of the cell outside the cell housing are measured.

4. Results

Three experiments with fresh automotive pouch cells were conducted. In the first experiment the cell is charged to 100%. In the second experiment the cell is charged to 30% and in the third to 0%. The first venting of the cell could be observed at all three test samples. The TR could only be triggered at the fully charged cell.

4.1. Heat Generation/Temperature Response

One critical hazard of a failing cell is heat generation, which can be detected by measuring the temperature response of the cell to the trigger (Figure 6). The experiment of the fresh automotive pouch cell at 100% SOC is compared to the 30% SOC cell in Figure 6a,c during the whole heat ramp experiment and Figure 6b,d at the main exothermic event.

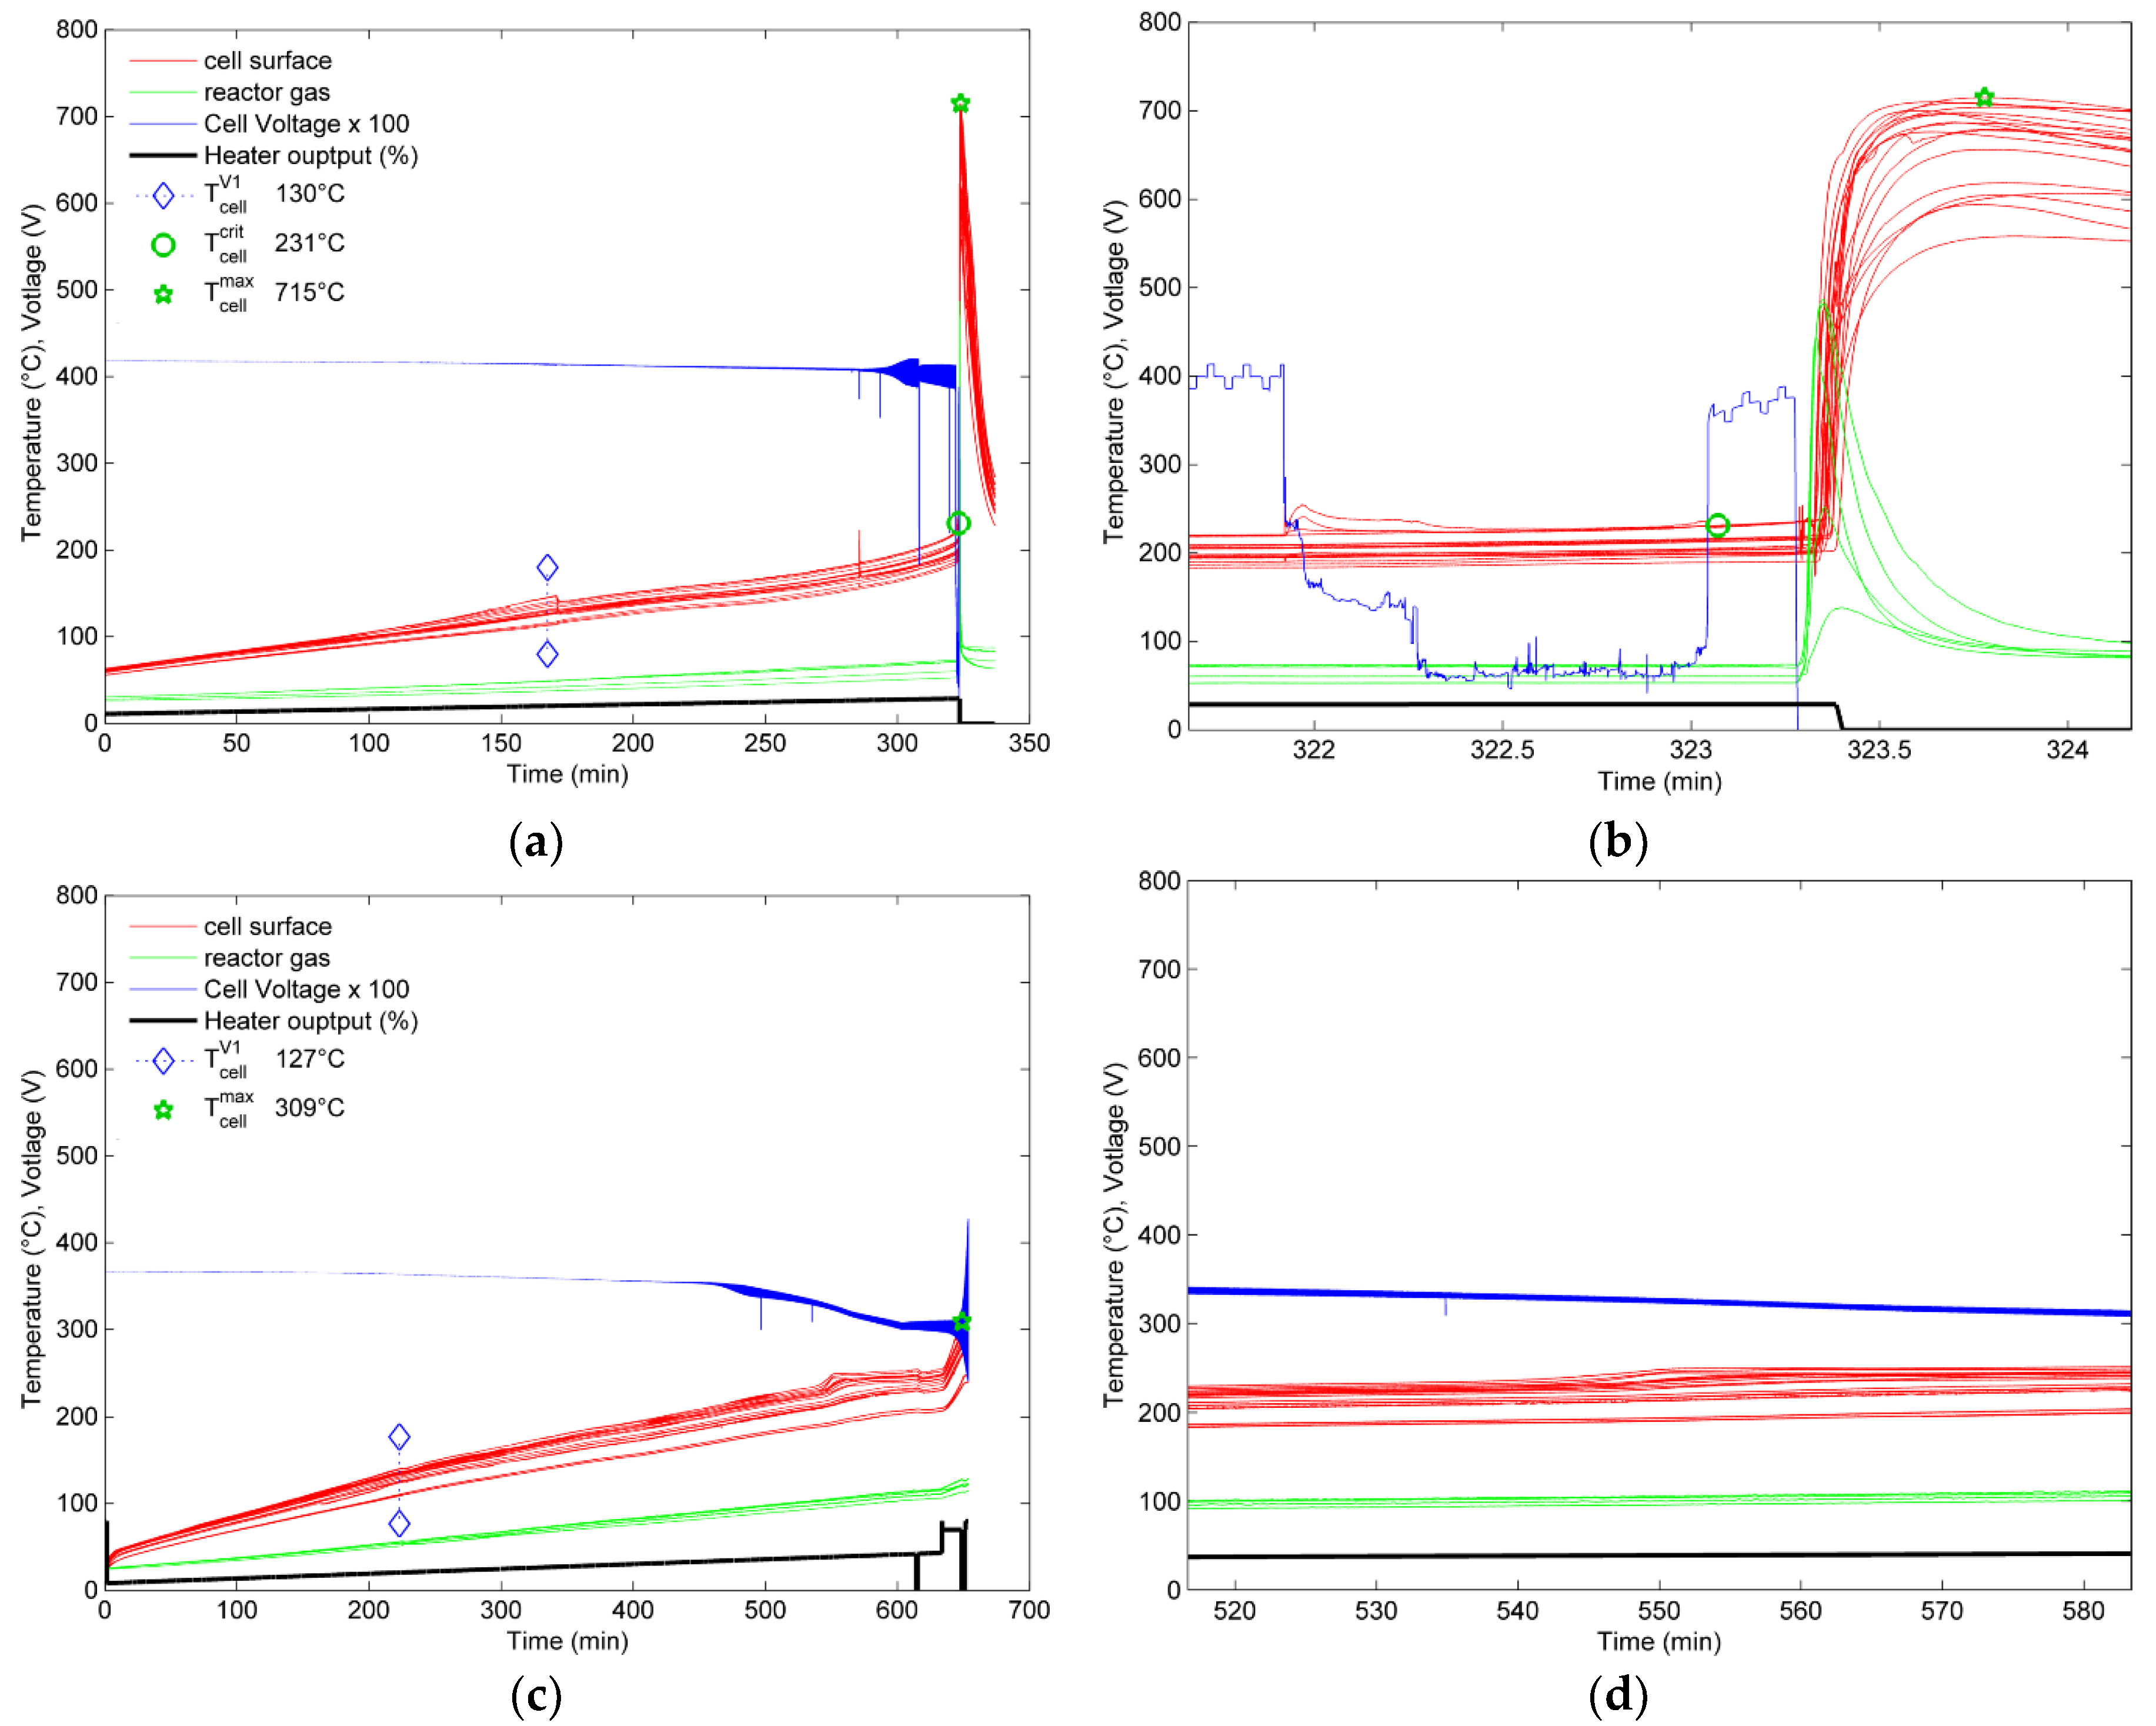
4.1.1. Experiment with the 100% SOC Cell

As the fully charged cell is heated it shows a minor temperature excursion in the range of T c e l l V 1 = 130 °C—the first venting of the cell—10,300 s after activating the heat ramp (Figure 6a). The pouch cell opens. If the cell gets heated up further, the cell reaches the onset temperature. The onset of the main exothermic reaction is detected at T c e l l o n s e t = 170 °C. The voltage of the cell started decreasing during the heating phase at 70 °C and dropped completely to 0 V at 203 °C cell surface temperature. The second venting starts at T c e l l V 2 = 212 °C. The main exothermic reaction developed to a rapid TR at T c e l l c r i t = 231 °C (self-heating beyond 10 °C/min). At 100% SOC the cell exhibited an exothermic reaction after 19,397 s and reached a maximum temperature of T c e l l m a x = 715 °C on the cell surface. The main exothermic reaction begun at a location between the center of the cell and the positive tab of the cell. Within 4.28 s the exothermic reaction propagated through the cell (time between the rapid increase of the first thermocouple and the increase of the last thermocouple in Figure 6b).

4.1.2. Experiment with the 30% and 0% SOC Cell

Compared to the fully charged fresh cell, the cell with 30% SOC behaves differently using the same overtemperature setup (Figure 6c,d). After reaching the first venting at about T c e l l V 1 = 127 °C, no exothermic reaction can be detected even by heating beyond 231 °C. The 30% SOC cell is heated with a constant rate of 0.36 °C/min until 38,000 s and afterwards with an increased rate up to 309 °C (Figure 6c). After reaching the 309 °C maximum cell surface temperature, the heat ramp is stopped.
The 0% SOC cell also could not be triggered into TR by heat. At T c e l l V 1 = 120 °C cell surface temperature, the first venting is detected. The experiment is stopped heating up to 240 °C.

4.2. Gas Emission

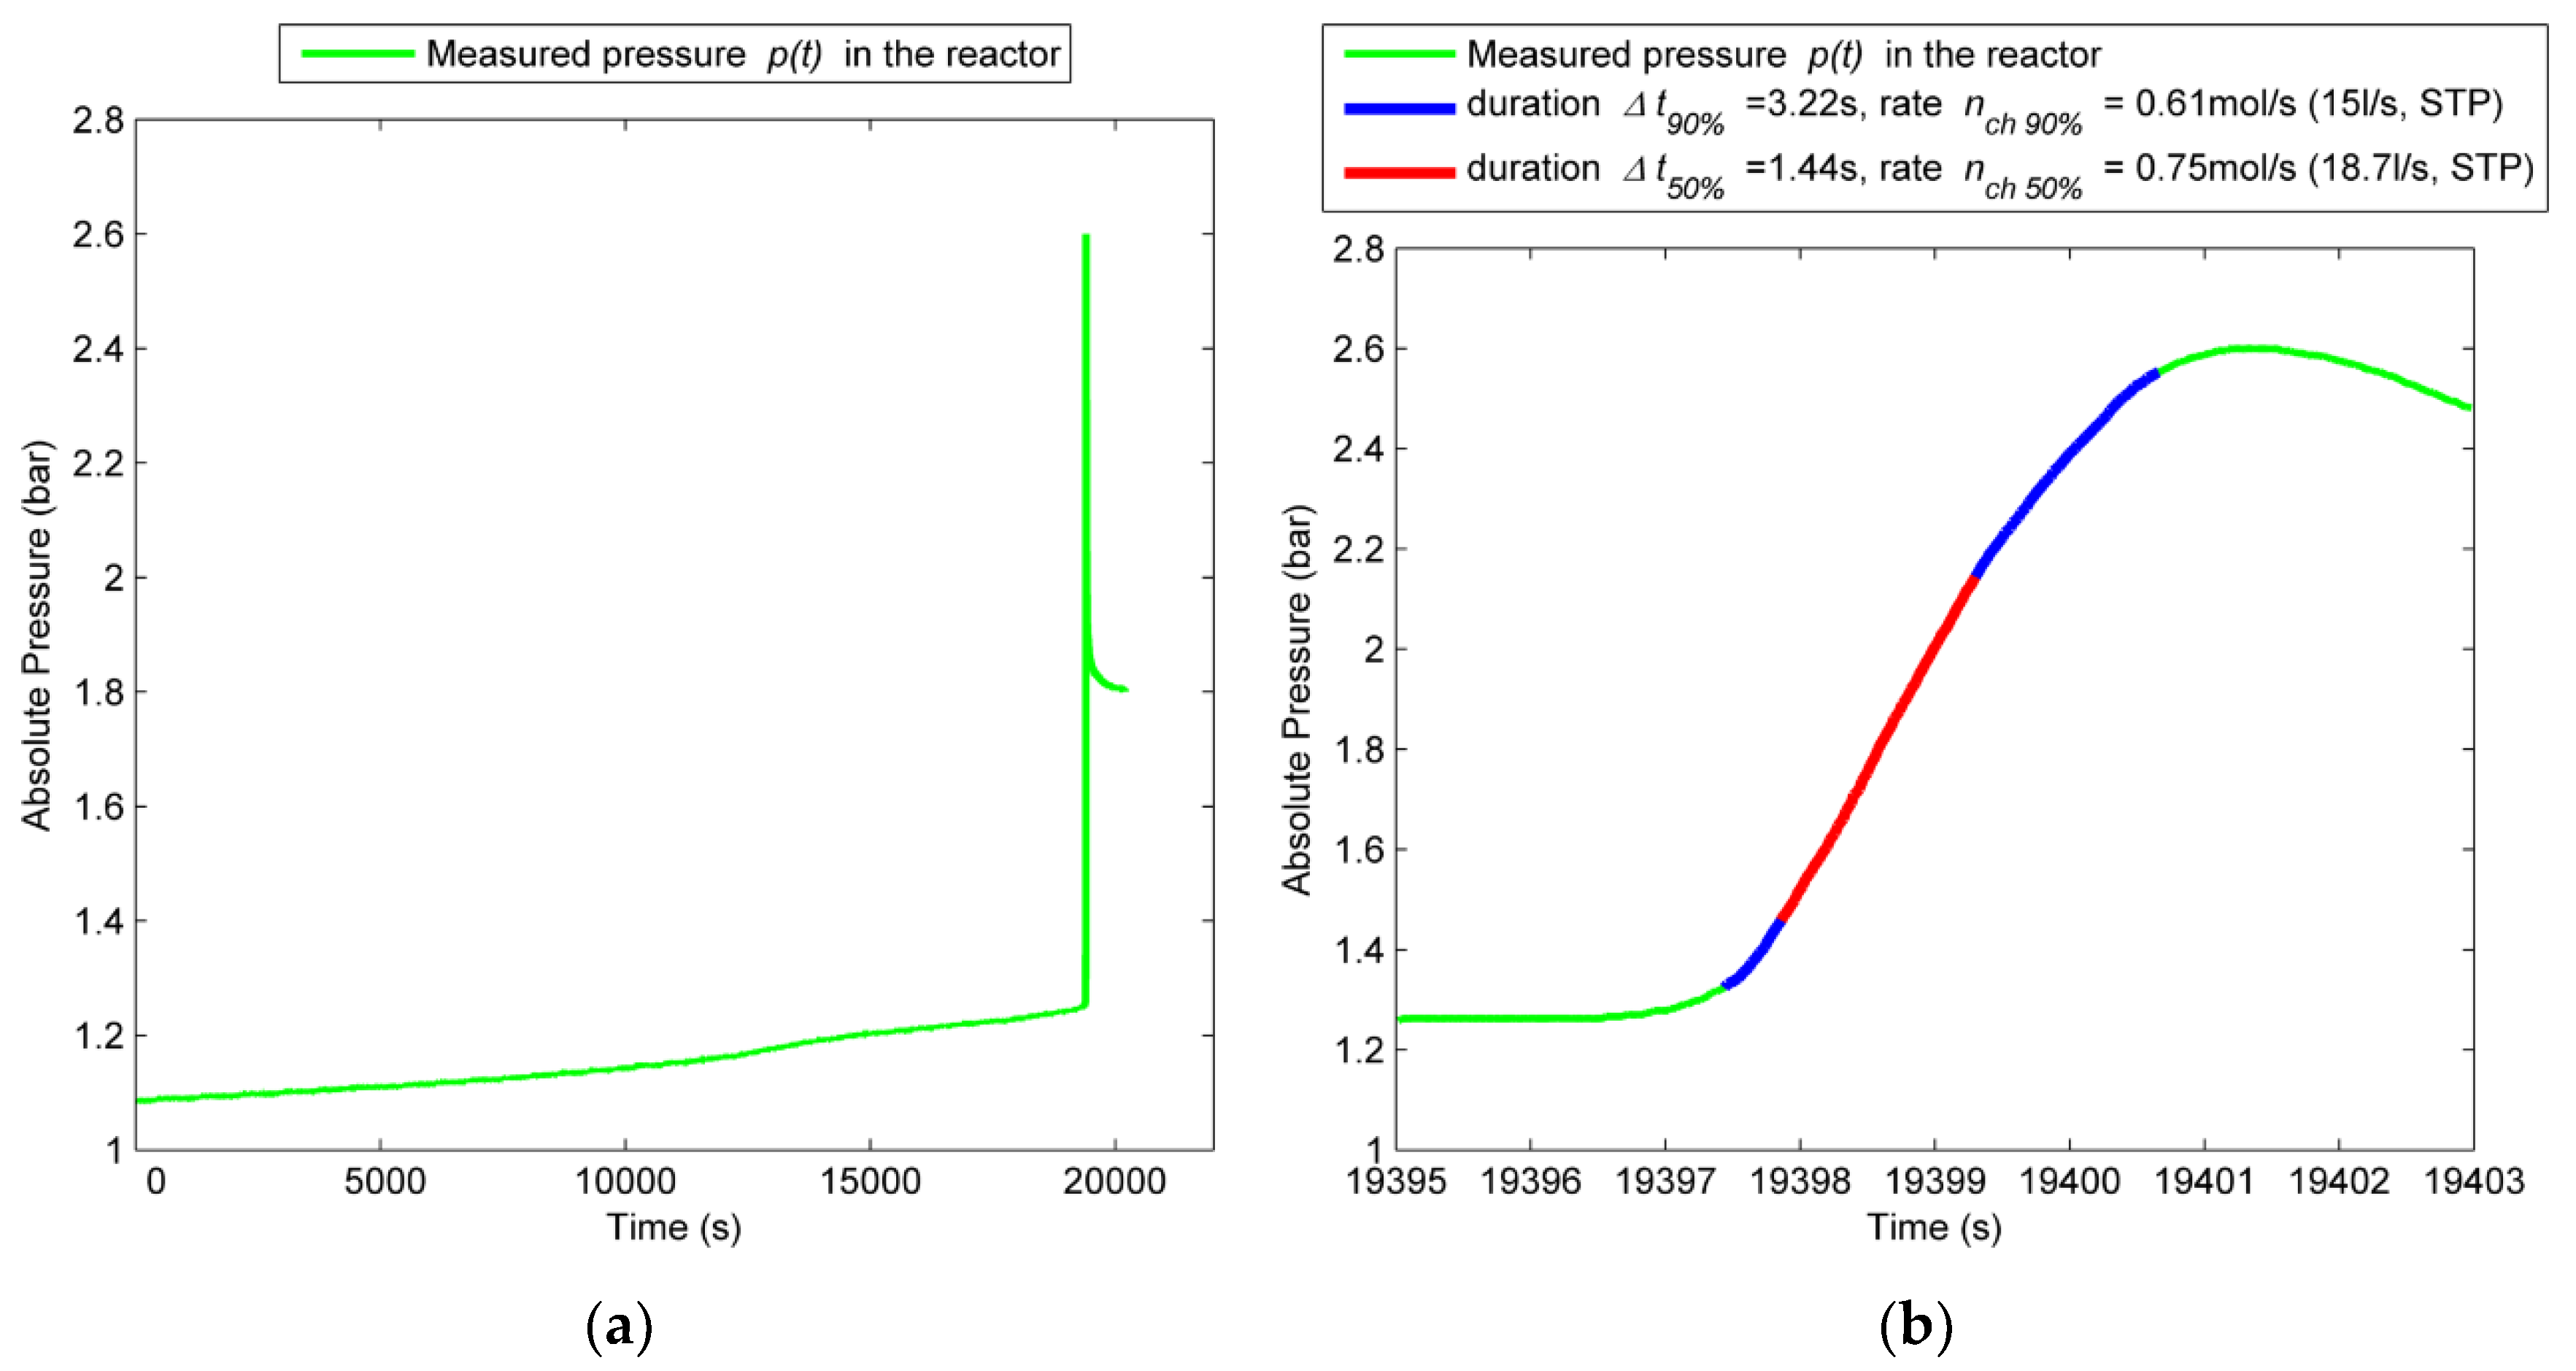
4.2.1. Experiment with the 100% SOC Cell

The pressure inside the reactor increases slowly at the first venting of the pouch cell and abruptly at the TR (Figure 7a). Figure 7b shows that the gas emission of the cell at the TR takes in total about 4 s. About 50% of the gas is produced in ∆t50% = 1.44 s and 90% in ∆t90% = 3.22 s.
The fully charged cell released during the first venting nv1 = 0.14 mol of gas (Figure 8a). During the main TR reaction, the cell released additional nv2 = 2.17 mol of gas with a characteristic venting rate of n ˙ ch = 0.8 mol/s (18.7 L/s). The calculated produced vent gas amount is shown in Figure 8a. At 100% SOC in total nv = 2.31 mol gas, which is equivalent to 52 norm liters (at 0 °C, 1013.25 hPa) and 57 L at STP, are produced. The fully charged cell produced 0.06 mol/Ah (equivalent to 15 mol/kWh, 1.3 L/Ah) during the overtemperature TR experiment.

4.2.2. Experiment with the 30% and 0% SOC Cell

The 30% SOC cell released nv = 0.53 mol (13 L) gas during the first venting and constant evaporation of electrolyte until the heating is stopped at 309 °C (Figure 8b). Compared with nv1 of the fully charged cell, the 30% cell released nv = 0.11 mol until Tcell = 212 °C. The discharged cell shows a similar behavior and produces nv = 0.41 mol (10 L) gas until the heating is stopped at 240 °C. In these cases, after the first venting, additional gas is produced during the heating phase.
Figure 9 shows the produced gas amount in mol of the 0%, 30% and 100% charged cell for the first venting, the second venting and the total gas emission. In case of the 0% and 30% cell no second venting could be triggered, therefore, the gases produced until the heating is stopped are added up to the first venting. Hence, the amount of produced gas at the first venting is higher at the 0% and the 30% SOC cells than at the 100% SOC cell.

4.3. Vent Gas Composition

The main gas components at the heat triggered cell at 0% and 30% SOC are CO2, DEC, H2O with minor components like CO, H2, C2H4, CH4, C3H8, C2H6, C2H2 (Figure 10). The main gas components of the fully charged cell are in descending order at the first venting DEC, H2O, CO2, CO, C2H6, H2, C2H4 and at the TR CO2, H2, CO, H2O, C2H4, CH4, DEC, C4H10, C2H6, C2H2 (Table 3, Figure 10). In Table 3 the measured gas concentration values of the experiment at 100% and 30% SOC are listed as well as the vent gas composition in% and mol according to Equation (1).
The measured gas components at the 30% SOC and 0% SOC cell match with the gas compounds measured at the beginning of the first venting of the 100% SOC cell at about 120‒130 °C cell surface temperature. Additionally, it is assumed that the quantified gases at the 30% and 0% SOC cell are dominated by SEI decomposition, electrolyte vapor and decomposition reaction of the electrolyte above 200 °C [5]. At the experiments of the 100%, 30% and 0% SOC cell no HF is detected.
The FTIR spectra of vent gases produced at the 100% (blue) and the 30% (red) charged cell are compared directly in Figure 11. The absorbance spectrum shows for the 30% SOC cell significant higher absorption peaks of the used electrolyte DEC between 1000–1850 cm−1 than at the venting of the fully charged cell. In the spectrum of the gas produced at the 100% SOC cell the electrolyte absorption peaks decreased (decomposition of the electrolyte, TR reaction and less long heating time at the 100% SOC cell) and CO, CO2, CH4 and C2H4 increased.

4.4. Particle Emission

Imaging of particles collected after the TR is performed using SEM. SE images deliver topographic contrast (Figure 12a). Although BSE imaging enables material contrast (Figure 12b), where particles with higher mean atomic number appear comparatively brighter and particles of different composition could be discerned by different gray levels, SE imaging is used to enhance the visibility of carbonated particles on the carbon substrate. To determine the PSD, SE images are binarized by gray value thresholding. Results of the measured average particle areas are presented in Table 4. Due to different reasons, like image noise or image resolution, particles segmented with the threshold method which are beneath 2 µm2 in area have a big relative uncertainty. The investigation of the particle size shows that most of the particles have an area smaller than 10 μm2 and about half of the particles are smaller than 5 μm2.
To obtain a precise particle composition EDX analysis is used. Therefore, the combination of the SEM with an Oxford XMax 80 EDX detector is applied using the software AZtec for EDX control an evaluation. Therewith it is possible to simultaneously obtain the PSD and the elemental composition of every individual particle. With this setup five different categories of particles are identified and assigned the following classes:
  • Particles mainly consisting of Al and O. Their assumed chemical formula is Al2O3 (Figure 13).
  • Particles with huge amounts of nickel (Ni), manganese (Mn), O and smaller amounts of cobalt (Co). The assumed chemical formula is (Li + NMC)3O4.
  • Particles mainly consisting of Mn and O. The average elemental composition has the estimated chemical formula Mn2O3 or its decomposition products.
  • Particles with a high content of C. Very small EDX peaks of O, fluorine (F) and phosphorus (P) were measured.
  • The fifth particle class describes agglomerates with several different material composites which do not fit into one of the listed classes.
The identified particles were parts of the cell active material and were ejected by the cell due to the exothermic reaction. The Mn rich particles (class 2 and 3) result from the cathode. The C rich particles originate from the anode. F and P may result from the salt LiPF6. A small amount of C measured at almost every particle can result from the used carbon tape, the conducting carbon in the cathode or the carbon coating which was performed prior to the investigation in order to get an electrically conductive surface of the specimen.
In the Supplementary Materials SEM images of particles of the listed classes and the correlated spectra are explained. Exemplarily Figure 13 shows (a) the SE image, (b) the BSE image and (c) the EDX spectrum of a particle of class 1. The main elements in this particle are O and Al, as shown in the EDX spectrum. For the most particles of this class the chemical formula Al2O3 can be assumed.

4.5. Mass Reduction

Since no TR could be triggered at the 0% and 30% SOC cell, the initial cell mass of 865 g is reduced by 15% during the whole experimental test including the aftertreatment. Considering the amount of vent gas and the molar mass of the measured main gas components produced until the heat ramp was stopped, the 30% SOC cell released in total 27 g uncondensed gas during the heat ramp experiment. We assume that the mass reduction of 15% is due to the measured gas, condensed gas and additional gases produced at the experiment after-treatment.
At the 100% SOC overtemperature experiment the initial cell mass of 868 g reduced to 491 g after the TR. This means a cell mass reduction by 43%. This mass reduction can be explained as the sum of released gas, liquids and ejected particles at the TR. Considering the amount of vent gas and the molar mass of the measured main gas components H2, CO and CO2 and the side products CH4, C2H4, DEC, H2O, C2H6, C4H10 in total 74 g not condensed gas is released during the TR experiment. The measured gas components are about 20% of the lost cell mass during TR and about 9% of the initial cell mass. The result of the total mass of produced gas is used to assume the mass of the produced particles at the TR. The total mass loss (377 g) minus the gas amount (74 g) results in ~300 g particles. We assume that EC, one of the main electrolyte components, condensed after the TR. Gas with high boiling temperature will condensate on the colder reactor walls, but the amount of condensed gas is not the focus of this study.

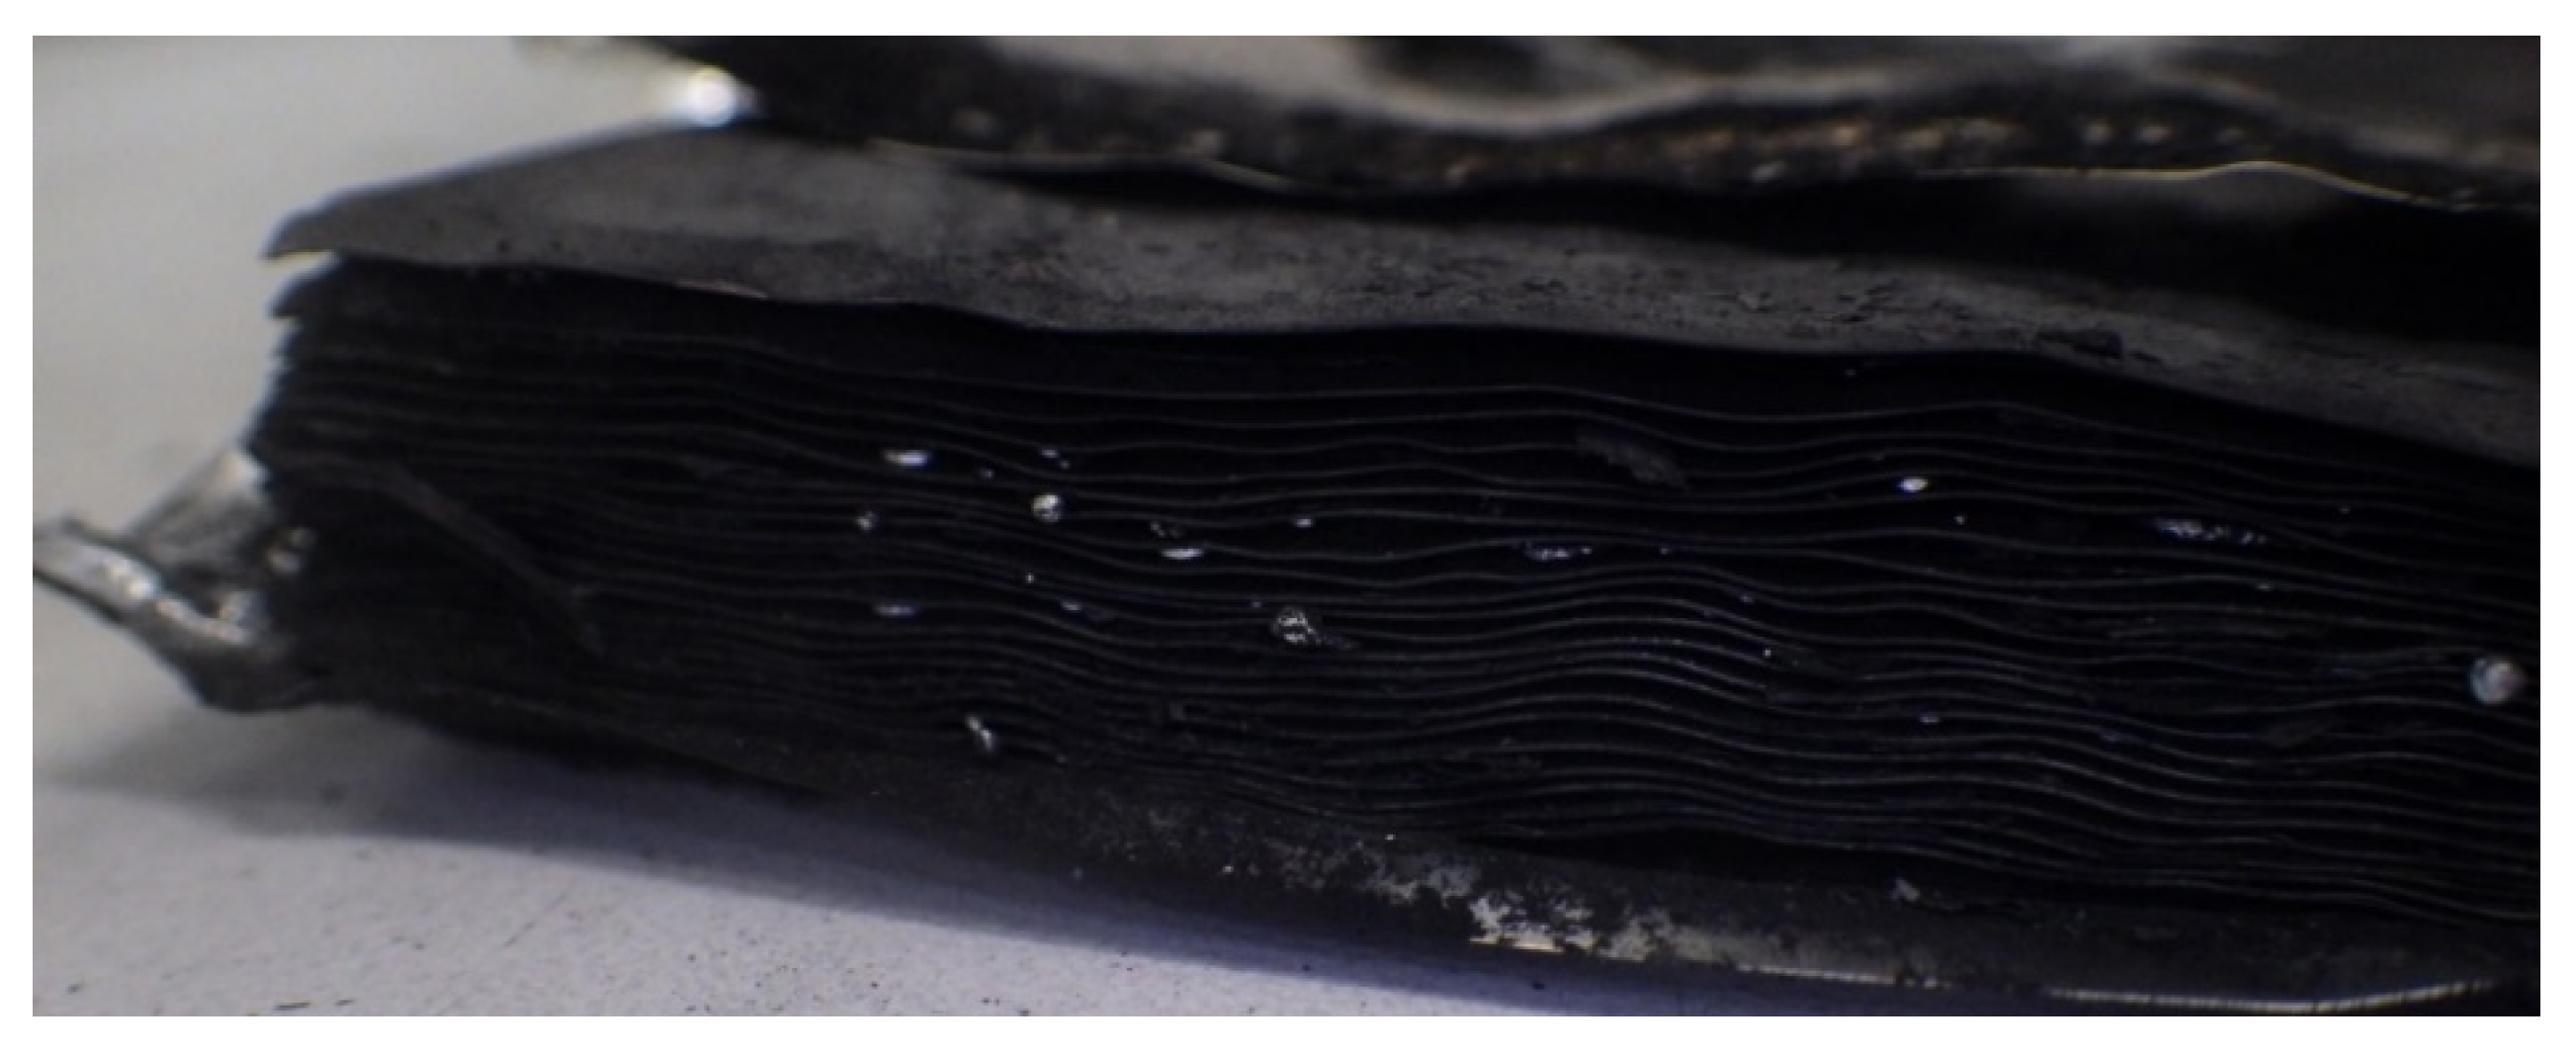
4.6. Optical Observation of the Cell after TR

The pouch foil of the fully charged cell is heavily damaged on the top and bottom side after the TR and the Cu foil is visible on the top. The foil opened on all three welded sides except for the side with the terminals. In Figure 14 the cell stack including metallically glossy droplets are visible. We assume that these are Al droplets from the Al current collector. At the 30% and the 0% SOC cell no visible openings of the pouch foil surface are observed. The pouch is still closed on the sides of the terminals. An opening is observed opposite the terminals.

5. Discussion

The heat triggered TR experiments of a currently used high capacity cell—extracted from a modern mass-produced EV—enables studying hazards and quantify safety relevant parameters from this automotive cell. Since there are few papers available for failing high capacity NMC/LMO cells, the study of those hazards is even more important. Respective papers concentrate on single hazard categories. We concentrate on all five categorized hazards and the safety relevant parameters at different SOC. Table 5 sums up all safety relevant findings of the heat triggered battery failures of the fresh automotive pouch cell at 100%, 30% and 0% SOC.
The fully charged cell can be triggered thermally into TR. At 30% SOC and lower, it is not possible to trigger the cell into TR with the same heat setup (Table 5). If the cell is fully charged during thermal abuse the electrolyte reacts with the lithiated anode after the SEI breakdown [7,17]. Additionally, the stability of the delithiated cathode material is decreased [44]. If the cell is at 0% or 30% SOC the reaction of the lithiated anode with the electrolyte is reduced due to the lack of Li in the anode. No exothermal decomposition of those cells is observed. Increased safety with decreasing SOC is consistent with [12,17,43,44], although referenced literature describes different chemistries and cell components: NCA and LFP [43]; NCA [44]; NMC/LTO [12]. The thermal interactions between several binder materials and anode carbon at 50% and 100% SOC is reported in [17].
Still one question is remaining: Which SOC is the minimum to trigger TR thermally? SOCcrit is defined as the lowest SOC to trigger TR. For this investigated cell it seems to be >30%, but there is no general answer for other cells, especially not for higher energy density cells. The SOC influences hazards, consequently safety and health risks from failing LIB. At failing cells with SOC < SOCcrit the vaporizing electrolyte and the electrolyte decomposition has the risk of flammable, toxic and corrosive gases. At cells with SOC > SOCcrit additional serious risks from heat generation, hot gas and particle emission due to the uncontrollable exothermal reaction need to be considered.

5.1. Hazard Analysis of Failing Automotive Pouch Cells

5.1.1. Heat Generation/Temperature Increase

Temperature sensors on the cell surface show the TR propagation through the cell in 4.28 s. This rapid exothermal reaction and maximal cell temperatures above 700 °C can challenge prevention of TR propagation to neighboring cells and increase resulting risks and damage.
The comparison of the experiments at 100%, 30% and 0% SOC illustrates that the first venting of the investigated cell begins between T c e l l V 1 = 120 °C–130 °C cell surface temperature. The deviations between the measured T c e l l V 1 values may not be connected to the SOC and is explained as a measurement uncertainty. T c e l l V 1 is comparable with the measured temperature rate change (first venting) of overheated NMC pouch cells at about 120 °C plotted by Ren et al. [18]. Ren et al. shows in [17] (Figure 11) that the first venting appeared almost at the same temperature ~120 °C independent of the four different degradation paths and SOH. This would mean that aging effects, like SEI growth and electrolyte consumption, does not influence the first venting. For 50 Ah LMO prismatic metal can cells at our test stand the first venting was observed between T c e l l V 1 = 194 °C–220 °C [19]—far apart from our measured values for the pouch cell. This may indicate the influence of different cell design (metal can), vent design and chemistry (LMO) to T c e l l V 1 .
The next important temperature is the critical temperature T c e l l c r i t , where the temperature rate of the hottest sensor exceeds 10 °C/min, immediately before the full TR. At the fully charged cell T c e l l c r i t = 231 °C is comparable with the defined temperature T2 by Feng et al. [46]. Feng et al. correlated the influence of gravimetric energy density to the maximum reached temperature in [45] (Figure 6). Our result of T c e l l m a x = 715 °C fits the presented maximum temperature of NMC/LMO and NMC cells with similar energy density measured in [18] and [46]. At the TR, the cell temperature increases enormously due to chemical reactions inside the cell mainly produced by NMC degradation and reaction of the cathode and the solvent according to [12,17]. The maximum reached temperature can be significantly higher than 715 °C on the surface of the cell and even more inside the cell itself as demonstrated by [13]. The exothermic decomposition of the delithiated cathode material and the reaction between the released O2 with the solvent is speculated to be the reason for reaching the maximum cell surface temperature [17,22] at the fully charged cell.
Energy density, cathode material and cell design seem to be a main influencing factor for safety relevant and critical temperatures like the first venting as well as the maximum reached cell surface temperature.

5.1.2. Gas Emission

Pressure increase at the first venting does not present any hazards. But the abrupt gas production at the TR and the venting rate of 18.7 L/s can lead to explosion of a battery pack.
The soft pouch packaging ruptured at T c e l l V 1 and the cell started to release gas continuously until the TR happens or the heating is stopped. The 100% SOC cell released 0.14 mol gas before the TR. During the TR, the cell released abrupt additional 2.17 mol of gas within 4 s. The 4 s reaction time is observed in the measured temperature and pressure data at the TR. The characteristic venting rate is 0.8 mol/s (18.7 L/s) is comparable with the published results of Golubkov et al. for heated 50 Ah prismatic LMO cells (0.8 ± 0.3) mol/s [19]. This parameter is a relevant parameter for battery pack design and vent design. For higher energy densities and higher capacities increased maximum gas rates are expected. In addition, the reaction time of 4 s observed by the pouch cell may be different for prismatic metal can cells.
The measured 1.3 L/Ah vent gas for this cell is barely within the literature review of Koch et al. of 1.3 L/Ah–2.5 L/Ah for current state-of-the-art batteries [34] and shows that the presented cell produced less gas compared with cells of similar capacity, energy density and chemistry, but the vent gas emission still needs to be considered as a serious safety risk. Compared to other state-of-the-art automotive pouch and metal can cells analyzed in our test setup, this investigated cell produces less gas per Ah at 100% SOC heat trigger, although no gas reducing electrolyte additives could be found. Roth et al. investigated the vent gas amount at different cathode materials (LCO, NCA, NMC, LFP, LMO) and found that all cells produce about 1.2 L/Ah and that a main factor of predicting gas generation is the volume of the used electrolyte [27]. It needs to be mentioned that more vent gas is expected at the presence of O2 (as measured by Koch et al. as 1.96 L/Ah [34]) and at increasing SOC, like published at overcharge experiments of NCA and LFP cells in [43]. Additional published gas emission values are for NMC 1.2 L/Ah (0.9 Ah NMC) [27], 1.4 L/Ah (2 Ah NMC) [35] and 0.9 L/Ah (2.6 Ah NMC in air) [42]. Deviations from [42] may be explained due to different vent gas amount calculation. The literature source reporting of 2.5 L/Ah is not experimentally determined.
Therefore, we assume that NMC/LMO cells produce between 1.2 L/Ah‒2 L/Ah gas at thermal abuse. If the cell goes into TR (SOC ≥ SOCcrit) main influencing factors seem to be the capacity of the cell, the electrolyte amount, the SOC and present O2. According to Roth et al. cathode material has a minor influence on the gas amount.

5.1.3. Gas Composition below SOCcrit—30% and 0% SOC

Vent gases measured at the 30% and 0% SOC cell and the first venting are dominated by CO2, H2O and electrolyte vapor. At this cell EC (irritant, PAC-1: 30 mg/m3) and DEC (flammable, PAC-1: 2 mg/m3) are the main electrolyte components. Lebedeva et al. state clear that most of the currently used LIB electrolytes are toxic, irritant or harmful in addition to being flammable and may even be carcinogenic [26]. Therefore, the opening of the cell and first venting below SOCcrit need to be handled as a serious risk due to irritant, toxic and flammable composites, especially at the early opening soft pouch packing and the vaporization of electrolyte inside a closed system (pack, garage, tunnel).
Beside significant electrolyte vapors the following gas components were measured at the heated 30% and 0% SOC cell in descending order: CO2, H2O, DEC, CO, H2, C2H4, CH4, C3H8, C2H6, C2H2. There are many studies reporting gas generation from electrolyte at cycling, formation and heating. The main gas components are similar to the measured gas components in this experiment (CO2, CO, C2H4, CH4, C3H8, H2, C2H6 [53,54,55]), although the exact gas concentration depends highly on the used electrolyte composition and the additives.
Gas generated at overheating of cells below SOCcrit are rarely published. Literature on high capacity NMC or NMC/LMO cells concerning the first venting or gassing at cells with SOC < SOCcrit is missing. Literature from small capacity cells: For a 3.35 Ah NCA cell Golubkov et al. presented on 25% SOC 18,650 cells at heating similar main gas compounds: CO2, H2, CH4, C2H4, CO [43] (electrolyte and higher hydrocarbons were not quantified). For a 1 Ah LCO cell with 50% PC, 20% EMC, 15% DEC and 10% DMC Kumai et al. measured before and after cycling tests significant different gas compositions, but also the same main gas components: CH4, CO2, CO, C2H6, C3H8 and C3H6 [23] (H2 and electrolyte compounds were not quantified). The produced gases can also be compared with gases produced at the formation process and cycling of NMC cells: At a NMC(422)/graphite cell with 3:7 EC:EMC and LiPF6 at 100% SOC CO2, C2H4, C2H6, C2H5F, C3H8 and CH4 are measured in decreasing order [53]. Wu et al. investigated at LTO/NMC cells the gas generation at different electrolyte compositions with and without cell formation (SEI) and found significant reduction in CO2 compared to cells with SEI [55].
Possible sources of the identified gases are therefore: for CO2: electrolyte [54] and SEI decomposition [5,55], for CO: EC [54], for C2H4: EC [54], SEI decomposition [5], for C2H6: DEC [54] and DMC [5], for H2: linear carbonates [55], C3H8 and CH4: DMC [55].
It seems that the cathode material plays a minor role for the gas composition at the first venting and at thermal abuse of cells below SOCcrit. The major influence appears to be the electrolyte composition.

5.1.4. Gas Composition—100% SOC

Main components after TR are: 38% CO2, 23% H2, 17% CO, 8% H2O, 6% C2H4, 4% CH4 and electrolyte vapor 3% DEC. TR vent gas consists—apart from CO2 and H2O—of mainly toxic (CO) and flammable (H2, CH4, DEC) gases. Beside the risk of toxic and flammable atmosphere, fire and explosion are serious consequences.
CO2 is the most abundant gas component in the vent gas at the heat triggered TR at 100%, 30% and 0% SOC. At the 100% charged cell a 3.9 times higher CO2 amount was measured than at the 30% SOC cell. The ratio of CO2:CO = 9.3:1 for the 0% SOC and 30% SOC cell and CO2:CO = 2.3:1 for the 100% SOC cell. This observation can change at TR of LIBs with higher energy density, where CO2:CO ratios less than one are possible at TR [34] and more CO than CO2 is produced due to incomplete combustion reaction. Similar CO2:CO ratios of measured gases at heat triggered TR of NMC cells are observed in [40], although the investigated cell is a 1.5 Ah 18,650 cells with DMC:EMC:EC:PC (7:1:1:1) and an energy density of 133 Wh/kg (only CO2, H2, CO, CH4 and C2H4 were analyzed). In addition, perfect comparable main gas concentrations were measured for NMC cells with different electrolyte compositions by Koch et al. The mean substance concentration values over 51 NMC LIBs fit perfectly for the presented results in this study: 37% CO2, 22% H2, 6% C2H4 and 5% CH4 [34] with the difference in CO amount (28% CO by Koch et al.). The different CO amount can be explained by the lower energy density at our NMC/LMO cell. Koch et al. did not quantify gaseous H2O and electrolyte [34]. For different cathode materials similar gases, but different gas concentrations, were observed [40]. If the same cell chemistry is analyzed, but different triggers are used (like overcharge or nail penetration instead of overtemperature), different preferred chemical reactions take place ending up in different gas compositions [32].
As stated by Zhang et al. in literature no more than 10 gas species in the vent gas are quantified except for their own study [47]. Thus, in this study, 18 possible gas compounds during battery failures are presented. Additional gases identified by other authors, but not listed in this study, for instance C3H6 [34] and other higher hydrocarbons (less than 1.7% of the total gas emission according to [47]), were not identified. The deviations may be explained by different cell chemistry, different reaction probability, the test setup and the gas analysis methods. Commonly used electrolytes as EC, DEC, DMC and EMC absorb at similar wavenumber regions and can only be identified clearly at certain wavenumber regions with the FTIR.
Although for the presented experiments no hydrogen fluoride (HF) could be detected, HF is expected to be released by the cell in small amounts [32,36] and to undergo further reactions with the materials inside the reactor, the analysis region and the released particles. Beside the HF production, F may also remain in the cell itself and LiF can be formed. For another aged 18 Ah cell with NMC/LTO chemistry in our test setup, 66 ppm (0.396 mmol) HF were measured [37].
Adding up all quantified gas components at the presented results does not sum up to 100% in total. Possible reasons of the deviation are the sum of uncertainties of each gas component and gases which could not be identified/measured in this experiment.
In addition to the listed gases produced at the venting of cells with SOC < SOCcrit, at TR an increase of especially H2, CO2 and CO were observed. Though the total amount of measured electrolyte at the fully charged cell is reduced in comparison to the cell at 30% SOC (Figure 11), parts of the vent gas result from decomposing parts of 44 g EC, 59 g DEC, 3.7 g DMC according to [7,56,57] and result in mainly CO2 and H2O. Further sources for the gases are for H2: the reaction of binder material and Li in the anode [42]; for CO2: oxidation of the electrolyte on the negative electrode surface and LiPF6 and further reaction with the released O2 of the decomposing cathode [5,21,27,54].
Concluding, the vent gas composition of a failing LIB may be highly sensitive to the SOC, the failure mode/trigger, the used electrolyte composition (especially for cells with SOC < SOCcrit), the chemistry and the energy density. This NMC/LMO cell produces similar gases and concentrations as published NMC cells.

5.1.5. Particle Emission

The ejected particles contain elements that are potentially toxic and could act as an ignition source of the emitted burnable gasses, due to their high temperature [4,38]. Furthermore, most of the particles are smaller than 10 μm2 and can therefore be inhaled deeply into the lungs [58].
Challenges to the particle analysis were the sampling method and the evaluation of the exact particle size and composition. Sampling is the bottleneck of any analytic method and may compromise the results, even when using a measurement method with high precision. During sampling, the material of interest should not be altered, and the sample should be representative. Several methods were tested and are described in [51]. However, the jet of air sampling method used in the end provides a uniform distribution of the particles on the carbon tape used in the SEM measurements, allowing the individual analysis of the particles regarding their size and composition. It has to be mentioned that the air sampling method is selective concerning the dimensions of the particles, but we assume that it is representative for these particles, which are relevant concerning hazards during inhalation.
The particles contain elements that are potentially toxic for humans including Al, Ni, F. Those elements were also reported in [38]. Thus, safety equipment for people handling cells after TR is important such as particle masks and protective clothing. However, the measured major particle size (<10 μm2) and the reported mass loss does not match with the observations of [38,47]. Zhang et al. show in [38] for a fully charged metal can cell particle matter account for 11.20% of the cell mass. Measured particle sizes were less than 0.85 mm at nearly 45% of particles. In [47] Zhang et al. report a mass loss of 28.53% at a 50 Ah cell due to gas and particle emission with a near 90% of the particles with a size of 0.5 mm in diameter. Zhang et al. measures lower maximum cell surface temperature (438 °C) [47]. The deviation in particle size may be explained due to differences in the cell design (metal can versus pouch), the chemical composition, the sample preparation techniques and the analysis methods.
In [38,47] four different methods were used for the characterization of settleable particulate matter in the chamber, where the thermal runaway was investigated. In fact, very precise methods were applied, which have the drawback, that not one and the same sample can be used for each method. This is a great advantage of SEM combined with EDX, because after getting a specimen holder with disjunct fixated (carbon tape) particles the number, morphology, size and elemental composition (from the element boron (B) to uranium (U)) can be measured using only one methodical approach on the same sample. Hence a good statistic can be achieved, and even individual information of each particle is enabled. Additionally, it has to be highlighted that the only alteration of the sample is the application of a thin carbon layer on the particles, which is fundamental for imaging without charging, but is not compromising the elemental assessment. Thus, using SEM/EDX no heating of the material or dilution in a supporting liquid is needed as is prerequisite at several chemical or elemental analytical methods.
Beside elemental analysis using EDX even chemical analysis via Raman spectroscopy would help to identify particles. Especially organic materials (e.g., carbon rich particles) could be assessed. A new system called RISE (Raman Imaging and SEM) combines high resolution imaging using an SEM with chemical analysis by an integrated Raman microscope [59]. Thus, correlative microscopy combining morphologic, elemental and chemical investigation could be realized. In this special case the application of a carbon layer would be obstructive since it would mask the signal for Raman measurements. However, the used SEM enables a special vacuum mode (Variable Pressure), where imaging without charging and subsequent EDX and Raman analysis can be realized.

5.1.6. Mass Reduction

At the TR, the investigated cell reduces the initial mass by 43% due to gas and particle emission. This result is comparable with pouch and hard case cells at 100% SOC overtemperature experiments by [34] reporting mass loss of 15–60% for NMC cells with 20–81 Ah. Zhang et al. measured significant lower mass loss (29%) for overheated prismatic NMC cell [47]. The mass loss of the 0% and 30% charged cells after the experiment after-treatment (15%) is comparable with the assumed amount of electrolyte (14%). Therefore, it is assumed that the mass loss of the 0% and 30% charged cell is mainly due electrolyte vaporization and decomposition of SEI, electrolyte and synthetic material.
The quantified mass reduction seems to depend on the SOC, the energy content of the cell and the cell design (metal can prismatic or cylindrical versus pouch cell).

5.2. Forecast for Failing Behavior of Future Cells

Cells with higher energy density than the investigated cell, which are currently planned for the next generation of EVs, may behave differently and it is possible that a TR even below 30% SOC can be triggered by heat. In TR experiments with different cell generations and increasing gravimetric energy density at our test bench, the failing event results in more heat, higher mass loss, more gas and the gas composition changes towards increased toxic components (CO) compared to the presented results as indicated in [34]. New cell technology with increased Ni-content in NMCs are also supposed to have a reduced thermal stability and therefore failing behavior is supposed to change [47].
For comparability of experiments it is important to highlight influencing factors like the cell capacity, the SOC, the SOH, the energy density and the chosen TR trigger for each experiment. It is expected, that for instance the impact of overcharge triggered cells is higher than in heat triggered cells: gas amount and toxicity (CO) increase with SOC [33].

5.3. Forecast for Failing Behavior of Aged Cells

Aged cells (without Li plating) with increased SEI thickness and decreased electrolyte content are supposed to have a decreased heat generation and gas emission as observed by [18] and [35]. For pouch cells the first vent was observed at the same mean surface temperature for aged cells as for fresh cells [18], in contrast to a different cell design in [35], where the first venting started at a lower temperature at the investigated cylindrical cell. Further investigations on the first venting at different cell designs need to be done for early failure detection.

5.4. Recommended Failure Detection

As a result of the presented hazards and risks, special safety equipment and failure detection methods are recommended. For instance, temperature, pressure and gas monitoring is recommended at battery applications, especially inside the EV battery pack. This may enable failure detection at an early stage, as aimed by EVS–GTR. An unwanted opening of the cell could be detected with the proposed monitoring. Early failure detection is gaining more importance due to increasing cell energy density.

6. Conclusions

A comprehensive hazard analysis of modern automotive high capacity NMC/LMO—graphite pouch cells was performed at three overtemperature TR experiments. The investigated cells are currently used in commercially available mass-produced EVs.
In the first experiment the cell is charged to 100%, in the second to 30% and in the third to 0% SOC. The results confirm the influence of the SOC on the failing behavior of the LIB. The fully charged cell could be triggered into TR, but the cells with SOC ≤ 30% could not. The experiments show that there are serious risks (safety and health) at failing state-of-the-art Li-ion cells resulting from electrolyte vapor, generated heat, gas and particles at TR as toxic and flammable gas, explosion and fire. Safety relevant hazards are electrolyte vaporization, heat generation, gas emission including gas rate, gas composition including electrolyte and particle emission including size and content of the particles.
Main findings of the investigated automotive cells are:
  • The first venting is measured at 120–130 °C cell surface temperature independent of the SOC.
  • At the 30% and 0% SOC cell:
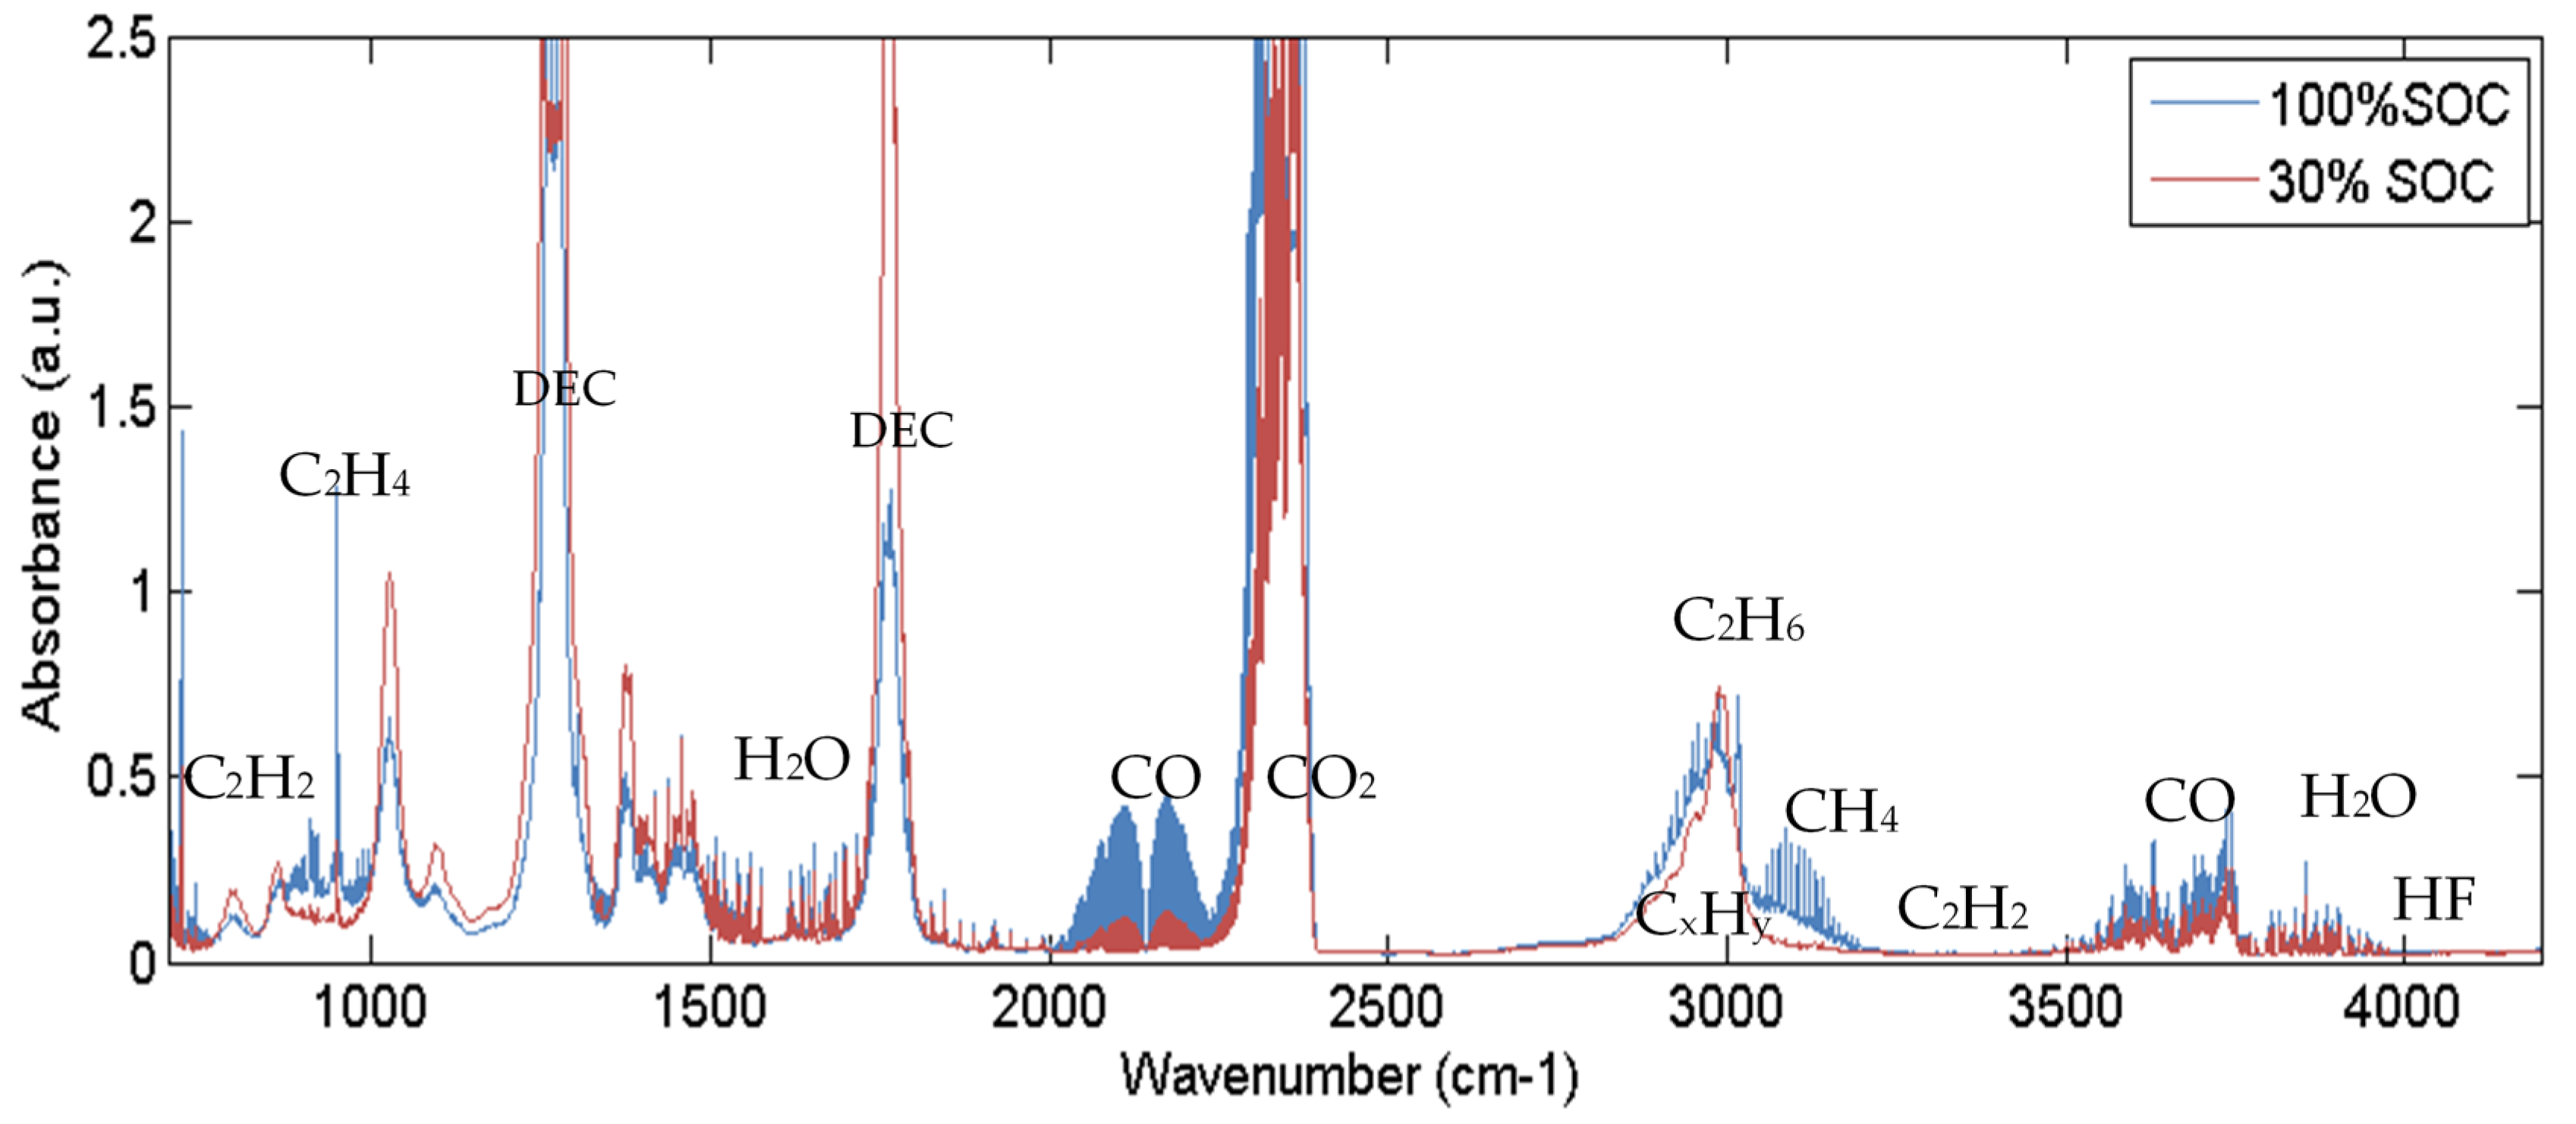
    The main gas components are after the first venting and constant gas production until the heating is stopped in descending order CO2, DEC, H2O, CO, H2, C2H4, CH4, C3H8.
    One presented hazard is electrolyte vaporization. Commonly used electrolyte components such as EC, DEC, DMC, EMC in an unsealed cell are critical due to the consequential irritant, toxic, cancerogenic and flammable atmosphere. At this cell EC (irritant, PAC-1: 30 mg/m3) and DEC (flammable, PAC-1: 2 mg/m3) are the main electrolyte components. It is important to address this hazard especially in large traction battery EV applications, where significant amounts of electrolyte may vaporize inside a closed system (pack, garage, tunnel).
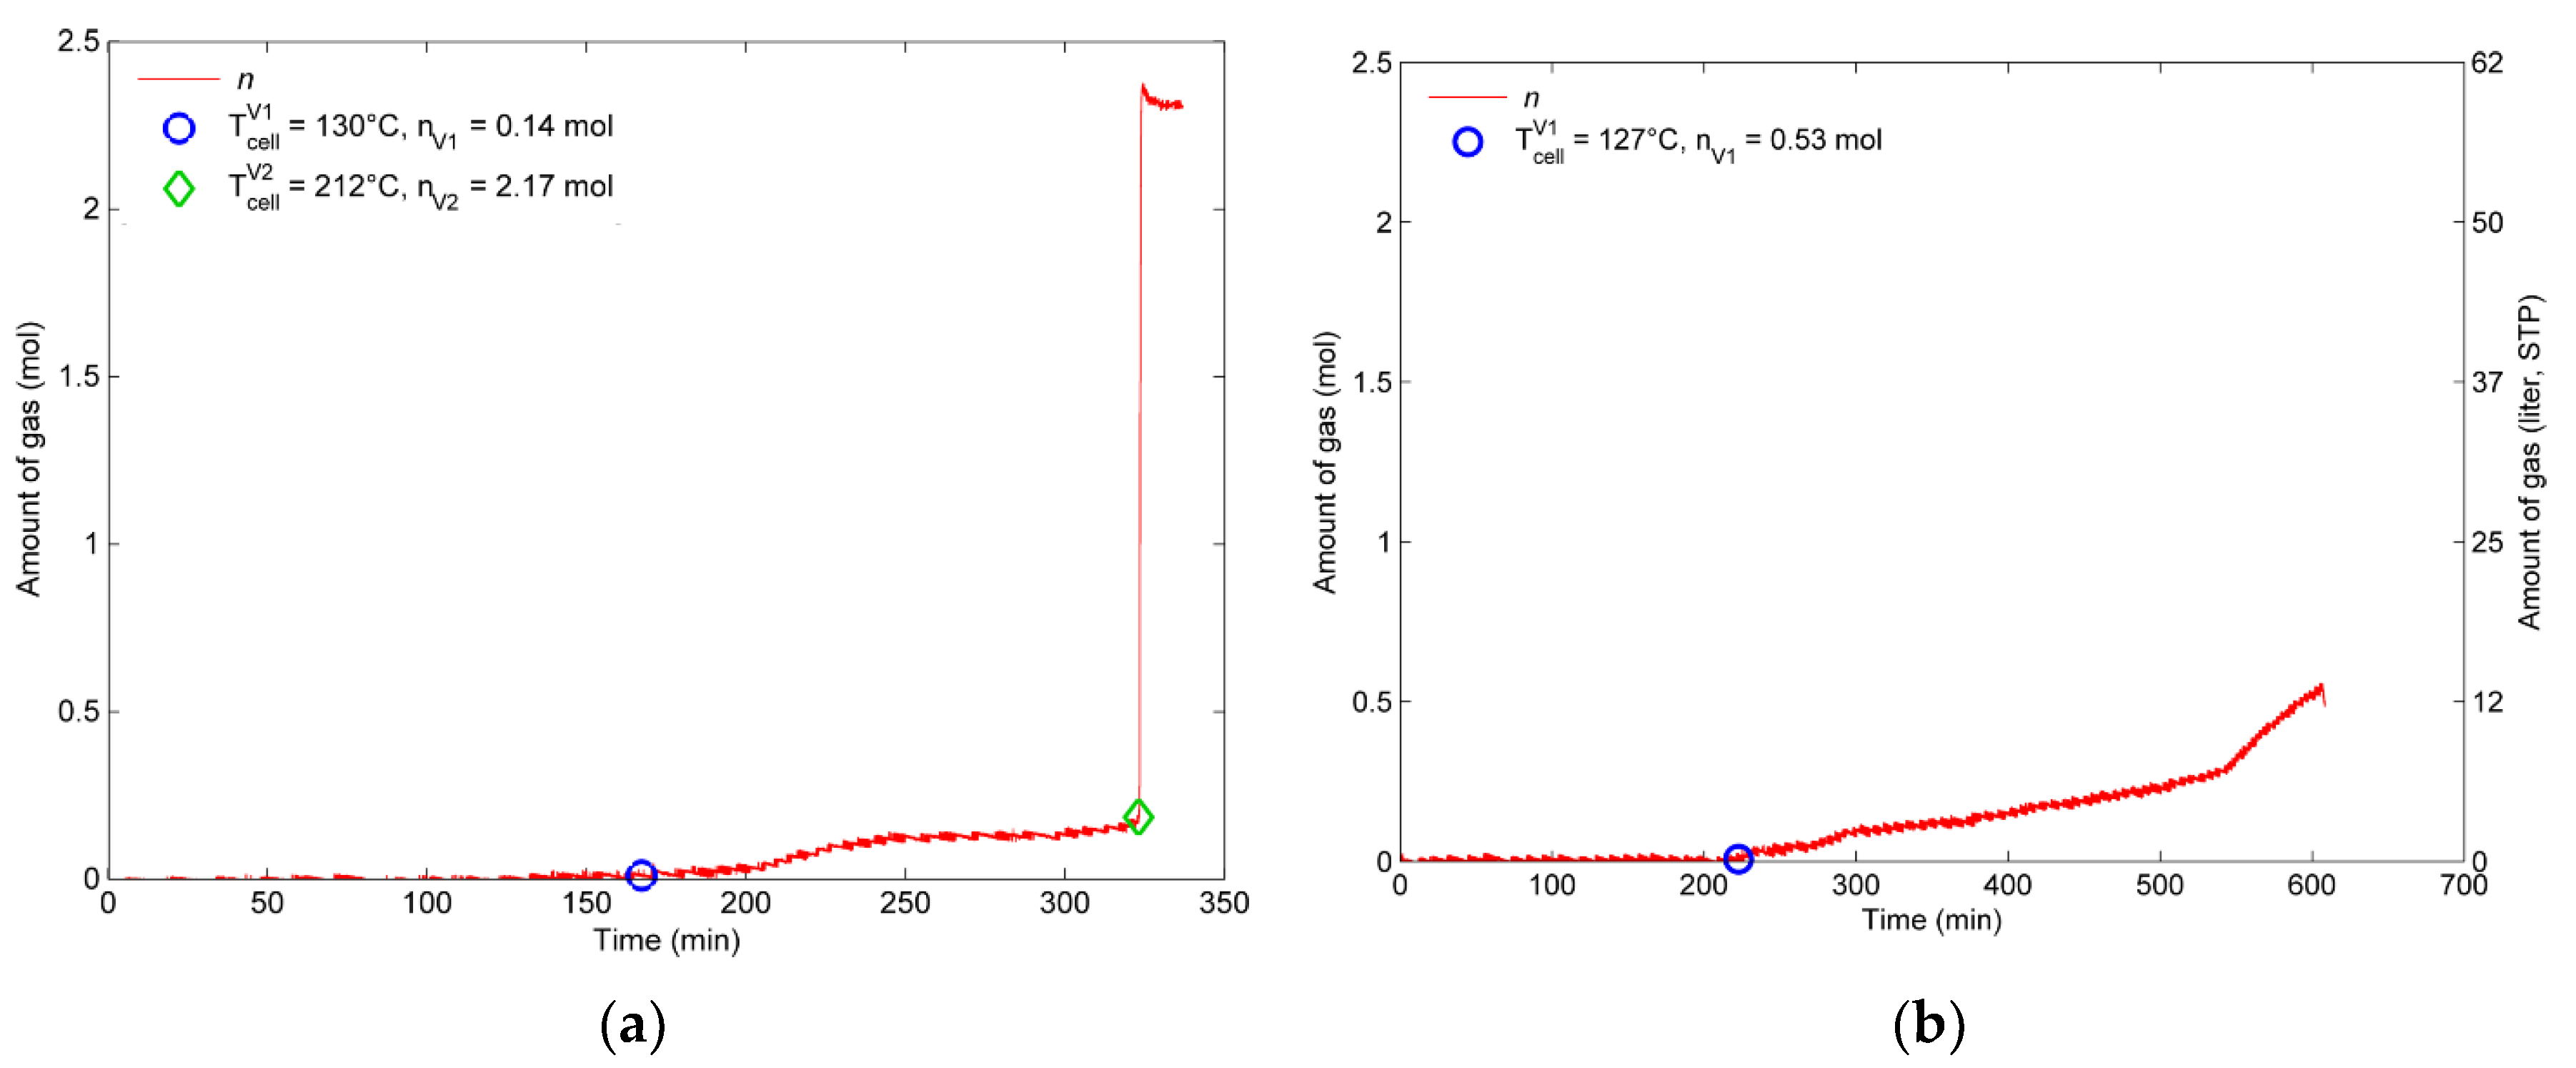
  • At the fully charged (100% SOC) pouch cell two venting stages were observed: A first venting and a second venting (TR). The second venting starts above average cell temperature of 212 °C. The TR has the following hazards and consequences, which end up as safety and health risks:
    Enormous heat is generated by the cell, the cell surface temperatures increased above 700 °C. The main exothermic reaction developed to a rapid TR when the hottest measured part of the cell reached 231 °C. Within 4.28 s the TR propagated through the cell. This high surface temperature can lead to TR propagation to neighboring cells and irreversible damage of the battery pack.
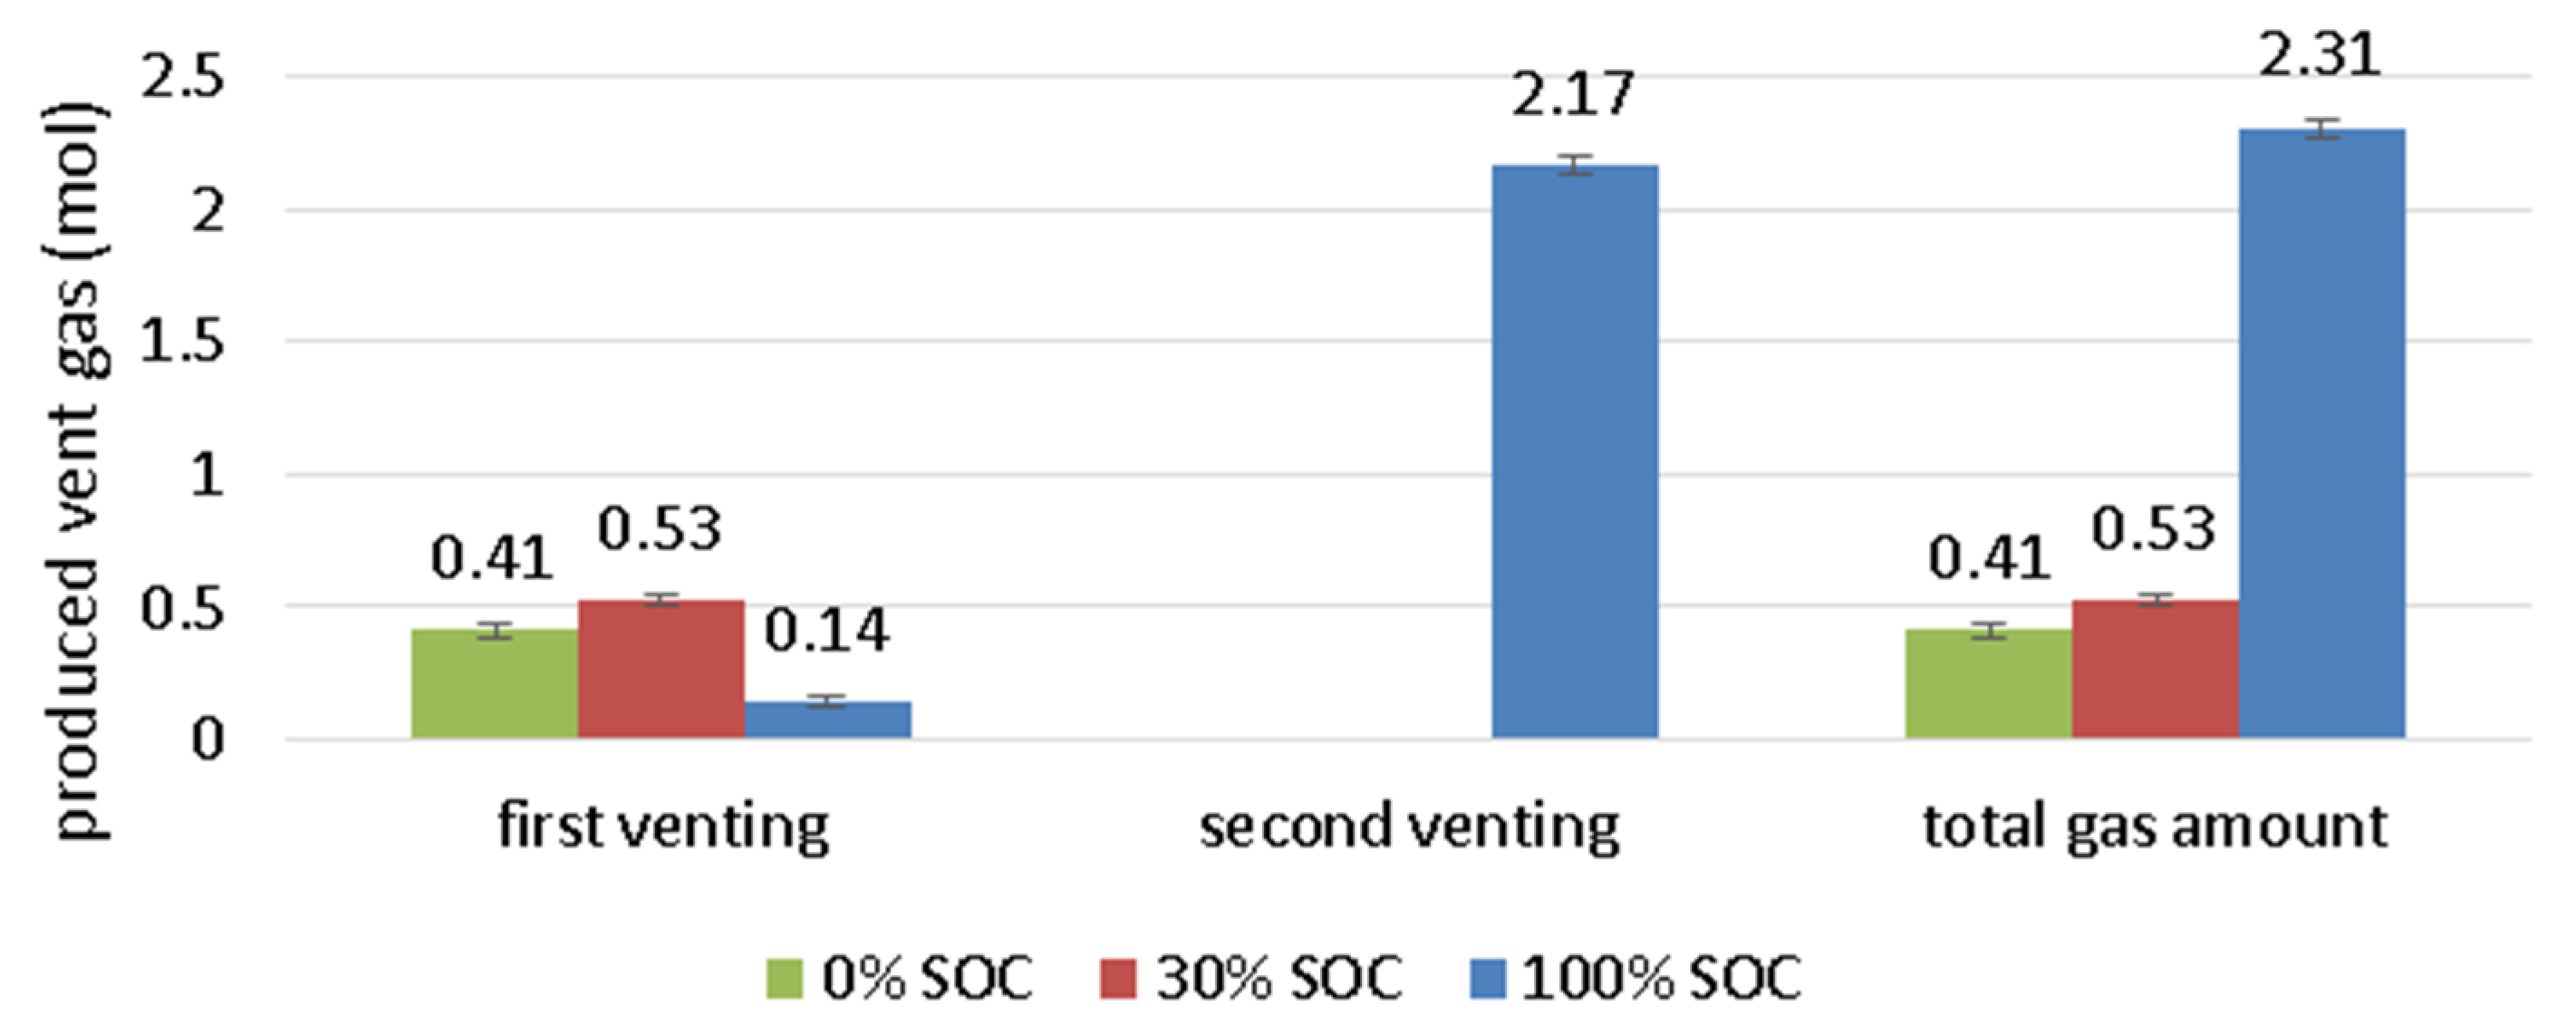
    Overall, 2.31 mol (57 L, 1.3 L/Ah) of gas is produced. The cell released 0.14 mol before the TR. During the TR, the cell released in 4 s additional 2.17 mol with a characteristic rate of 0.8 mol/s (18.7 L/s). 50% of the gas is produced in 1.4 s. The abrupt pressure increase at the TR is a serious risk inside a closed volume.
    The cell mass reduces by 43% of the initial mass. This mass reduction can be explained as the sum of released gas and ejected particles at TR.
    The main gas components are: 38% CO2, 23% H2, 17% CO, 8% H2O, 6% C2H4, 4% CH4 and 3% electrolyte vapor (DEC). The measured gas components are about 20% of the lost cell mass during TR and 9% of the initial cell mass. Toxic (CO) and flammable (H2, CH4, DEC, etc.) gas components are dangerous when entering the passenger compartment.
    A large number of ejected particles are smaller than 10 μm2. Novel nondestructive sampling and analysis methods were used to evaluate the particle parameters: The smallest analyzed particles have an area of 0.1 µm2, thus a circle equivalent diameter of roughly 6 nm. A total of twelve elements were detected in the particles, including elements like Al, Ni or F. These ejected hot particles (~35% of the initial cell mass) may ignite the vent gas, are carcinogenic and respirable for humans.
  • The NMC/LMO cell is comparable to results of failing NMC cells concerning heat generation (max. reached temperature), gas emission and main gas components. Although, the exact gas composition is highly sensitive to the electrolyte mixture.
To reach an acceptable level of safety in EVs a comprehensive analysis of hazards is very important. In order to define testing standards, the battery hazard influencing factors (such as energy content of the cell, chemistry, the failure case/trigger, cell design, SOC and SOH) must be characterized clearly. The five presented hazards addressed in this study should also be considered in future work for different cell types. We recommend to include in the quantification of safety relevant parameters such as the maximum reached cell surface temperature, the amount if produced vent gas, the venting rate, the composition of the produced gases at the first venting and the TR including electrolyte vapor and the size and composition of the produced particles to cover the most significant hazards at battery failures.
Our future work is aimed to evaluate the influence of different triggers, cell design (pouch versus prismatic metal can) and aging on the failing behavior of large automotive Li-ion cells with higher capacity than the presented sample. To guarantee safety at LIB applications it is important to be aware of potential safety and health risks originated from failing cells.

Supplementary Materials

The following are available online at https://www.mdpi.com/2313-0105/6/2/30/s1, Document S1: SEM images of particle classes.

Author Contributions

Conceptualization, C.E.; methodology for gas analysis, C.E.; methodology for particle analysis, E.G., A.Z., M.N., C.E.; software, C.E.; validation, C.E., A.W.G.; formal analysis, C.E., A.W.G., E.G.; investigation, C.E.; data curation, C.E., E.G.; writing—original draft preparation, C.E.; writing—review and editing, A.W.G., A.F., M.N., A.Z., E.G., E.E.; visualization, C.E., A.W.G., E.G.; supervision, A.F.; All authors have read and agreed to the published version of the manuscript.

Funding

The publication was written at VIRTUAL VEHICLE Research GmbH in Graz and is partially funded by the COMET K2—Competence Centers for Excellent Technologies Program of the Federal Ministry for Transport, Innovation and Technology (BMVIT), the Federal Ministry for Digital and Economic Affairs (BMDW), the Austrian Research Promotion Agency (FFG), the Province of Styria and the Styrian Business Promotion Agency (SFG). The study shows the results of the FFG project SafeBattery. The K-project SafeBattery is funded by the BMVIT, BMDW, Austria and Land Steiermark within the framework of the COMET—Competence Centers for Excellent Technologies program. The COMET program is administered by the FFG.

Acknowledgments

Special thanks to the institution ICTM for the cooperation in the project SafeBattery, particularly Ilie Hanzu and Petra Kaschnitz for the analysis of the electrolyte of the investigated cell. Special thanks to the Institute of Electron Microscopy and Nanoanalysis (FELMI) of Graz University of Technology for the cooperation at the particle analysis in the course of Eva Gassers Master’s thesis, especially to Werner Grogger. The setup of the electron microscope Sigma 300 VP was enabled by the project “HRSM-Projekt ELMINet Graz — Korrelative Elektronenmikroskopie in den Biowissenschaften” (i.e., a cooperation within “BioTechMed-Graz”, a research alliance of the University of Graz, the Medical University of Graz and Graz University of Technology), which was financed by the Austrian Federal Ministry of Education, Science and Research. The combination with the EDX detector could be realized by the project “Innovative Materialcharakterisierung” (SP2016-002-006), which is part of “ACR Strategisches Projektprogramm 2016” of the Austrian Cooperative Research (ACR), where a support by the Austrian Federal Ministry for Digital and Economic Affairs is to be mentioned. The thermal runaway test stand was developed with technical and financial support by AVL List GmbH.

Conflicts of Interest

The authors declare no conflict of interest. The funders had no role in the design of the study; in the collection, analyses or interpretation of data; in the writing of the manuscript or in the decision to publish the results.

Abbreviations

LIBLithium-ion batteryEVElectric vehicle
TRThermal runawaySOCState-of-charge
BEVBattery electric vehicleHEVHybrid electric vehicles
ECEthylene carbonateDECDiethylene carbonate
DMCDimethyl carbonateEMCEthyl methyl carbonate
SEMScanning electron microscopeEDXEnergy dispersive X-ray spectroscopy
FTIRFourier-transform infrared (spectroscopy)BSEBackscattered electron
GCGas chromatographSESecondary electrons
ppmParts per millionPSDParticle size distribution
SOHState-of-healthICIon chromatography
SEISolid electrolyte interfaceLODLimit of detection
ICTMInstitute of Chemistry and Technology of Materials, Graz University of TechnologyFELMIInstitute of Electron Microscopy and Nanoanalysis, Graz University of Technology

References

  1. Wagner, I. 2017—Statista-Statistic_id264754_Worldwide-Vehicle-Sales-by-Propulsion-Technology-2017-2030 (1).pdf. Statista. 2017. Available online: https://www.statista.com/statistics/264754/worldwide-vehicle-sales-by-propulsion-technology-2025/ (accessed on 2 March 2020).
  2. Ahlswede, A. 2020—Statista-Statistic_id681259_Absatz-von-Elektroautos-in-Ausgewaehlten-Maerkten-Weltweit-Bis-2019.pdf. Statista. 2020. Available online: https://de.statista.com/statistik/daten/studie/681259/umfrage/absatz-von-elektroautos-in-ausgewaehlten-maerkten-weltweit/ (accessed on 2 March 2020).
  3. Sun, P.; Bisschop, R.; Niu, H.; Huang, X. A Review of Battery Fires in Electric Vehicles; Springer: New York, NY, USA, 2020. [Google Scholar] [CrossRef]
  4. Pfrang, A.; Kriston, A.; Ruiz, V.; Lebedeva, N.; di Persio, F. Safety of Rechargeable Energy Storage Systems with a Focus on Li-Ion Technology; Elsevier Inc.: Amsterdam, The Netherlands, 2017. [Google Scholar] [CrossRef]
  5. Spotnitz, R.; Franklin, J. Abuse behavior of high-power, lithium-ion cells. J. Power Sources 2003, 113, 81–100. [Google Scholar] [CrossRef]
  6. Bandhauer, T.M.; Garimella, S.; Fuller, T.F. A Critical Review of Thermal Issues in Lithium-Ion Batteries. J. Electrochem. Soc. 2011, 158, R1–R25. [Google Scholar] [CrossRef]
  7. Wang, Q.; Sun, J.; Yao, X.; Chen, C. Thermal Behavior of Lithiated Graphite with Electrolyte in Lithium-Ion Batteries. J. Electrochem. Soc. 2006, 153, A329. [Google Scholar] [CrossRef]
  8. Blomgren, G.E. The development and future of lithium ion batteries. J. Electrochem. Soc. 2017, 164, A5019–A5025. [Google Scholar] [CrossRef] [Green Version]
  9. Yang, H.; Zhuang, G.V.; Ross, P.N. Thermal stability of LiPF6 salt and Li-ion battery electrolytes containing LiPF6. J. Power Sources 2006, 161, 573–579. [Google Scholar] [CrossRef] [Green Version]
  10. Jhu, C.Y.; Wang, Y.W.; Wen, C.Y.; Shu, C.M. Thermal runaway potential of LiCoO2 and Li(Ni1/3Co1/3Mn1/3)O2 batteries determined with adiabatic calorimetry methodology. Appl. Energy 2012, 100, 127–131. [Google Scholar] [CrossRef]
  11. Orendorff, C.J.; Lamb, J.; Steele, L.A.M.; Spangler, S.W.; Langendorf, J. Quantification of Lithium-Ion Cell Thermal Runaway Energetics; Sandia Report; Sandia National Laboratories (SNL-NM): Albuquerque, NM, USA, 2016; p. 0486.
  12. Huang, P.; Wang, Q.; Li, K.; Ping, P.; Sun, J. The combustion behavior of large scale lithium titanate battery. Sci. Rep. 2015, 5, 7788. [Google Scholar] [CrossRef] [Green Version]
  13. Feng, X.; Fang, M.; He, X.; Ouyang, M.; Lu, L.; Wang, H.; Zhang, M. Thermal runaway features of large format prismatic lithium ion battery using extended volume accelerating rate calorimetry. J. Power Sources 2014, 255, 294–301. [Google Scholar] [CrossRef]
  14. Finegan, D.P.; Scheel, M.; Robinson, J.B.; Tjaden, B.; Hunt, I.; Mason, T.J.; Millichamp, J.; Di Michiel, M.; Offer, G.J.; Hinds, G.; et al. In-operando high-speed tomography of lithium-ion batteries during thermal runaway. Nat. Commun. 2015, 6, 6924. [Google Scholar] [CrossRef]
  15. Harris, S.J.; Timmons, A.; Pitz, W.J. A combustion chemistry analysis of carbonate solvents used in Li-ion batteries. J. Power Sources 2009, 193, 855–858. [Google Scholar] [CrossRef]
  16. Mikolajczak, C.; Michael Kahn, P.; White, K.; Thomas Long, R. Lithium-Ion Batteries Hazard and Use Assessment Final Report; Fire Protection Research Foundation: Quincy, MA, USA, 2011. [Google Scholar]
  17. Roth, E.P.; Doughty, D.H.; Franklin, J. DSC investigation of exothermic reactions occurring at elevated temperatures in lithium-ion anodes containing PVDF-based binders. J. Power Sources 2004. [Google Scholar] [CrossRef]
  18. Ren, D.; Hsu, H.; Li, R.; Feng, X.; Guo, D.; Han, X.; Lu, L.; He, X.; Gao, S.; Hou, J.; et al. A comparative investigation of aging effects on thermal runaway behavior of lithium-ion batteries. eTransportation 2019, 2, 100034. [Google Scholar] [CrossRef]
  19. Golubkov, A.W.; Planteu, R.; Krohn, P.; Rasch, B.; Brunnsteiner, B.; Thaler, A.; Hacker, V. Thermal runaway of large automotive Li-ion batteries. RSC Adv. 2018, 8, 40172–40186. [Google Scholar] [CrossRef] [Green Version]
  20. Wang, Q.; Ping, P.; Zhao, X.; Chu, G.; Sun, J.; Chen, C. Thermal runaway caused fire and explosion of lithium ion battery. J. Power Sources 2012, 208, 210–224. [Google Scholar] [CrossRef]
  21. Gachot, G.; Ribière, P.; Mathiron, D.; Grugeon, S.; Armand, M.; Leriche, J.B.; Pilard, S.; Laruelle, S. Gas chromatography/mass spectrometry as a suitable tool for the li-ion battery electrolyte degradation mechanisms study. Anal. Chem. 2011, 83, 478–485. [Google Scholar] [CrossRef]
  22. Dahn, J.R.; Fuller, E.W.; Obrovac, M.; von Sacken, U. Thermal stability of LixCoO2, LixNiO2 and λ-MnO2 and consequences for the safety of Li-ion cells. Solid State Ion. 1994, 69, 265–270. [Google Scholar] [CrossRef]
  23. Kumai, K.; Miyashiro, H.; Kobayashi, Y.; Takei, K.; Ishikawa, R. Gas generation mechanism due to electrolyte decomposition in commercial lithium-ion cell. J. Power Sources 1999, 81–82, 715–719. [Google Scholar] [CrossRef]
  24. Kenichiroh, K. Journey to a New Regulatory Option. OICA Submission to IWG for GTR 20, Phase 2 2019(IWG#19). pp. 1–31. Available online: https://wiki.unece.org/download/attachments/86311372/EVS19-E1TP-0300 %5BOICA%5DJourney to a New Regulatory Option.pdf?api=v2 (accessed on 23 February 2020).
  25. Nedjalkov, A.; Meyer, J.; Köhring, M.; Doering, A.; Angelmahr, M.; Dahle, S.; Sander, A.; Fischer, A.; Schade, W. Toxic Gas Emissions from Damaged Lithium Ion Batteries—Analysis and Safety Enhancement Solution. Batteries 2016, 2, 5. [Google Scholar] [CrossRef]
  26. Lebedeva, N.P.; Boon-Brett, L. Considerations on the Chemical Toxicity of Contemporary Li-Ion Battery Electrolytes and Their Components. J. Electrochem. Soc. 2016, 163, A821–A830. [Google Scholar] [CrossRef]
  27. Roth, E.P.; Orendorff, C.J. How electrolytes influence battery safety. Electrochem. Soc. Interface 2012, 21, 45–49. [Google Scholar] [CrossRef]
  28. Larsson, F. Assessment of Safety Characteristics for Li-Ion Battery Cells by Abuse Testing; Chalmers University of Technology: Göteborg, Sweden, 2014. [Google Scholar]
  29. Hollmotz, L.; Hackmann, M. Lithium Ion Batteries for Hybrid and Electric Vehicles—Risks, Requirements and Solutions out of the Crash Safety Point of View; 11–0269; International Technical Conference on the Enhanced Safety of Vehicles (ESV): Washington, DC, USA, 2011.
  30. Feng, X.; Ouyang, M.; Liu, X.; Lu, L.; Xia, Y.; He, X. Thermal runaway mechanism of lithium ion battery for electric vehicles: A review. Energy Storage Mater. 2018, 10, 246–267. [Google Scholar] [CrossRef]
  31. Larsson, F.; Andersson, P.; Mellander, B.E. Lithium-Ion Battery Aspects on Fires in Electrified Vehicles on the Basis of Experimental Abuse Tests. Batteries 2016, 2, 9. [Google Scholar] [CrossRef]
  32. Fernandes, Y.; Bry, A.; de Persis, S. Identification and quantification of gases emitted during abuse tests by overcharge of a commercial Li-ion battery. J. Power Sources 2018, 389, 106–119. [Google Scholar] [CrossRef]
  33. Somandepalli, V.; Marr, K.; Horn, Q. Quantification of Combustion Hazards of Thermal Runaway Failures in Lithium-Ion Batteries. SAE Int. J. Altern. Powertrains 2014, 3, 98–104. [Google Scholar] [CrossRef]
  34. Koch, S.; Fill, A.; Birke, K.P. Comprehensive gas analysis on large scale automotive lithium-ion cells in thermal runaway. J. Power Sources 2018, 398, 106–112. [Google Scholar] [CrossRef]
  35. Zhao, C.; Sun, J.; Wang, Q. Thermal runaway hazards investigation on 18650 lithium-ion battery using extended volume accelerating rate calorimeter. J. Energy Storage 2020, 28, 101232. [Google Scholar] [CrossRef]
  36. Larsson, F.; Andersson, P.; Blomqvist, P.; Mellander, B.E. Toxic fluoride gas emissions from lithium-ion battery fires. Sci. Rep. 2017, 7, 10018. [Google Scholar] [CrossRef]
  37. Essl, C.; Golubkov, A.W.; Planteu, R.; Rasch, B.; Fuchs, A. Transport of Li-Ion Batteries: Early Failure Detection by Gas Composition Measurements. In Proceedings of the 7th Transport Research Arena (TRA), Vienna, Austria, 16–19 April 2018. [Google Scholar] [CrossRef]
  38. Zhang, Y.; Wang, H.; Li, W.; Li, C.; Ouyang, M. Size distribution and elemental composition of vent particles from abused prismatic Ni-rich automotive lithium-ion batteries. J. Energy Storage 2019, 26, 100991. [Google Scholar] [CrossRef]
  39. Feng, X.; Zheng, S.; Ren, D.; He, X.; Wang, L.; Liu, X.; Li, M.; Ouyang, M. Key characteristics for thermal runaway of Li-ion batteries. Energy Procedia 2019, 158. [Google Scholar] [CrossRef]
  40. Golubkov, A.W.; Fuchs, D.; Wagner, J.; Wiltsche, H.; Stangl, C.; Fauler, G.; Voitic, G.; Thaler, A.; Hacker, V. Thermal-runaway experiments on consumer Li-ion batteries with metal-oxide and olivin-type cathodes. RSC Adv. 2014, 4, 3633–3642. [Google Scholar] [CrossRef] [Green Version]
  41. Nagasubramanian, G.; Fenton, K. Reducing Li-ion safety hazards through use of non-flammable solvents and recent work at Sandia National Laboratories. Electrochim. Acta 2013, 101, 3–10. [Google Scholar] [CrossRef]
  42. Diaz, F.; Wang, Y.; Weyhe, R.; Friedrich, B. Gas generation measurement and evaluation during mechanical processing and thermal treatment of spent Li-ion batteries. Waste Manag. 2019, 84, 102–111. [Google Scholar] [CrossRef] [PubMed]
  43. Golubkov, A.W.; Scheikl, S.; Planteu, R.; Voitic, G.; Wiltsche, H.; Stangl, C.; Fauler, G.; Thaler, A.; Hacker, V. Thermal runaway of commercial 18650 Li-ion batteries with LFP and NCA cathodes—Impact of state of charge and overcharge. RSC Adv. 2015, 5, 57171–57186. [Google Scholar] [CrossRef] [Green Version]
  44. Perea, A.; Paolella, A.; Dubé, J.; Champagne, D.; Mauger, A.; Zaghib, K. State of charge influence on thermal reactions and abuse tests in commercial lithium-ion cells. J. Power Sources 2018, 399, 392–397. [Google Scholar] [CrossRef]
  45. Waldmann, T.; Wohlfahrt-Mehrens, M. Effects of rest time after Li plating on safety behavior—ARC tests with commercial high-energy 18650 Li-ion cells. Electrochim. Acta 2017. [Google Scholar] [CrossRef]
  46. Feng, X.; Zheng, S.; Ren, D.; He, X.; Wang, L.; Cui, H.; Liu, X.; Jin, C.; Zhang, F.; Xu, C.; et al. Investigating the thermal runaway mechanisms of lithium-ion batteries based on thermal analysis database. Appl. Energy 2019, 246, 53–64. [Google Scholar] [CrossRef]
  47. Zhang, Y.; Wang, H.; Li, W.; Li, C. Quantitative identification of emissions from abused prismatic Ni-rich lithium-ion batteries. eTransportation 2019, 2, 100031. [Google Scholar] [CrossRef]
  48. Gao, S.; Feng, X.; Lu, L.; Ouyang, M.; Kamyab, N.; White, R.E.; Coman, P. Thermal Runaway Propagation Assessment of Different Battery Pack Designs Using the TF5 Draft as Framework. J. Electrochem. Soc. 2019, 166, A1653–A1659. [Google Scholar] [CrossRef]
  49. Kovachev, G.; Schröttner, H.; Gstrein, G.; Aiello, L.; Hanzu, I. Analytical Dissection of an Automotive Li-Ion Pouch Cell. Batteries 2019, 5, 67. [Google Scholar] [CrossRef] [Green Version]
  50. Golubkov, A.W.; Planteu, R.; Rasch, B.; Essl, C.; Thaler, A.; Hacker, V. Thermal runaway and battery fire: Comparison of Li-ion, Ni-MH and sealed lead-acid batteries. In Proceedings of the 7th Transport Research Arena (TRA), Vienna, Austria, 16–19 April 2018; Volume 43. [Google Scholar] [CrossRef]
  51. Gasser, E. Characterization of Gas and Particle Released during Thermal Runaway of Li-Ion Batteries. Master’s Thesis, Graz University of Technology, Graz, Austria, 2019; pp. 2–92. [Google Scholar]
  52. Goldstein, J.I.; Newbury, D.E.; Michael, J.R.; Ritchie, N.W.M.; Scott, J.H.J.; Joy, D.C. Scanning Electron Microscopy and X-Ray Microanalysis, 4th ed.; Springer: New York, NY, USA, 2017. [Google Scholar] [CrossRef]
  53. Self, J.; Aiken, C.P.; Petibon, R.; Dahn, J.R. Survey of Gas Expansion in Li-Ion NMC Pouch Cells. J. Electrochem. Soc. 2015, 162, 796–802. [Google Scholar] [CrossRef]
  54. Onuki, M.; Kinoshita, S.; Sakata, Y.; Yanagidate, M.; Otake, Y.; Ue, M.; Deguchi, M. Identification of the Source of Evolved Gas in Li-Ion Batteries Using [sup 13]C-labeled Solvents. J. Electrochem. Soc. 2008, 155, A794. [Google Scholar] [CrossRef]
  55. Wu, K.; Yang, J.; Liu, Y.; Zhang, Y.; Wang, C.; Xu, J.; Ning, F.; Wang, D. Investigation on gas generation of Li4Ti5O 12/LiNi1/3Co1/3Mn1/3O2 cells at elevated temperature. J. Power Sources 2013, 237, 285–290. [Google Scholar] [CrossRef]
  56. Gachot, G.; Grugeon, S.; Jimenez-Gordon, I.; Eshetu, G.G.; Boyanov, S.; Lecocq, A.; Marlair, G.; Pilard, S.; Laruelle, S. Gas chromatography/Fourier transform infrared/mass spectrometry coupling: A tool for Li-ion battery safety field investigation. Anal. Methods 2014, 6120–6124. [Google Scholar] [CrossRef]
  57. Sun, W.; Yang, B.; Hansen, N.; Westbrook, C.K.; Zhang, F.; Wang, G.; Moshammer, K.; Law, C.K. An experimental and kinetic modeling study on dimethyl carbonate (DMC) pyrolysis and combustion. Combust. Flame 2016, 164, 224–238. [Google Scholar] [CrossRef] [Green Version]
  58. Spangl, W.; Kaiser, A.; Schneider, J. Herkunftsanalyse der PM10-Belastung in Österreich—Ferntransport und Regionale Beiträge; Umweltbundesamt: Wien, Austria, 2006.
  59. Schmidt, R.; Fitzek, H.; Nachtnebel, M.; Mayrhofer, C.; Schroettner, H.; Zankel, A. The Combination of Electron Microscopy, Raman Microscopy and Energy Dispersive X-Ray Spectroscopy for the Investigation of Polymeric Materials. Macromol. Symp. 2019, 384, 1–10. [Google Scholar] [CrossRef]
Figure 1. A failing battery can lead to hazards at the first venting and at the TR. Five categorized hazards (orange) and their consequences on safety and health (red) are presented. The battery failures are influenced by several factors.
Batteries 06 00030 g001
Figure 2. Estimated mass split of the investigated fresh automotive pouch cell in discharged condition.
Batteries 06 00030 g002
Figure 3. Test rig for thermal runaway experiments on automotive cells [19,50] designed for different cell geometries and different sample holders.
Batteries 06 00030 g003
Figure 4. Cell sample holder (a) open and (b) closed; two heater stripes (red) on the top and two on the bottom side of the stainless-steel plates (dark gray), thermal insolating mica sheets (beige) between the cell (symbolic geometry and design of a pouch cell (blue)) and the stainless-steel plates, thermocouples attached on the mica sheets facing the cell surface.
Batteries 06 00030 g004
Figure 5. Scheme of the thermocouples positions on the surface of the pouch cell (red) and at different positions inside the TR reactor (green).
Batteries 06 00030 g005
Figure 6. Overtemperature experiments of a fresh automotive pouch cell at (a,b) 100% SOC and (c,d) 30% SOC: (a,c) show the temperatures at up to 30 different positions during the heat ramp experiment measured on the cell surface (red) and inside the reactor (green). The heater output of the sample holder in% is plotted (black line). The cell voltage times 100 is plotted in blue. (b,d) show the temperature measured at the main exothermic event. In (b) ±1 A pulses are visible (blue).
Batteries 06 00030 g006
Figure 7. Absolute pressure (green) versus time of the fully charged cell (a) during the whole experiment and (b) at the TR only. The maximum pressure is reached 4 s after the TR starts. 50% of the gas is produced in 1.44 s (red line). 90% of the gas is produced in 3.22 s (blue).
Batteries 06 00030 g007
Figure 8. Produced vent gas amount nv in mol and liter at STP during the experiments of the (a) 100% and (b) 30% SOC cell. At the 100% SOC cell two venting stages are measured: A first venting starting at T c e l l V 1 and a second venting starting at T c e l l V 2 . The 30% SOC cell released gas starting at the first venting at T c e l l V 1 until the heating was stopped.
Batteries 06 00030 g008
Figure 9. Produced vent gas amount in mol for 0% (green), 30% (red) and 100% SOC (blue) pouch cell at overtemperature experiments at first venting and second venting in comparison.
Batteries 06 00030 g009
Figure 10. Measured gas composition in mol: immediately after the first venting at T c e l l V 1 of the 100% SOC cell (yellow); after the heat ramp was stopped at the 0% (green) and 30% SOC cell (red); and after the TR of the 100% SOC cell (blue); experimental setup in N2.
Batteries 06 00030 g010
Figure 11. FTIR spectrum of the gas composition measured after the TR of the 100% SOC cell (blue) in comparison to the spectrum measured after stopping the heat ramp at the 30% SOC cell (red).
Batteries 06 00030 g011
Figure 12. SEM images of particles assembled after the TR. (a) SE image shows the topographic contrast; (b) BSE measurement shows the material contrast of the same area of the sample. Particles were positioned on a carbon adhesive tape.
Batteries 06 00030 g012
Figure 13. Analysis of a particle of class 1: (a) SE image, (b) BSE image, (c) EDX spectrum. The presented scale in (a) and (b) is 10 µm.
Batteries 06 00030 g013
Figure 14. The pouch cell after TR was opened on the welded sides. Droplets were visible between the stacked cell layers.
Batteries 06 00030 g014
Table 1. Specification of the automotive Li-ion pouch cell.
ParameterValue
Nominal capacity41 Ah
Cathode materialNMC/LMO
Anode materialgraphite
Electrolyte48% EC, 48% DEC, 4% DMC, 1 mol/L LiPF6
Nominal voltage~3.8 V
Initial mass865 g
Volume0.459 L
Aging statefresh, unused
SOC0%, 30% and 100%
Table 2. Accuracy of the FTIR and GC gas quantification optimized for expected gas concentrations.
GasFTIRGC
Optimized
Concentration/%
Accuracy/% rel.LOD/
ppm
Calibrated
Concentration/%
Accuracy/% rel.LOD/
ppm
O2---0–20±514
N2---22–100±3220,000
H2---0.1–35±622
C2H20–10±4810.1–5±4200
C2H42–10±5140.1–5±4195
C2H60–10±6330.1–2±5184
CH40–10±41140.1–5±5272
CO0–30±4650.1–55±6534
CO20–35±41210.1–28±4189
DEC-±420---
DMC-±428---
EC-±42---
EMC-±425---
H2O0–3±4120---
C6H14-±416---
HF0–30±4(min 5 ppm)4---
C4H10-±415---
C3H8- 30---
LOD: limit of detection at the specific setting in parts per million (ppm). -: not calibrated for quantitative analysis or not possible to measure.
Table 3. Measured gas concentration values at heat triggered fresh automotive pouch cell at 100% SOC versus 30% SOC in N2.
Gas100% SOC30% SOC
Measured GasVent Gas (without N2)Vent Gas (without N2)Measured GasVent Gas (without N2)Vent Gas (without N2)
cm/%volcv/% vol cv/molcm/%volcv/% vol cv/mol
O20.010.040.000.000.000.00
N269.21 89.01
H27.0622.930.530.414.470.02
C2H20.020.050.000.010.120.00
C2H41.815.880.140.272.930.02
C2H60.300.990.020.030.360.00
CH41.063.460.080.050.520.00
CO5.1116.590.380.475.150.03
CO211.8038.330.894.3947.730.25
DEC0.832.690.061.9120.720.11
DMC0.000.000.000.000.000.00
EC0.000.000.000.000.000.00
EMC0.000.000.000.000.000.00
H2O2.327.550.171.6117.500.09
C6H140.000.000.000.000.000.00
HF0.000.000.000.000.000.00
C4H100.391.260.030.000.000.00
C3H80.000.000.000.050.500.00
Gas amount 2.31 mol 0.53 mol
cm: measured gas concentration including N2 atmosphere; cv/% Vol: vent gas in volume%, according to Equation (1); cv/mol: vent gas in mol.
Table 4. Average measured area (a) of particles and average number of particles produced from an automotive pouch cell (at 100% SOC) at overtemperature.
Area of Particles/µm2Average Number of Particles/%
1 < a ≤ 221.8 ± 7.6
2 < a ≤ 311.6 ± 2.2
3 < a ≤ 512.2 ± 2.7
5 < a ≤ 1015.8 ± 0.6
10 < a ≤ 5026.2 ± 5.5
50 < a ≤ 1006.6 ± 3.4
100 < a5.9 ± 5.5
Table 5. Summary of safety relevant parameters of overtemperature experiment of the fresh automotive pouch cell at 100%, 30% and 0% SOC.
Safety Relevant Parameter100% SOC30% SOC0% SOC
First venting (electrolyte vapor)yesyesyes
Thermal runawayyesnono
Start voltage (V)4.183.673.11
Heat ramp (°C/min)0.390.360.33
T c e l l V 1 (°C)130127120
T v o l t a g e = 0 (°C)203190190
T c e l l c r i t (°C)231--
T c e l l m a x (°C)715
(self-heating)
309
(external heating)
242
(external heating)
Duration of TR (s)4--
Amount of vent gas nv (mol)2.31 (57 l)0.53 (13 l)0.41 (10 l)
Characteristic venting rate n ˙ ch (mol/s)0.8 (18.7 L/s)--
Main gas compoundsCO2, CO, H2DEC, CO2, H2ODEC, CO2, H2O
CH2 (vol%)2341
CCO (vol%)1751
Particle release (g)~300--

