Abstract
The phase-field model based on the Cahn-Hilliard equation is employed to simulate lithium intercalation dynamics in a cathode with particles of distributed size. We start with a simplified phase-field model for a single submicron particle under galvanostatic condition. We observe two stages associated with single-phase and double-phase patterns typical for both charging and discharging processes. The single-phase stage takes approximately 10–15% of the process and plays an important role in the intercalation dynamics. We establish the laws for speed of front propagation and evolution of single-phase concentration valid for different sizes of electrode particles and a wide range of temperatures and C-rates. The universality of these laws allows us to formulate the boundary condition with time-dependent flux density for the Cahn-Hilliard equation and analyze the phase-field intercalation in a heterogeneous cathode characterized by the particle size distribution.
1. Introduction
Currently, lithium-ion batteries (LIB) are one of the most common devices for energy storage [1]. Many works are devoted to understanding the lithium intercalation/deintercalation mechanisms into electrodes and to optimization of LIB components for better electrochemical characteristics (see reviews [2,3]). The most widely accepted electrochemical model of LIB is the so-called pseudo-two-dimensional (P2D) model [4,5], where the intercalation and deintercalation in electrode particles, ion transport in electrolyte and separator are described in terms of the normal diffusion equations. The generalization to the anomalous diffusion case is proposed in [6]. However, in several electrode materials, the mutual solubility of the lithiated and delithiated phases is very low, and two phases coexist in a wide range of the state of charge (SOC). Such behavior is typical for charging and discharging in cathode based on lithium iron phosphate and in anode materials based on lithium titanate [7]. For this reason, lithiation and delithiation of the cathode particles can be associated with reversible phase transition in quasi-binary system, where the intercalant concentration can vary in the range from 0 to 1 during charging or discharging. The corresponding theoretical approach is based on the phase-field theory [8,9,10,11,12,13,14,15,16] that is commonly employed in studies on phase transitions [17,18,19].
The fact that the electrodes consist of particles of various sizes is often neglected. For example, the classic single particle model (SPM) and P2D model assume the electrodes consisting of spherical particles of identical size. Nonetheless, electrodes are typically made of porous materials with particles of different sizes and shapes. As a result, the medium in LIB is a highly heterogeneous system. Neglecting the particle size distribution (PSD) largely underestimates the capacity in the case of elevated C-rates [20], and the SPM approaches poorly describe the battery performance at higher current densities. PSD is an important factor in the degradation of batteries [21,22], and it may be altered during battery operation due to cracking or agglomeration of particles [21]. In [23], the multiple-particle model indicates that the PSD broadening may lead to higher values of volumetric capacity and energy density. On the other hand, this broadening can cause amplification of electrode polarization [23].
There are several papers (see e.g., [20,23,24,25,26]) where the particle size dispersion is considered within the diffusion approach. In most cases, the actual PSD is described by finite number of particle groups [20,25,26]. The multiple-particle approach meets computational difficulties related to the need to solve diffusion equations for each particle bin [26].
In the present paper, we extend the phase-field model based on the Cahn-Hilliard equation to simulate lithium intercalation dynamics in a cathode with particles of distributed size. Due to PSD, during charging/discharging, number of active electrode particles and their interfacial flux density depend on time. The boundary condition with time-dependent flux density for the Cahn-Hilliard equation is formulated from the universal laws established for speed of front propagation and evolution of single-phase concentration in individual particles. Calculation of the time-dependentflux density is performed by the developed general approach that can be employed for analysis of intercalation process in particle ensemble with arbitrary PSD.
2. Phase-Field Intercalation in a Single Spherical Particle
We start with a simplified phase-field model for a single submicron particle under galvanostatic condition. Expecting to establish some general rules of phase-field intercalation in a spherical particle, we analyze the dynamics for wide ranges of particle size and C-rate. The process of intercalation is simulated in terms of the Cahn-Hilliard (CH) equation [14,16,18,19]:
where is concentration field of intercalating atoms that defines the local state of charge of a cathode particle, is the mobility, is the free energy of mixing in a quasi-binary system, is the gradient energy coefficient. In this study, the free energy of mixing of quasi-binary solid solution is considered in the regular solution approximation [17,18,19]:
is the interaction parameter, is the temperature, and is the Boltzmann constant. The influence of elastic strain is neglected. Assuming spherical symmetry of cathode particles, we use the Laplace operator of the form: .
The insertion and extraction of intercalating atoms are simulated at the temperature of 300 K. The mobility of intercalated atom in a cathode particle is related to the diffusion coefficient through the Einstein relation, . The diffusion coefficient of intercalating atom (e.g., lithium) for different cathode materials is D = 10−13–10−15 m2/s at the considered temperature [4,8,13]. The interaction parameter for different cathode materials lies in the range of 0.059–0.193 eV/atom [8,9,10,11,12,13,14,15,16]. The gradient energy coefficient can be related to the width of equilibrium profile [17,18] that is usually of several nanometers [8,10]. In this study, we employ the diffusion coefficient D = 10−14 m2/s, interaction parameter Ω = 0.115 eV/atom. The gradient energy coefficient is usually written as [8,14,17,18], where is the intermolecular distance and is the dimensionless coefficient depending on form of interaction potential [18]. In this study, the value of gradient energy coefficient is eVnm2.
The interaction parameter allows us to calculate phase diagram of the system (Figure 1). The equilibrium values of intercalating atom concentration are and at the temperature of 300 K. The unstable region lies in the interval between and .
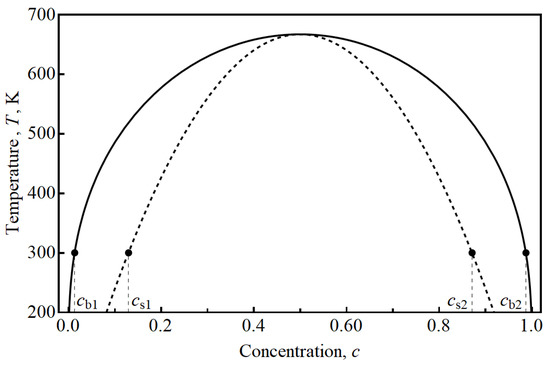
Figure 1.
Phase diagram for regular binary solution with interaction parameter of Ω = 0.115 eV/atom.
The CH Equation (1) is solved under natural boundary conditions corresponding to the galvanostatic mode:
Here, is the chemical potential defining the flux density of intercalating atoms. Initial distribution of the atoms is uniform and is characterized by equilibrium values of concentration, i.e., for insertion and for extraction process. The CH Equation (1) with boundary conditions (2) is solved numerically by using the explicit Euler time integration scheme [27].
Figure 2 demonstrates the evolution of concentration profile of intercalating atoms computed with the introduced values of the model parameter. The insertion and extraction processes are simulated for the cathode particle with radius of R0 = 0.1 µm under C-rate of 1C and 10C. Also, we simulated the insertion and extraction dynamics for cathode particle with radius R0 = 0.2 µm under C-rate equal to C/2.
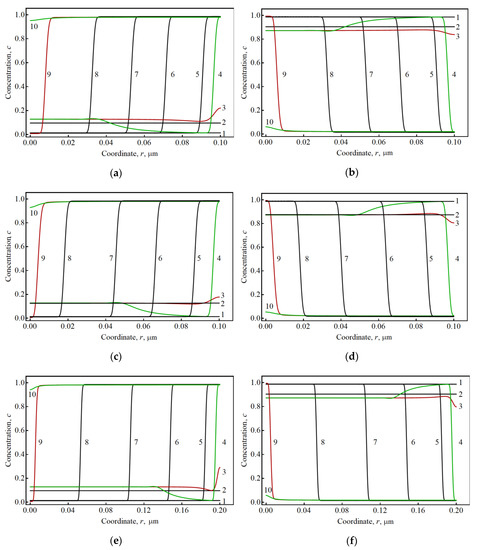
Figure 2.
Concentration profiles of intercalating atoms for different time points at T = 300 K. Corresponding radius of particle and C-rate are: (a) 0.1 µm, 1C insertion, (b) 0.1 µm, 1C extraction, (c) 0.1 µm, 10C insertion, (d) 0.1 µm, 10C extraction, (e) 0.2 µm, 0.5C insertion, (f) 0.2 µm, 0.5C extraction. The lines 3, 4, 9 and 10 correspond to passing from single-phase stage to double-phase stage and vice versa.
Analyzing the results of insertion and extraction of intercalating atoms in cathode particles, we can identify some important features of these processes. At the very beginning of the processes, the concentration of intercalant decreases uniformly over the particle volume (see lines 1 and 2 in Figure 2a–f). At this stage, the particle corresponds to the single-phase pattern. The uniformity is explained by fast equilibration of atom distribution due to high diffusion coefficient and small size of the particle. The stage continues until the nearest value of metastability limit ( or ) is achieved. At this stage, the average intercalant concentration changes linearly with time (Figure 3). The approximate dependence can be easily obtained from the CH Equation (1):
that agrees well with the results of direct solution of CH Equation (Figure 3). The relation (3) is valid at the time interval 0 ≤ t ≤ ts. From Equation (3) we can calculate the duration of the single-phase stage as for extraction and for insertion process.
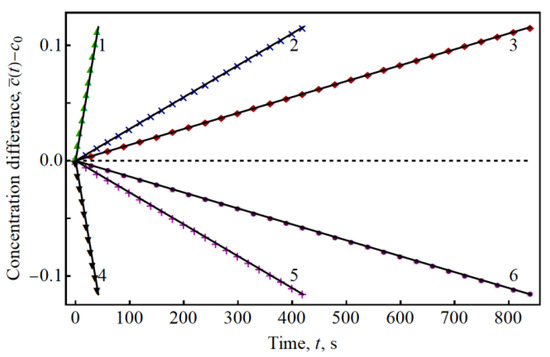
Figure 3.
Kinetics of average concentration at the single-phase stage of insertion (1–3) and extraction (4–6) processes. Points are the solution of the CH equation, lines correspond to the linear dependence (3).
After that the concentration profile dramatically changes. Interfacial region depletes in very short time interval and the particle passes to double-phase pattern (see lines 3 and 4 in Figure 2a–f). At this stage, the intercalant redistributes over the particle volume and passes to the nearest equilibrium composition (see lines 4 and 5 in Figure 2a–f). Transition from single-phase to double-phase stage takes place for the short time interval estimated as ~0.2 s and ~0.5 s for particles with size of 0.1 µm (1C) and 0.2 µm, respectively. The longer time interval for larger particle is explained by the presence of additional concentration wave moving toward the particle center (see line 4 in Figure 2a–f) during equilibration of concentration profile. Overpotential of electrode depends on interfacial concentration of intercalating atoms [4,5,8]. Therefore, it is expected that passing from single-phase to double-phase regime can cause the abrupt change of overpotential. The effect could be used for determination of metastability limit.
The next stage is characterized by motion of the concentration wave from the particle interface to the center (lines 5–9 in Figure 2a–f). The position of concentration wave can be associated with coordinate corresponding to concentration . The position of the wave front satisfies the linear dependence
obtained from the solution of the CH Equation (1). The Equation (4) is valid for t > ts (after the single-phase stage). The results of simulation by the CH Equation (Figure 2a–f) confirm Equation (4) (see Figure 4). The end of the double-phase stage corresponds to the time point for both insertion and extraction processes. The relation can be employed for calculation of the flux density corresponding to 1C-rate, if duration of charging or discharging process equals to td = 3600 s.
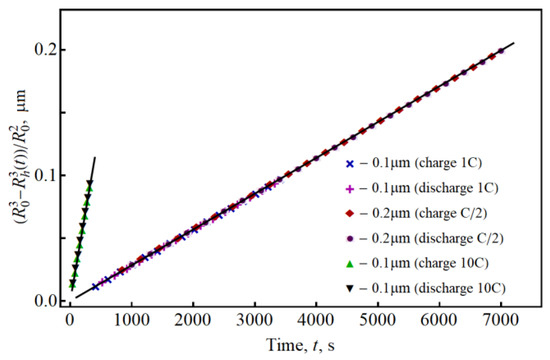
Figure 4.
Kinetics of concentration wave propagation obtained by the CH Equation (points). Lines represent the linearized dependence (4). Size of particles and applied C-rate are indicated in Figure 2.
At the end of insertion or extraction process, the system passes over unstable region to another single-phase state that corresponds to fully charged or discharged state of a particle (lines 9 and 10 in Figure 2a–f). The process of insertion or extraction is stopped, when the corresponding equilibrium composition is achieved.
Contribution of the single-phase and double-phase stages can be estimated by ratio . This ratio can be easily found from Equations (3) and (4):
for charging and discharging, respectively. The value of is defined by the phase diagram and depends on temperature only. In case of symmetric phase diagram, this parameters are equal to each other . Calculation of the ratio in the range 250–400 K gives contribution of single-phase stage about 10–15%. Simulation of insertion and extraction for lower diffusion coefficient reveals deviation from concentration profiles at the single-phase stage only if the diffusion coefficient is less than ~10−17 m2/s.
Remarkably, variation of insertion and extraction rates in the range 1–10 C at the temperature of 300 K does not modify the two-stage mechanism and relations (3) and (4) remain valid (see Figure 2, Figure 3 and Figure 4). Thus, Equations (3) and (4) can be used for determination of the composition profile at any time point of insertion or extraction process.
3. Intercalation in Particles of Distributed Size
Real cathodes consist of particles of various sizes and can be characterized by certain PSD. Under the assumption that the current is equally distributed over the active surface, smaller particles are charged or discharged for shorter time interval and withdraw earlier from the intercalation process. Larger particles have to balance the total current change in the galvanostatic mode. Therefore, flux density at the particle surface turns to depend on time .
Let us modify the obtained relations with respect to size distribution of cathode particles. If the flux density at the particle interface depends on time after integration of CH equation we obtain for single-phase and double-phase regimes:
Whereas the total amount of intercalating atoms is conserved, the relation for total time of insertion or extraction process can be written in the form
Equation (6) can be used for definition of threshold value defining the minimal size of particle that can participate in intercalation process
Then we assume that particles with are excluded from the intercalation process (they are fully charged/discharged). The total current redistributes over the interface of residual particles with . Therefore, the galvanostatic mode can be determined by the following equation:
where is the flux density at the beginning of intercalation process and is the size distribution function of cathode particles, is the squared radius averaged over the whole ensemble of cathode particles.
Combining Equations (7) and (8) leads to the equation for the threshold value
Let us assume that ensemble of cathode particles is described by the gamma distribution
that is usually employed as PSD for different cathode materials [28,29]. Here and are the constant parameters and is the gamma function. The expectation value and dispersion of the distribution are and respectively.
Integration of Equation (9) with respect to PSD (10) gives the implicit time-dependence of
The threshold radius alters from zero to infinity, and the charging/discharging time is determined by
Figure 5 shows the time-dependence of threshold particle radius in dimensionless coordinates for different values of parameter . The results in these coordinates do not depend on parameter (see Equation (11)).
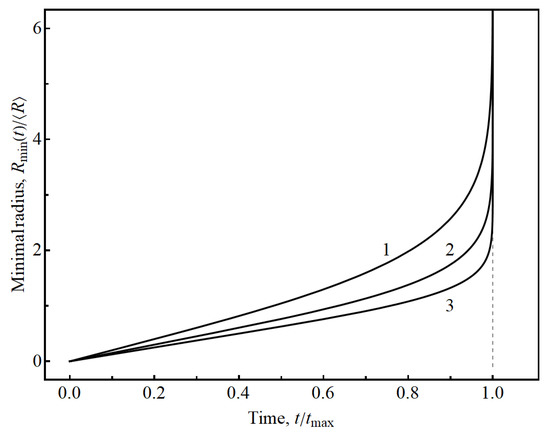
Figure 5.
Dynamics of minimal radius of active particle in process of intercalation. Lines are the results of analytical solution (11) for different values of parameter : (1) , (2) , (3) .
Analyzing Figure 5, we conclude that depends linearly on time at the beginning of insertion or extraction process that can be described by dependence
The time interval corresponding to linear dependence is characterized by a constant flux density . After that the flux density of intercalating atoms grows very quickly and goes to infinity when time approaches to .
Taking Equation (7) into account, one can transform Equations (5) into
These equations describe the dynamics of intercalant distribution over the electrode particle at the single-phase and double-phase stage with respect to PSD.
Let us consider the impact of the PSD parameters on the extraction process from the particle ensemble characterized by PSD (10). Here, and . We solve the CH Equation (1) for particle with size of R0 = 0.2 µm and time-dependent interfacial flux density that defines the boundary condition (2).
The time-dependence of flux density can be calculated by Equations (7) and (11). To represent given by Equation (11) in explicit form, we choose the following approximation
where n is the order of approximation, and b are fitting parameters. Using this approximation, we obtain the explicit dependence of the interfacial flux density for in the form
The initial flux density j0 corresponds to C-rate of 1C for cathode particle with average size .
The result of simulation of the extraction process from an individual particle of the ensemble is shown in Figure 6. The radius of this particle is chosen equal to R0 = 0.2 µm. The concentration profiles at different times are similar to Figure 2f. Analyzing Figure 6, one can conclude that solution of the CH Equation (1) with time-dependent interfacial flux density agrees well with the general Equation (13b) at the double-phase stage. The size distribution function of the cathode particles causes decrease of the total time of extraction that corresponds to time interval in Figure 6.
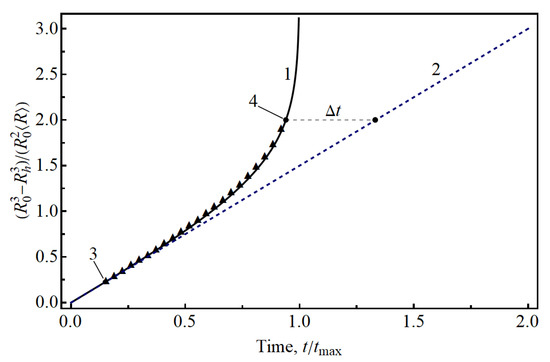
Figure 6.
The time-dependence of concentration wave position in dimensionless units for cathode particle with the size of R0 = 0.2 µm at the double-phase stage. The particle is the part of ensemble described by PSD given by Equation (10) with µm and . Solid line 1 corresponds to solution of Equation (11). Dashed line 2 is the linear dependence corresponding to constancy of the interfacial flux density. Points 3 and 4 correspond to moments of start and finish of double-phase stage for the particle. Triangle points correspond to solution of the CH equation.
The time-dependent flux density is approximately constant at the single-phase stage, therefore the dependence of average concentration at this stage is almost identical to that in Figure 2f. Generally, the time-dependent flux density can influence the average concentration dynamics at the single-phase stage for large particles. The large particles are expected to deviate from the linear dependence that is observed under constant flux density (see Figure 3).
4. Conclusions
We extended the phase-field model based on the Cahn-Hilliard equation to the lithium intercalation dynamics in a cathode with particles of distributed size. Considering the simplified phase-field intercalation in a single submicron spherical particle under galvanostatic condition, we established universal behavior observed for different sizes of electrode particles and a wide range of temperatures and C-rates. The universal rules were formulated for speed of front propagation and evolution of single-phase concentration. Two stages associated with single-phase and double-phase patterns are typical for both charging and discharging processes. The single-phase stage takes approximately 10–15% of the process and plays an important role in the intercalation dynamics.
The particle size distribution causes the time-dependence of the interfacial flux density under galvanostatic conditions. The analytical results for a particle ensemble are presented for the case of the gammadistribution of particle sizes, and can be easily generalized to other PSDs. The universality of the established laws allowed us to formulate the boundary condition with time-dependent flux density for the Cahn-Hilliard equation. Numerical solutions of the corresponding boundary-value problem agree well with the obtained universal relations.
Thus, we obtained thegeneral analytical relations describing the intercalation process in ensemble of submicron electrode particle characterized by the arbitrary PSD. Other approaches based on the diffusion equation for intercalating atoms can consider finite number of particle bins only and have higher computational cost.
The Cahn-Hilliard equation and obtained approximate relations on the phase-field intercalation can be used for modification of the well-known SPM and P2D models of LIBs.
Author Contributions
Conceptualization, P.L. and R.S.; methodology, P.L.; software, P.L.; validation, P.L. and R.S.; formal analysis, P.L.; writing—original draft preparation, P.L.; writing—review and editing, R.S.; visualization, P.L.; supervision, P.L. and R.S.; project administration, R.S. All authors have read and agreed to the published version of the manuscript.
Funding
The authors thank the Russian Science Foundation (project no. 19-71-10063) for financial support.
Conflicts of Interest
The authors declare no conflict of interest.
List of Symbols
| Parameter of gamma distribution function | |
| Fitting parameter of time-dependence | |
| Fitting parameter of time-dependence | |
| Concentration of intercalating atom | |
| , | Concentration of intercalating atom in equilibrium states of binary system |
| Average concentration of intercalant in cathode particle at the single-phase stage | |
| Half-sum of equilibrium compositions of binary system | |
| Diffusion coefficient, m2/s | |
| Free energy of mixing of binary system, J/atom | |
| Interfacial flux density of intercalating atoms, m/s | |
| Initial flux density of cathode particle ensemble, m/s | |
| Mobility of intercalating atoms, m2/(Js) | |
| Parameter of gamma distribution function | |
| Time, s | |
| Time point of the end of single–phase stage, s | |
| Time point of the end of double-phase stage, s | |
| Duration of charging or discharging process of cathode particle ensemble, s | |
| Temperature, K | |
| Boltzmann constant, J/K | |
| Intermolecular distance, m | |
| Radius of individual cathode particle, m | |
| Threshold value of radius of active cathode particle , m | |
| Coordinate of concentration wave front at the double-phase stage, m | |
| Particle size distribution function | |
| Gamma function | |
| Gradient energy coefficient, Jm2 | |
| Interaction parameter of binary system, J | |
| Dimensionless coefficient in gradient energy coefficient | |
| Ratio of duration of single-phase and double-phase stages | |
| Laplace operator, m−2 |
References
- Liu, C.; Cao, G. Fundamentals of Rechargeable Batteries and Electrochemical Potentials of Electrode Materials. In Nanomaterials for Energy Conversion and Storage; Wang, D., Cao, G., Eds.; World Scientific (Europe): London, UK, 2018; pp. 394–451. [Google Scholar]
- Yuan, L.X.; Wang, Z.H.; Zhang, W.X.; Hu, X.L.; Chen, J.T.; Huang, Y.H.; Goodenough, J.B. Development and challenges of LiFePO4 cathode material for lithium-ion batteries. Energy Environ. Sci. 2011, 4, 269–284. [Google Scholar] [CrossRef]
- Zhang, W.J. Structure and performance of LiFePO4 cathode materials: A review. J. Power Sources 2011, 196, 2962–2970. [Google Scholar] [CrossRef]
- Doyle, M.; Fuller, T.F.; Newman, J. Modeling of galvanostatic charge and discharge of the lithium/polymer/insertion cell. J. Electrochem. Soc. 1993, 140, 1526–1533. [Google Scholar] [CrossRef]
- Hariharan, K.S.; Tagade, P.; Ramachandran, S. Mathematical Modeling of Lithium Batteries; Springer International Publishing: Cham, Switzerland, 2018. [Google Scholar]
- Sibatov, R.T.; Svetukhin, V.V.; Kitsyuk, E.P.; Pavlov, A.A. Fractional differential generalization of the single particle model of a lithium-ion cell. Electronics 2019, 8, 650. [Google Scholar] [CrossRef]
- Yaroslavtsev, A.B.; Kulova, T.L.; Skundin, A.M. Electrode nanomaterials for lithium-ion batteries. Rus. Chem. Rev. 2015, 84, 826. [Google Scholar] [CrossRef]
- Cogswell, D.A.; Bazant, M.Z. Coherency Strain and the Kinetics of Phase Separation in LiFePO4 Nanoparticles. ACS Nano 2012, 6, 2215–2225. [Google Scholar] [CrossRef]
- Fleck, M.; Federmann, H.; Pogorelov, E. Phase-field modeling of Li-insertion kinetics in single LiFePO4-nano-particles for rechargeable Li-ion battery application. Comp. Mater. Sci. 2018, 153, 288–296. [Google Scholar] [CrossRef]
- Tang, M.; Huang, H.-Y.; Meethong, N.; Kao, Y.-H.; Carter, W.C.; Chiang, Y.-M. Model for the particle size, overpotential, and strain dependence of phase transition pathways in storage electrodes: Application to nanoscaleolivines. Chem. Mater. 2009, 21, 1557–1571. [Google Scholar] [CrossRef]
- Santhanagopalan, S.; Guo, Q.; Ramadass, P.; White, R.E. Review of models for predicting the cycling performance of lithium ion batteries. J. Power Sources 2006, 156, 620–628. [Google Scholar] [CrossRef]
- Han, B.; der Ven, A.V.; Morgan, D.; Ceder, G. Electrochemical modeling of intercalation processes with phase field models. Electrochim. Acta 2004, 49, 4691–4699. [Google Scholar] [CrossRef]
- Zhang, T.; Kamlah, M. Phase-field modeling of the particle size and average concentration dependent miscibility gap in nanoparticles of LiMn2O4, LiFePO4, and NaFePO4 during insertion. Electrochim. Acta 2019, 298, 31–42. [Google Scholar] [CrossRef]
- Huttin, M.; Kamlah, M. Phase-field modeling of stress generation in electrode particles of lithium ion batteries. Appl. Phys. Lett. 2012, 101, 133902. [Google Scholar] [CrossRef]
- Burch, D.; Bazant, M.Z. Size-dependent spinodal and miscibility gaps for intercalation in nanoparticles. NanoLett. 2009, 9, 3795–3800. [Google Scholar] [CrossRef] [PubMed]
- Zelič, K.; Katrašnik, T. Thermodynamically consistent derivation of chemical potential of a battery solid particle from the regular solution theory applied to LiFePO4. Sci. Rep. 2019, 9, 1–13. [Google Scholar] [CrossRef] [PubMed]
- Cahn, J.W.; Hilliard, J.E. Free Energy of a Nonuniform System. I. Interfacial Free Energy. J. Chem. Phys. 1958, 28, 258–267. [Google Scholar]
- Provatas, N.; Elder, K. Phase-Field Methods in Material Science and Engineering; John Wiley & Sons: Weinheim, Germany, 2010. [Google Scholar]
- L’vov, P.E.; Svetukhin, V.V. Simulation of the first order phase transitions in binary alloys with variable mobility. Model. Simul. Mater. Sci. Eng. 2017, 25, 75006. [Google Scholar] [CrossRef]
- Farkhondeh, M.; Delacourt, C. Mathematical modeling of commercial LiFePO4 electrodes based on variable solid-state diffusivity. J. Electrochem. Soc. 2011, 159, A177–A192. [Google Scholar] [CrossRef]
- Vetter, J.; Novák, P.; Wagner, M.R.; Veit, C.; Möller, K.C.; Besenhard, J.O.; Winter, M.; Wohlfahrt-Mehrens, M.; Vogler, C.; Hammouche, A. Ageing mechanisms in lithium-ion batteries. J. Power Sources 2005, 147, 269–281. [Google Scholar] [CrossRef]
- Capone, I.; Hurlbutt, K.; Naylor, A.J.; Xiao, A.W.; Pasta, M. Effect of the Particle-Size Distribution on the Electrochemical Performance of a Red Phosphorus−Carbon Composite Anode for Sodium-Ion Batteries. Energy Fuels 2019, 33, 4651–4658. [Google Scholar] [CrossRef]
- Röder, F.; Sonntag, S.; Schröder, D.; Krewer, U. Simulating the impact of particle size distribution on the performance of graphite electrodes in lithium-ion batteries. Energy Tech. 2016, 4, 1588–1597. [Google Scholar] [CrossRef]
- Wu, S.; Yu, B.; Wu, Z.; Fang, S.; Shi, B.; Yang, J. Effect of particle size distribution on the electrochemical performance of micro-sized silicon-based negative materials. RSC Adv. 2018, 8, 8544–8551. [Google Scholar] [CrossRef]
- Nagarajan, G.S.; Van Zee, J.W.; Spotnitz, R.M. A mathematical Model for Intercalation Electrode Behaviour. J. Electrochem. Soc. 1998, 145, 771–779. [Google Scholar] [CrossRef]
- Majdabadi, M.M.; Farhad, S.; Farkhondeh, M.; Fraser, R.A.; Fowler, M. Simplified electrochemical multi-particle model for LiFePO4 cathodes in lithium-ion batteries. J. Power Sources 2015, 275, 633–643. [Google Scholar] [CrossRef]
- Biner, S.B. Programming Phase-Field Modeling; Springer: Cham, Switzerland, 2017. [Google Scholar]
- Westhoff, D.; Feinauer, J.; Kuchler, K.; Mitsch, T.; Manke, I.; Hein, S.; Latz, A.; Schmidt, V. Parametric stochastic 3D model for the microstructure of anodes in lithium-ion power cells. Comput. Mater. Sci. 2017, 126, 453–467. [Google Scholar] [CrossRef]
- Westhoff, D.; Manke, I.; Schmidt, V. Generation of virtual lithium-ion battery electrode microstructures based on spatial stochastic modeling. Comput. Mater. Sci. 2018, 151, 53–64. [Google Scholar] [CrossRef]


© 2020 by the authors. Licensee MDPI, Basel, Switzerland. This article is an open access article distributed under the terms and conditions of the Creative Commons Attribution (CC BY) license (http://creativecommons.org/licenses/by/4.0/).