Abstract
Internal resistance is one of the important parameters in the Li-Ion battery. This paper identifies it using two different methods: electrochemical impedance spectroscopy (EIS) and parameter estimation based on equivalent circuit model (ECM). Comparing internal resistance, the conventional parameter estimation method yields a different value than EIS. Therefore, a hysteresis-free parameter identification method based on ECM is proposed. The proposed technique separates hysteresis resistance from the effective resistance. It precisely estimated actual internal resistance, which matches the internal resistance obtained from EIS. In addition, state of charge, open circuit voltage, and different internal equivalent circuit components were identified. The least square method was used to identify the parameters based on ECM. A parameter extraction algorithm to interpret impedance spectrum obtained from the EIS. The algorithm is based on the properties of Nyquist plot, phasor algebra, and resonances. Experiments were conducted using a cellphone pouch battery and a cylindrical 18650 battery.
1. Introduction
It is essential to know the different parameters of a battery to track, control, and forecast its dynamics [1,2,3]. Efficiency, charging control, safety, and the lifespan of a battery can be enhanced by utilizing these parameters. Terminal voltage, current, and temperature are useful parameters to operate a battery within safety limits [4]. Cycle life and calendar life are useful parameters to determine the aging and health condition of a battery [5]. State of charge (SOC), depth of discharge, capacity, and open circuit voltage (OCV) are useful for fuel gauging a battery [6]. State of health (SOH) and remaining useful life (RUL) are good indicators of performance degradation [7,8]. The internal resistance is one of the battery parameters which is relevant to determine the aging mechanism, SOH, and RUL [9,10]. Internal equivalent impedance of a battery is useful for improving charging efficiency [11]. Internal resistance and other equivalent circuit parameters can be correlated to the conduction loss, ions loss, and active material loss in a Li-Ion battery [12].
Different methods have been developed to identify specific battery parameters. Some parameters (Voltage, Current, and Temperature) are identified using direct measurements. Other parameters are calculated, estimated, and predicted based on the initial measurements [1,2,3,13,14,15,16,17,18,19]. Hybrid pulse power characterization (HPPC), Galvanostatic intermittent titration technique (GITT), Equivalent circuit model (ECM) estimation and electrochemical impedance spectroscopy (EIS) are renowned methods for parameter identification. ECM estimation and the EIS based method are used. It is expected that the same battery parameter obtained using different identification methods should be equal. However, experimental results show that internal resistance obtained using the conventional estimation method for ECM does not match with the results obtained using EIS. This paper proposes a solution by introducing a hysteresis-free parameter identification method based on ECM to reduce the mismatch.
The relationship between SOC and OCV is obtained from experiments considering an equivalent circuit model (ECM). For parameter estimation based on ECM, a battery is charged and discharged fully by a very small amount of current (C/26-rate). Terminal voltage and current are measured and analyzed [2]. Recent studies show that the ECM based parameter estimation method can also determine the internal DC resistance, RUL, and SOH [15,20,21]. Parameter estimation based on ECM is easy to implement and reliable for SOC determination. However, the test for parameter estimation based on ECM is prone to hysteresis [22]. Hysteresis affects the internal resistance estimation. Different models have been used to characterize hysteresis [23,24,25]. Hysteresis voltage in a battery depends on the SOC level, temperature, charging/discharging current rate, and aging [22,26,27]. Based on the recent literature, there is no universally defined model for hysteresis in a battery [25]. Considering the effects of hysteresis, a hysteresis-free parameter estimation method is developed in this paper.
Impedance spectrum ( impedances corresponding to specific frequencies) of a battery is measured with the EIS method. It can accurately explain the internal electrochemical characteristics of a battery. A change of SOH is due to the aging and can be determined using the impedance spectrum [12]. The chemistry of aging, frequency sweep, and EIS have been discussed in [28,29,30,31]. EIS uses either voltage or current perturbation to get the battery response. The voltage and current measurements are used to obtain the impedance spectrum by frequency domain analysis [32]. Despite the expensive equipment, EIS provides the opportunity to obtain highly accurate values for internal equivalent circuit parameters. Unlike ECM estimation by charging–discharging test, a battery is not affected by hysteresis during the EIS test [25]. Conventionally, the curve fitting method is used to characterize and track the SOC with internal equivalent circuit parameters from EIS test data [17]. The curve fitting method uses regression analysis and iterative processes. A curve fitting based parameter extraction algorithm is introduced in [10], which can be implemented offline and require high computing power. Therefore, the curve fitting method is inconvenient for fast interpretation of the impedance spectrum. Fast interpretation of impedance spectrum is necessary for online EIS application. To resolve this issue, an internal equivalent circuit parameter extraction algorithm is proposed in [1]. The algorithm looks through the properties of the impedance spectrum and do not have iterative processes for regression analysis. Therefore, it provided the scope to interpret impedance spectrum with less computing power and can be implemented online. In addition to [1], impedance spectrum for different SOC has been interpreted using the proposed algorithm for two different types of Li-Ion batteries in this paper.
Although parameter identification based on ECM and EIS methods uses voltage and current measurements, their intended objectives, procedures, and analyses are different. As a result, each method identifies internal resistances with different values. This happens because of the role of hysteresis in a conventional parameter estimation method based on ECM. The conventional method determines effective resistance as internal resistance. On the other hand, the aforementioned parameter extraction algorithm gives Ohmic resistance as internal resistance which was introduced [1]. The algorithm is applied to the results obtained using EIS tests in this paper. To unify the internal resistance from both methods, the following contributions are made in this paper:
- The tests for ECM and EIS are conducted on two different types of Li-Ion batteries.
- Parameter extraction algorithm is proposed and validated theoretically and experimentally.
- The identified parameters from two methods are compared.
- Difference is found for internal resistance obtained from two methods.
- To unify the values of internal resistance, a hysteresis-free ECM based parameter estimation method is proposed.
- The values from EIS tests matched with the results obtained from the tests for ECM using the proposed hysteresis-free method.
To unify the identification methods, tests have been conducted on a Samsung-B600BC pouch cellphone battery (Seoul, South Korea) and a Samsung-18650 cylindrical Li-Ion battery. Theoretical explanation of ECM based parameter estimation, EIS, and the parameter extraction algorithm are discussed in Section 2, Section 3 and Section 4. The ECM based parameter estimation method is explained by using optimization theories and equivalent circuit models. EIS and the parameter extraction algorithm are explained by Nyquist theory, resonance, and phasor algebra. In addition to the development of theories and experimentation, analyses have been performed for validity in Section 5. Analytical results obtained from the tests for ECM and EIS are compared to justify the proposed method. The analysis shows how hysteresis affects resistance identification for the conventional ECM based parameter estimation. Results finally show that the estimated internal resistance obtained from the proposed ECM based parameter estimation matches with that obtained from EIS.
2. ECM Based Parameter Estimation
The ECM based parameter identification method can be implemented using steady state response of a battery. The details of conventional ECM based parameter estimation techniques are discussed in [2]. The basic structure of the ECM, battery response and test set up, conventional, and proposed parameter estimation technique are discussed as follows.
2.1. Equivalent Circuit Model
The response of a battery in a steady state condition can be explained by an equivalent circuit model as shown in Figure 1. The circuit consists of a DC OCV source, , DC equivalent resistance, , and hysteresis voltage source, h. The open circuit voltage is considered as a function of SOC, s. The terminal voltage can be expressed by Equation (1):
where terminal voltage of measurement is , current through the battery is , and measurement noise is .
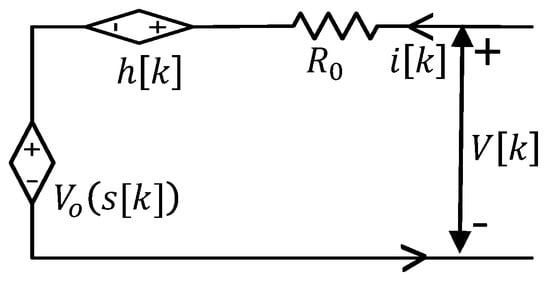
Figure 1.
Equivalent circuit model of a battery for estimation.
2.2. Response of a Battery in a Charging–Discharging Test
The block diagram and actual experimental set up for ECM based parameter estimation are shown in Figure 2. The test set up consists of a bench power supply, power resistor, programmable load, data logging system, etc. To estimate ECM parameters, a Samsung-B600BC cellphone’s 2600 mAh 3.8 V 9.88 Wh Li-Ion battery (LCO) was used. To validate the idea further, the test was also conducted on a Samsung-18650 Li-Ion battery (NCA) which has 2550 mAh nominal capacity. The batteries were charged and discharged slowly with constant 100 mA current, considering the effect of hysteresis, rated capacity, and safety limits.The maximum discharging/charging voltage limits used for the tests for B600BC and 18650 batteries are 3.3 V/4.4 V and 3.0 V/4.2 V, respectively. As time passes, the terminal voltage and SOC level of the battery change. The values of terminal voltage and current have been measured and recorded using a scopecorder (DLP750P) for analysis. The responses for the charging–discharging test for batteries are shown in Figure 3. Up and down arrows denote charging voltage, , and discharging voltage, , respectively. SOC has been calculated by the Coulomb counting method using current integration (trapezoidal). The actual OCV for a specific SOC level has been calculated by averaging the charging and discharging voltages. The measured voltage and actual OCV with respect to SOC are shown in Figure 4. The actual OCV is calculated by Equation (2):
where and denote the measured voltage at specific SOC level s, during charging and discharging. The effective voltage drop which is combined with hysteresis voltage and Ohmic drop is determined by the following equations:

Figure 2.
Equivalent circuit model (ECM) experiment: (a) test bench; (b) block diagram.
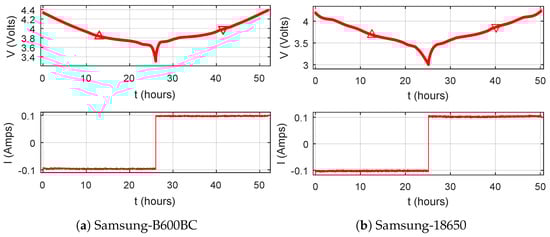
Figure 3.
Response of batteries for the charging–discharging test.

Figure 4.
Battery voltage profiles for charging–discharging tests.
2.3. Theory of Conventional Parameter Estimation
The SOC-OCV relationship is estimated from the voltage and current measurements, and . Battery current, , is integrated to get the present capacity, total capacity, and SOC levels for every data logging instant from the measurements. By considering equal voltage drop during charging and discharging for the same SOC levels, the average OCV is calculated from the measured terminal voltage as in Figure 4. Estimation (1) can be re-written as in Equation (5), which is adopted from [2].
Due to a small value of and dependency on hysteresis resistance, , hysteresis voltage is replaced by in Equation (5). By combining and to the effective resistance, , Equation (5) is simplified in Equation (6).
where
The ECM parameters are estimated from , and s. Thus, Equation (6) is rearranged to matrix form, as shown in Equation (8).
The function provides the estimation equation for the battery. can be expressed using various models. The combined model [2] for is shown in Equation (10).
The second portion of Equation (8) has coefficient vector, , and the effective resistance, . The size of vector depends on the model . If has M number of terms in its model, then .
Now, for N number of measurements, the equation for voltage can be written as
where
The parameter vector, , is determined by using a parameter estimation technique. For the least square estimation technique, the estimated parameter vector, , is calculated by Equation (17).
Coefficient vector, , and the effective resistance, , are obtained from the estimated parameter vector, . From the estimated coefficient vector, , the SOC-OCV relationship is determined by Equation (18):
The actual and estimated SOC-OCV curves are shown in the result section. The estimated values for , and are also presented in the results section.
2.4. Proposed Hysteresis-Free Estimation
The effective resistance, , of a battery was considered to be constant for different SOC levels in conventional ECM based parameter estimation technique [2]. The consideration is usable for SOC-OCV relation identification but not valid for resistance identification. changes with SOC [22,23,24,33,34,35]. It indicates that the hysteresis resistance also changes with SOC. Recent study shows that hysteresis voltage depends on SOC levels, temperature, charging/discharging current, and aging [23,27,36]. Our test was conducted at room temperature with a new battery. Hysteresis voltage is represented by the only multiplication of current and constant hysteresis resistance in Equation (5). In the proposed method, terminal voltage will be expressed by Equation (19) instead of by Equation (1).
Hysteresis voltage of battery can be represented by Equation (20).
As a result, the effective resistance, , model will also be changed, and is expressed in Equation (21).
Hysteresis voltage has been modeled using differential equations, four states model, variable dependent model and Tackas model, and so on [23,36,37,38,39,40]. Authors of [2,25,36] claim that hysteresis in a battery is not a one to one relation, impractical to model perfectly and has no absolute model. A simplified computationally effective quadratic model for hysteresis resistance is proposed in this paper for simplicity. SOC dependency on hysteresis resistance, , is modeled in quadratic form in the following equations:
where is the coefficient vector for the hysteresis resistance model. Considering the proposed model, the effective resistance can be expressed by Equation (24).
Since the first term of hysteresis resistance is constant, Equation (24) could be reduced to Equation (25).
where is the coefficient vector for the effective resistance model:
By using this hysteresis model, measured voltage can be expressed by Equation (27) instead of by Equation (8):
where
Once is estimated from Equation (17), can be calculated from Equation (25). At 100% SOC level, current should not be injected into the battery. Experimental observation shows that, at 100% SOC, the battery has minimum hysteresis resistance. The hysteresis resistance is very small compared to effective resistance. Therefore, only the internal resistance mainly exists in the effective resistance in this case. This special case can be expressed by Equation (31):
3. Electrochemical Impedance Spectroscopy
EIS measures perturbation response in a battery. Voltage and current measurements are converted from the time domain to the frequency domain to get the internal impedance spectrum. From the impedance spectrum, internal resistance can be obtained. The impedance spectrum represents internal circuit parameters of a battery, which give a good insight into electrochemical behavior. EIS is inherently hysteresis free because of its AC perturbation signal [25]. To understand EIS, it is necessary to explain the Adaptive Randles Equivalent Circuit Model (AR-ECM) [12].
3.1. Adaptive Randles Equivalent Circuit Model
The AR-ECM for a battery as shown in Figure 5 consists of a voltage source, , stray inductance, L, Ohmic resistance, , solid electrolytic interface impedance, , Faradaic impedance (double layer capacitance, and charge transfer resistance, ), and Warburg impedance, .
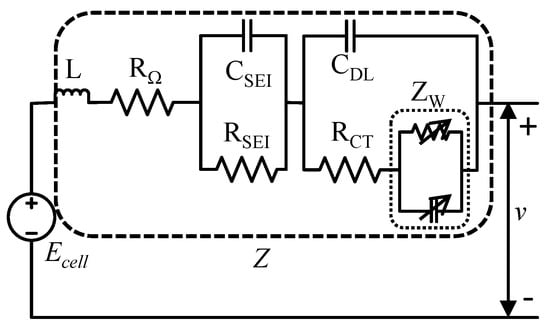
Figure 5.
AR-ECM for a Li-ion battery.
3.1.1. Output Voltage Model
The cell potential is analogous to OCV, and can be determined by the Nernst Equation (34):
where is the cell potential, is the standard cell potential, R is the gas constant, T is the absolute temperature, n is the number of electron transfers in the reaction, F is the Faraday constant, and Q is the reaction quotient.
3.1.2. Impedance Model
Li-Ion battery battery impedance, Z, is comprised of different contributing factors as shown in Figure 5. Those factors are discussed below.
Inductance
A negligible amount of inductance, L, occurs due to parasitics in the wire and metal. Inductive impedance, , is a frequency-dependent component and expressed by Equation (35).
where , and is the angular frequency, .
Ohmic Resistance
Ohmic resistance, , is the resistance of bulk material in a battery. is comprised of electrolyte resistance, current collector resistance, electrode resistance, and binder resistance. Electrolyte resistance is dominant here and depends on ionic concentration, geometry of the cell, temperature and SOC. is independent of frequency, which is shown in Equation (36).
Solid Electrolyte Interface impedance
Solid Electrolyte Interface impedance, , occurs because of mass transfer and polarization. Frequency response of is expressed using resitance and capacitance in Equation (37).
Faradaic impedance
Faradaic impedance is comprised of double layer capacitance, , and charge transfer resistance, . depends on the porosity and tortuosity of the electrodes.
Warburg Impedance
Warburg impedance, , is related to the diffusion of particles [41]. Resistive and capacitive elements are equal for . The value of this impedance is significant at low frequencies. is expressed by Equations (38) and (39).
where is the Warburg Coefficient, A is the surface area of the electrode, C is the concentration, D is the diffusion coefficient, is the oxidant, is the reductant, and b represents the bulk material. The models of Faradaic and Warburg impedance are combined in Equation (40).
3.2. Response of a Battery in EIS Test
The EIS test has been conducted for the same batteries that were used in the ECM based parameter estimation. The experimental set up and block diagram for the EIS test is shown in Figure 6. The Solartron 1455 cell test system has been used to conduct this test.AC perturbation current 70 mA on top of 200 mA DC current was applied to a Samsung-B600BC battery. The frequency has been swept from 0.1 Hz to 10 kHz using a chirp perturbation signal. For Samsung-18650 battery, 100 mA AC perturbation was applied from 0.05 Hz to 5 kHz. The celltest system can measure the few milivolt voltage response caused by current perturbation. It also performs the analysis, and gives V, I, , , f and . An explanatory impedance plot (inverted Nyquist plot) of the battery is shown in Figure 7. The impedance plot is used to analyze electrochemical behavior of the battery.
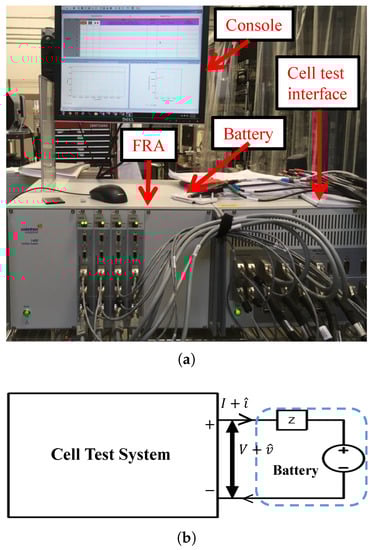
Figure 6.
EIS experimental set up: (a) test bench; (b) block diagram.
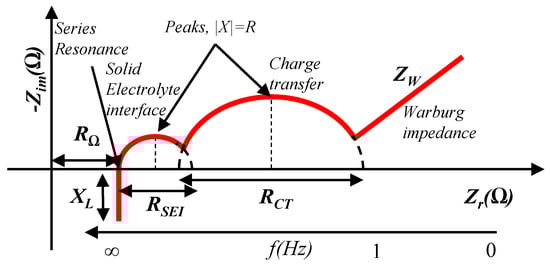
Figure 7.
Properties of an impedance plot for a battery [1].
3.3. Computation Technique in EIS
Frequency response includes perturbation and measurement of voltage and current over a range of frequencies. The time domain voltage and current measurement is converted to frequency domain by Fast Fourier Transformation (FFT) as expressed by Equation (42). After performing the FFT, impedance is calculated in the complex plane. The complex impedance in frequency domain provides the Nyquist plot and Bode plot.
4. Proposed Parameter Extraction Algorithm
Recently, EIS is implemented in conjunction with a charger, which is known as online EIS [42,43,44]. Online EIS provides the opportunity to track the internal condition of a battery while it is in operation. Online EIS needs a fast interpretation method for impedance spectrum. Parameter estimation and curve fitting methods are available to interpret impedance spectrum [10,17]. These methods are based on iterative regression analysis and required high computing power. For fast interpretation of impedence spectrum, an algorithm shown in Figure 8 is proposed.
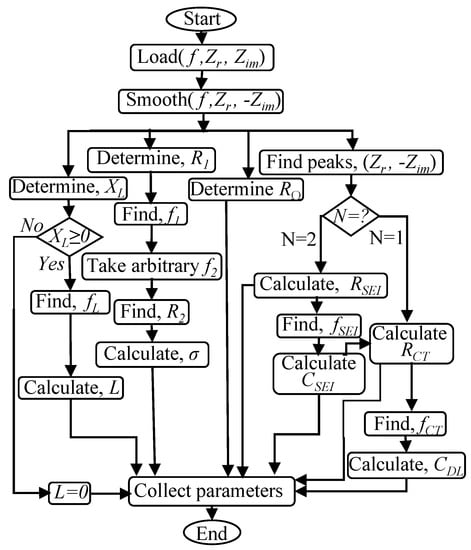
Figure 8.
Parameter extraction algorithm [1].
The proposed algorithm interprets the properties of impedance spectrum rather than iterative regression analysis. It is based on Nyquist plot, peak detection, resonance, and phasor algebra. The proposed algorithm is able to get the AR-ECM parameters from an impedance spectrum.
First, frequency and corresponding impedances are loaded to analyze. Then, the impedance plot is smoothed. Finally, circuit parameters are extracted from the smoothed impedance plot. At very high frequencies, capacitive reactance is almost zero and only resistive and inductive parts exist. Thus, the total impedance at high frequencies is expressed by Equation (43).
For the imaginary part, the inductive reactance becomes dominant. Equation (43) can therefore be written as Equation (44).
Now, to get from the impedance plot, Equation (45) can be used.
For sub-Hertz frequencies, Warburg impedance is dominant. It causes a 45-degree slope in the impedance plot, and the resistive part can be expressed by Equation (47).
Two sub-Hertz level frequencies are chosen to determine the Warburg coefficient, . First, the maximum value of resistance, , () and the corresponding minimum frequency, , are selected. Then, an arbitrary frequency is chosen such that . is the corresponding resistance to , which is found from the impedance spectrum. Now, Equation (48) is used to calculate .
For frequencies close to series resonance, battery impedance can be represented by Equation (49).
The value of ohmic resistance, , is found at the series resonance frequency where it crosses the x-axis. In this case, and cancel each other out. As a result, only the resistive part exists, which is found using Equation (50) at the minimum resistance condition from the impedance plot.
To find the , , , and , the peaks in the impedance plot are used. For the peaks, the absolute value for specific resistance and reactance are equal, as in Equation (51).
5. Results and Analysis
EIS and ECM based charging/discharging tests are conducted for two Li-Ion batteries. Internal resistance and other parameters obtained from both methods are analyzed and compared as follows.
5.1. Parameter Estimation Based on ECM
The actual test voltage, current, SOC, and OCV are presented in Figure 3 and Figure 4. The estimated SOC-OCV relationship has been presented in Figure 9 which are obtained by a conventional method using two models: the combined model (10) and combined+3 model (11). Figure 9 also shows the SOC-OCV parameter estimation using a proposed hysteresis-free method. The error () of the estimation is shown in Figure 10. The estimated parameters are shown in Table 1 and Table 2. The parameters are relevant to (8), (10), (11), (27), and (33). The estimated parameters of B600BC battery are different than the 18650 battery.
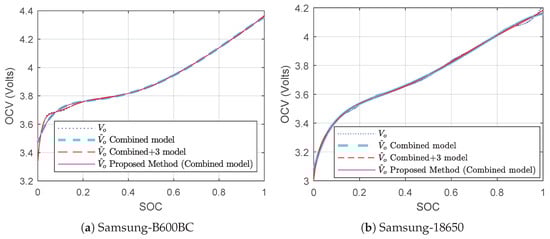
Figure 9.
SOC vs. OCV estimation in ECM.

Figure 10.
OCV estimation error in ECM.

Table 1.
Estimated parameters: Samsung-B600BC.
Table 2.
Estimated parameters: Samsung-18650.
The estimated DC internal resistance, , from the proposed method versus the actual value of effective resistance, , and estimated effective resistance, , from different methods are shown in Figure 11. is considered constant with respect to SOC in the conventional estimation technique. The proposed method considers as a varying quantity.

Figure 11.
SOC vs. resistance estimation in ECM.
The actual has been calculated from (measured voltage-actual OCV) and current. The pattern of calculated matches earlier research of hysteresis [24]. Figure 11 shows that, in the conventional method, is the average of actual . The proposed method fits the curve to actual in quadratic form. The estimated value of from the proposed method gives the value of at 100% SOC. The estimated from the proposed method is hysteresis-free and can be compared to the measurement from the EIS test. The proposed differs significantly from the conventional . ECM experimentation and the proposed hysteresis-free method have been validated by repeated tests and comparing results with [2,23,24,25].
5.2. Parameter Extraction from EIS Tests
The EIS test has been conducted for the same battery used in the ECM based parameter estimation. The test has been conducted for different SOC levels varying from 0% to 100% in a discharging cycle as shown in Figure 12.

Figure 12.
Impedance plots from EIS tests.
Impedance spectra have been obtained using Solartron 1455, and stored in Excel files. The Excel file has been used later in the parameter extraction algorithm. The extracted parameters for different SOC levels are shown in Table 3. is the main contributing factor of battery impedance and its value is ≈ 230 m for B600BC battery and ≈ 13 m for 18650 battery. The value of is almost th of for B600BC battery and is almost rd for 18650 battery. The value of is a few Farads for the B600BC battery and a fraction of a Farad for a 18650 battery. and are not included in the Table 3 because their values are negligible. There was only one peak for each impedance plots shown in Figure 12. This indicates that the value of and are negligible compared to other portions of the impedance. The values are negligible because a new battery is used for the EIS tests. The extracted parameters can form the AR-ECM, as described in Section 3.
Table 3.
Extracted parameters from EIS.
5.3. Unification of Methods for Resistance Identification
The results from ECM based parameter estimation have been compared with the EIS test results for the same battery in Figure 13. The charging discharging tests have been conducted consecutively after the EIS tests. Thus, the change in is insignificant. At the end of the EIS tests, was 227.75 m for B600BC battery and was 13.16 m for 18650 battery. The resistance varies between 18650 battery and B600BC battery because of different chemistry and shape. identified from conventional ECM based parameter estimation methods are ≈342 m for B600BC battery and ≈ 37 m for 18650 battery. These values differ 50% from for B600BC battery. For 18650 battery, the difference is 172%. Therefore, we conclude that does not represent the internal resistance properly. can be useful for fuel gauging but useless to determine internal electrochemical behavior of a battery. The effective resistance found by conventional ECM is , while effective resistance found by EIS testing is . The proposed method estimates , which is 236.51 m for B660BC battery and is only 3.5% different from the actual internal resistance obtained from EIS. For 18650 battery, the estimated value of by the proposed method is 11.41 m and differs only 1.76 m from the value of . Therefore, it can be concluded that . This unified understanding of internal resistance will be useful for estimating internal electrochemical behavior of a battery.
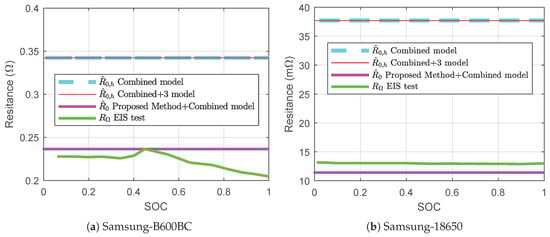
Figure 13.
Identified internal resistances from different methods.
6. Conclusions
Parameter identification methods (based on ECM and EIS) for a Li-Ion battery are compared considering their similarities and differences. Hysteresis is the major difference between the two methods for resistance identification. To compare the methods, the following theories are developed:
- A parameter extraction algorithm to interpret the properties of impedance spectrum.
- A hysteresis-free ECM based parameter estimation method.
- Internal resistance obtained from EIS test is approximately equal to hysteresis-free resistance from ECM based parameter estimation
These theories are validated by experimental results. The parameter extraction algorithm was applied for impedance spectra of two different batteries. The proposed hysteresis-free resistance identification method is used to analyze data obtained from a charging–discharging test. Finally, a match is found for the value of internal resistance from both methods with an insignificant tolerance. The proposed parameter extraction will be useful for the online EIS where fast interpretation of impedance spectrum is necessary. The quadratic model of hysteresis resistance separation is computationally effective and will be useful for the modeling of a battery. The proposed methods will be supplementary to track electrochemical parameters properly which can improve the accuracy of SOH prediction.
Author Contributions
All the authors contributed substantially to the manuscript.Contributions of each author are as follows: conceptualization, S.M.R.I., S.-Y.P., and B.B.; methodology, S.M.R.I.,and B.B.; software, S.M.R.I.; validation, S.M.R.I. and S.-Y.P.; formal analysis, S.M.R.I.; investigation, S.M.R.I.; resources, S.I. and S.-Y.P.; data curation, S.M.R.I.; writing—original draft preparation, S.M.R.I.; writing—review and editing, S.M.R.I. and S.-Y.P.; visualization, S.M.R.I.; supervision, S.-Y.P. and B.B.; project administration, S.-Y.P.; funding acquisition, S.-Y.P. All authors have read and agreed to the published version of the manuscript.
Funding
This research was funded by the National Science Foundation of under Grant No. 1454578.
Acknowledgments
This work was supported by the National Science Foundation under Grant No. 1454578. However, any opinions, findings, conclusions, or recommendations expressed herein are those of the authors and do not necessarily reflect the views of the National Science Foundation.
Conflicts of Interest
The authors declare no conflict of interest.The funders had no role in the design of the study; in the collection, analyses, or interpretation of data; in the writing of the manuscript, or in the decision to publish the results.
References
- Islam, S.M.R.; Park, S.Y.; Balasingam, B. Circuit parameters extraction algorithm for a lithium-ion battery charging system incorporated with electrochemical impedance spectroscopy. In Proceedings of the IEEE Applied Power Electronics Conference and Exposition (APEC), San Antonio, TX, USA, 4–8 March 2018; pp. 3353–3358. [Google Scholar] [CrossRef]
- Pattipati, B.; Balasingam, B.; Avvari, G.; Pattipati, K.; Bar-Shalom, Y. Open circuit voltage characterization of lithium-ion batteries. J. Power Sources 2014, 269, 317–333. [Google Scholar] [CrossRef]
- Jossen, A. Fundamentals of battery dynamics. J. Power Sources 2006, 154, 530–538. [Google Scholar] [CrossRef]
- Brand, M.; Gläser, S.; Geder, J.; Menacher, S.; Obpacher, S.; Jossen, A.; Quinger, D. Electrical safety of commercial Li-ion cells based on NMC and NCA technology compared to LFP technology. In Proceedings of the World Electric Vehicle Symposium and Exhibition (EVS27), Barcelona, Spain, 17–20 November 2013; pp. 1–9. [Google Scholar] [CrossRef]
- Ecker, M.; Nieto, N.; Käbitz, S.; Schmalstieg, J.; Blanke, H.; Warnecke, A.; Sauer, D.U. Calendar and cycle life study of Li(NiMnCo)O2-based 18650 lithium-ion batteries. J. Power Sources 2014, 248, 839–851. [Google Scholar] [CrossRef]
- Balasingam, B.; Avvari, G.; Pattipati, B.; Pattipati, K.; Bar-Shalom, Y. A robust approach to battery fuel gauging, part I: Real time model identification. J. Power Sources 2014, 272, 1142–1153. [Google Scholar] [CrossRef]
- Pastor-Fernández, C.; Widanage, W.D.; Chouchelamane, G.H.; Marco, J. A SoH diagnosis and prognosis method to identify and quantify degradation modes in Li-ion batteries using the IC/DV technique. In Proceedings of the 6th Hybrid and Electric Vehicles Conference (HEVC 2016), London, UK, 2–3 November 2016; pp. 1–6. [Google Scholar] [CrossRef]
- Zhang, D.; Dey, S.; Perez, H.E.; Moura, S.J. Remaining useful life estimation of Lithium-ion batteries based on thermal dynamics. In Proceedings of the American Control Conference (ACC), Seattle, WA, USA, 24–26 May 2017; pp. 4042–4047. [Google Scholar] [CrossRef]
- Andre, D.; Appel, C.; Soczka-Guth, T.; Sauer, D.U. Advanced mathematical methods of SOC and SOH estimation for lithium-ion batteries. J. Power Sources 2013, 224, 20–27. [Google Scholar] [CrossRef]
- Tröltzsch, U.; Kanoun, O.; Tränkler, H.R. Characterizing aging effects of lithium ion batteries by impedance spectroscopy. Electrochim. Acta 2006, 51, 1664–1672. [Google Scholar] [CrossRef]
- Lee, Y.D.; Park, S.Y. Electrochemical State-Based Sinusoidal Ripple Current Charging Control. IEEE Trans. Power Electron. 2015, 30, 4232–4243. [Google Scholar] [CrossRef]
- Pastor-Fernández, C.; Widanage, W.D.; Marco, J.; Gama-Valdez, M.Á.; Chouchelamane, G.H. Identification and quantification of ageing mechanisms in Lithium-ion batteries using the EIS technique. In Proceedings of the IEEE Transportation Electrification Conference and Expo (ITEC), Dearborn, MI, USA, 27–29 June 2016; pp. 1–6. [Google Scholar] [CrossRef]
- Cuadras, A.; Kanoun, O. SoC Li-ion battery monitoring with impedance spectroscopy. In Proceedings of the 6th International Multi-Conference on Systems, Signals and Devices, Djerba, Tunisia, 23–26 March 2009; pp. 1–5. [Google Scholar] [CrossRef]
- Lotfi, N.; Landers, R.G.; Li, J.; Park, J. Reduced-Order Electrochemical Model-Based SOC Observer with Output Model Uncertainty Estimation. IEEE Trans. Control Syst. Technol. 2017, 25, 1217–1230. [Google Scholar] [CrossRef]
- Schweiger, H.G.; Obeidi, O.; Komesker, O.; Raschke, A.; Schiemann, M.; Zehner, C.; Gehnen, M.; Keller, M.; Birke, P. Comparison of Several Methods for Determining the Internal Resistance of Lithium Ion Cells. Sensors 2010, 10, 5604–5625. [Google Scholar] [CrossRef]
- Nagaoka, N.; Ametani, A. An estimation method of Li-ion battery impedance using z-transform. In Proceedings of the IEEE 13th Workshop on Control and Modeling for Power Electronics (COMPEL), Kyoto, Japan, 10–13 June 2012; pp. 1–6. [Google Scholar] [CrossRef]
- Wang, Q.; He, Y.; Shen, J.; Hu, X.; Ma, Z. State of Charge-Dependent Polynomial Equivalent Circuit Modeling for Electrochemical Impedance Spectroscopy of Lithium-Ion Batteries. IEEE Trans. Power Electron. 2018, 33, 8449–8460. [Google Scholar] [CrossRef]
- Lai, X.; Gao, W.; Zheng, Y.; Ouyang, M.; Li, J.; Han, X.; Zhou, L. A comparative study of global optimization methods for parameter identification of different equivalent circuit models for Li-ion batteries. Electrochim. Acta 2019, 295, 1057–1066. [Google Scholar] [CrossRef]
- Chu, Z.; Jobman, R.; Rodríguez, A.; Plett, G.L.; Trimboli, M.S.; Feng, X.; Ouyang, M. A control-oriented electrochemical model for lithium-ion battery. Part II: Parameter identification based on reference electrode. J. Energy Storage 2020, 27, 101101. [Google Scholar] [CrossRef]
- Gould, C.R.; Bingham, C.M.; Stone, D.A.; Bentley, P. New Battery Model and State-of-Health Determination Through Subspace Parameter Estimation and State-Observer Techniques. IEEE TTrans. Veh. Technol. 2009, 58, 3905–3916. [Google Scholar] [CrossRef]
- Zhang, J.; Lee, J. A review on prognostics and health monitoring of Li-ion battery. J. Power Sources 2011, 196, 6007–6014. [Google Scholar] [CrossRef]
- Somakettarin, N.; Funaki, T. Study on Factors for Accurate Open Circuit Voltage Characterizations in Mn-Type Li-Ion Batteries. Batteries 2017, 3, 8. [Google Scholar] [CrossRef]
- Roscher, M.A.; Bohlen, O.; Vetter, J. OCV hysteresis in Li-ion batteries including two-phase transition materials. Int. J. Electrochem. 2011, 2011, 984320. [Google Scholar] [CrossRef]
- Baronti, F.; Femia, N.; Saletti, R.; Zamboni, W. Comparing open-circuit voltage hysteresis models for lithium-iron-phosphate batteries. In Proceedings of the IECON 2014—40th Annual Conference of the IEEE Industrial Electronics Society, Dallas, TX, USA, 29 October–1 November 2014; pp. 5635–5640. [Google Scholar] [CrossRef]
- Plett, G.L. Battery Management Systems, Volume I: Battery Modeling, Chapter 2; Artech House: Norwood, MA, USA, 2015; Chapter 2; pp. 29–63. [Google Scholar]
- Rahimi Eichi, H.; Chow, M. Modeling and analysis of battery hysteresis effects. In Proceedings of the IEEE Energy Conversion Congress and Exposition (ECCE), Raleigh, NC, USA, 15–20 September 2012; pp. 4479–4486. [Google Scholar] [CrossRef]
- Marongiu, A.; Nußbaum, F.G.W.; Waag, W.; Garmendia, M.; Sauer, D.U. Comprehensive study of the influence of aging on the hysteresis behavior of a lithium iron phosphate cathode-based lithium ion battery—An experimental investigation of the hysteresis. Appl. Energy 2016, 171, 629–645. [Google Scholar] [CrossRef]
- Legrand, N.; Raël, S.; Knosp, B.; Hinaje, M.; Desprez, P.; Lapicque, F. Including double-layer capacitance in lithium-ion battery mathematical models. J. Power Sources 2014, 251, 370–378. [Google Scholar] [CrossRef]
- Erol, S. Electrochemical Impedance Spectroscopy Analysis and Modeling of Lithium Cobalt Oxide/Carbon Batteries. Ph.D. Thesis, University of Florida, Gainesville, FL, USA, 2015. [Google Scholar]
- Müller, S.; Massarani, P. Transfer-function measurement with sweeps. J. Audio Eng. Soc. 2001, 49, 443–471. [Google Scholar]
- Instruments, G. Introduction to Electrochemical Impedance Spectroscopy; Application Note: Warminster, PA, USA, 2015. [Google Scholar]
- Orazem, M.E.; Tribollet, B. Electrochemical Impedance Spectroscopy; John Wiley & Sons: Pennington, NJ, USA, 2011; Volume 48. [Google Scholar]
- Liu, C.; Neale, Z.G.; Cao, G. Understanding electrochemical potentials of cathode materials in rechargeable batteries. Mater. Today 2016, 19, 109–123. [Google Scholar] [CrossRef]
- Lin, S.H.; Zhao, H.; Burke, A. A First-Order Transient Response Model for Lithium-ion Batteries of Various Chemistries: Test Data and Model Validation; Technical Report; Institute of Transportation Studies, University of California: Davis, CA, USA, 2012. [Google Scholar]
- Fuller, T.F.; Doyle, M.; Newman, J. Relaxation Phenomena in Lithium-Ion-Insertion Cells. J. Electrochem. Soc. 1994, 141, 982–990. [Google Scholar] [CrossRef]
- Zhang, H.; Chow, M. On-line PHEV battery hysteresis effect dynamics modeling. In Proceedings of the IECON 2010—36th Annual Conference on IEEE Industrial Electronics Society, Glendale, AZ, USA, 7–10 November 2010; pp. 1844–1849. [Google Scholar] [CrossRef]
- Zhao, X.; de Callafon, R.A. Modeling of battery dynamics and hysteresis for power delivery prediction and SOC estimation. Appl. Energy 2016, 180, 823–833. [Google Scholar] [CrossRef]
- Windarko, N.A.; Choi, J. Hysteresis modeling for estimation of State-of-Charge in NiMH battery based on improved Takacs model. In Proceedings of the INTELEC 2009—31st International Telecommunications Energy Conference, Incheon, Korea, 18–22 October 2009; pp. 1–6. [Google Scholar] [CrossRef]
- Hussein, A.A.; Kutkut, N.; Batarseh, I. A hysteresis model for a Lithium battery cell with improved transient response. In Proceedings of the Twenty-Sixth Annual IEEE Applied Power Electronics Conference and Exposition (APEC), Fort Worth, TX, USA, 6–11 March 2011; pp. 1790–1794. [Google Scholar] [CrossRef]
- Sasaki, T.; Ukyo, Y.; Novák, P. Memory effect in a lithium-ion battery. Nat. Mater. 2013, 12, 569. [Google Scholar] [CrossRef] [PubMed]
- Taylor, S.; Gileadi, E. Physical interpretation of the Warburg impedance. Corrosion 1995, 51, 664–671. [Google Scholar] [CrossRef]
- Qahouq, J.A.A.; Xia, Z. Single-Perturbation-Cycle Online Battery Impedance Spectrum Measurement Method with Closed-Loop Control of Power Converter. IEEE Trans. Ind. Electron. 2017, 64, 7019–7029. [Google Scholar] [CrossRef]
- Varnosfaderani, M.A.; Strickland, D. A Comparison of Online Electrochemical Spectroscopy Impedance Estimation of Batteries. IEEE Access 2018, 6, 23668–23677. [Google Scholar] [CrossRef]
- Din, E.; Schaef, C.; Moffat, K.; Stauth, J.T. A Scalable Active Battery Management System with Embedded Real-Time Electrochemical Impedance Spectroscopy. IEEE Trans. Power Electron. 2017, 32, 5688–5698. [Google Scholar] [CrossRef]
© 2020 by the authors. Licensee MDPI, Basel, Switzerland. This article is an open access article distributed under the terms and conditions of the Creative Commons Attribution (CC BY) license (http://creativecommons.org/licenses/by/4.0/).