In-Operando Impedance Spectroscopy and Ultrasonic Measurements during High-Temperature Abuse Experiments on Lithium-Ion Batteries


Abstract
1. Introduction
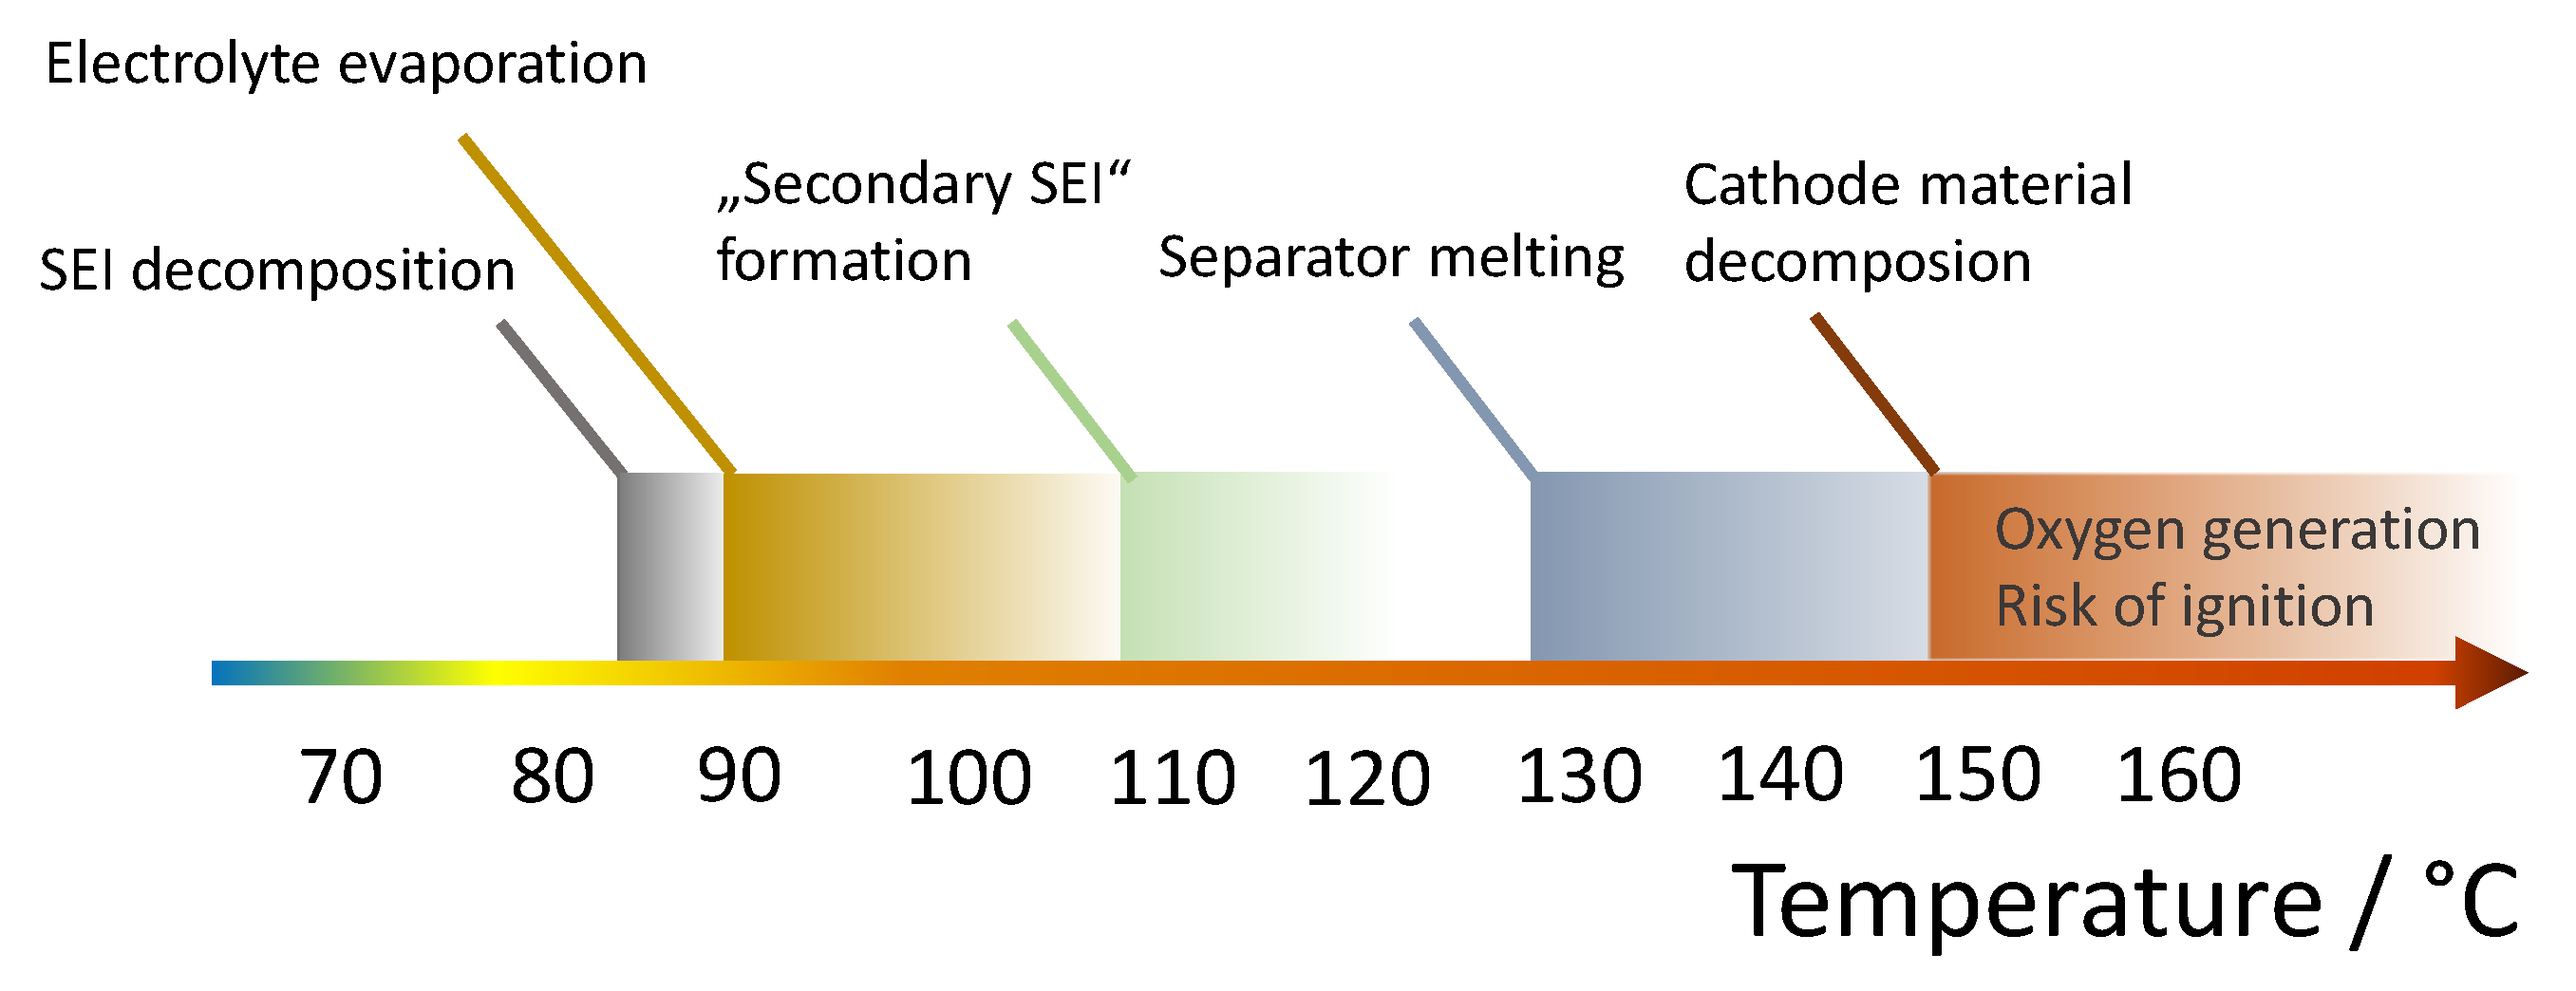
Behaviour of Lithium-Ion Batteries under High-Temperature Conditions
- 85–90 °C: Exothermic decomposition of the SEI at the anode begins [15].
- Above 130–160 °C: Melting point of polyethylene (PE) separator (Polypropylene-containing separators have a slightly higher melting temperature) [21] Formation of local internal short circuits and thus further heat generation.
- Above 140 °C: Evaporation of the solvent in the electrolyte. In the presence of free oxygen ignition possible. This oxygen can be produced, for example, by decomposition reactions in the cathode [15].
- 150–250 °C: Decomposition of the cathode material with oxygen formation [15]. LiFePO4 has the highest thermal stability of all common cathode materials. With this cathode material, the probability of ignition and explosion is therefore lower, since the formation of oxygen only begins at a significantly higher temperature. As already discussed above, Nickel-rich cathode materials suffer have a significantly lower thermal stability.
2. Experimental
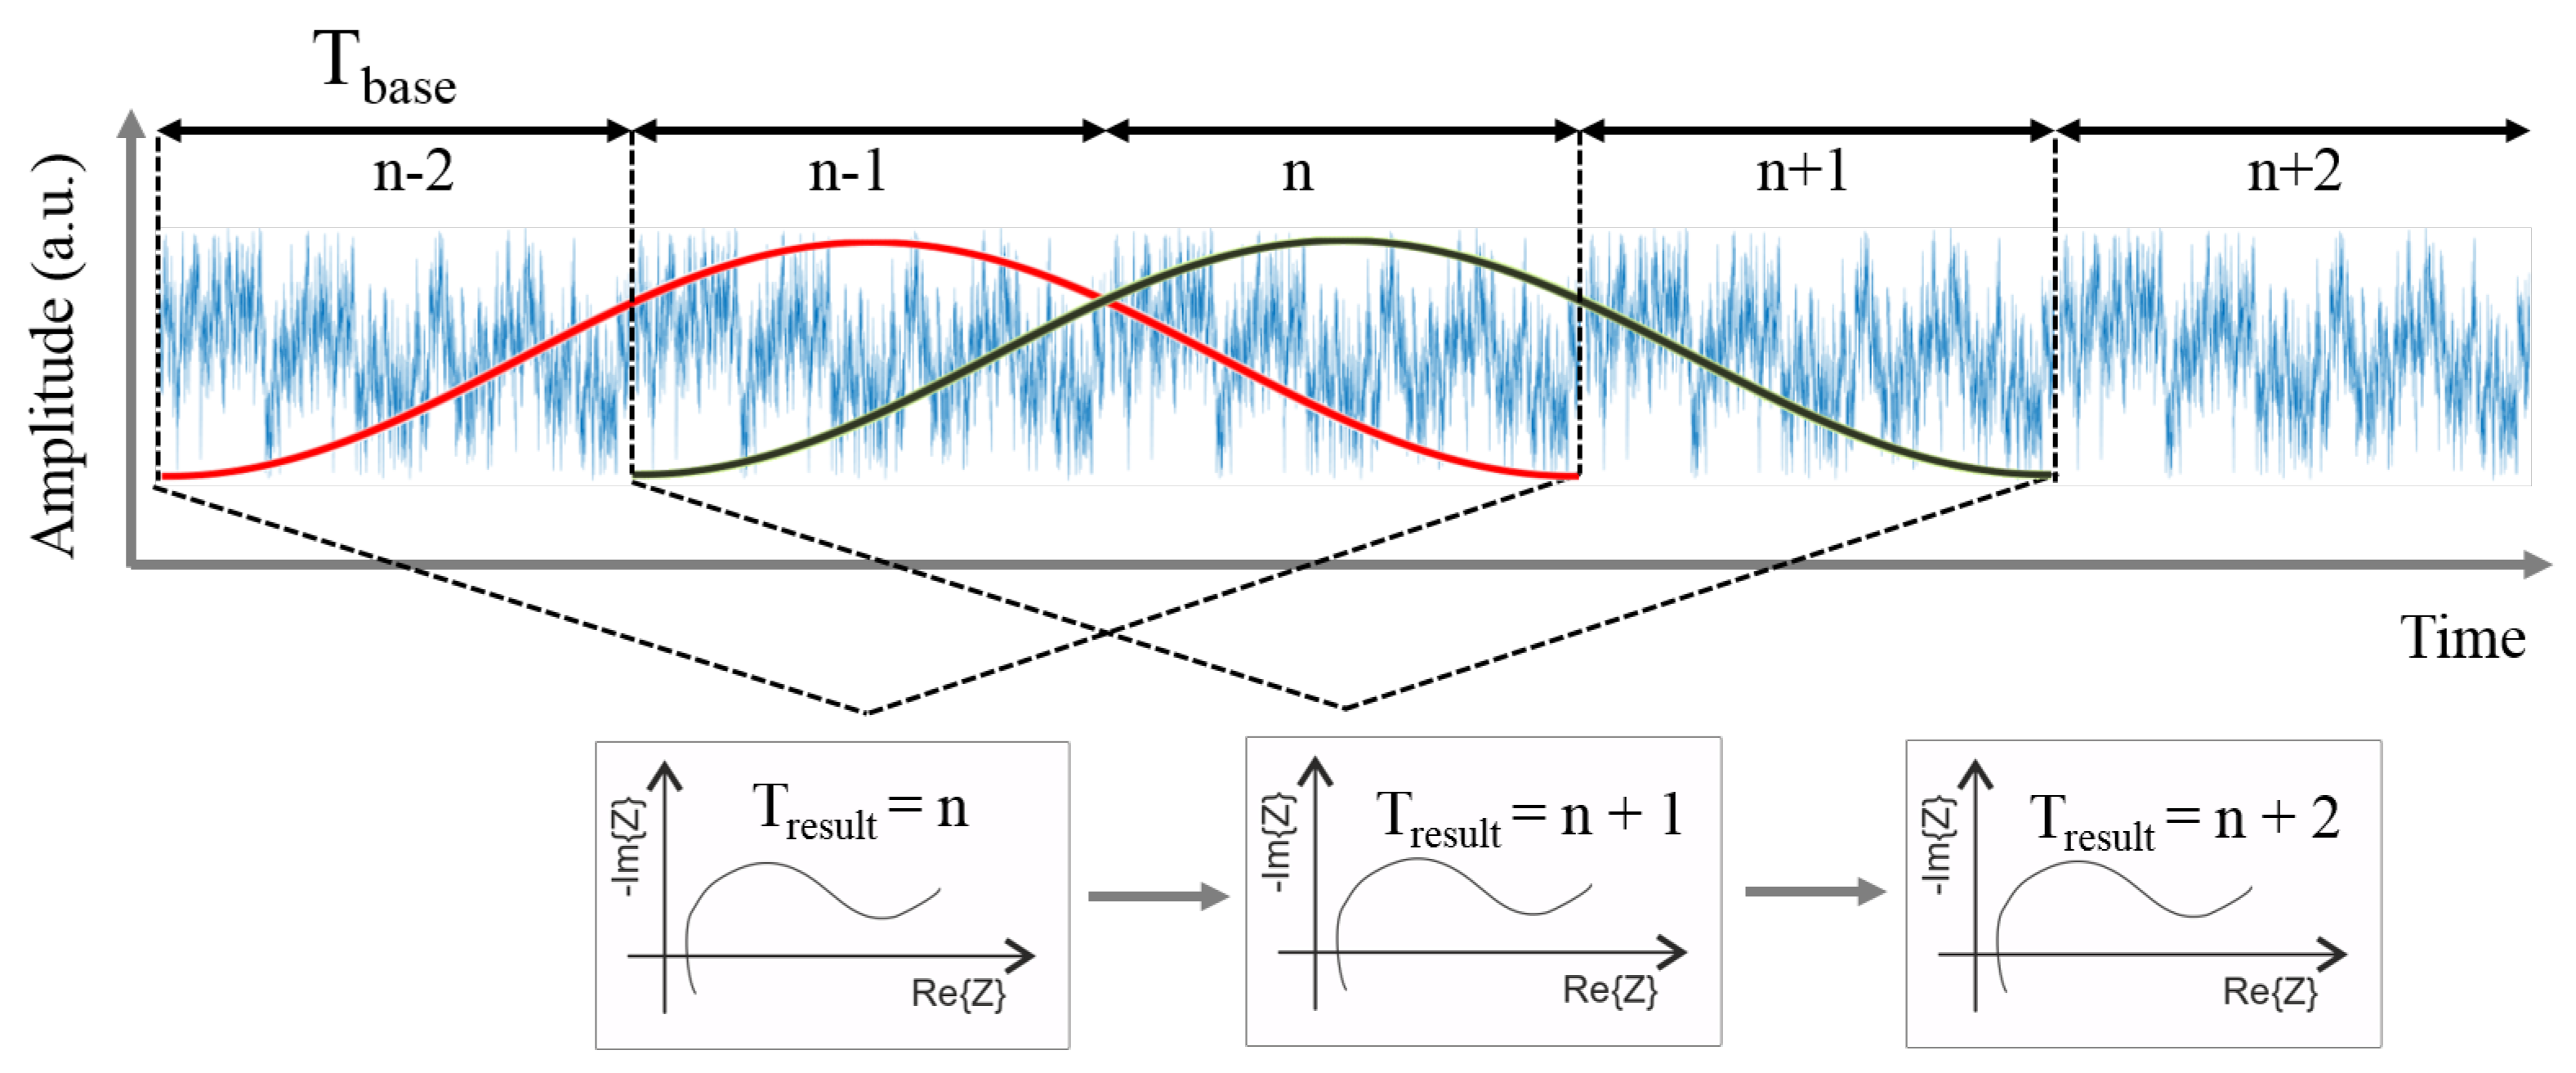
2.1. Fast Impedance Spectroscopy Measurements
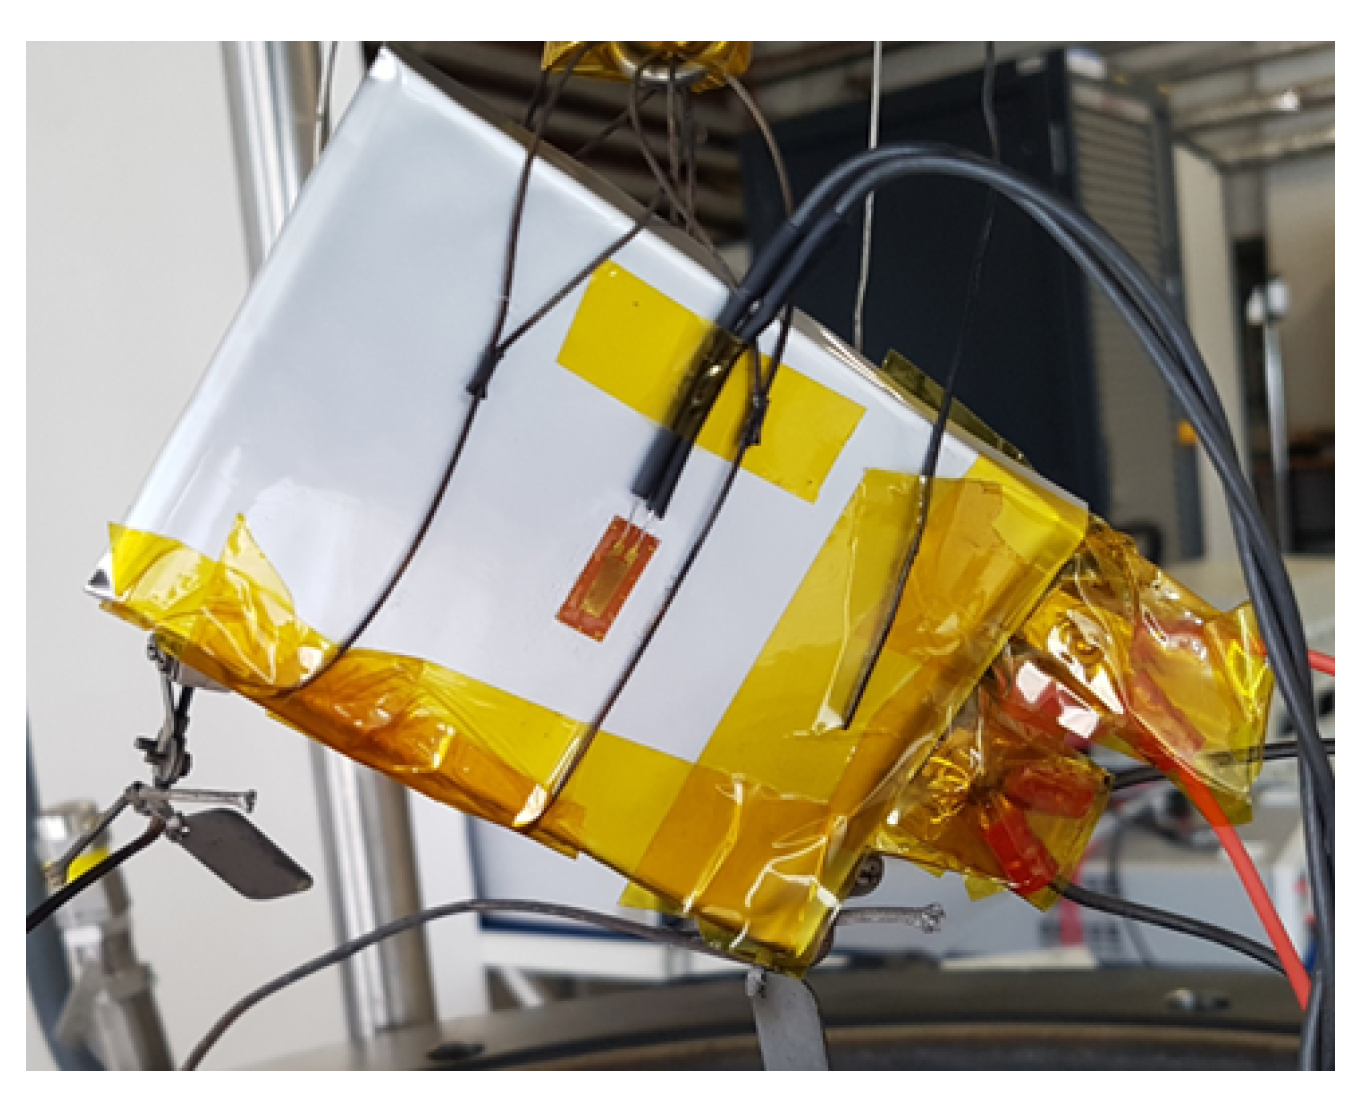
2.2. Strain Gauge Measurements
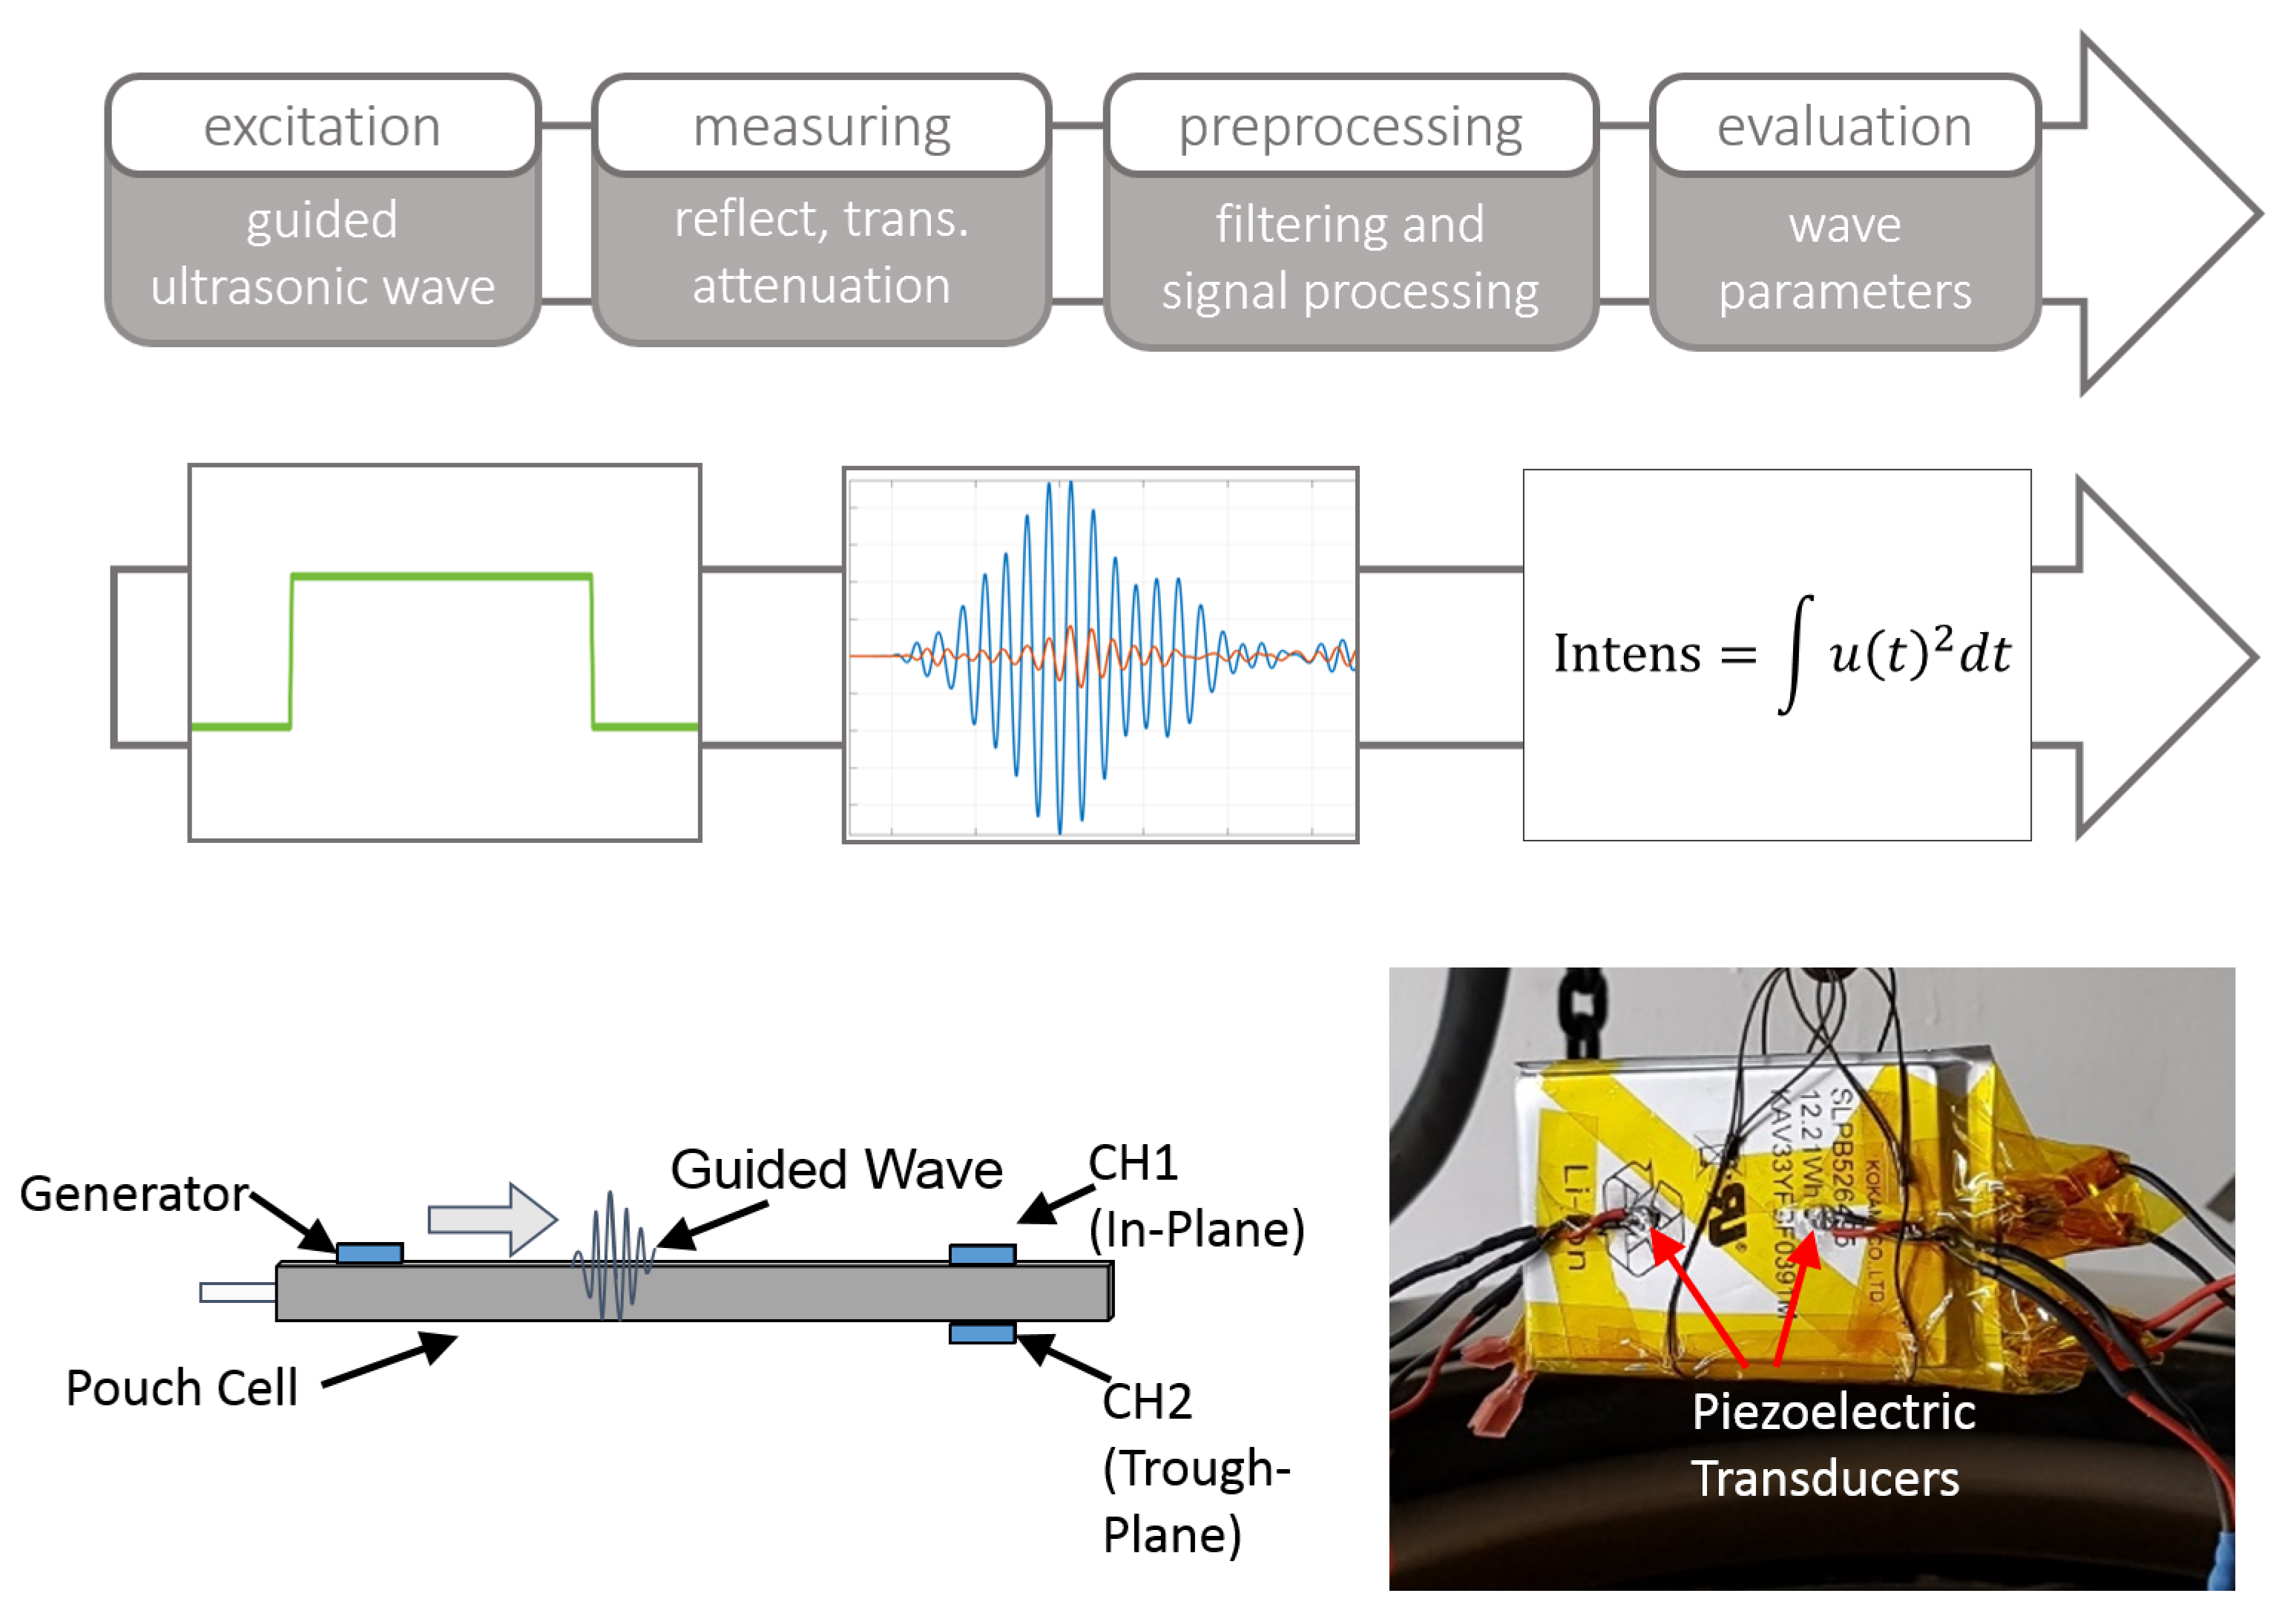
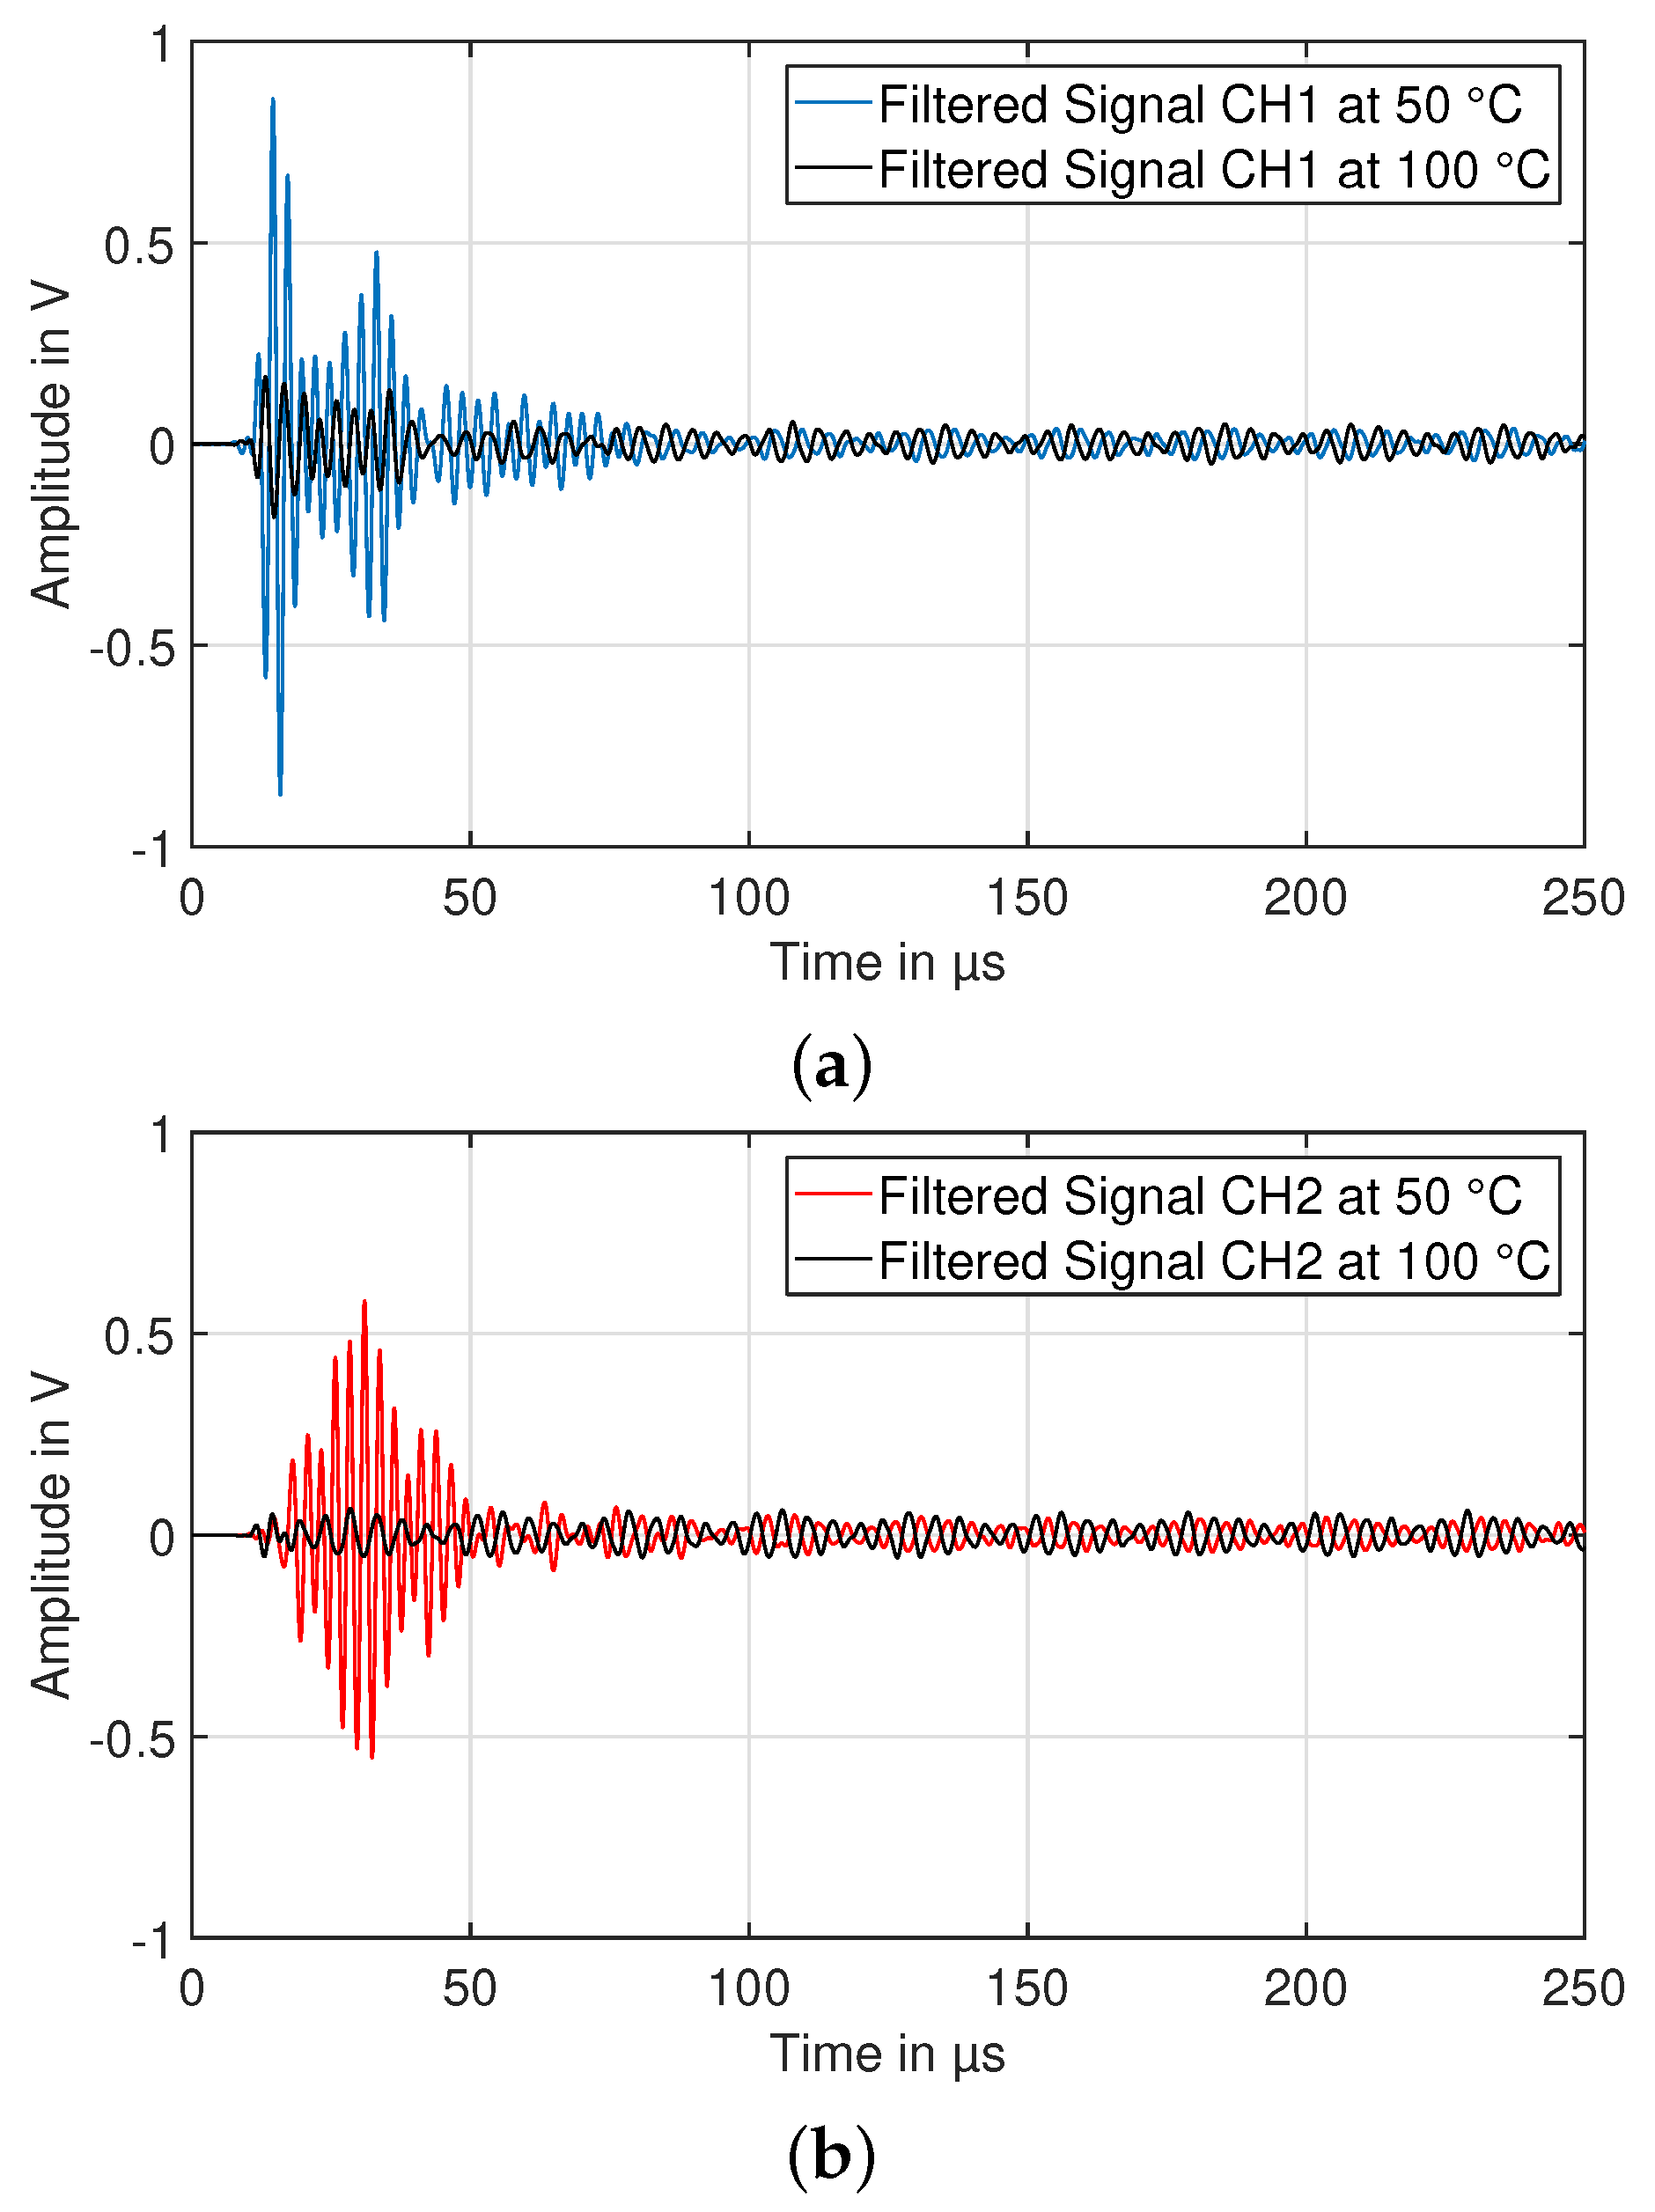
2.3. Ultrasonic Acoustic Guided Wave Measurements
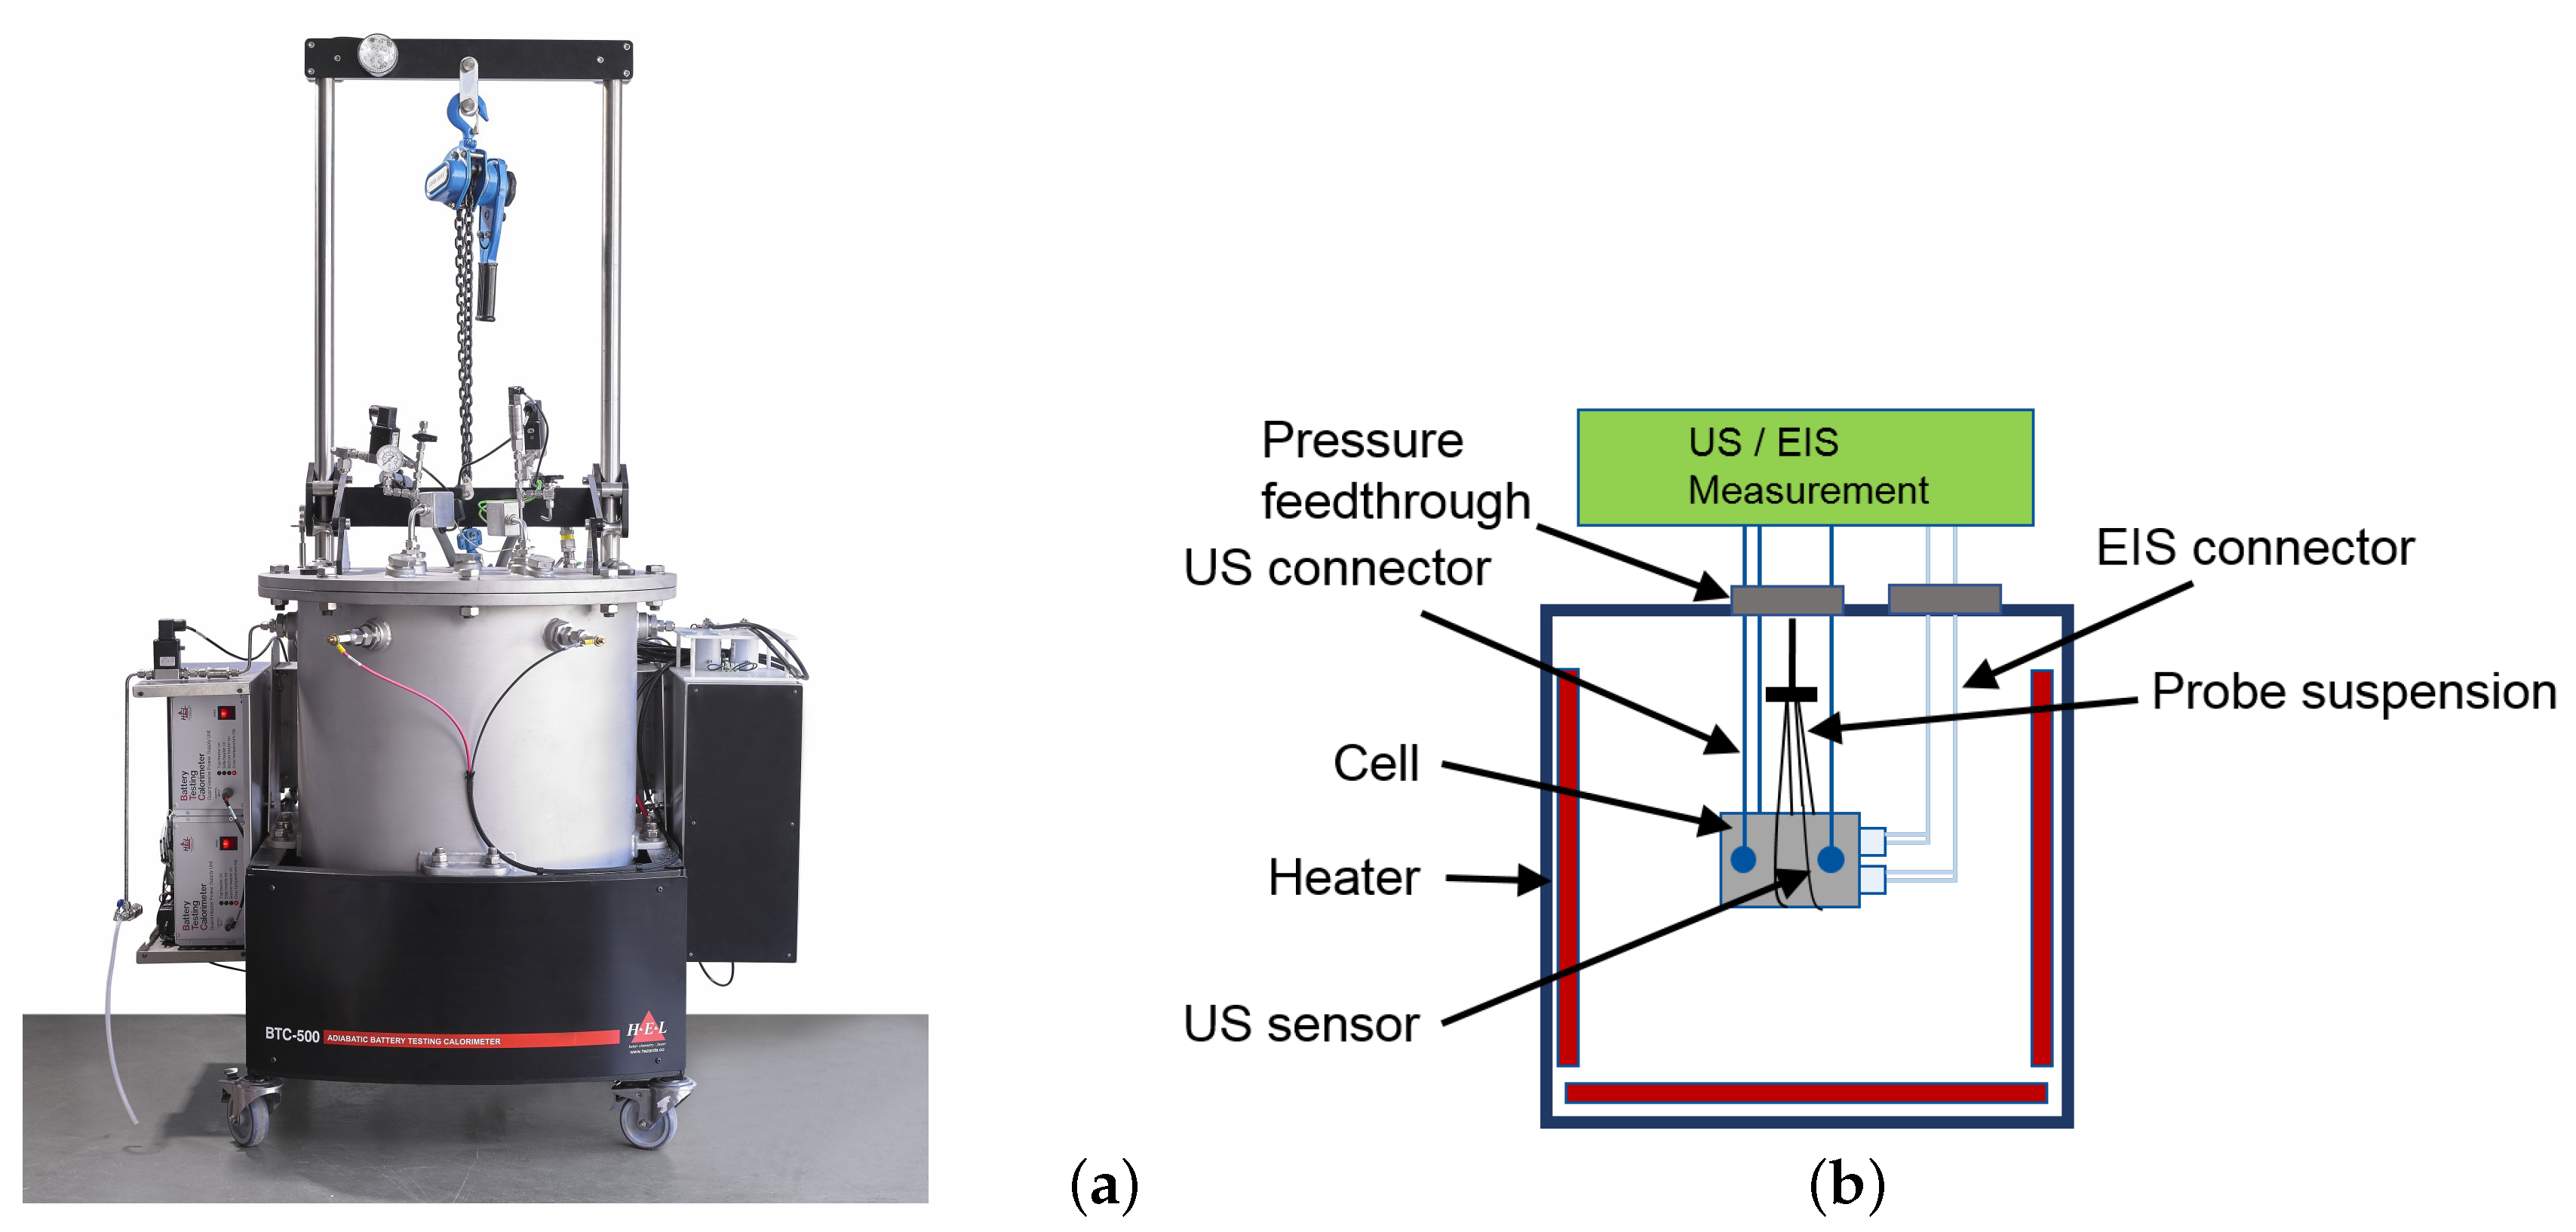
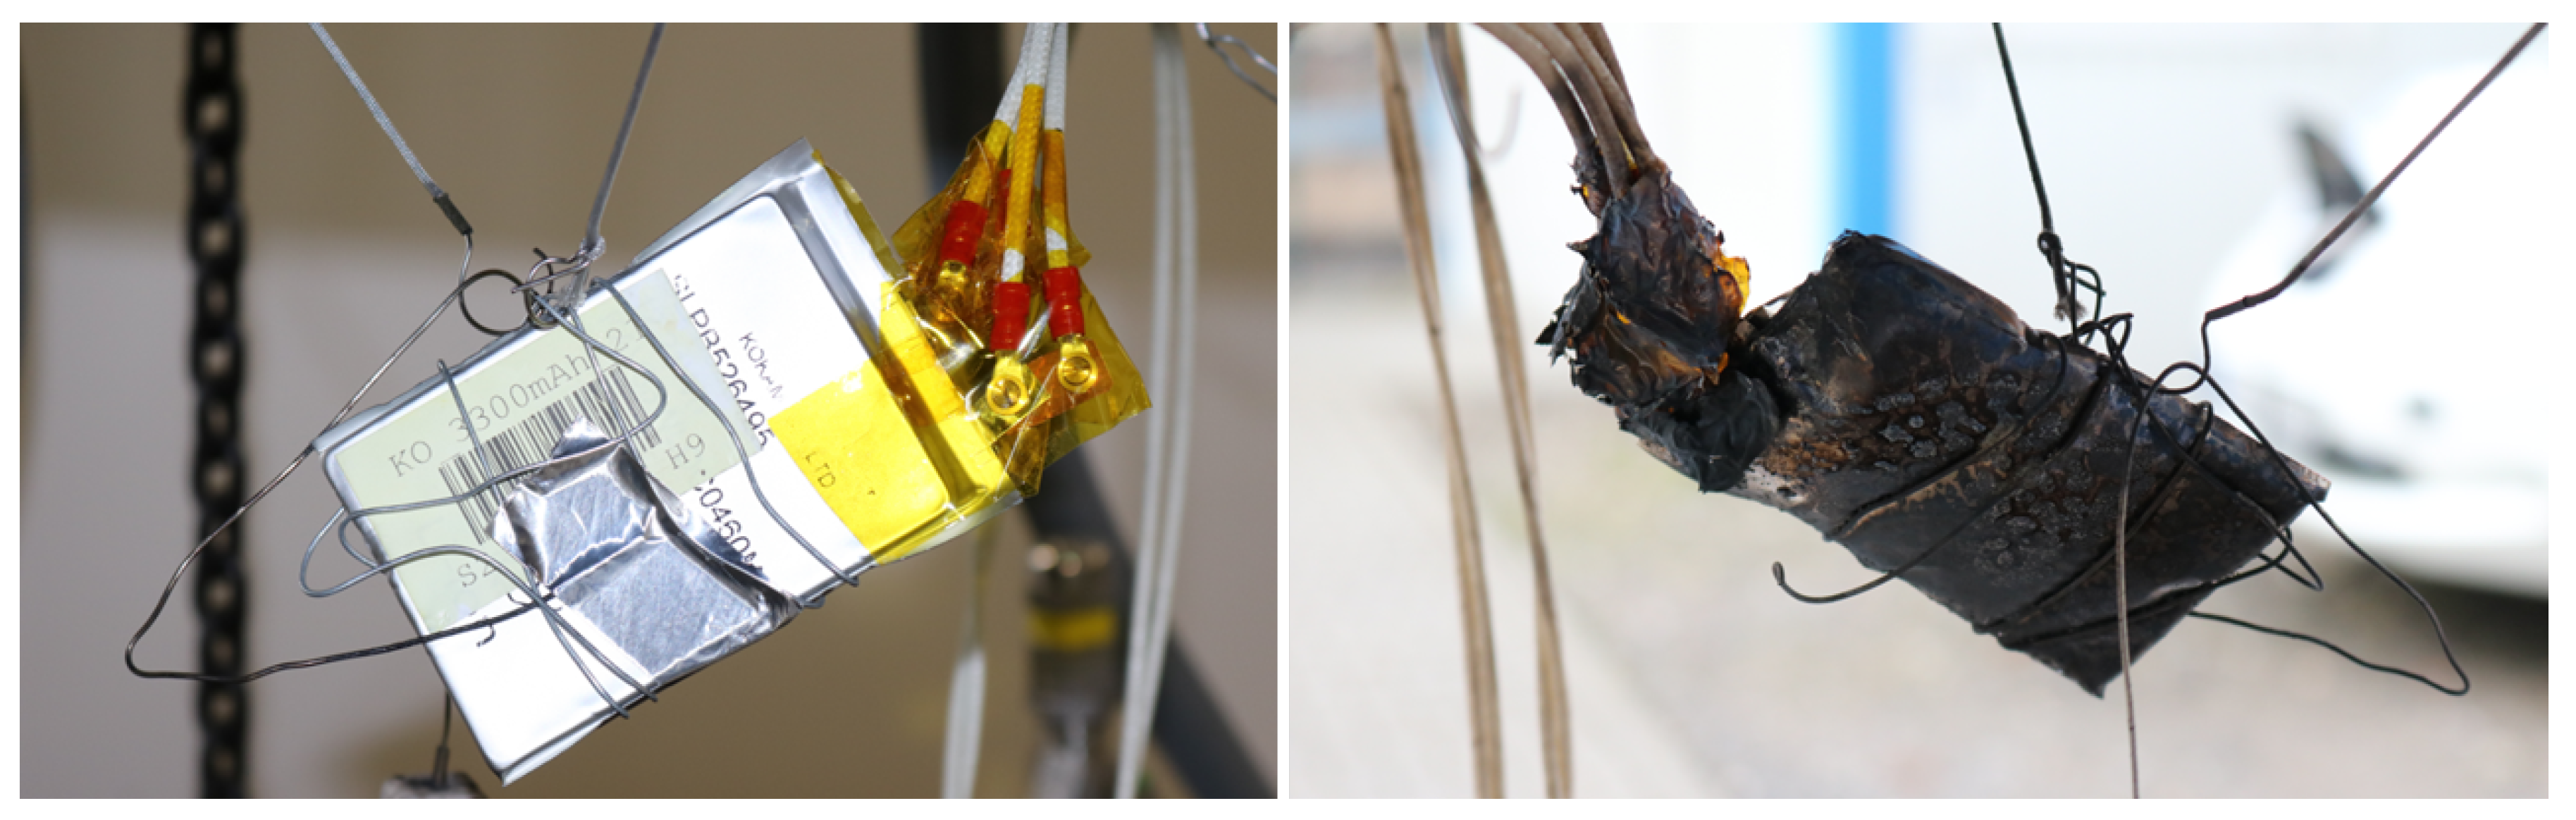
2.4. High-Temperature Abuse Experiments
3. Results and Discussion
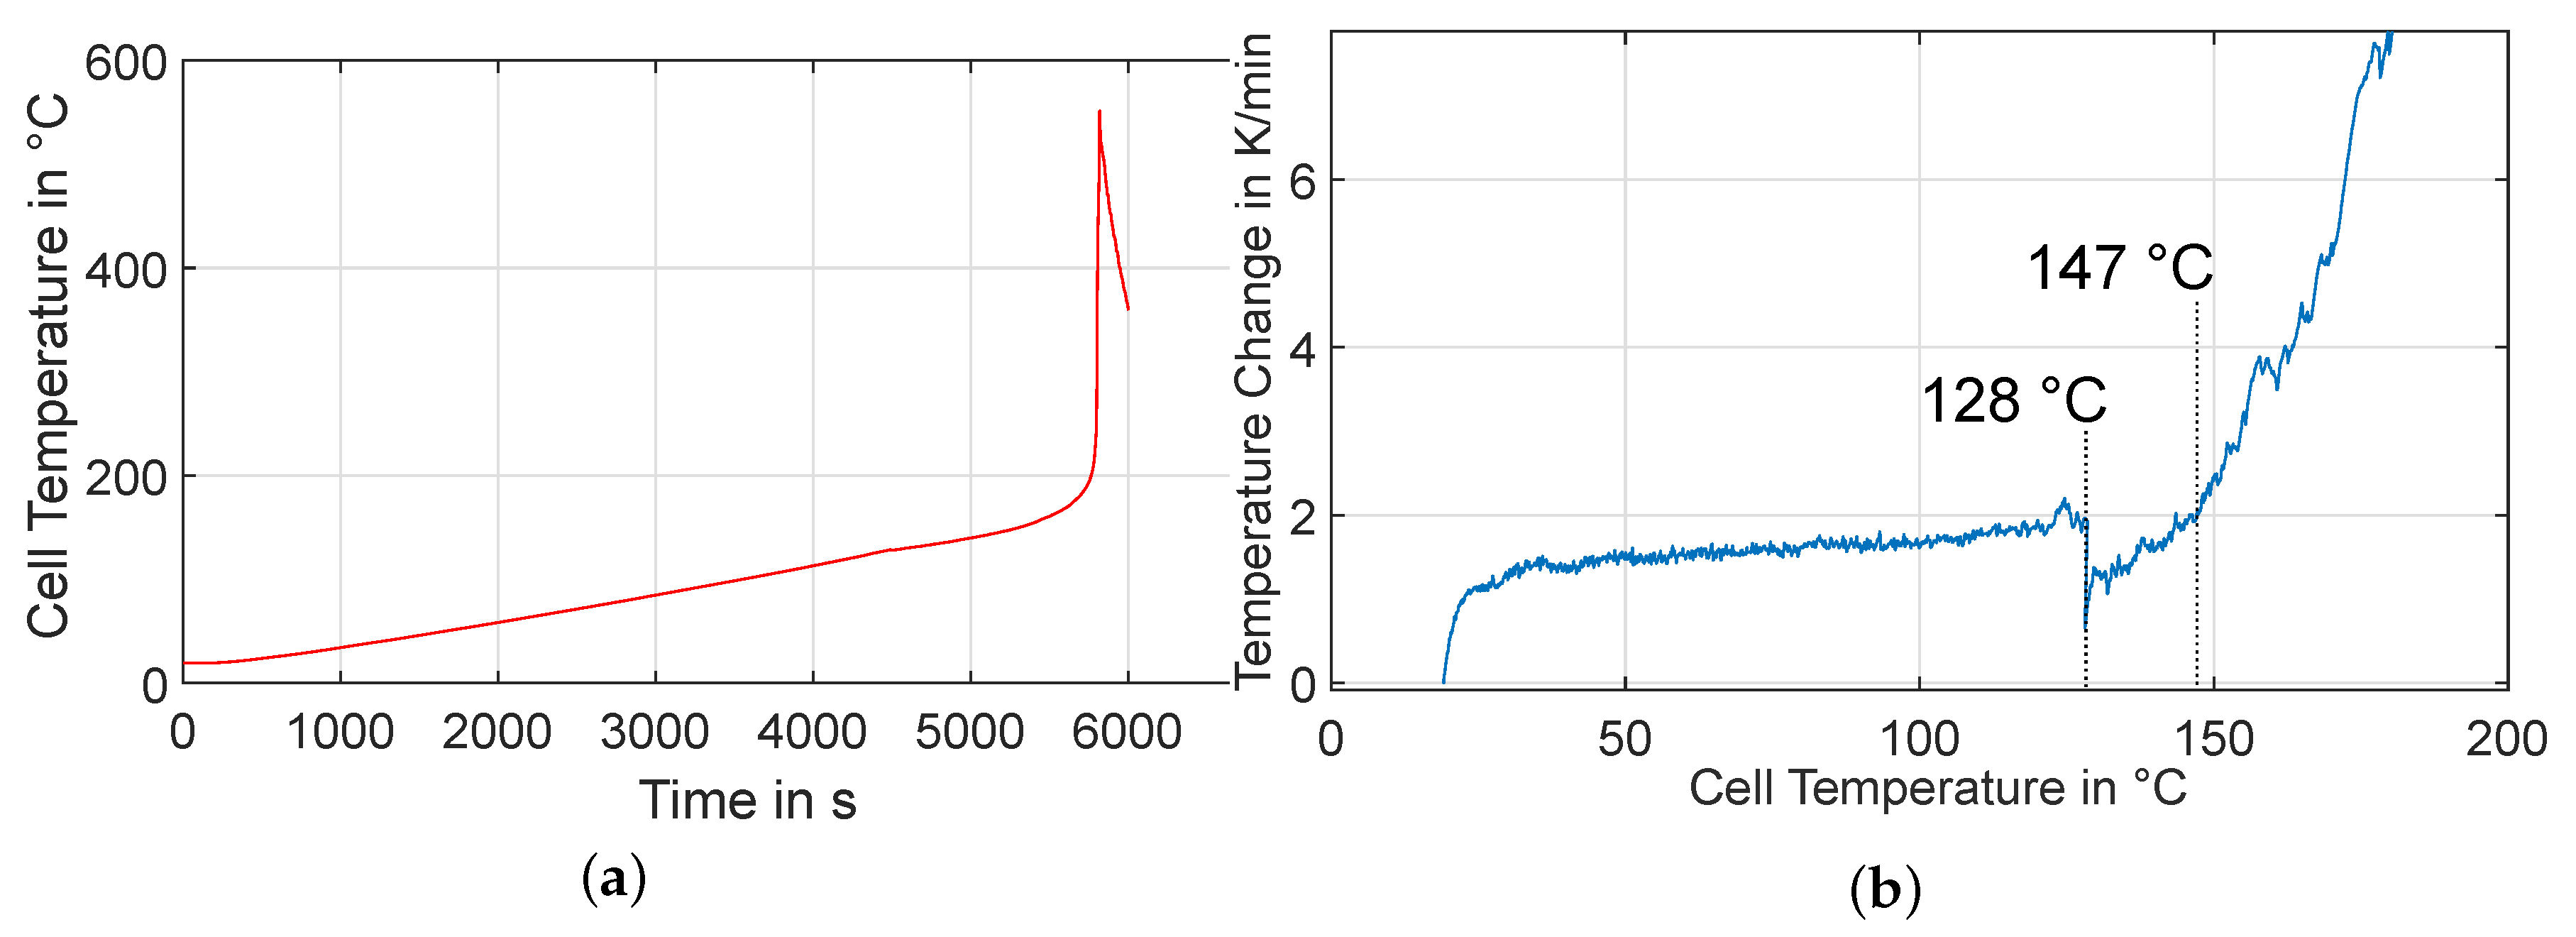
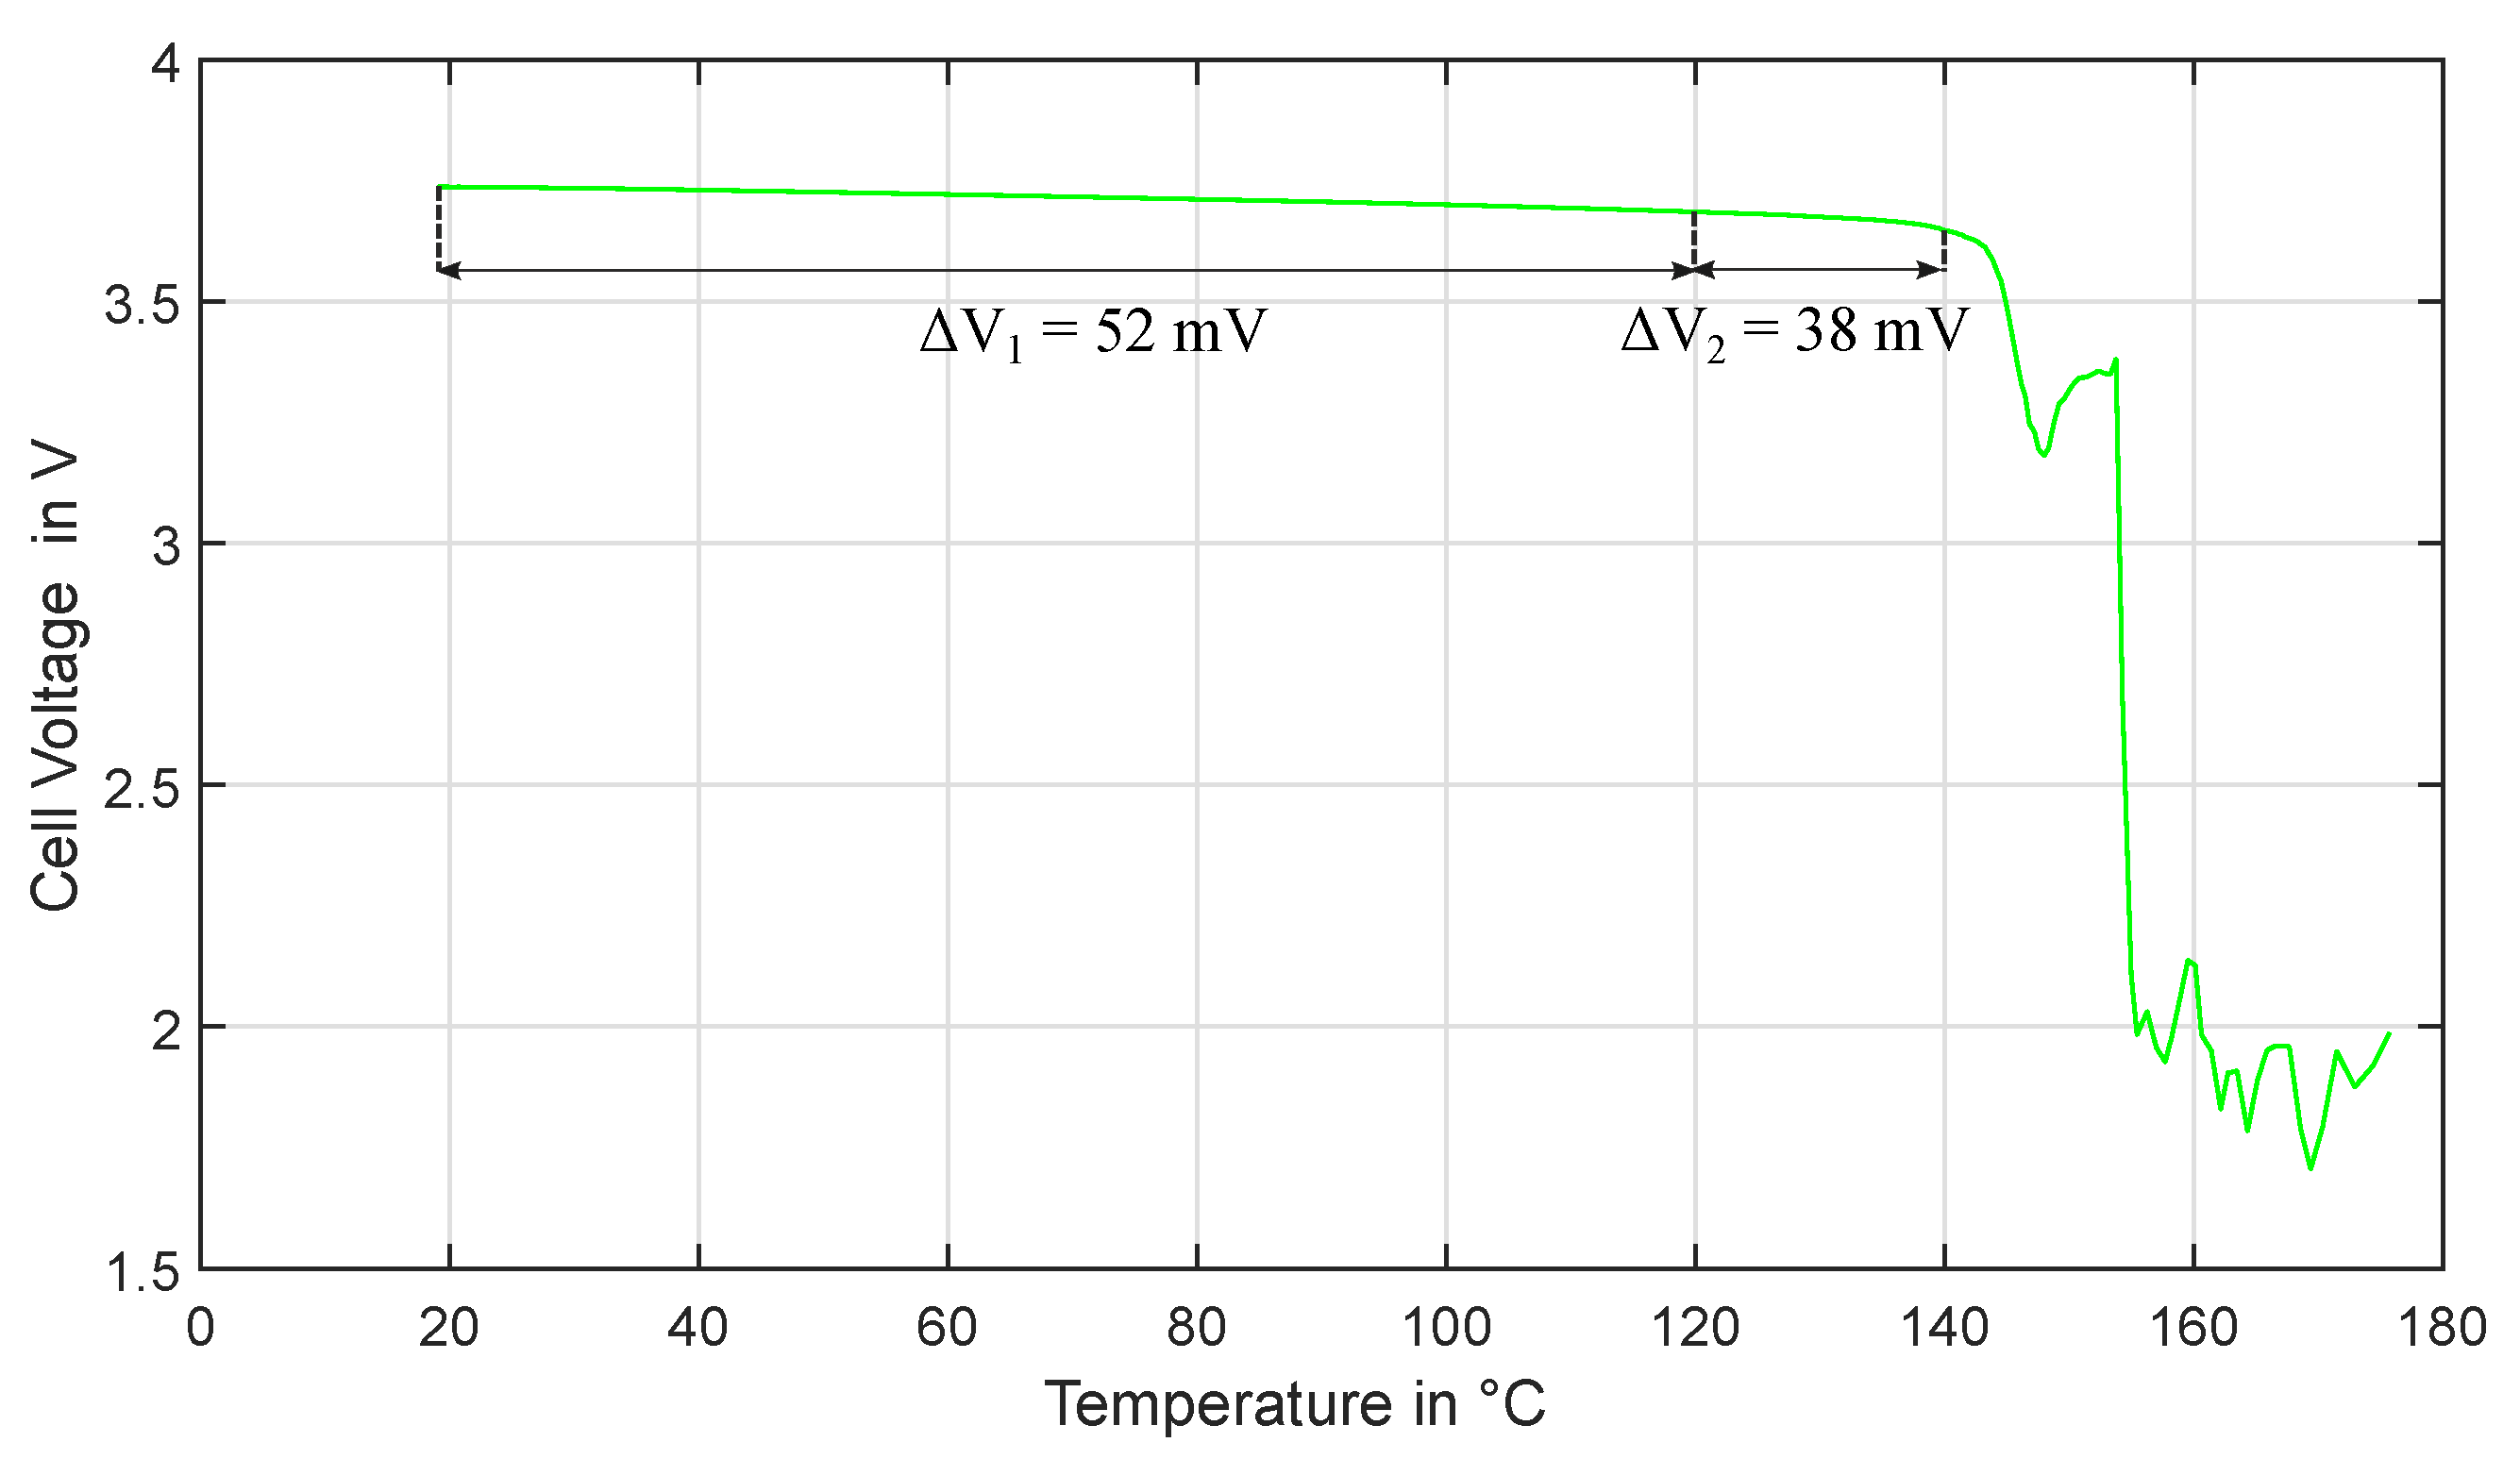
3.1. Experiment HT1
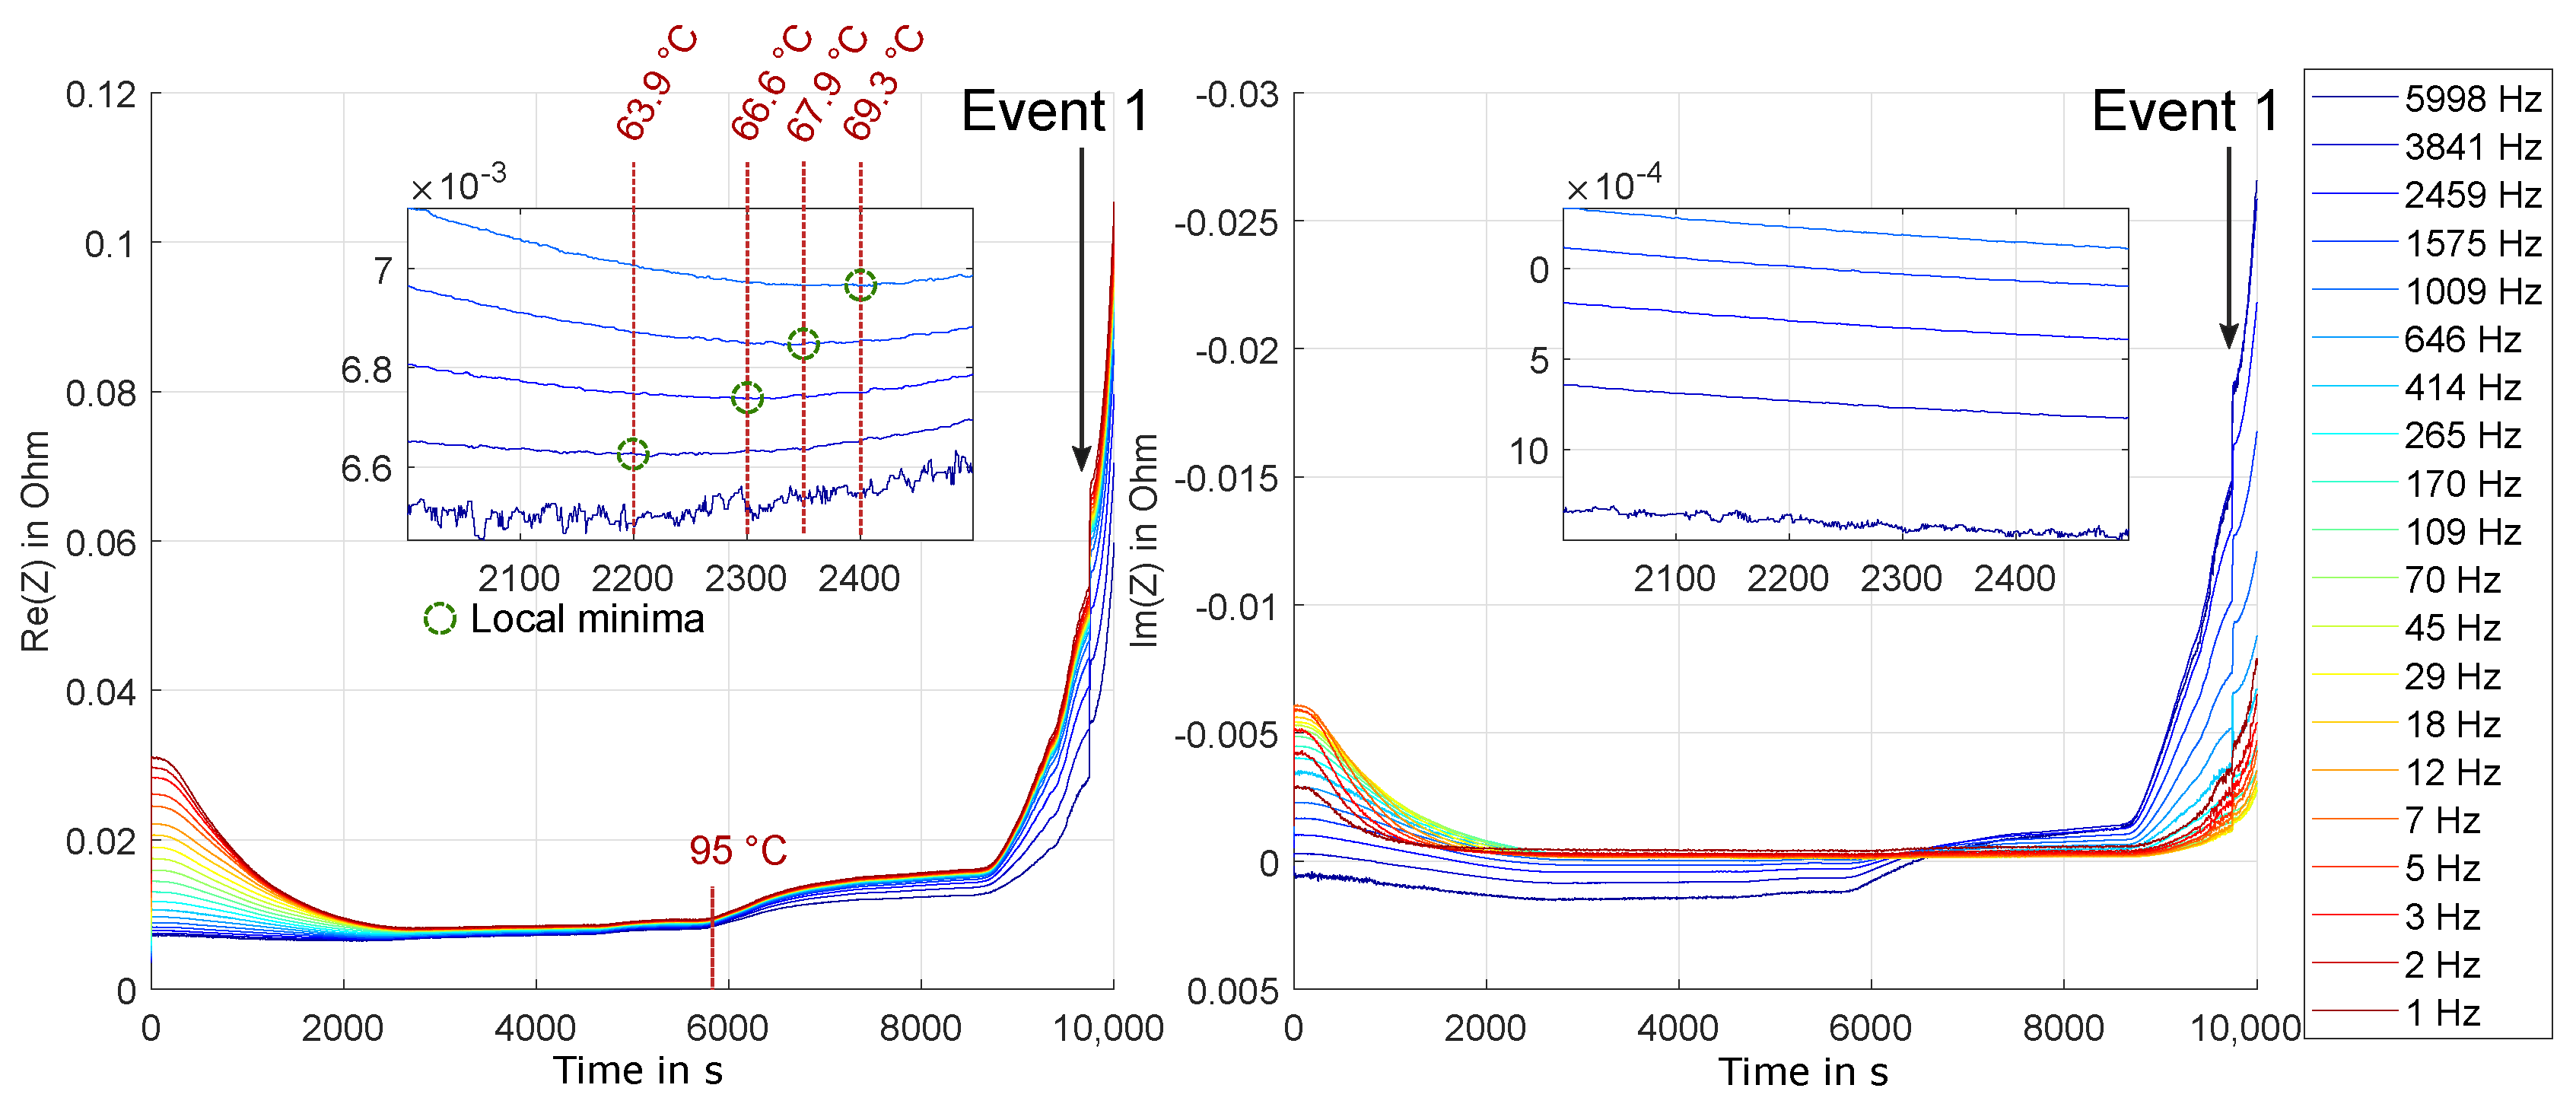
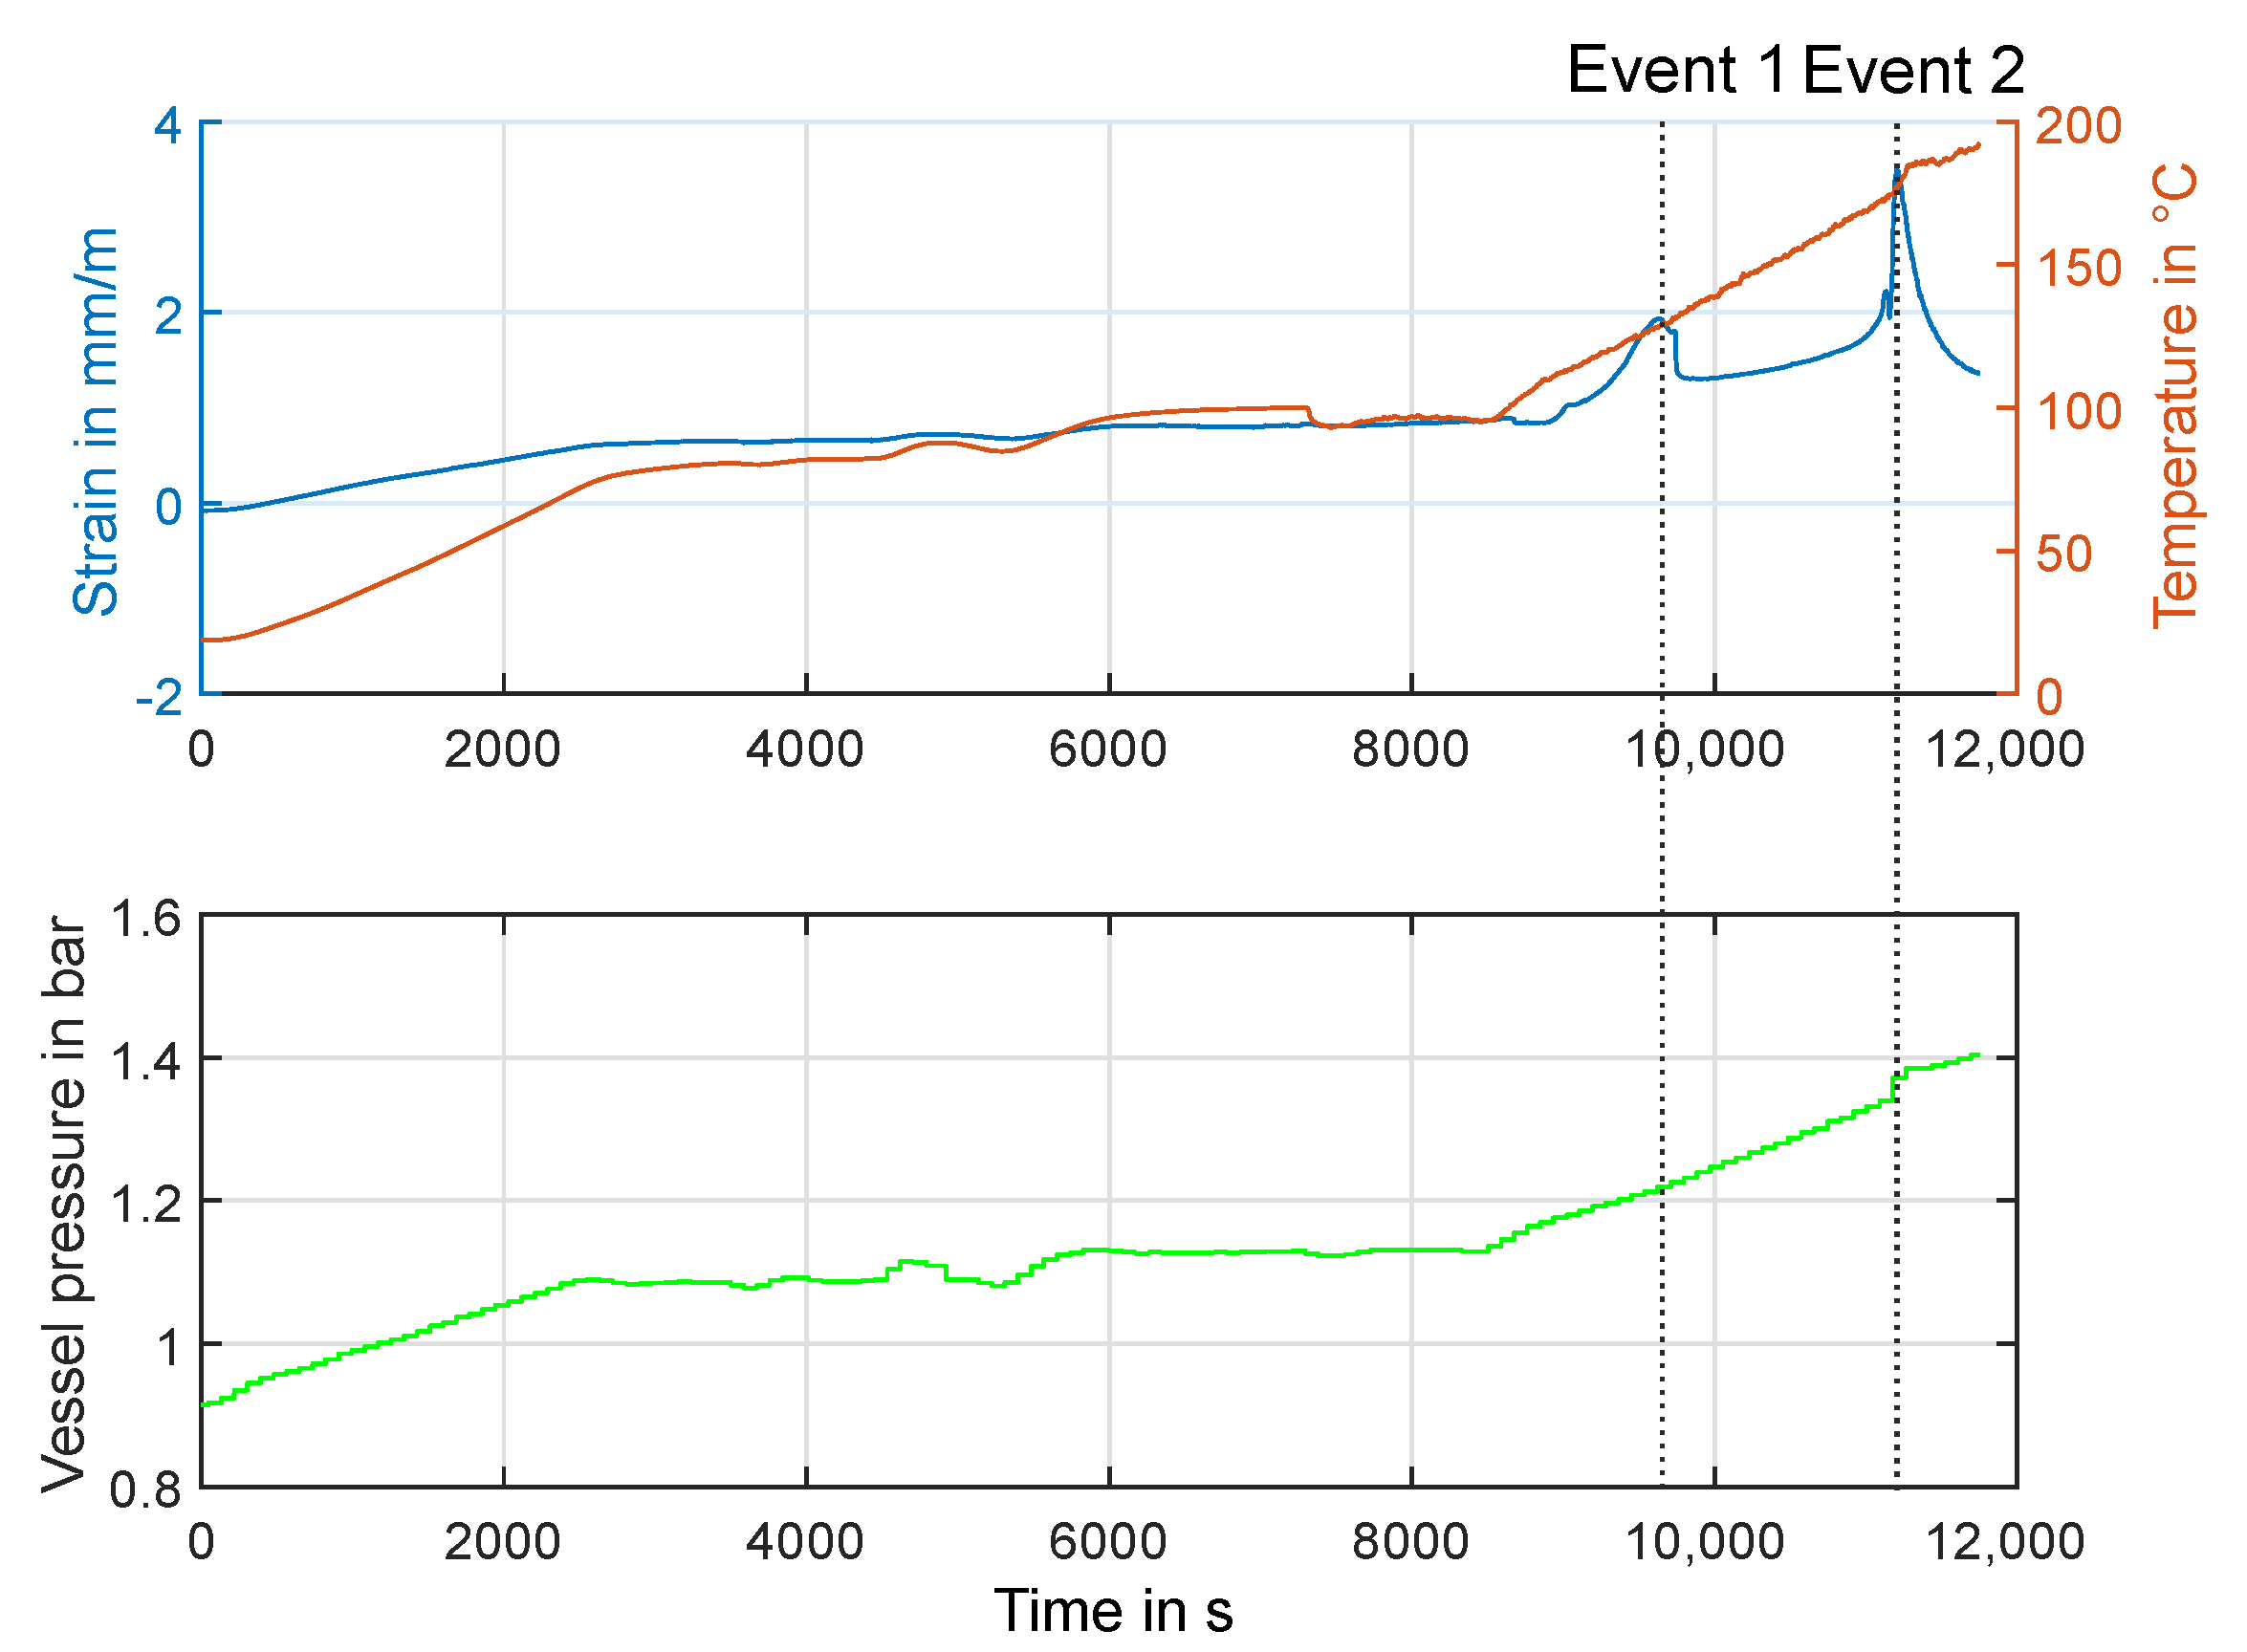
3.2. Experiment HT2
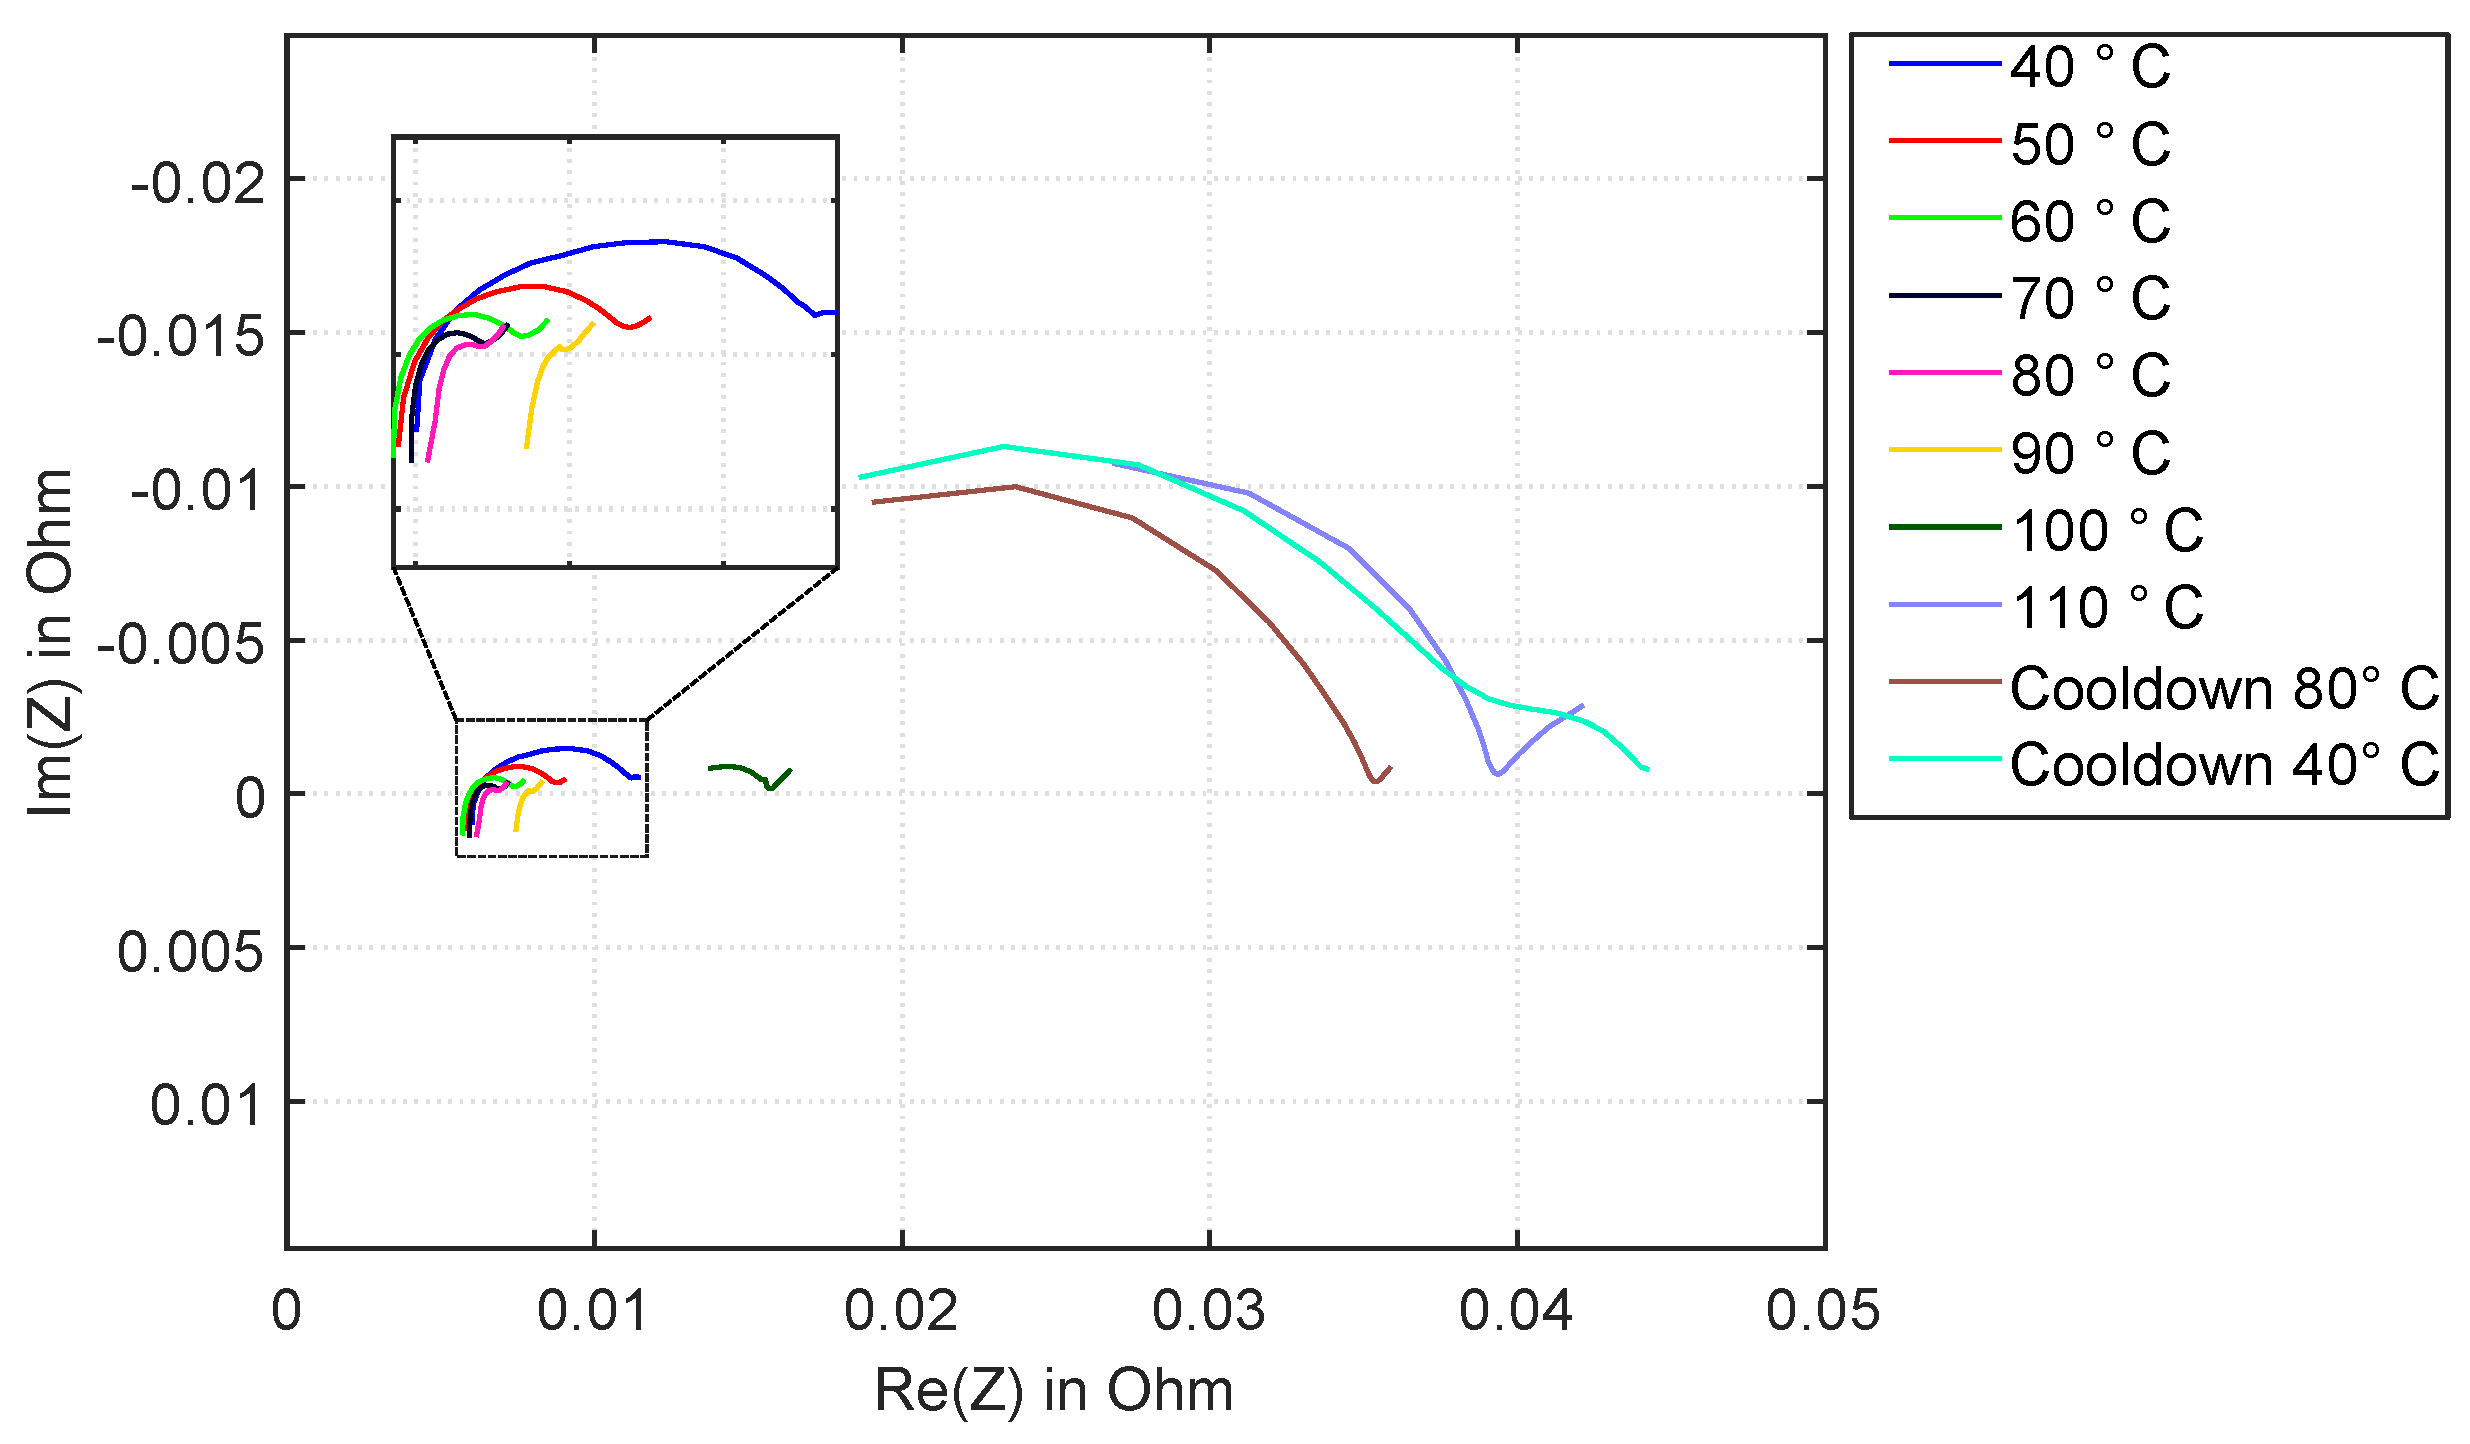
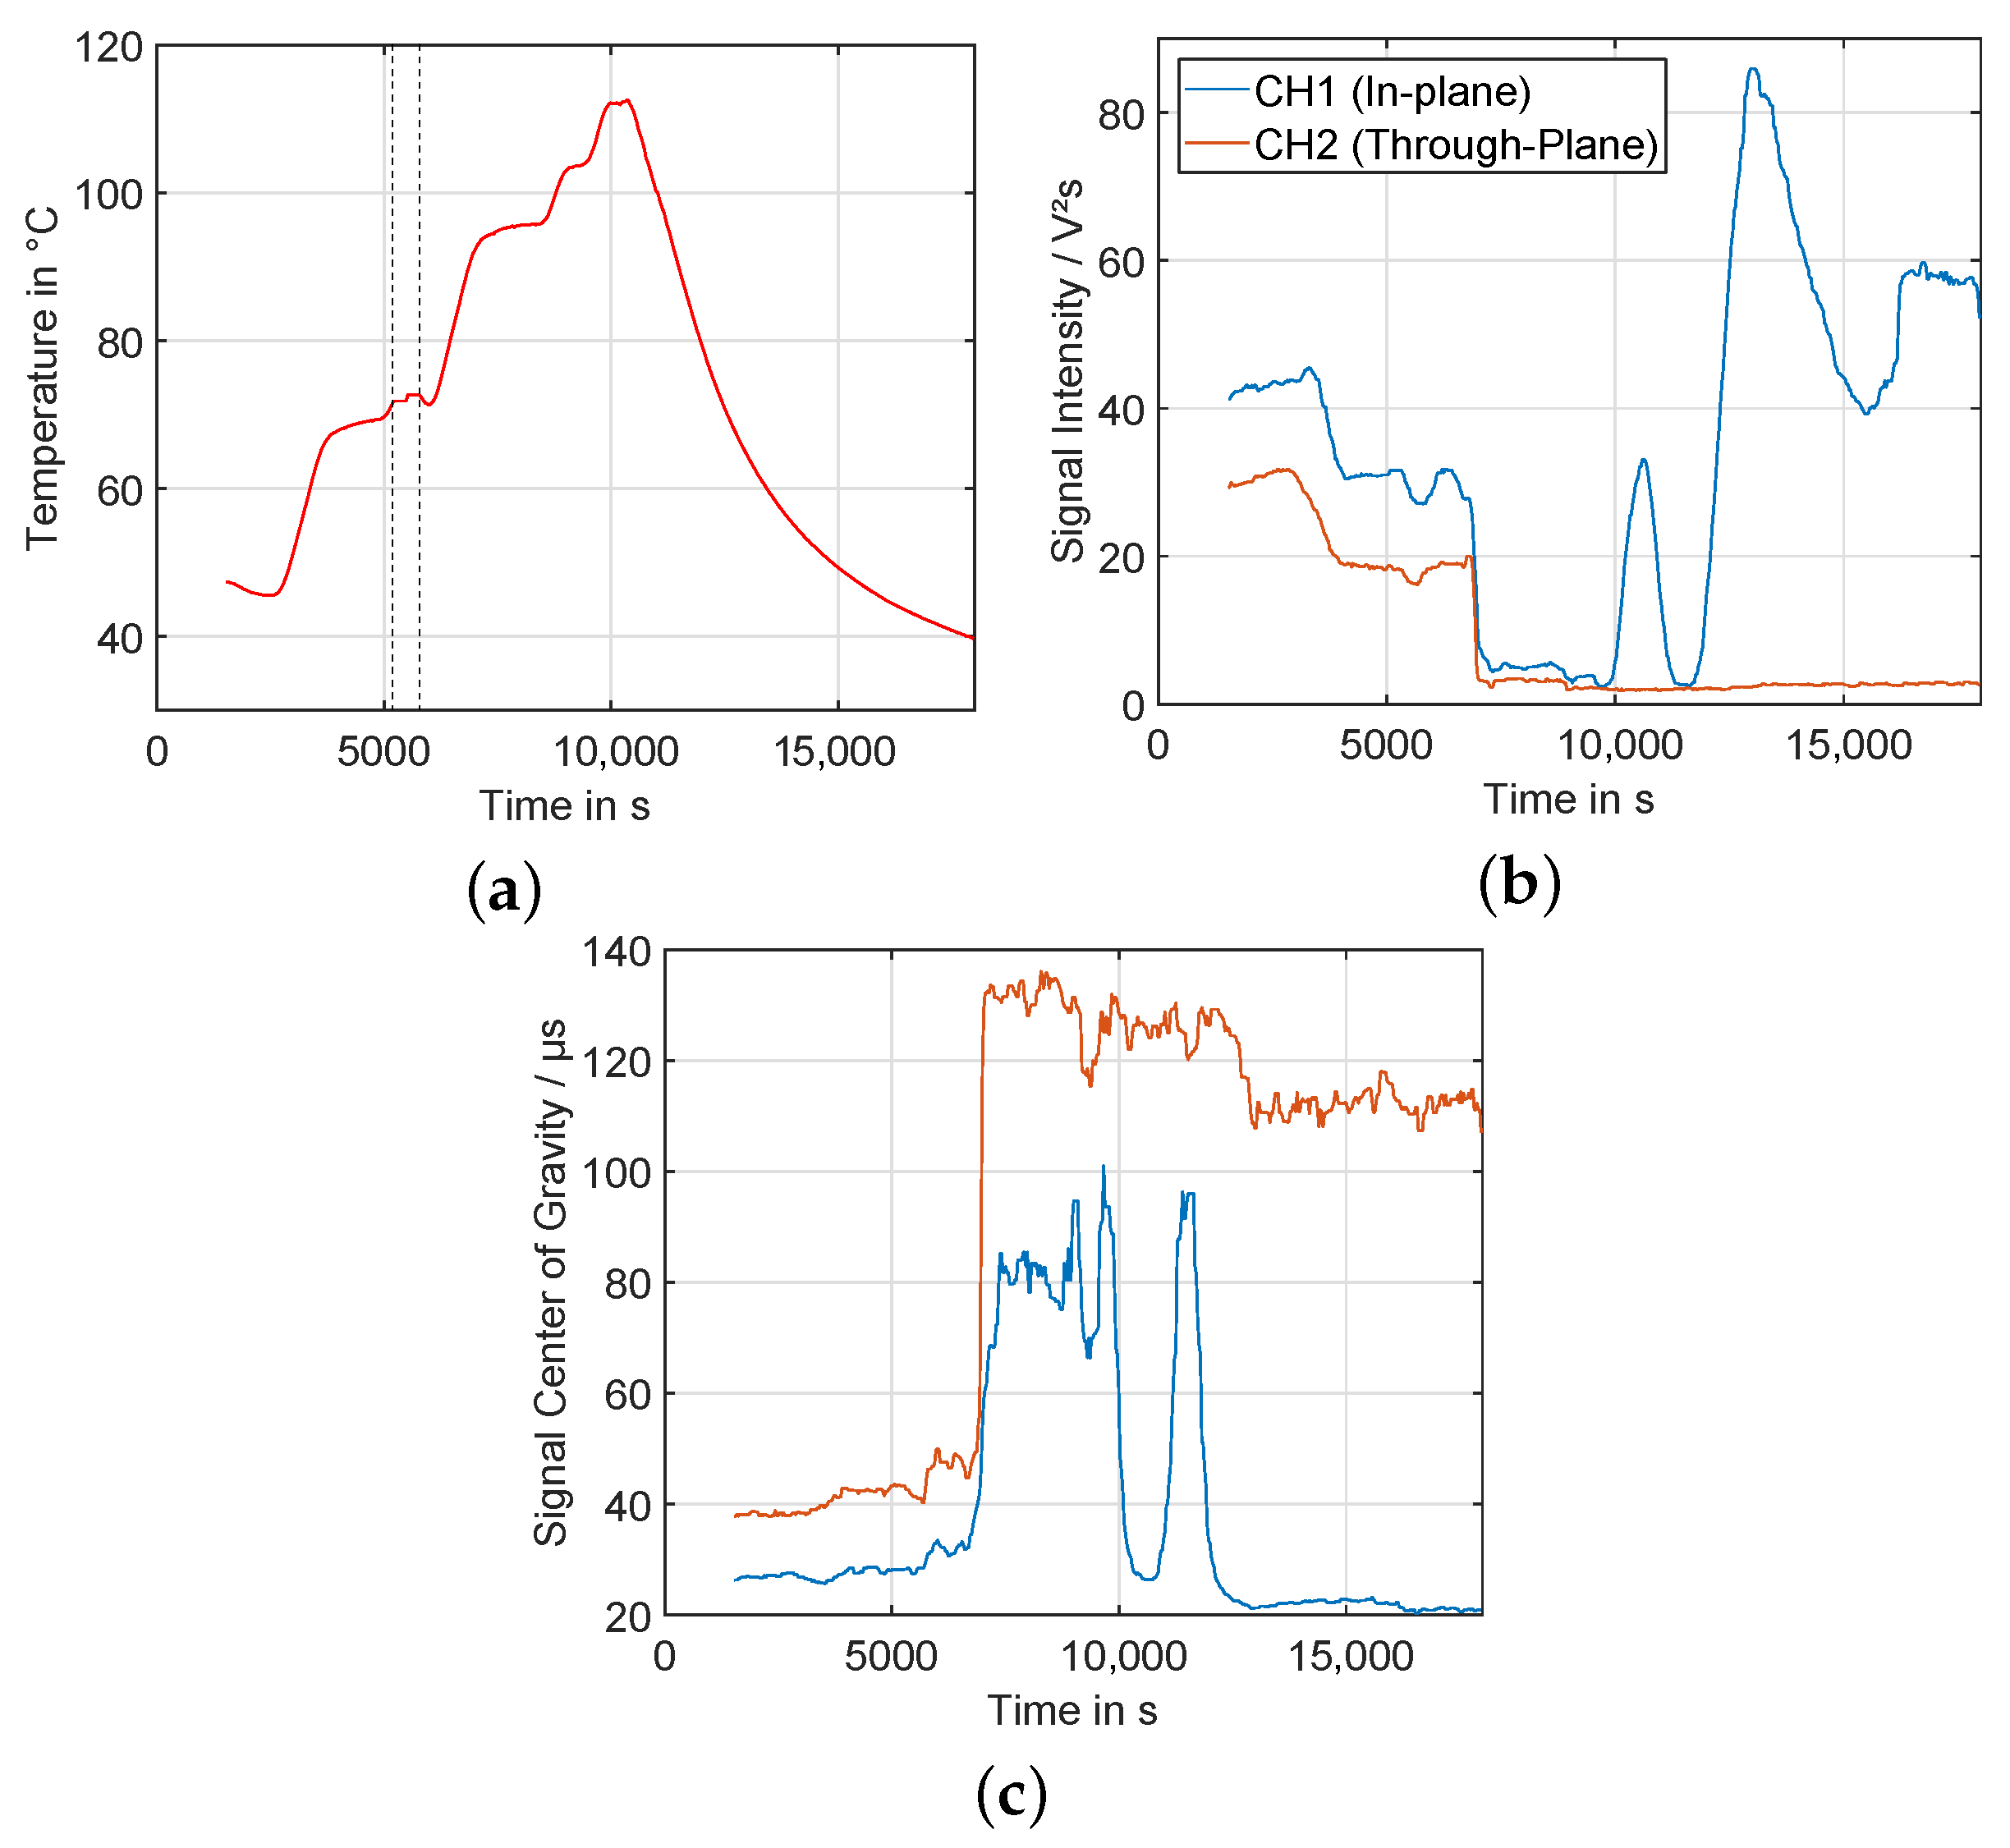
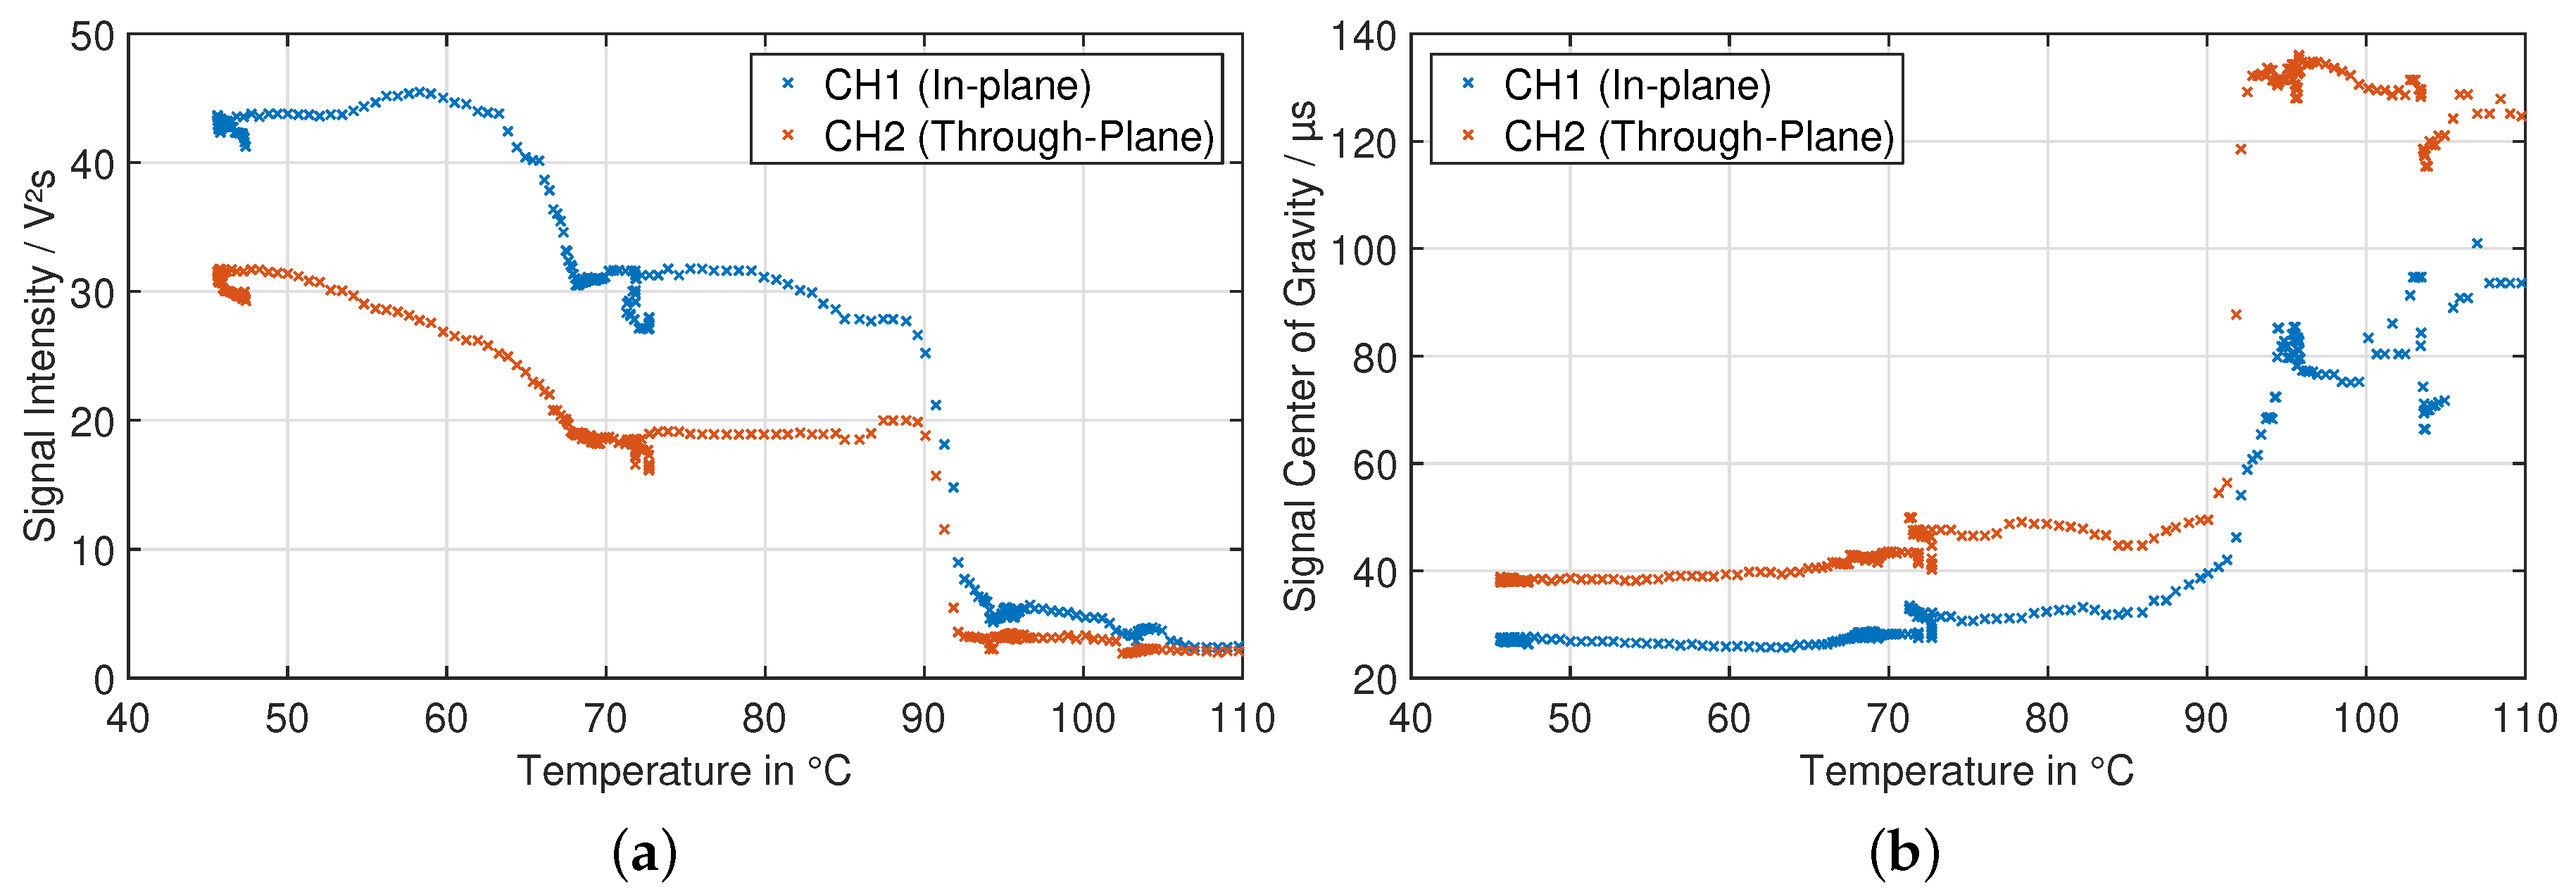
3.3. Experiment HT3
4. Conclusions and Outlook
Author Contributions
Funding
Conflicts of Interest
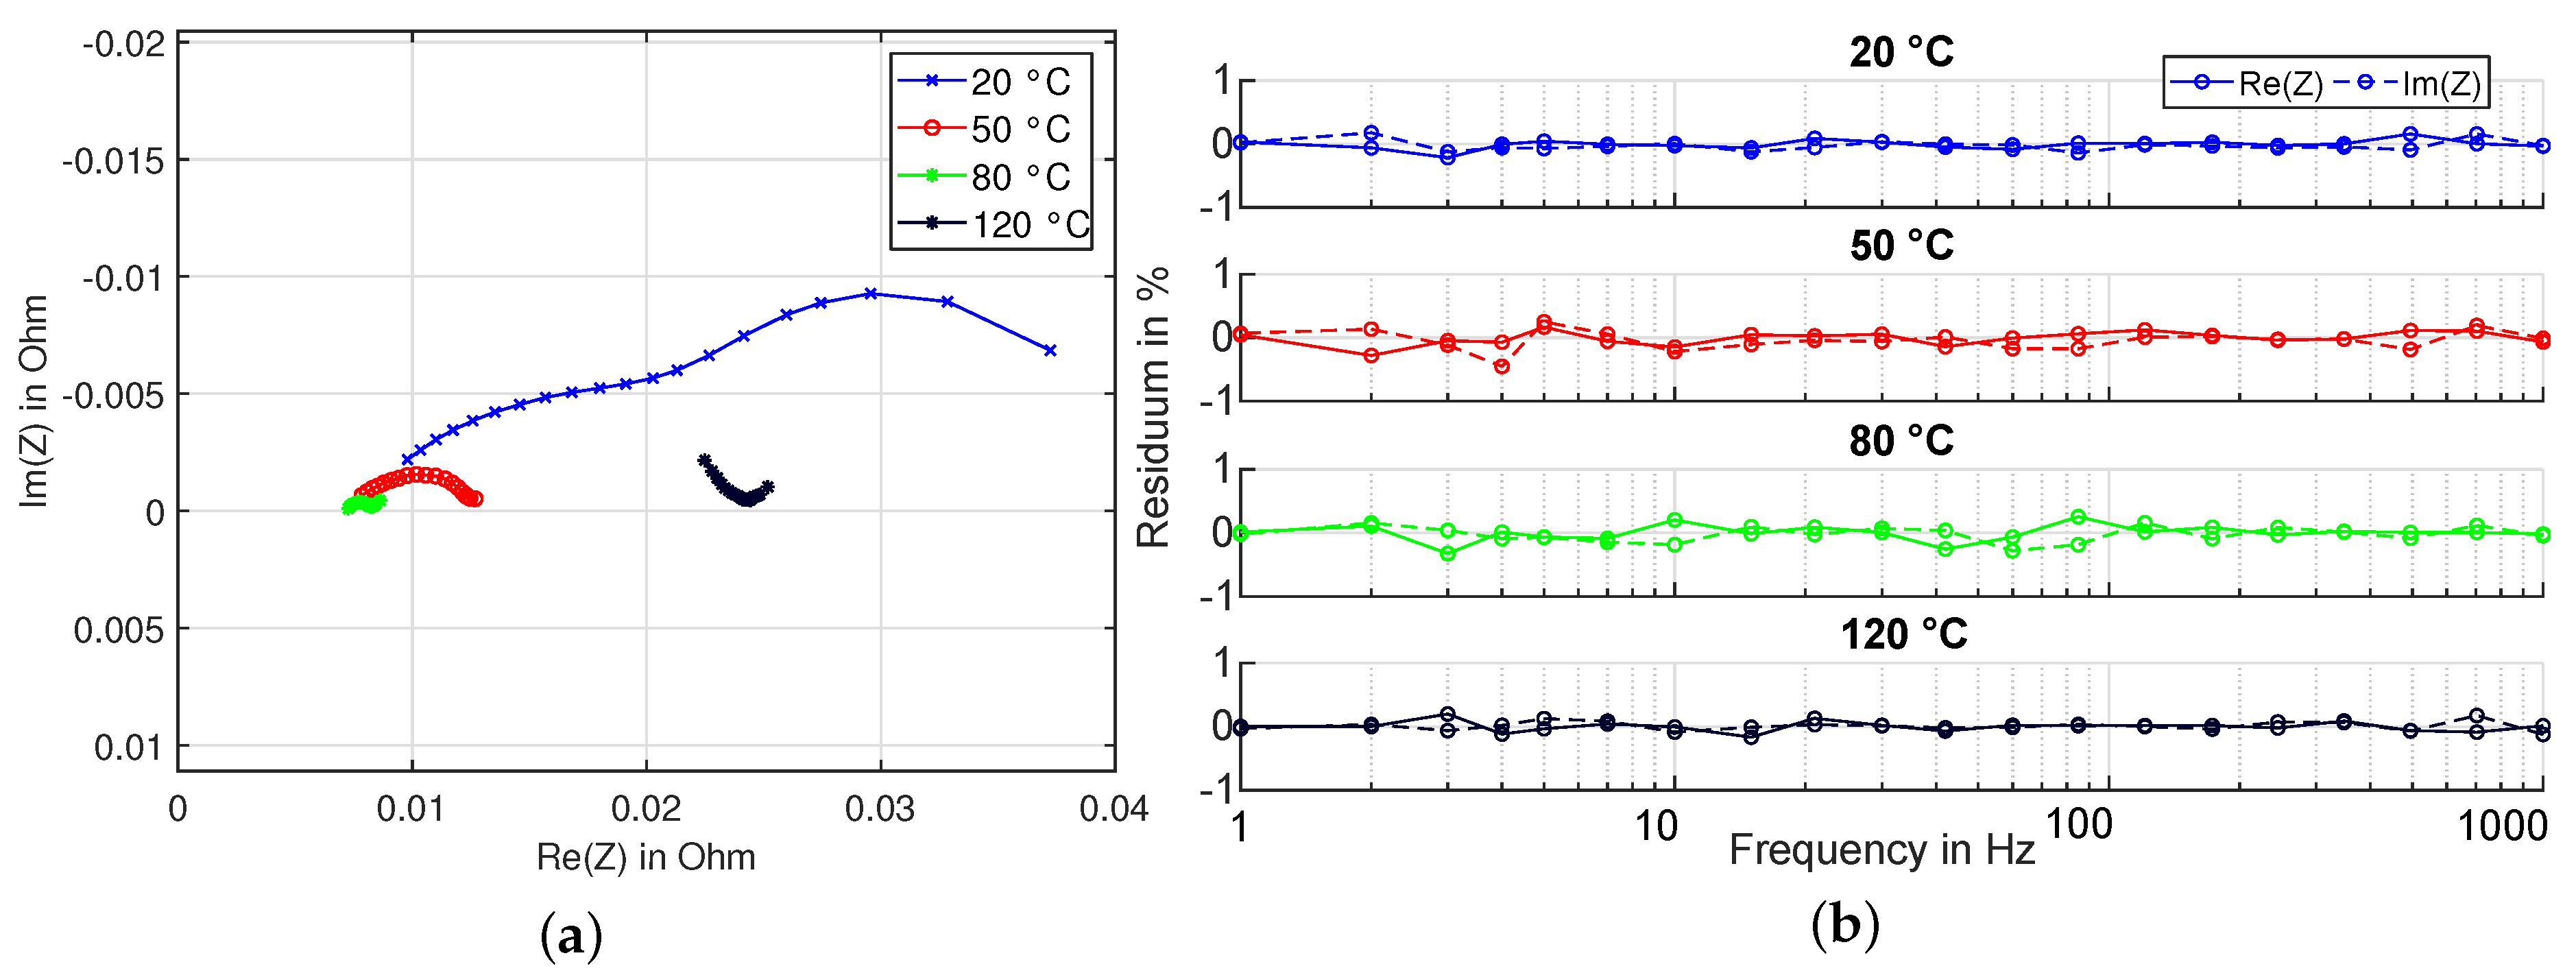
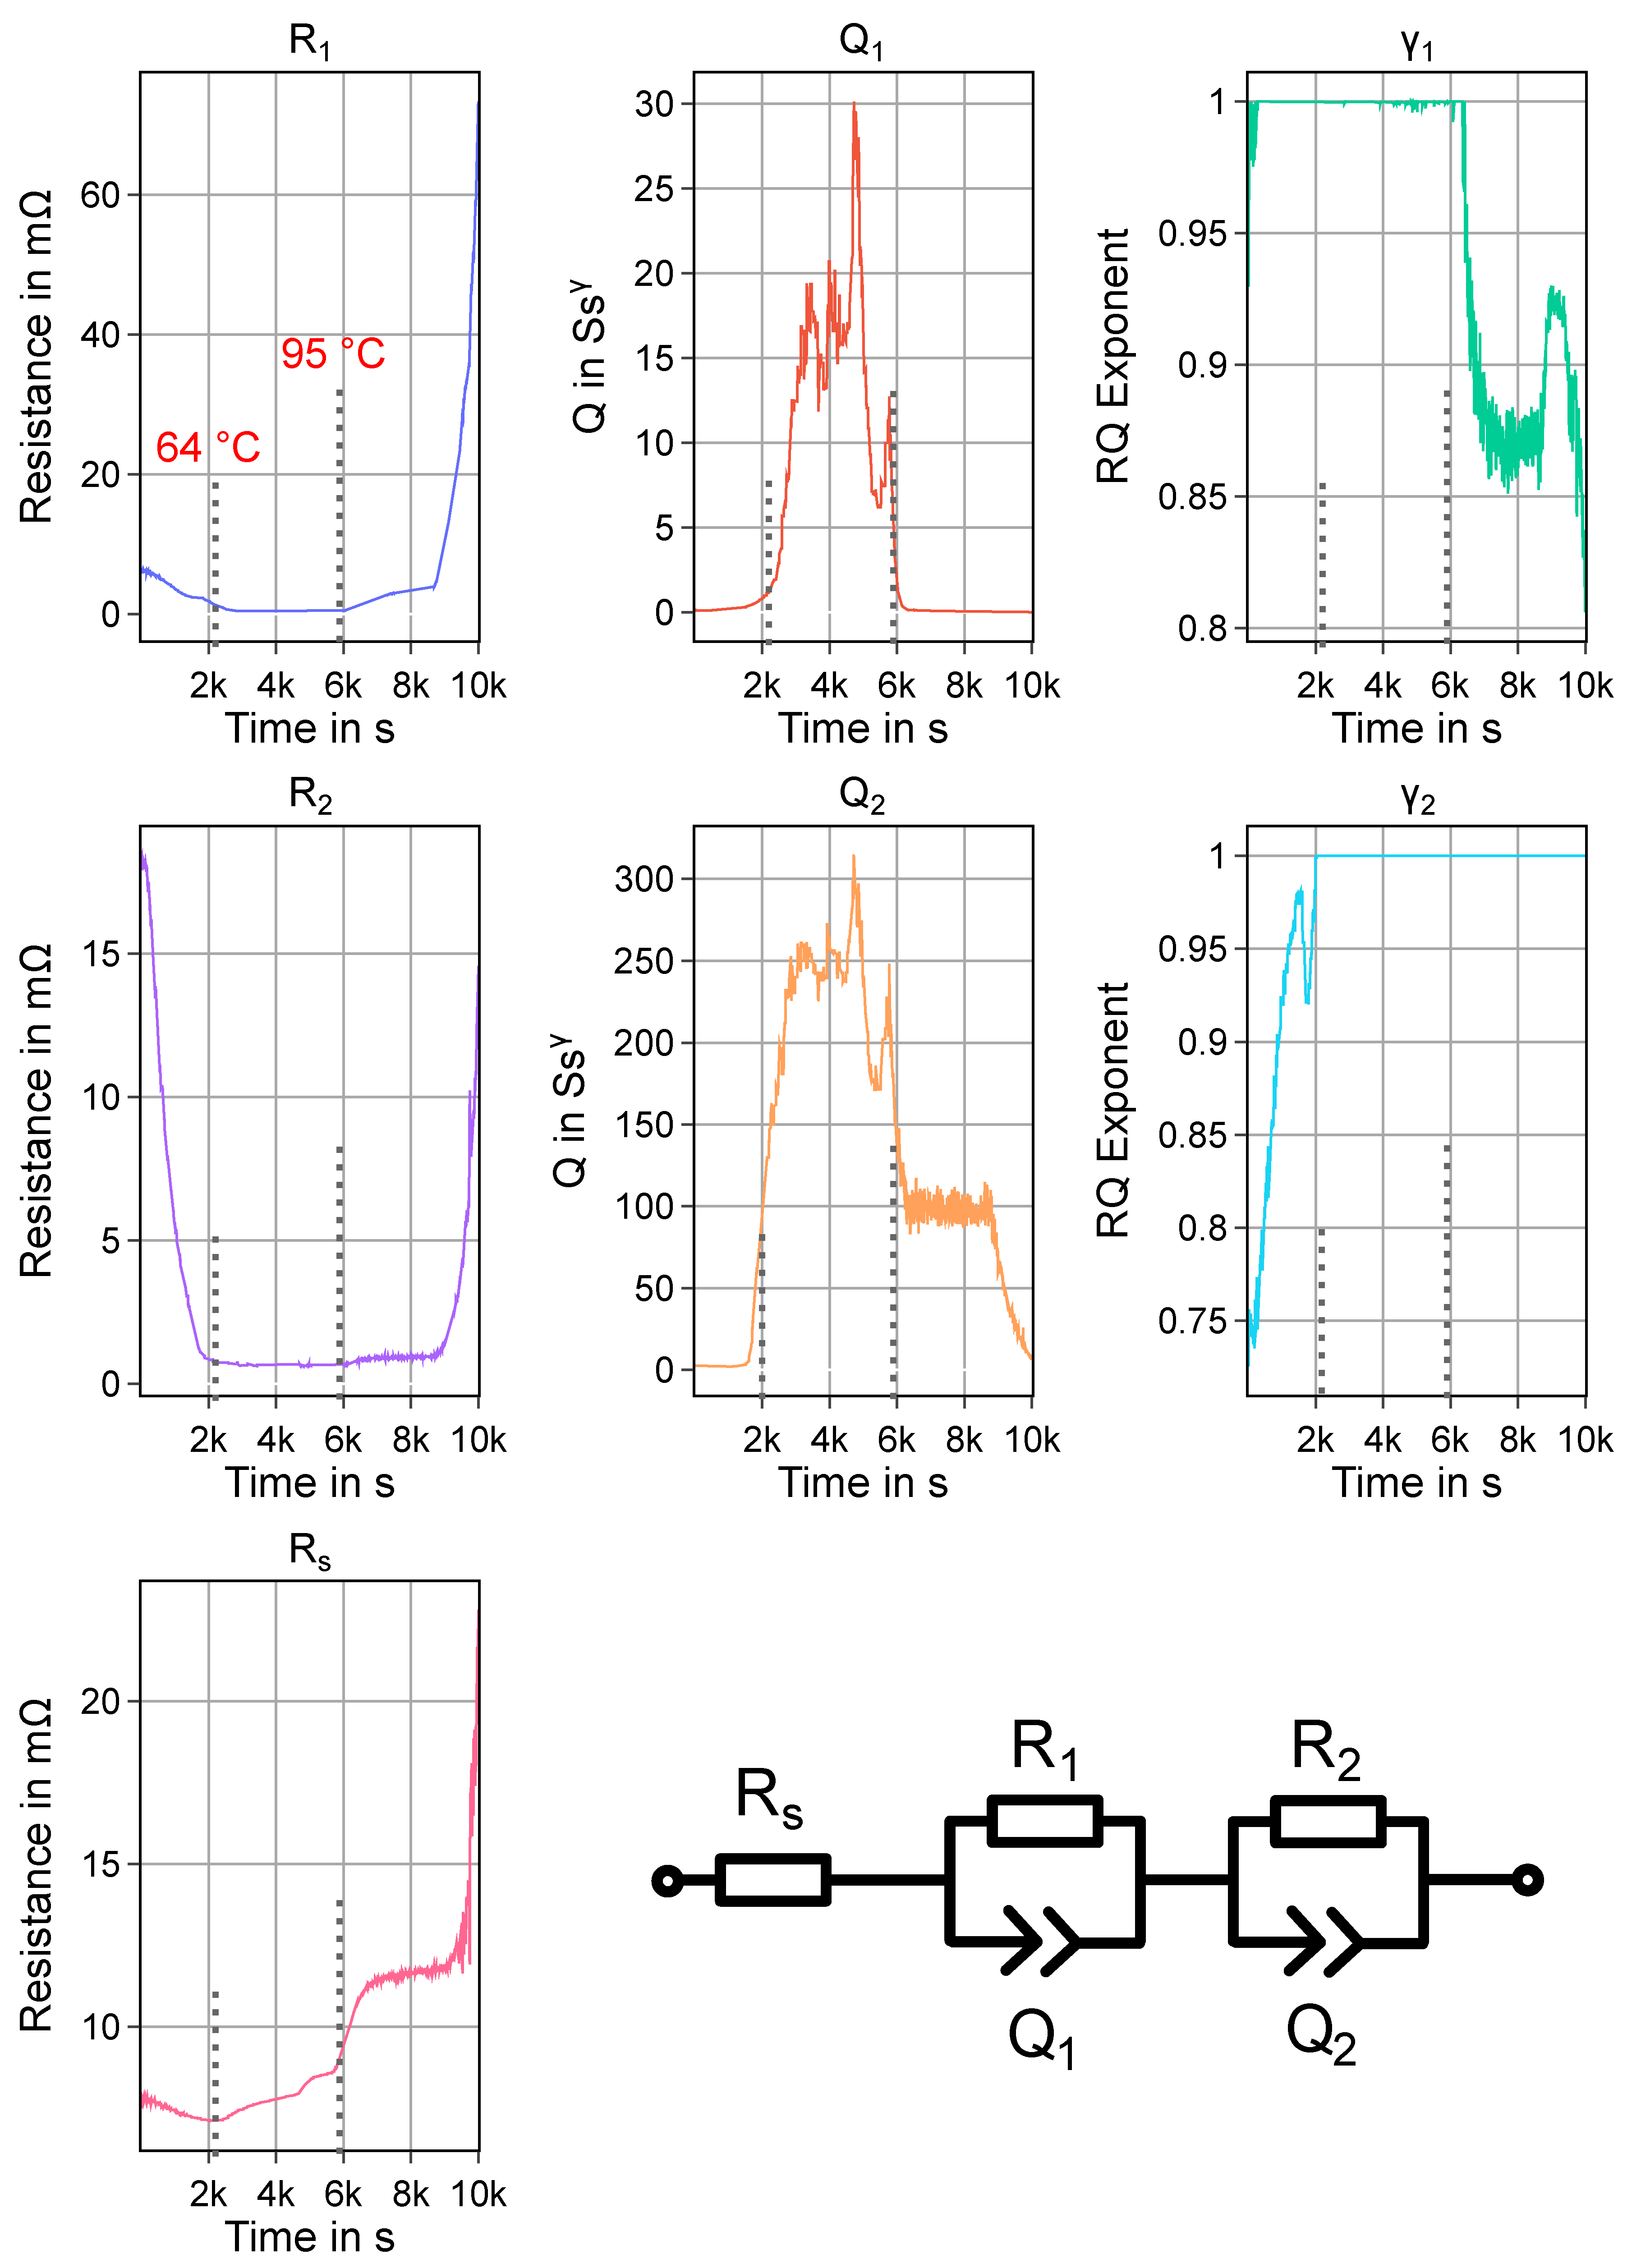
Appendix A. Equivalent Circuit Modelling of Impedance Measurements of Experiment HT2

References
- Ko, M.; Oh, P.; Chae, S.; Cho, W.; Cho, J. Considering Critical Factors of Li-rich Cathode and Si Anode Materials for Practical Li-ion Cell Applications. Small 2015, 11, 4058–4073. [Google Scholar] [CrossRef] [PubMed]
- Hou, P.; Yin, J.; Ding, M.; Huang, J.; Xu, X. Surface/Interfacial Structure and Chemistry of High-Energy Nickel-Rich Layered Oxide Cathodes: Advances and Perspectives. Small 2017, 13, 1701802. [Google Scholar] [CrossRef]
- Bak, S.M.; Hu, E.; Zhou, Y.; Yu, X.; Senanayake, S.D.; Cho, S.J.; Kim, K.B.; Chung, K.Y.; Yang, X.Q.; Nam, K.W. Structural Changes and Thermal Stability of Charged LiNi x Mn y Co z O 2 Cathode Materials Studied by Combined In Situ Time-Resolved XRD and Mass Spectroscopy. ACS Appl. Mater. Interfaces 2014, 6, 22594–22601. [Google Scholar] [CrossRef] [PubMed]
- Waldmann, T.; Hogg, B.I.; Wohlfahrt-Mehrens, M. Li plating as unwanted side reaction in commercial Li-ion cells—A review. J. Power Sources 2018, 384, 107–124. [Google Scholar] [CrossRef]
- Korthauer, R. (Ed.) Handbuch Lithium-Ionen-Batterien; Springer: Berlin/Heidelberg, Germany, 2013. [Google Scholar] [CrossRef]
- Käbitz, S.; Gerschler, J.B.; Ecker, M.; Yurdagel, Y.; Emmermacher, B.; André, D.; Mitsch, T.; Sauer, D.U. Cycle and calendar life study of a graphite|LiNi1/3Mn1/3Co1/3O2 Li-ion high energy system. Part A: Full cell characterization. J. Power Sources 2013, 239, 572–583. [Google Scholar] [CrossRef]
- Holleman, A.F.; Wiberg, E.; Wiberg, N. Lehrbuch der Anorganischen Chemie; de Gruyter: Berlin, Germany, 2007. [Google Scholar]
- Waldmann, T.; Wilka, M.; Kasper, M.; Fleischhammer, M.; Wohlfahrt-Mehrens, M. Temperature dependent ageing mechanisms in Lithium-ion batteries—A Post-Mortem study. J. Power Sources 2014, 262, 129–135. [Google Scholar] [CrossRef]
- Warnecke, A.J. Degradation Mechanisms in NMC-Based Lithium-Ion Batteries. Ph.D. Thesis, RWTH Aachen University, Aachen, Germany, 2017. [Google Scholar] [CrossRef]
- Ecker, M.; Gerschler, J.B.; Vogel, J.; Käbitz, S.; Hust, F.; Dechent, P.; Sauer, D.U. Development of a lifetime prediction model for lithium-ion batteries based on extended accelerated aging test data. J. Power Sources 2012, 215, 248–257. [Google Scholar] [CrossRef]
- Kim, Y. Mechanism of gas evolution from the cathode of lithium-ion batteries at the initial stage of high-temperature storage. J. Mater. Sci. 2013, 48, 8547–8551. [Google Scholar] [CrossRef]
- Wuersig, A.; Scheifele, W.; Novák, P. CO2 Gas Evolution on Cathode Materials for Lithium-Ion Batteries. J. Electrochem. Soc. 2007, 154, A449. [Google Scholar] [CrossRef]
- Xiong, D.J.; Ellis, L.D.; Nelson, K.J.; Hynes, T.; Petibon, R.; Dahn, J.R. Rapid Impedance Growth and Gas Production at the Li-Ion Cell Positive Electrode in the Absence of a Negative Electrode. J. Electrochem. Soc. 2016, 163, A3069–A3077. [Google Scholar] [CrossRef]
- Maleki, H. Thermal Stability Studies of Li-Ion Cells and Components. J. Electrochem. Soc. 1999, 146, 3224. [Google Scholar] [CrossRef]
- Bandhauer, T.M.; Garimella, S.; Fuller, T.F. A Critical Review of Thermal Issues in Lithium-Ion Batteries. J. Electrochem. Soc. 2011, 158, R1. [Google Scholar] [CrossRef]
- Feng, X.; Sun, J.; Ouyang, M.; He, X.; Lu, L.; Han, X.; Fang, M.; Peng, H. Characterization of large format lithium ion battery exposed to extremely high temperature. J. Power Sources 2014, 272, 457–467. [Google Scholar] [CrossRef]
- Hess, S.; Wohlfahrt-Mehrens, M.; Wachtler, M. Flammability of Li-Ion Battery Electrolytes: Flash Point and Self-Extinguishing Time Measurements. J. Electrochem. Soc. 2015, 162, A3084–A3097. [Google Scholar] [CrossRef]
- Lamb, J.; Orendorff, C.J.; Roth, E.P.; Langendorf, J. Studies on the Thermal Breakdown of Common Li-Ion Battery Electrolyte Components. J. Electrochem. Soc. 2015, 162, A2131–A2135. [Google Scholar] [CrossRef]
- Yang, H.; Zhuang, G.V.; Ross, P.N. Thermal stability of LiPF6 salt and Li-ion battery electrolytes containing LiPF6. J. Power Sources 2006, 161, 573–579. [Google Scholar] [CrossRef]
- Peled, E.; Menkin, S. Review—SEI: Past, Present and Future. J. Electrochem. Soc. 2017, 164, A1703–A1719. [Google Scholar] [CrossRef]
- Roth, E.P.; Doughty, D.H.; Pile, D.L. Effects of separator breakdown on abuse response of 18650 Li-ion cells. J. Power Sources 2007, 174, 579–583. [Google Scholar] [CrossRef]
- Barsoukov, E.; Macdonald, J.R. (Eds.) Impedance Spectroscopy: Theory, experiment, and Applications, 2nd ed.; Wiley-Interscience a John Wiley & Sons Inc. Publication: Hoboken, NJ, USA, 2005. [Google Scholar] [CrossRef]
- Schiller, C.A.; Richter, F.; Gülzow, E.; Wagner, N. Validation and evaluation of electrochemical impedance spectra of systems with states that change with time. Phys. Chem. Chem. Phys. 2001, 3, 374–378. [Google Scholar] [CrossRef]
- Zappen, H.; Ringbeck, F.; Sauer, D. Application of Time-Resolved Multi-Sine Impedance Spectroscopy for Lithium-Ion Battery Characterization. Batteries 2018, 4, 64. [Google Scholar] [CrossRef]
- HBM Serie Y Datasheet. Available online: https://www.me-systeme.de/produkte/dehnungsmessstreifen/catalog/Serie-Y-b4710.pdf (accessed on 21 April 2020).
- Loctite 454 Technical Datasheet. Available online: https://tdsna.henkel.com/americas/na/adhesives/hnauttds.nsf/web/A72821E60E3C0959882571870000D797/$File/454-212NEW-EN.pdf (accessed on 21 April 2020).
- Gitis, A.; Wessel, S.; Wazifehdust, M.; Heimes, H.; Sauer, D.U.; Figgemeier, E.; Kampker, A. Vom Staub zur Elektrode: Herstellungsprozess von Elektroden für Lithium-Ionen Batteriezellen.—Teil 1. Galvanotech. älteste Fachz. Für Die Prax. Der Oberflächentechnik 2017, 2017, 7–10. [Google Scholar]
- Hsieh, A.G.; Bhadra, S.; Hertzberg, B.J.; Gjeltema, P.J.; Goy, A.; Fleischer, J.W.; Steingart, D.A. Electrochemical-acoustic time of flight: In operando correlation of physical dynamics with battery charge and health. Energy Environ. Sci. 2015, 8, 1569–1577. [Google Scholar] [CrossRef]
- Davies, G.; Knehr, K.W.; van Tassell, B.; Hodson, T.; Biswas, S.; Hsieh, A.G.; Steingart, D.A. State of Charge and State of Health Estimation Using Electrochemical Acoustic Time of Flight Analysis. J. Electrochem. Soc. 2017, 164, A2746–A2755. [Google Scholar] [CrossRef]
- Gold, L.; Bach, T.; Virsik, W.; Schmitt, A.; Müller, J.; Staab, T.E.; Sextl, G. Probing lithium-ion batteries’ state-of-charge using ultrasonic transmission—Concept and laboratory testing. J. Power Sources 2017, 343, 536–544. [Google Scholar] [CrossRef]
- Arora, P.; Zhang, Z. Battery Separators. Chem. Rev. 2004, 104, 4419–4462. [Google Scholar] [CrossRef] [PubMed]
- Bard, A.J.; Faulkner, L.R. Electrochemical Methods: Fundamentals and Applications, 2nd ed.; Wiley: New York, NY, USA, 2001. [Google Scholar]
- Viswanathan, V.V.; Choi, D.; Wang, D.; Xu, W.; Towne, S.; Williford, R.E.; Zhang, J.G.; Liu, J.; Yang, Z. Effect of entropy change of lithium intercalation in cathodes and anodes on Li-ion battery thermal management. J. Power Sources 2010, 195, 3720–3729. [Google Scholar] [CrossRef]
- Feng, X.; Fang, M.; He, X.; Ouyang, M.; Lu, L.; Wang, H.; Zhang, M. Thermal runaway features of large format prismatic lithium ion battery using extended volume accelerating rate calorimetry. J. Power Sources 2014, 255, 294–301. [Google Scholar] [CrossRef]
- Ishikawa, H.; Mendoza, O.; Sone, Y.; Umeda, M. Study of thermal deterioration of lithium-ion secondary cell using an accelerated rate calorimeter (ARC) and AC impedance method. J. Power Sources 2012, 198, 236–242. [Google Scholar] [CrossRef]
- Karlsruhe Institute of Technology. Lin-KK Software. Available online: https://www.iam.kit.edu/wet/Lin-KK.php (accessed on 21 April 2020).
- Schönleber, M.; Ivers-Tiffée, E. Approximability of impedance spectra by RC elements and implications for impedance analysis. Electrochem. Commun. 2015, 58, 15–19. [Google Scholar] [CrossRef]
- Schönleber, M.; Klotz, D.; Ivers-Tiffée, E. A Method for Improving the Robustness of linear Kramers-Kronig Validity Tests. Electrochim. Acta 2014, 131, 20–27. [Google Scholar] [CrossRef]
- Witzenhausen, H. Electrical Battery Models: Modelling, Parameter Identification and Model Reduction; RWTH Aachen University: Aachen, Germany, 2017. [Google Scholar] [CrossRef]
- Illig, J. Physically Based Impedance Modelling of Lithium-Ion Cells. In Schriften des Instituts für Werkstoffe der Elektrotechnik, Karlsruher Institut für Technologie; KIT Scientific Publishing: Karlsruhe, Baden, 2014; Volume 27. [Google Scholar]
- Tanaka, N.; Bessler, W.G. Numerical investigation of kinetic mechanism for runaway thermo-electrochemistry in lithium-ion cells. Solid State Ionics 2014, 262, 70–73. [Google Scholar] [CrossRef]
- Richard, M.N.; Dahn, J.R. Accelerating Rate Calorimetry Study on the Thermal Stability of Lithium Intercalated Graphite in Electrolyte. I. Experimental. J. Electrochem. Soc. 1999, 146, 2068. [Google Scholar] [CrossRef]
- Knudsen, K. kbknudsen/PyEIS: PyEIS: A Python-based Electrochemical Impedance Spectroscopy Simulator and Analyzer. Available online: https://github.com/kbknudsen/PyEIS/ (accessed on 21 April 2020).


| Experiment No. | HT1 | HT2 | HT3 |
|---|---|---|---|
| Cell Type | Kokam SLPB526495 | ||
| SOC | 50 | 50 | 100 |
| SOH (Initial Capacity) | 95 | 96 | 100 |
| EIS Minimum Frequency | 1 Hz | 1 Hz | 1 Hz |
| EIS Maximum Frequency | 1 kHz | 6 kHz | 6 kHz |
| EIS Amplitude Control | constant | manual | manual |
| Cell Temperature Sensor | x | x | x |
| Tank Gas Pressure Sensor | x | x | x |
| Strain Gauge Sensor | - | x | - |
| Ultrasonic Sensors | - | - | x |
| Heating Procedure | Ramp 2 K/min until thermal runaway | Ramp with pauses until venting | Ramp with pauses until 110 °C and cool-down |
© 2020 by the authors. Licensee MDPI, Basel, Switzerland. This article is an open access article distributed under the terms and conditions of the Creative Commons Attribution (CC BY) license (http://creativecommons.org/licenses/by/4.0/).
Share and Cite
Zappen, H.; Fuchs, G.; Gitis, A.; Sauer, D.U. In-Operando Impedance Spectroscopy and Ultrasonic Measurements during High-Temperature Abuse Experiments on Lithium-Ion Batteries. Batteries 2020, 6, 25. https://doi.org/10.3390/batteries6020025
Zappen H, Fuchs G, Gitis A, Sauer DU. In-Operando Impedance Spectroscopy and Ultrasonic Measurements during High-Temperature Abuse Experiments on Lithium-Ion Batteries. Batteries. 2020; 6(2):25. https://doi.org/10.3390/batteries6020025
Chicago/Turabian StyleZappen, Hendrik, Georg Fuchs, Alexander Gitis, and Dirk Uwe Sauer. 2020. "In-Operando Impedance Spectroscopy and Ultrasonic Measurements during High-Temperature Abuse Experiments on Lithium-Ion Batteries" Batteries 6, no. 2: 25. https://doi.org/10.3390/batteries6020025
APA StyleZappen, H., Fuchs, G., Gitis, A., & Sauer, D. U. (2020). In-Operando Impedance Spectroscopy and Ultrasonic Measurements during High-Temperature Abuse Experiments on Lithium-Ion Batteries. Batteries, 6(2), 25. https://doi.org/10.3390/batteries6020025