Article

Effect of Ball Milling on the Electrochemical Performance of Activated Carbon with a Very High Specific Surface Area

1
Department of Mathematical Science and Electrical-Electronic-Computer Engineering, Akita University, Tegatagakuen-machi 1-1, Akita 010-8502, Japan
2
Department of Electrical Engineering, Fukuoka Institute of Technology, Wajiro-higashi 3-30-1, Higashi-ku, Fukuoka 811-0295, Japan
*
Author to whom correspondence should be addressed.
Batteries 2020, 6(2), 22; https://doi.org/10.3390/batteries6020022
Submission received: 10 February 2020 / Revised: 5 April 2020 / Accepted: 10 April 2020 / Published: 14 April 2020
(This article belongs to the Special Issue Electrochemical Capacitors)

Abstract

:
Activated carbon (AC) with a very high specific surface area of >3000 m2 g−1 and a number of course particles (average size: 75 µm) was pulverized by means of planetary ball milling under different conditions to find its greatest performances as the active material of an electric double-layer capacitor (EDLC) using a nonaqueous electrolyte. The variations in textural properties and particle morphology of the AC during the ball milling were investigated. The electrochemical performance (specific capacitance, rate and cyclic stabilities, and Ragone plot, both from gravimetric and volumetric viewpoints) was also evaluated for the ACs milled with different particle size distributions. A trade-off relation between the pulverization and the porosity maintenance of the AC was observed within the limited milling time. However, prolonged milling led to a degeneration of pores within the AC and a saturation of pulverization degree. The appropriate milling time provided the AC a high volumetric specific capacitance, as well as the greatest maintenance of both the gravimetric and volumetric specific capacitance. A high volumetric energy density of 6.6 Wh L−1 was attained at the high-power density of 1 kW L−1, which was a 35% increment compared with the nonmilled AC. The electrode densification (decreased interparticle gap) and the enhanced ion-transportation within the AC pores, which were attributed to the pulverization, were responsible for those excellent performances. It was also shown that excessive milling could degrade the EDLC performances because of the lowered micro- and meso-porosity and the excessive electrode densification to restrict the ion-transportation within the pores.

1. Introduction

Electric double-layer capacitors (EDLCs) are energy storage devices that have been applied to various energy storage sectors such as automobiles, power leveling for renewable energies, and portable electronic devices [1,2,3]. The advantages of EDLCs are high-power density and long cycle-life, when they were compared to secondary batteries. The charge–discharge processes with high-power density are based on a principle of physical adsorption and desorption of electrolytic ions onto the electrode, so as to allow the formation and release of the electric double-layer. Activated carbons (ACs) are mainly employed as the active materials of EDLC electrodes due to their high specific surface area, excellent cost-performance, and large-scale productivity [4]. The specific surface area of the active materials is closely related to the formation area of the electric double-layer. Highly porous carbons, whose specific surface areas are >3000 m2 g−1, have been produced from various precursors and via novel chemical activation techniques [5,6,7,8,9]. ACs with a high specific surface area are very effective in increasing the gravimetric energy and power density of EDLC electrodes. ACs with a specific surface area of >3000 m2 g−1 are now available on the market and can be employed as the electrode active material. Those provided a very high gravimetric specific capacitance of 209–575 F g−1 under the use of aqueous electrolytes [6,10,11] and that of 144–338 F g−1 under the use of nonaqueous electrolytes [5,12,13]. Microporous ACs with a narrow width of <2 nm can produce a wide electric double-layer and thus give the electrode a high specific capacitance [14,15,16,17]. In addition to the specific surface area, the pore size distribution of ACs is also an important factor determining the capacitive and resistive behaviors of EDLCs.
The EDLC electrodes have been chiefly prepared in two ways. One is to coat a slurry comprising active material, conductive agent, and binder onto an Al foil used as the current collector [18,19,20]. The other is to knead the mixture composed of active materials, conductive agent, and binder, and then to mold it into a sheet. The sheet is pressed and attached with the mesh-like current collector or is adhered with a foil-like current collector [21,22,23]. The particle size of AC used as the active material can be industrially recommended to be in the range of 4–8 µm [24]. A correlation between the particle size of the AC active material and the charge–discharge performance of EDLC has been explored. It was demonstrated that, for the EDLC electrodes, an increase in the AC particle size led to a decrease in the specific capacitance and an increase in the equivalent series resistance (ESR) [19]. The ESR of the electrode is chiefly attributed to the electrolyte, the contact, and the intrinsic resistance. The contact resistance is related to the contact degree between the AC particles, and that between the particles and the current collector. The intrinsic resistance is dependent on the conductivity of AC particles, which have a relation with their graphitization degree and their porosity. The specific surface area of the used AC and the exposure degree of pore-walls that allow access of the electrolytic ions so as to form an electric double-layer, are decisive factors of the specific capacitance of EDLC electrode. The exposure degree of pore-walls is affected by the affinity of AC particles with the binder, and the level of binder added in the electrode. The AC particle size and its size uniformity have been known to participate in the ESR [21,22,23,25]. The role of AC particle size on the diffusivity of ions in the EDLC electrodes has been also investigated, suggesting that smaller AC particles facilitated ion-transportation in the EDLC electrodes [26].
In order to obtain the desired particle size, or desired particle size distribution of ACs, a ball milling technique has been well employed. It has been shown that the porous structure and surface morphology of ACs can vary during the balling milling process [27,28,29,30,31,32,33,34]. The electrodes using nanoscale carbide-derived AC powders displayed an excellent electrical contact between the particles across the electrode and facilitated ion-movement within the pores, maintaining the specific capacitance of the electrode even at high current densities [35]. The AC processed by the prolonged ball milling decreased the specific capacitance due to particle agglomeration [34]. The presence of submicron sized particles in discrete AC particle clusters led to performance and cycle stability degradation of the electrodes [21]. In the abovementioned studies, the specific surface areas of the used ACs were in the range of 880–2200 m2 g−1. Increasing the gravimetric energy and power densities of the EDLC electrode requires highly porous ACs. However, there are few reports on the optimization of the particle size of ACs with a very high specific surface area (~3000 m2 g−1), which are intended for use in the fabrication of high-performance EDLC electrodes. The effects of the pulverization degree of ACs with such high specific surface area on their EDLC performances have not been explored so far.
In the present study, the EDLC performances of ACs with specific surface areas of around 3000 m2 g−1 were examined under the use of a nonaqueous electrolyte, which has been a mainstream electrolyte for high-performance commercial EDLCs. We investigated the variation in the textural properties and the particle morphology of the highly porous ACs during planetary ball milling. The charge–discharge performances (specific capacitance, rate and cyclic stabilities, and Ragone plot, from the viewpoints of both the gravimetric and volumetric performances) of EDLCs using the AC active materials of various particle sizes were evaluated. In order to achieve the greatest gravimetric or volumetric EDLC performance, the ball milling process was optimized for the highly porous ACs.

2. Materials and Methods

2.1. Ball Milling and Materials Characterization

Maxsorb (Kansai Coke and Chemicals Co., Ltd., Amagasaki, Japan), which was manufactured from petroleum coke by means of KOH activation [36], was used as the AC active material. For the ball milling process, planetary ball milling equipment (P-6, Fritch Japan Co., Ltd., Yokohama, Japan), a zirconia bowl with an 80 mL-milling space, and two types of zirconia balls (ϕ10.0 or ϕ19.5 mm) were employed. In air atmosphere, one gram of the sample AC was pulverized for 10, 90, and 120 min using the five ϕ19.5 mm balls at a rotation speed of 400 rpm. The ACs, pulverized for 10, 90, and 120 min, were termed AC10, AC90, and AC120, respectively. The AC milled for 10 min using the thirteen ϕ10.0 mm balls (ϕ19.5 mm balls were not mixed) at the similar rotation speed was also prepared to realize the particle size between those of AC0 and AC10, which was termed ACS10. The AC sample which was not milled was termed AC0.
Crystalline structures of the ACs were analyzed using an X-ray diffractometer (RINT-2020V, Rigaku Corp., Askishima, Japan) with Cu-Kα radiation (wavelength: 0.15418 nm), providing X-ray diffraction (XRD) patterns of the ACs. The disorder degree of graphene structures of the ACs was also evaluated using a microscopic Raman spectrometer (LabRAM HR Evolution, Horiba Ltd., Kyoto, Japan). The Raman spectra were acquired using a laser of 633 nm wave length. The degree of graphene disorder of ACs was quantified by the peak intensity ratio of the G-band (ca. 1580 cm−1) and D-band (ca. 1360 cm−1), which was defined as Id/Ig. The D-band and G-band corresponded to the in-plane vibrations of sp2 bonded carbon structures with structural defects and the in-plane vibrations of sp2 bonded graphene carbon structures, respectively [37,38,39]. Thus, Id/Ig is an indication of the disorder degree of graphene sheets.
The N2 adsorption–desorption isotherms of the ACs were measured using a gas adsorption analyzer (Autosorb-3B, Quantachrome Instruments Inc., Boynton Beach, FL, USA) at −196 °C. Approximately 30 mg of powdered AC was degassed under a vacuum at 200 °C for >8 h prior to the isotherm measurement. The Brunauer–Emmett–Teller (BET) theory was used to calculate the specific surface area (SBET) of the AC samples using the adsorption isotherm at a relative pressure of 0.05–0.10. The total pore volume (Vtotal) of the sample was determined by measuring the volume of nitrogen absorbed at the relative pressure of 0.99. The quenched solid density functional theory (QSDFT) was used to obtain the pore size distribution [40,41], with aid from the proprietary software (ASiQwin, version 1.11, Quantachrome Instruments Inc., Boynton Beach, FL, USA). Based on the pore size distributions, the volumes of the micro-pores (Vmicro) and meso-pores (Vmeso) were calculated.
The particle size distribution of the produced AC powder was analyzed using a laser diffraction particle size analyzer (SALD-200V, Shimadzu Corp., Kyoto, Japan). The average particle diameter and the cumulative 25%, 50% (median value), and 75% particle diameters, were acquired and were defined as Dave, D25, D50, and D75, respectively.

2.2. Electrochemical Characterization

AC as the active material, acetylene black (Denka Black, Denka Kagaku Co., Ltd., Tokyo, Japan) as the conductive agent, and polytetrafluoroethylene (Polyflon D210-C, Daikin Industries, Ltd., Osaka, Japan) as the binder were mixed in a mass ratio of 8:1:1 by a mortar and pestle, with added ethanol. The mixture was pressed into a sheet, then it was punched out into disks of ϕ12 mm. The mass of AC in the electrode and the electrode thickness were measured, providing the AC bulk density. The morphology of electrodes was microscopically observed using a scanning electron microscope (VE-8800, Keyence Corp., Osaka, Japan).
The meso- and macro-porosity, and interparticle porosity of the prepared EDLC electrodes were evaluated using a mercury porosimeter (PASCAL 140 and 240, Thermo Fisher Scientific KK, Tokyo, Japan). For each AC sample, four pieces of the same type of electrode, which were previously degassed in a vacuum at 140 °C for >6 h were subjected to a mercury intrusion and extrusion sequence. This sequence was performed in the low-pressure range (0.2–400 kPa) using PASCAL 140 and in the high-pressure range (up to 200 MPa) using PASCAL 240, providing the mercury intrusion volume at different equilibrated mercury pressures. The cumulative pore volumes of EDLC electrodes were calculated using the Washburn equation [42] with aid from a software installed in the above mercury porosimeter, where the shape of pores were assumed to be a cylinder.
The disk was pressed onto a ϕ15 mm Al mesh at a pressure of 0.5 MPa using a perpendicular press. The disk attached with an Al mesh was employed as the electrode. The electrodes were dried under a vacuum at 140 °C for >6 h prior to the cell assembly. A two-electrode cell made from Al (HS cell, Hohsen Corp., Osaka, Japan) was assembled in a glove box (GBJF080R, Glovebox Japan Inc., Inagi, Japan) filled with argon gas. The cell was constituted from two identical electrodes, a ϕ23 mm paper-based separator (TF4050, Nippon Kodoshi Corp., Kochi, Japan), and 1 mL electrolyte. The electrolyte was tetraethylammonium tetrafluoroborate at 1 mol L−1 dispersed in propylene carbonate (TEA·BF4/PC, Kishida Chemical Co., Ltd., Osaka, Japan).
The current passing through the electrodes under voltage application across the cell terminals was evaluated by cyclic voltammetry (CV). CV was performed at the scan rates of 1, 10, and 100 mV s−1 using an electrochemical measurement system (HZ5000, Hokuto Denko Corp., Tokyo, Japan) at the cell voltage range of 0–2.5 V. The specific capacitance of the AC during the CV measurement (CCV) was calculated from Equation (1).
C CV   ( F   g 1 ) = 4 I CV m V S
where m (g) is the total mass of AC incorporated in both the positive and negative electrodes, ICV (A) is the current measured at different applied voltages, and VS (V s−1) is the voltage scan rate.
A battery charge–discharge system (HJ1005SD8, Hokuto Denko Corp., Tokyo, Japan) was used to perform the galvanostatic charge–discharge (GCD) tests for the EDLC cells, during which the cell voltage was increased to 2.5 V for the charge process and was decreased to 0 V for the discharge process at different current densities of 0.1–100 mA cm−2. Table 1 shows the detailed conditions in the GCD rate tests. The charge–discharge performances at different current densities were evaluated at the specified cycle numbers. The gravimetric specific capacitance of the AC in the GCD tests (CGCD) was calculated using Equation (2).
C GCD   ( F   g 1 ) = 4 Q m V
where Q (C) is the charge released during the discharge process and V’ (V) is the maximum cell voltage (2.5 V) subtracted by the IR drop observed at the switching from charge to discharge processes. The IR drop is the voltage drop caused by the internal resistance, which can be represented by ESR. The relationship between the current density and the ESR at the switching of charge to discharge was also obtained for all types of ACs. The volumetric specific capacitance (F cm−3) was also calculated based on the AC bulk density in the electrode. The charge or discharge specific capacity of the AC was also defined to be a time-integral of the current divided by m, providing the specific capacity−cell voltage profile of the AC. The Ragone plot was created by calculating the energy density of the electrode, E (Wh kg−1), and power density of the electrode, P (W kg−1), from the GCD test results using Equations (3) and (4), respectively.
E   ( Wh   kg 1 ) = 1000 W m
P   ( W   kg 1 ) = 1000 V I m
where W (Wh) is the energy released from the cell during the discharge process, and I (A) is the discharge current. Using the AC bulk density in the electrode, the volumetric energy density and volumetric power density, in respective units of Wh L−1 and W L−1, were also calculated.
For the evaluation of electrode cycle stability, following the GCD rate test, the EDLC cell was charged and discharged 2000 times at the constant current density of 10 mA cm−2 under the similar cell voltage range. The gravimetric specific capacitance of the electrode was measured as a function of the number of cycles. All measurements and analyses were performed at 25 °C.

3. Results and Discussion

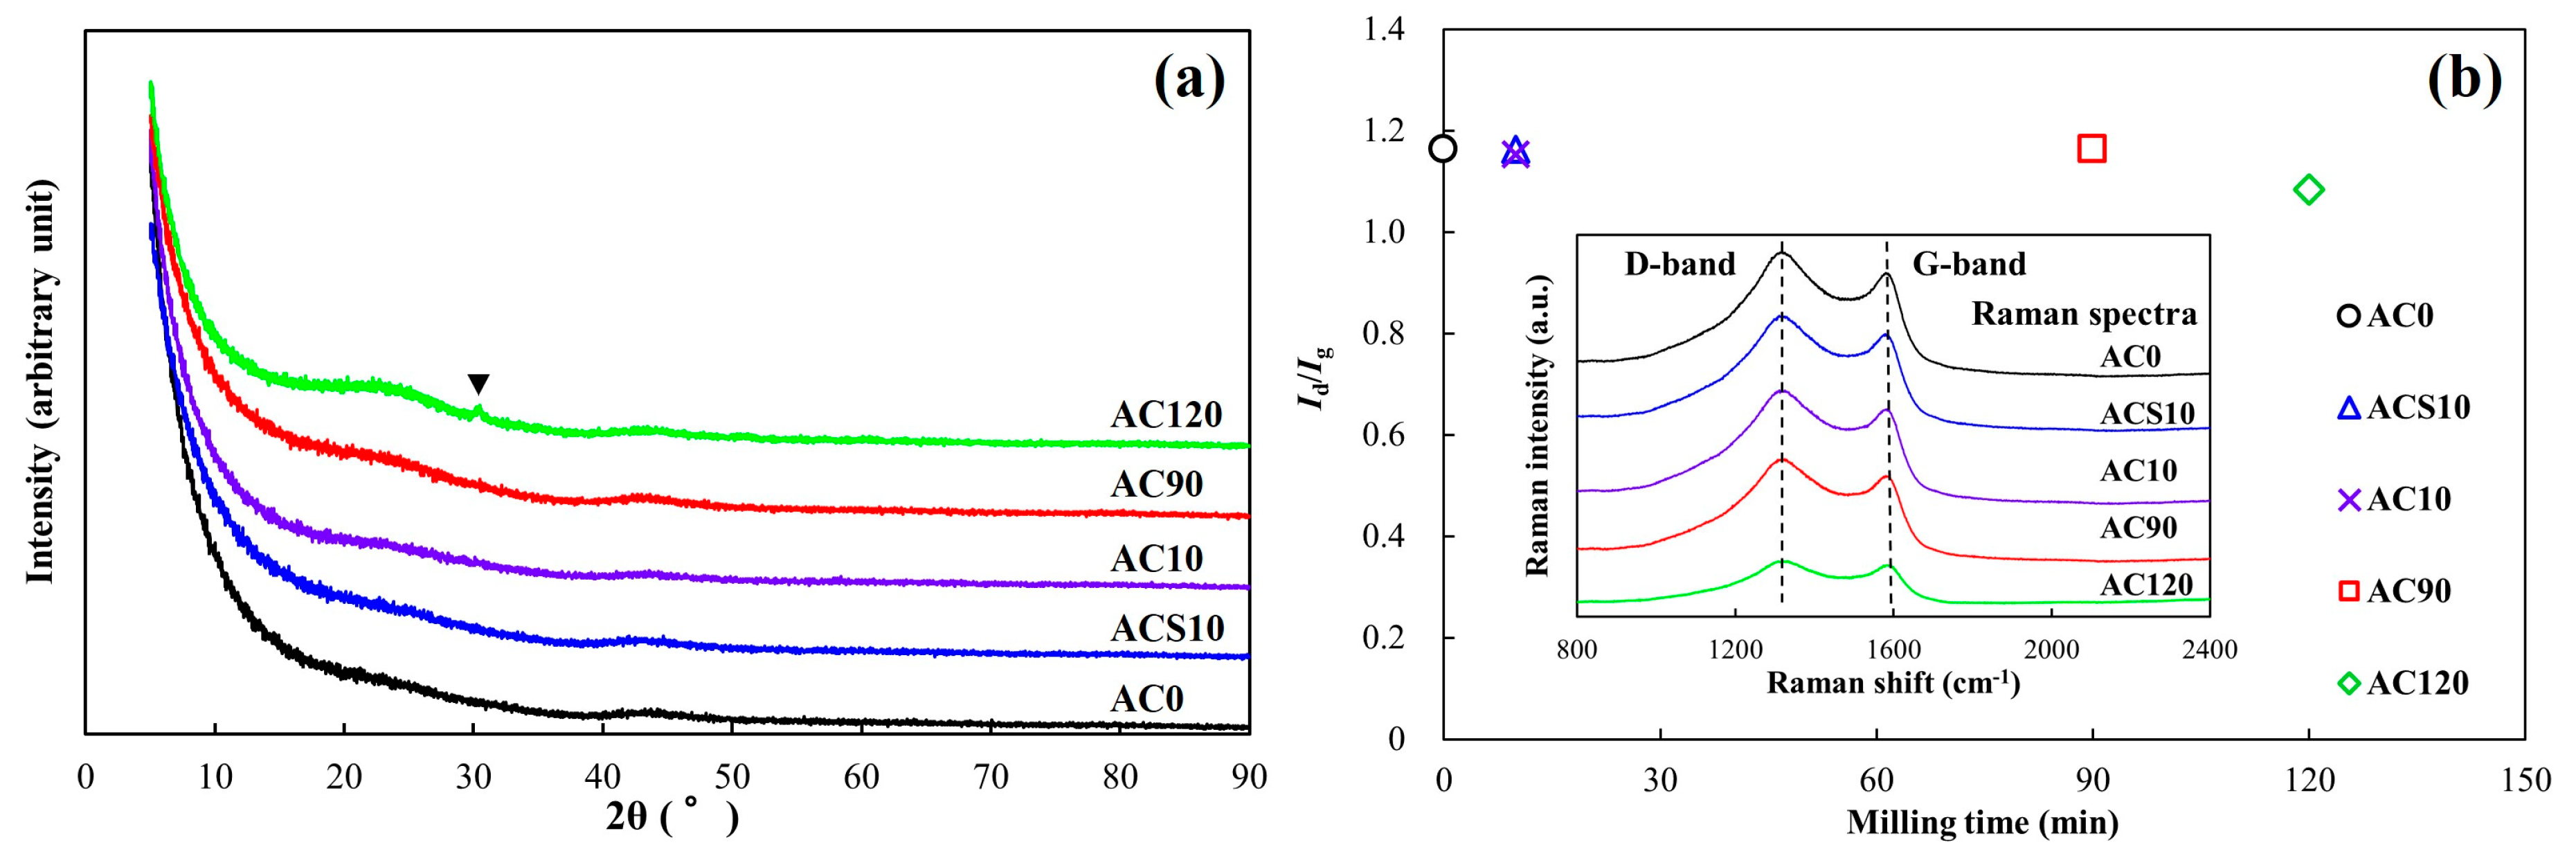
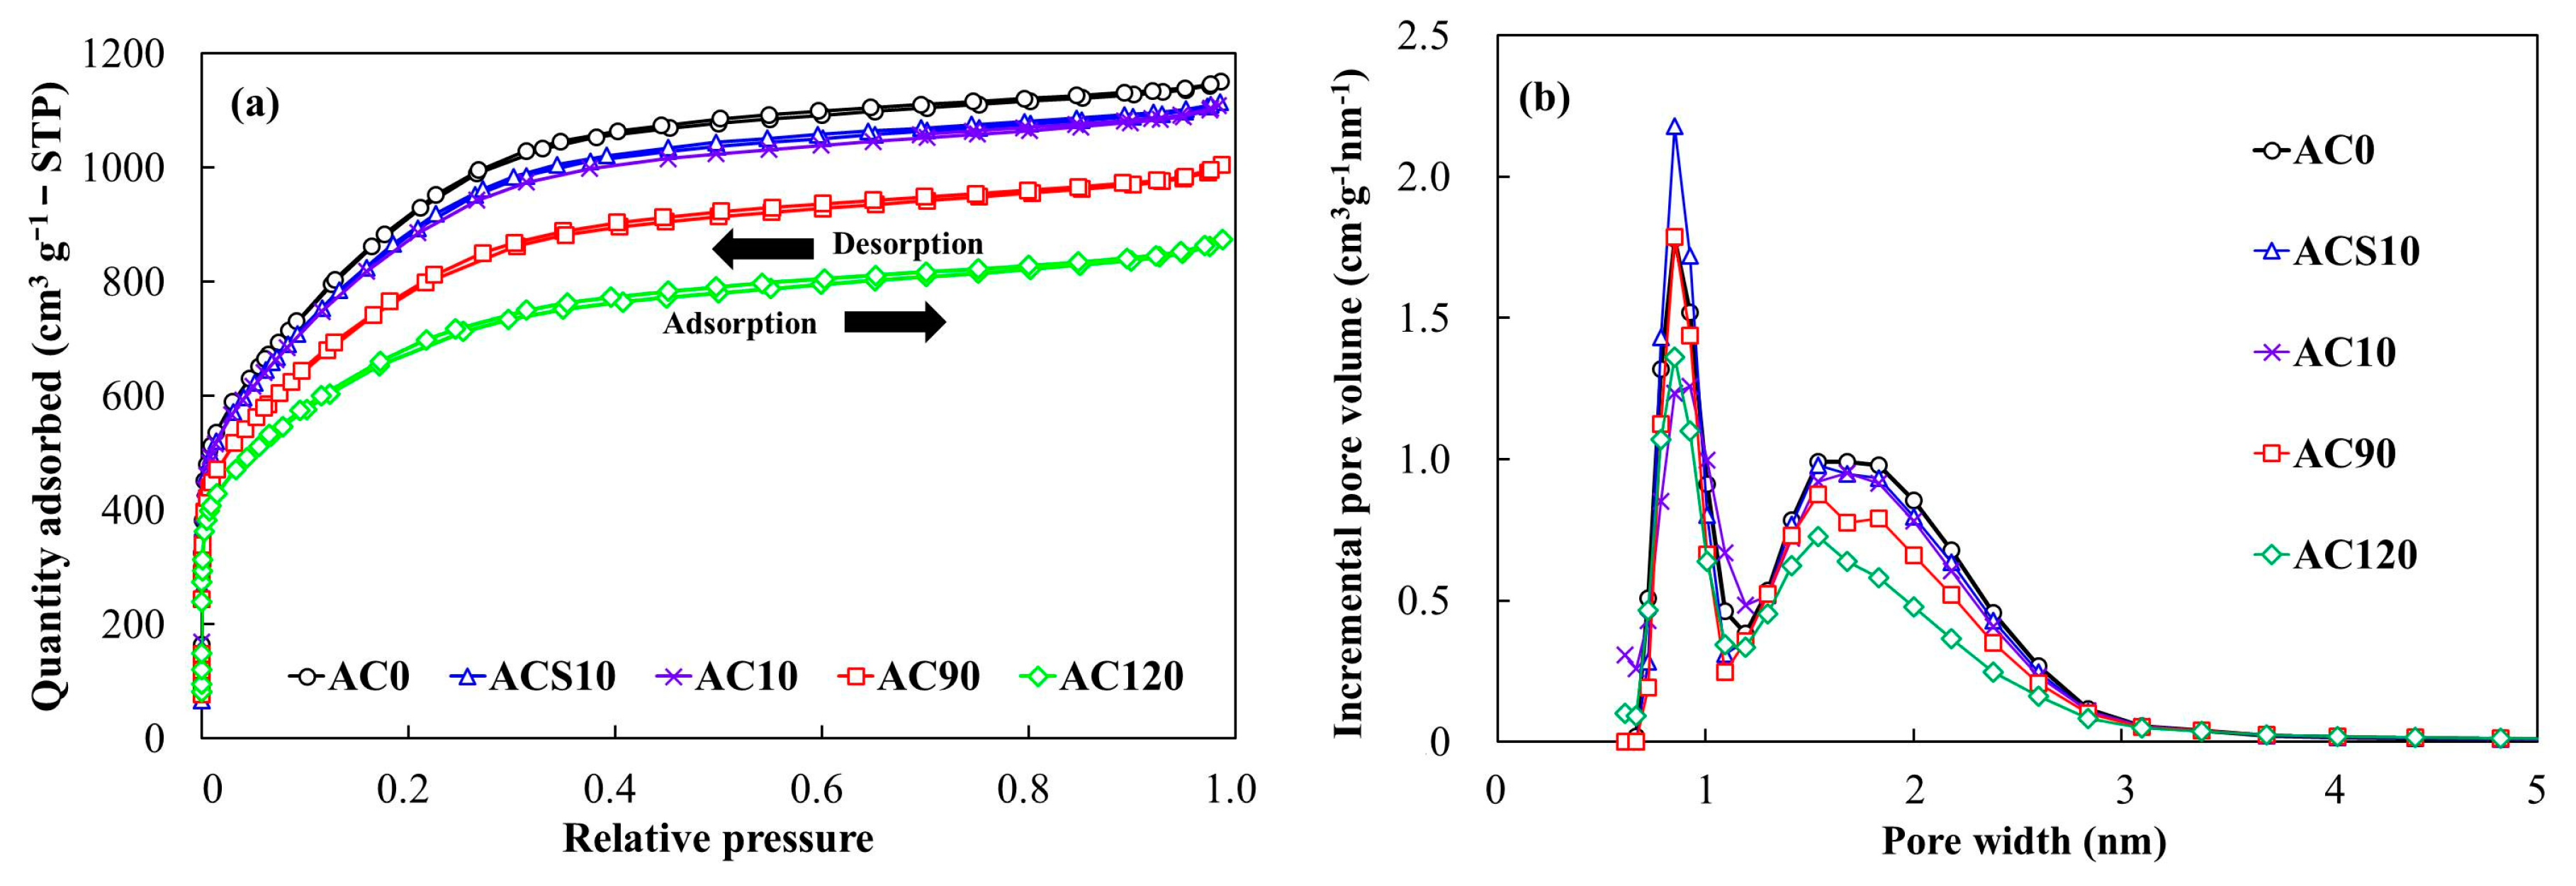
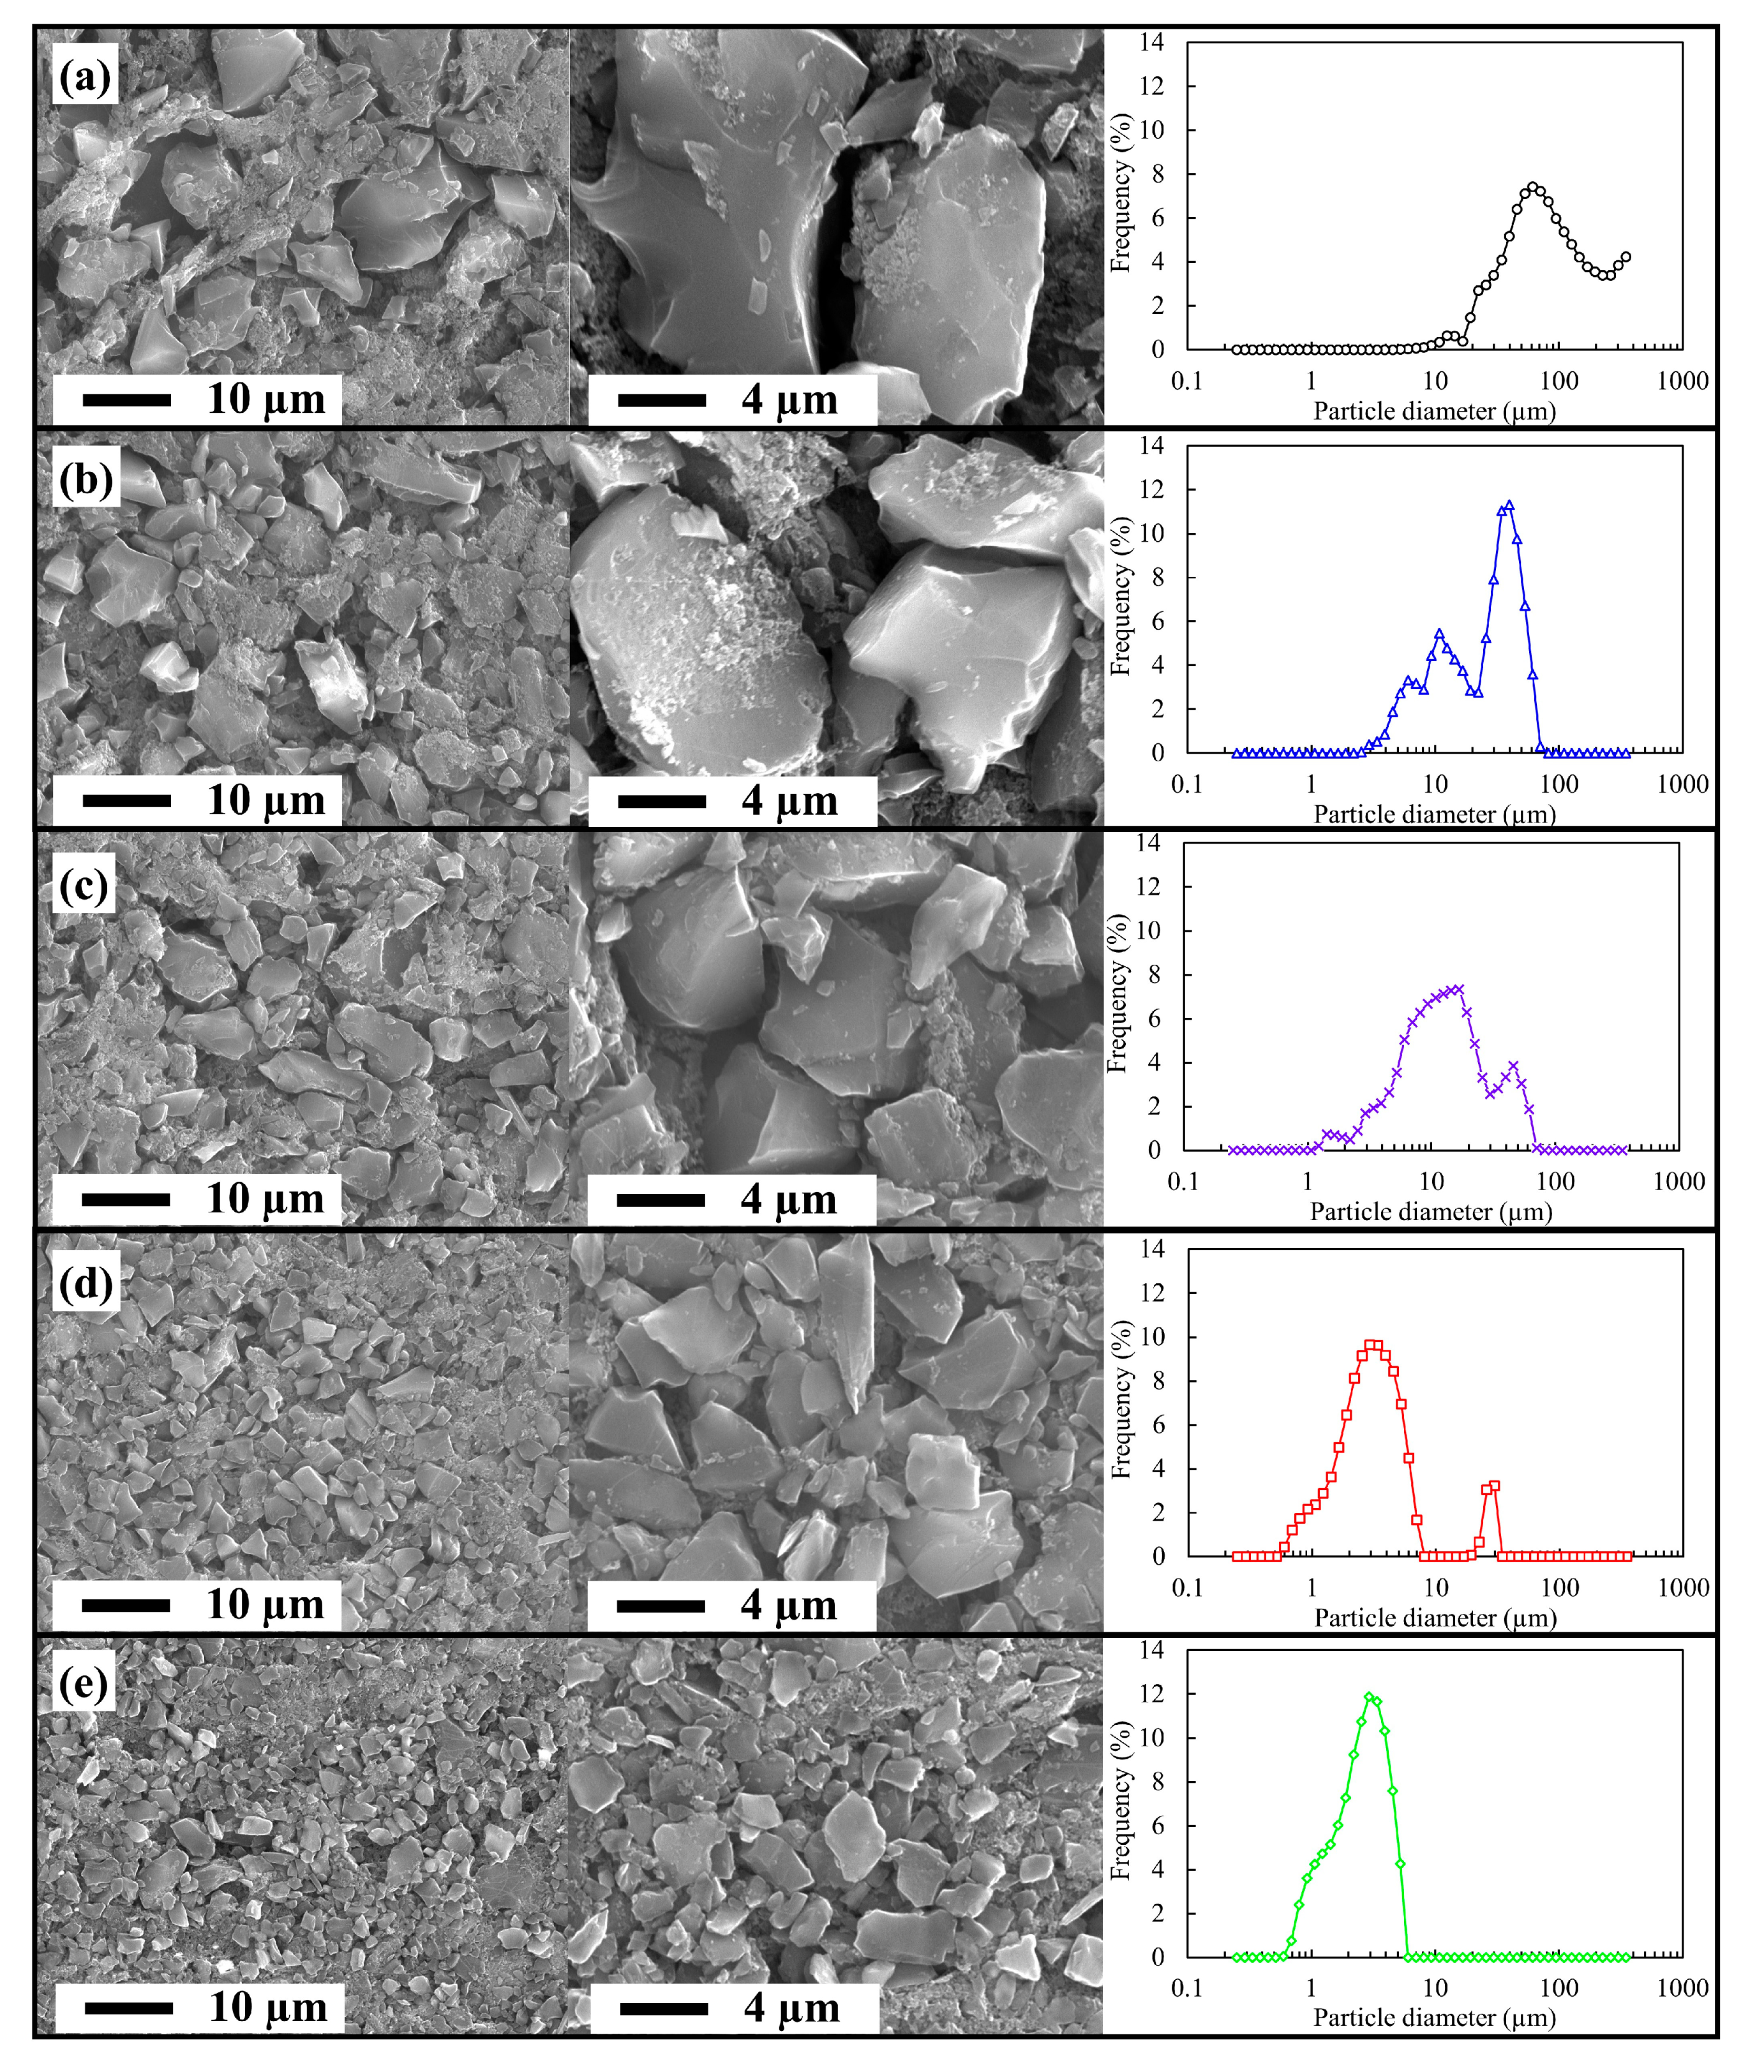
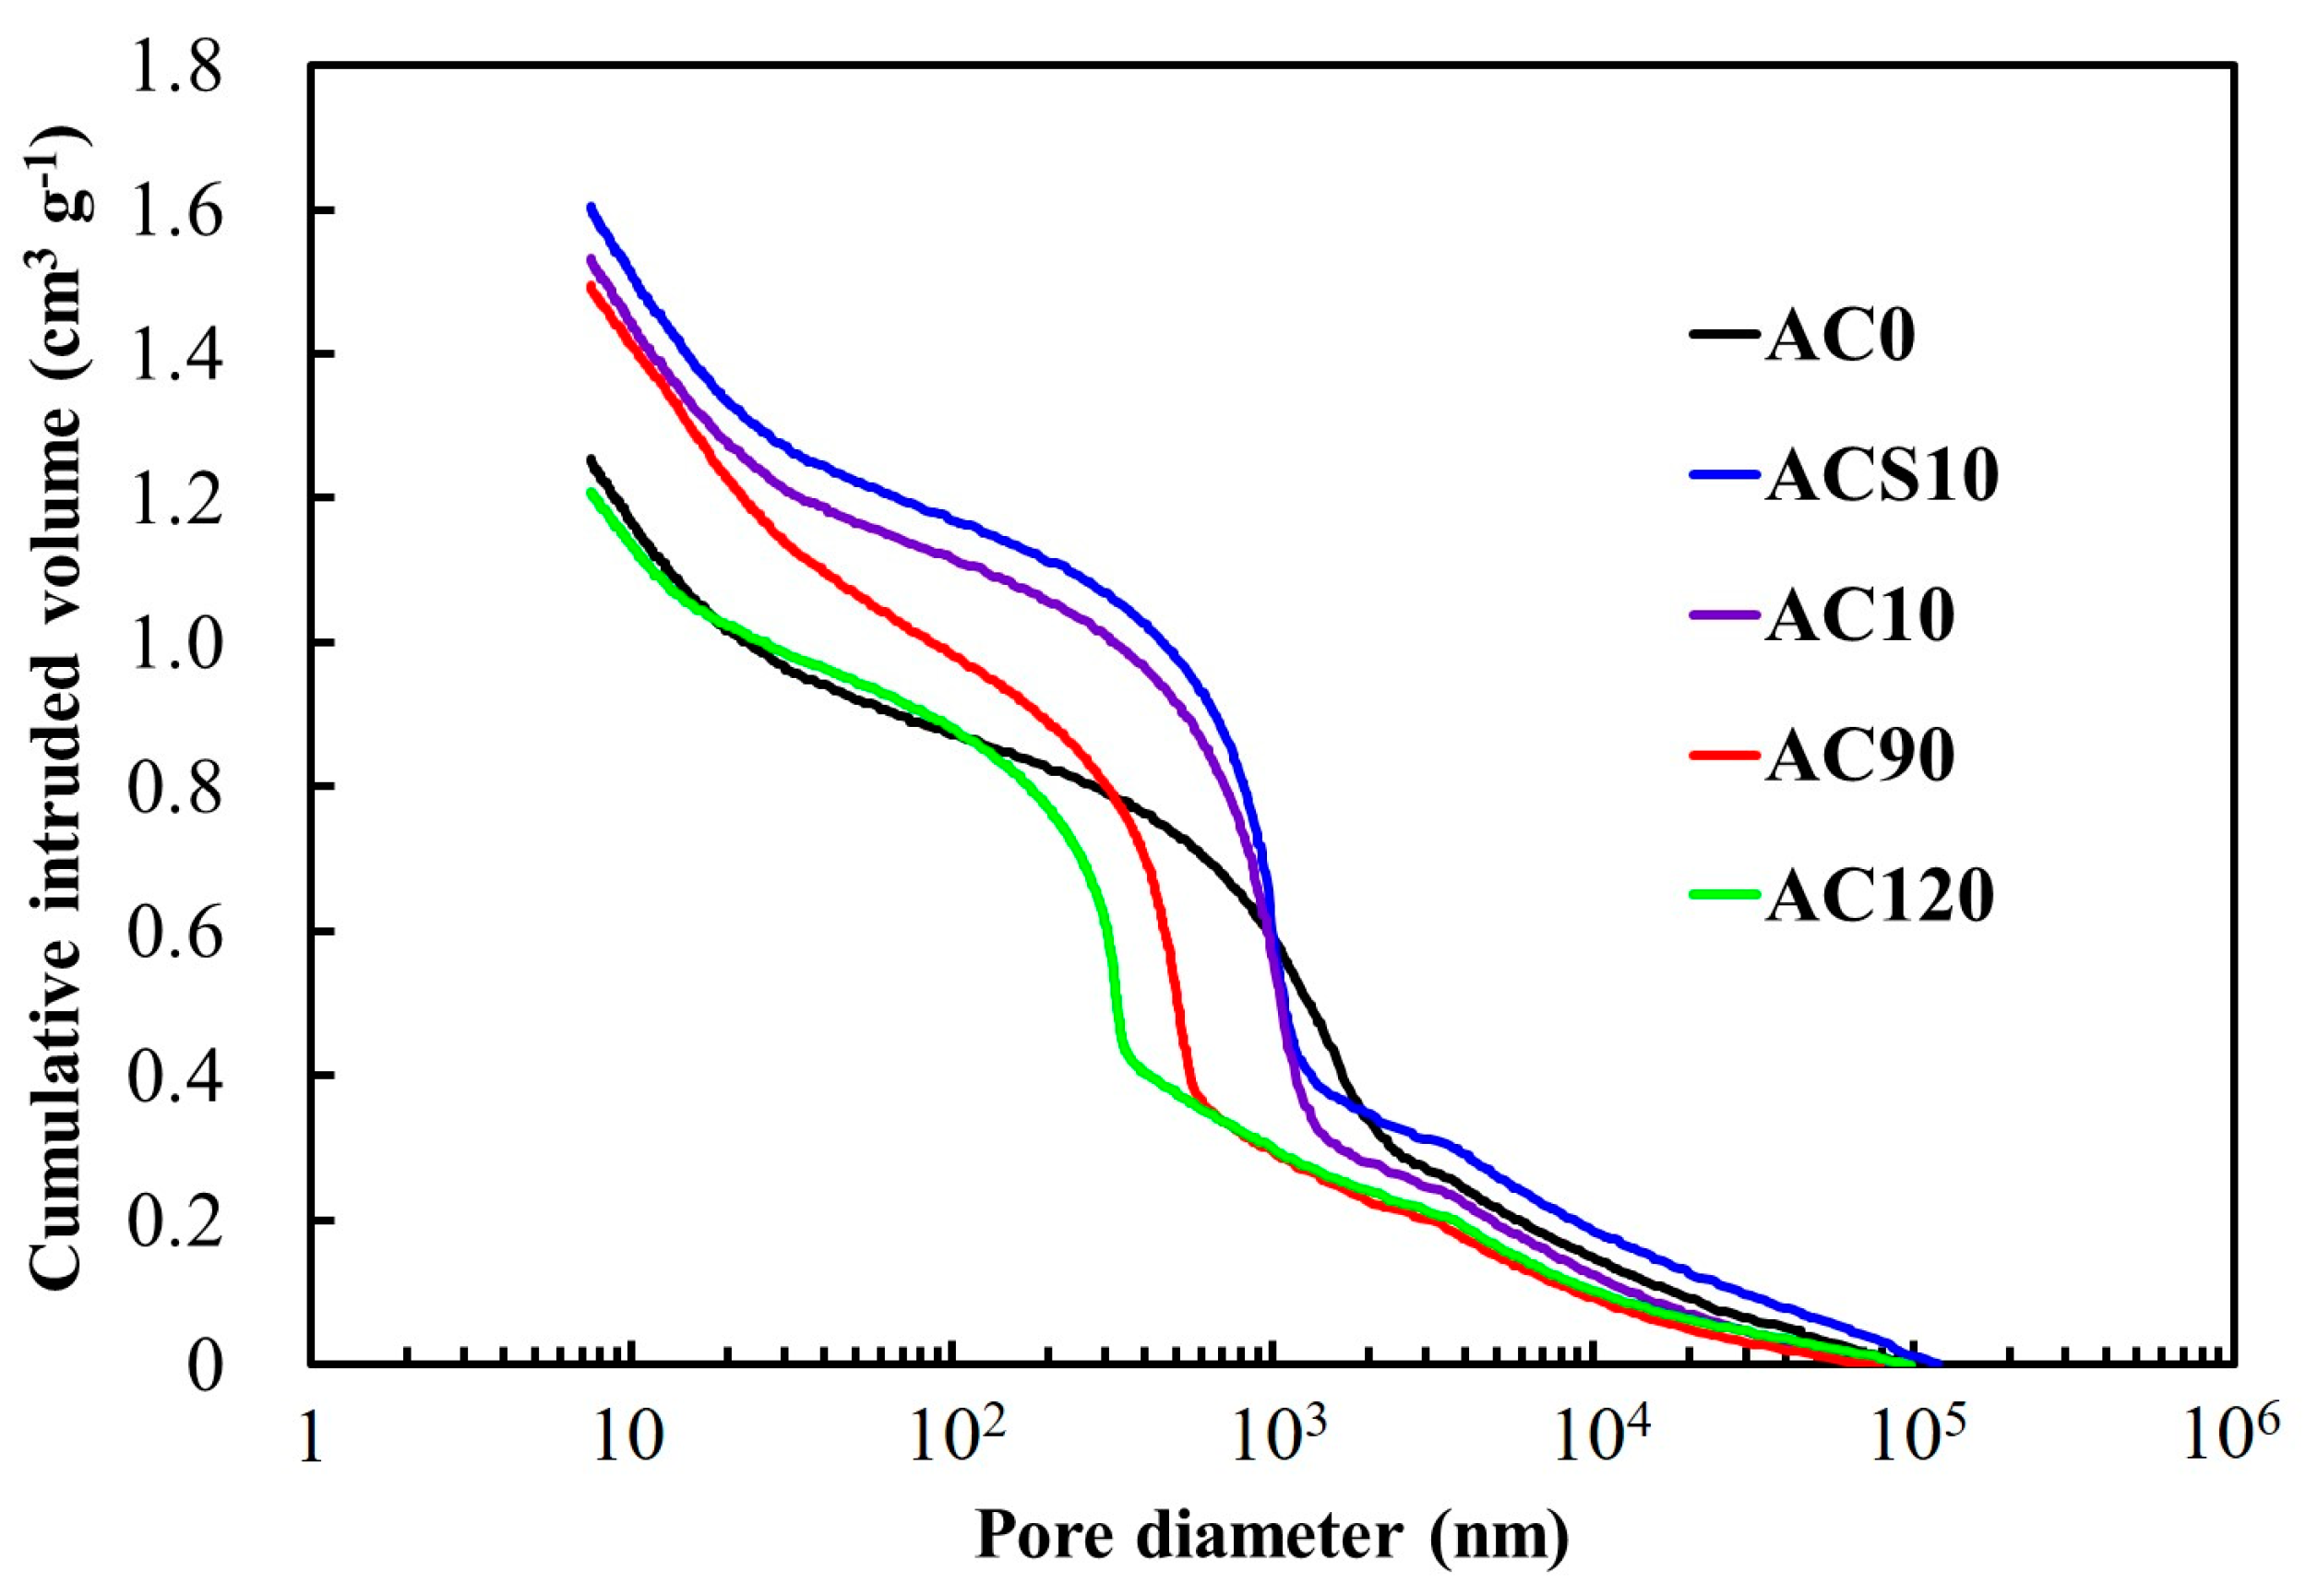
3.1. Material Properties of the Milled ACs

The ACs with different particle sizes were produced by changing the ball milling process. XRD patterns and Raman spectra for the milled ACs were obtained and are shown in Figure 1. In the XRD patterns, all ACs exhibited two gentle humps at the 2θ values of ca. 23 and 43°. These patterns are characteristic of turbostratic carbons, meaning that these lack correspondence between graphene planes [43]. Only a tiny peak (marked by an inverted triangle) was observed in the XRD pattern of AC120 at 30°, which was confirmed to be caused by the debris of zirconia balls and bowl used for the AC milling [44]. It was clearly indicated that carbon structures of all the ACs were turbostratic, and the milling process had little impact on those carbon structures. The Raman spectra of all the ACs displayed the D-band and G-band peaks resulting from carbonaceous structures. The Id/Ig values of AC0, AC10, ACS10, and AC90 were similar; while that of AC120 was slightly lower than the others. The lowering of Id/Ig indicates that AC120 alleviated the disorder of graphene sheets. From both the results of X-ray diffractometry and Raman spectroscopy, it was shown that, when the ball milling time was limited to within 120 min, the structural changes of the AC during the ball milling were minor.
Figure 2 shows the nitrogen adsorption–desorption isotherms at the temperature of −196 °C. All of the nitrogen adsorption isotherms exhibited a slightly hysteretic behavior at the relative pressure of 0.2–0.8. These can be categorized into an IUPAC type I (b) isotherm, suggesting pore size distributions over a broader range including wider micropores and possibly narrow meso-pores (<∼2.5 nm) [45]. It was found that, over the entire range of relative pressures, the adsorption quantity decreased with the milling time. All of the ACs allowed a development of pores that were 0.6–1.0 and 1.2–3.0 nm. The peaks of pore width for the ACs subjected to the ball milling shifted to the smaller side. Table 2 shows the textural properties of the ACs based on the above isotherms and pore size distributions. All of the textural parameters decreased with the milling time. The SBET and Vtotal of the nonmilled AC (AC0) were measured to be 3198 m2 g−1 and 1.78 cm3 g−1, respectively. The SBET of AC90 and AC120 were 2755 and 2448 m2 g−1, respectively, indicating that the ball milling for 90 or 120 min induced surface area decrements of 13.9% and 23.5%, respectively. The ratio of Vmicro to Vtatal and that of Vmeso to Vtatal were ~70% and ~20%, respectively, which were similar in all ACs.
Figure 3 shows the surface morphology of the electrodes using the milled ACs, and their particle size distributions. With increasing the milling time, the size of AC particles decreased and the gap between the AC particles at the electrode surfaces decreased. It was observed that dense surface structures were produced for the electrodes comprising ACs that were subjected to a long milling time (AC90 and AC120). The particle size distributions suggested that the mode (most frequent) particle size of AC decreased with the milling time. AC0 was composed of course particles and allowed a dominant existence of particles at >50 µm in diameter, while AC120 comprised only fine particles with diameters of <6 µm. It should be noticed that AC90 exhibited two peaks on its particle size distribution, which were attributed to milled fine particles at <8 µm and residual large particles at 20–30 µm. Particle properties of the milled ACs calculated based on the above distributions are shown in Table 3. AC0 and ACS10, which were composed of large size particles, did not show coincident Dave and D50. It was also confirmed that 75% of their particles were within 2 × D50 for AC10, AC90, and AC120, indicating that those were sufficiently pulverized rather than AC0 and ACS10. The ACs pulverized for 150 min using the five ϕ19.5 mm balls were also prepared and its Dave was measured to be 3.4 µm. It was suggested that excessive milling induced a particle agglomeration and the milling for 120 min attained the greatest pulverization.

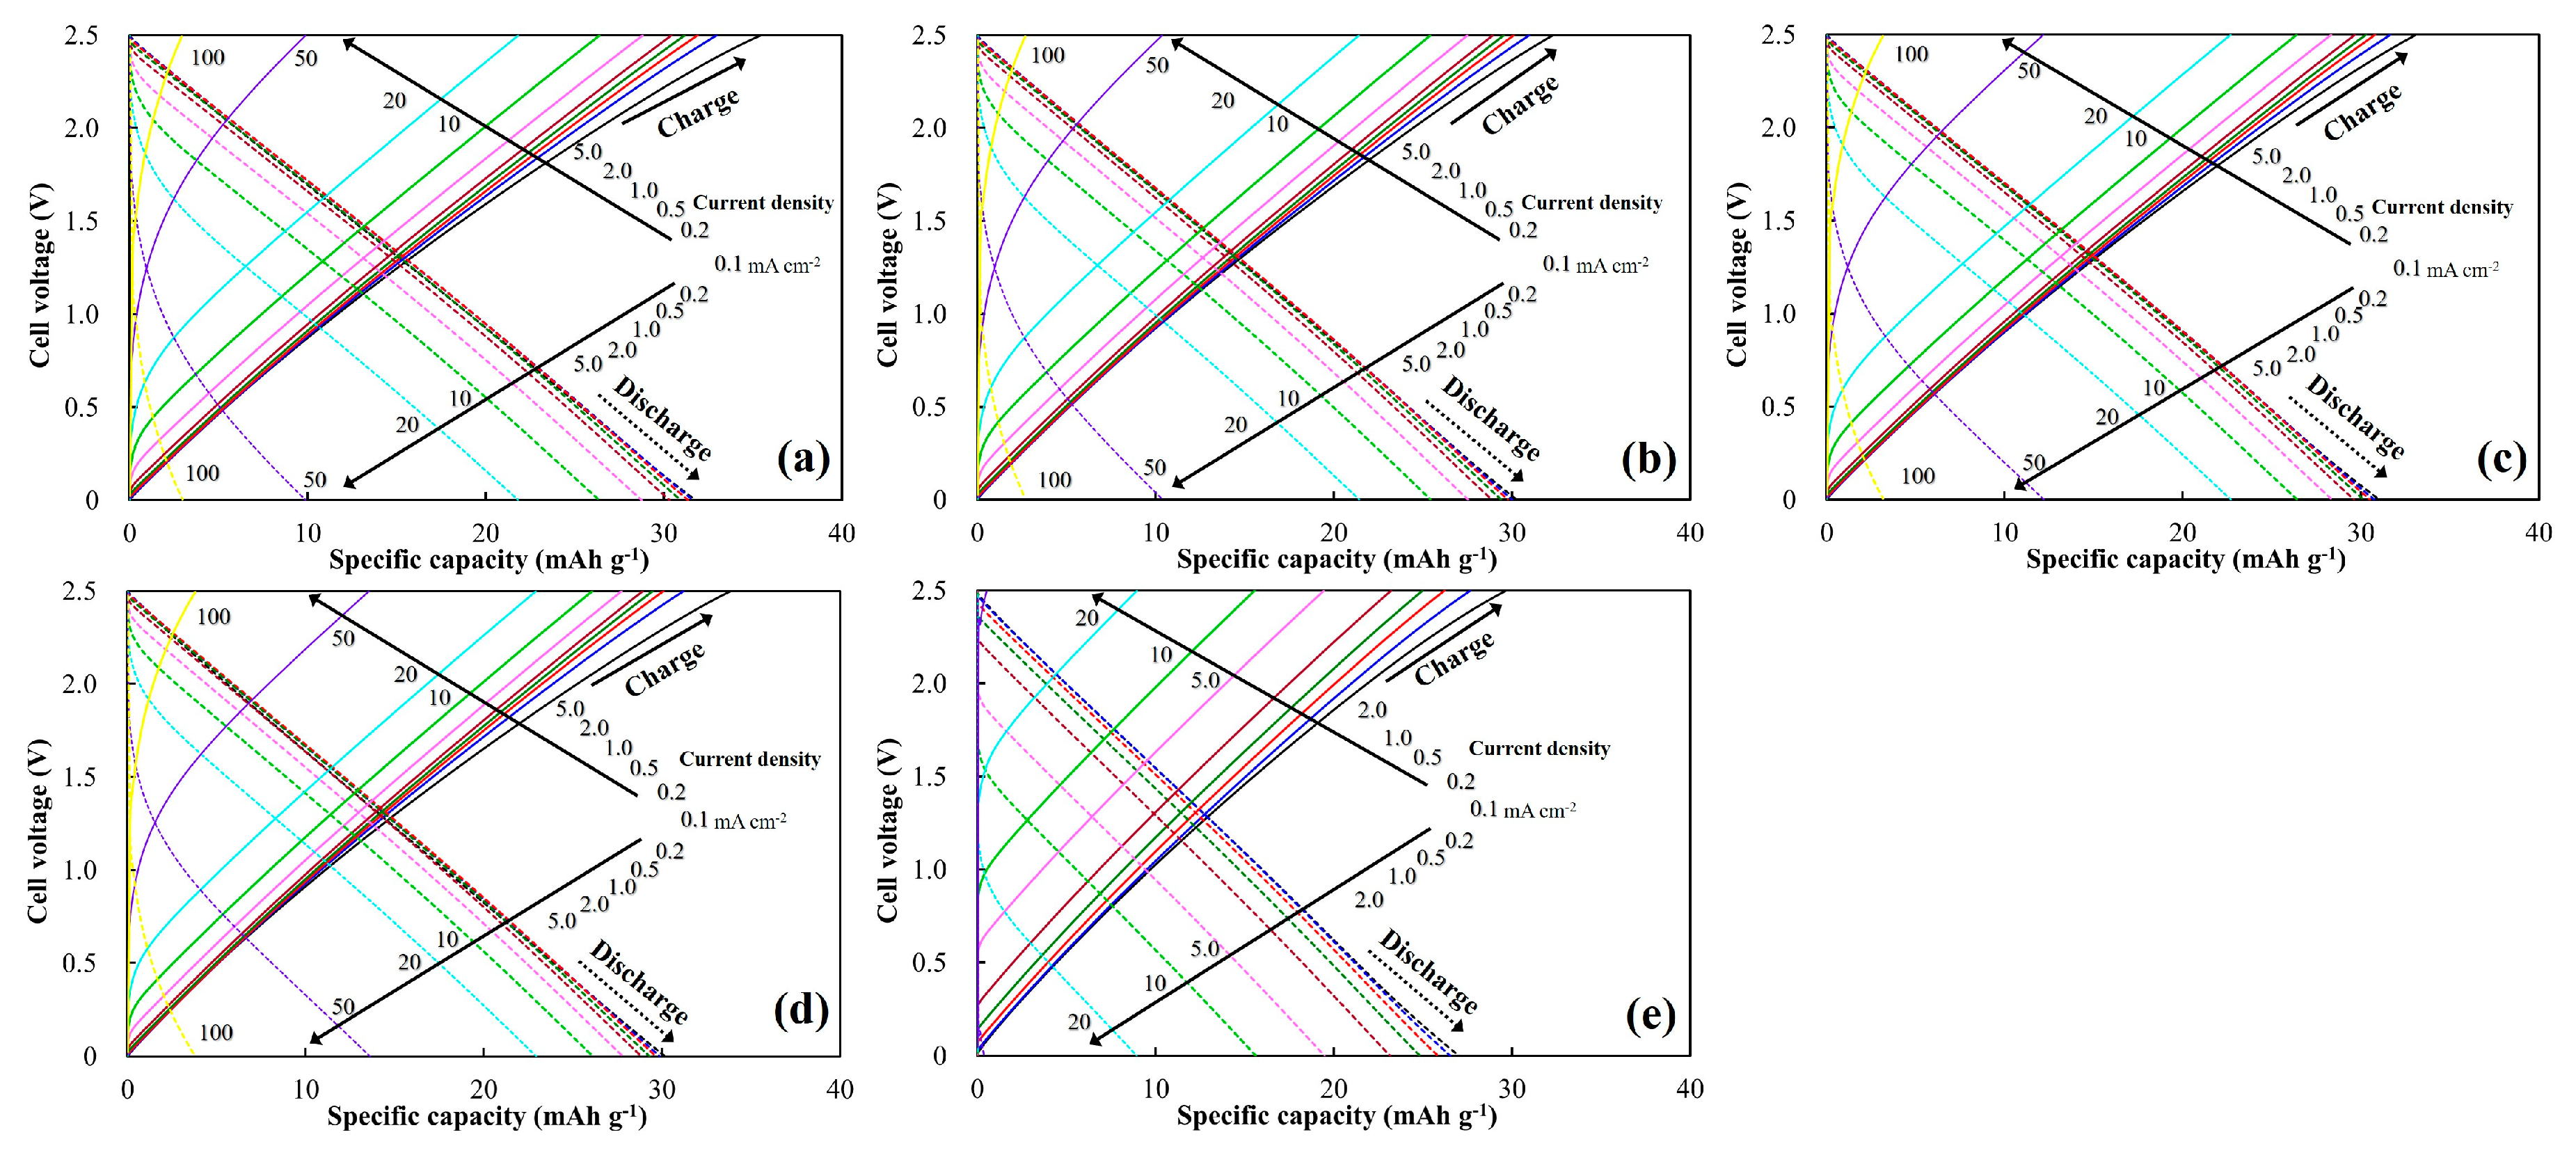
3.2. Electrochemical Properties of the Milled ACs

Details of the fabricated electrodes used for EDLC cells are shown in Table 4. The electrodes were ϕ12 mm disks incorporating the milled ACs of 10–13 mg, and their thickness ranged from 0.29 to 0.32 mm. The bulk density of AC in the electrode was dependent on the milling time. The higher AC bulk density was obtainable from the ACs pulverized for a longer time. The markedly high AC bulk density (0.39 g cm−3) was apparent for the electrode using AC120.
The meso- and macro-porosity, and interparticle porosity of the prepared EDLC electrodes were evaluated by means of mercury porosimetry. Figure 4 shows the cumulative pore volumes of the electrodes using the milled ACs. With decreasing the pore diameter, in other words, with increasing the mercury intrusion pressure, the cumulative volume of mercury intruded into the EDLC electrodes increased. All the electrodes allowed a linear increase in the cumulative intruded volume up to ~0.4 cm3 g−1. Above ~0.4 cm3 g−1, the cumulative intruded volume steeply increased with decreasing the pore diameter. Judging from the surface morphology of the EDLC electrodes, shown in Figure 3, the pore diameter corresponding to the end of the linear volume increase coincided with the interparticle distance (gap between AC particles), for instance, 1.5 µm for AC10, 0.7 µm for AC90, and 0.3 µm for AC120. Thus, it is reasonable to interpret that the variations in the cumulative intruded volume above 0.4 cm3 g−1 indicates the meso- and macro-porosity of the electrodes, which were produced within AC particles. It was observed that the electrodes using ACS10 and AC10 allowed a greater development of macro-pores, while that using AC90 possessed a largest volume of meso-pores of 7–50 nm. The electrodes using AC0 and AC120 exhibited the poorest macro- and meso-porosity. The electrodes using ACS10 and AC10 had a similar meso- and macro-porosity, although their average particle sizes had a twofold difference.
The cyclic voltammograms converted from the current response during the CV at the scan rates of 1, 10, and 100 mV s−1 are shown in Figure 5, providing the specific capacitance at the varying voltage cell. The symmetrical curves appeared in all the ACs at the scan rate of 1 mV s−1, meaning that an electric double-layer without a redox reaction was soundly formed on the electrode. At the scan rate of 1 mV s−1, AC0 showed the highest gravimetric specific capacitance, and the gravimetric specific capacitance of the ACs decreased with the milling time. As the voltage scan rate increased, the CV curves allowed a depressive distortion. The curve distortion of AC90 was found to be most suppressed at the scan rates of 10 and 100 mV s−1, indicating that the lowest internal resistance was produced in the AC90 electrode. It should be noticed that, at all the scan rates, the gravimetric specific capacitance of AC120 was lowest in all the ACs. The highest gravimetric specific capacitance did not appear for the nonmilled and the most milled ACs at the increased scan rates, suggesting that the degree of milling had a definite influence on the charge–discharge rate performance of AC.
Figure 6 shows the specific capacity–cell voltage profiles of the ACs under different current densities during the GCD rate test. The IR drops were observed at the start of charging and discharging. The IR drops appeared distinctly above the current density of >10 mA cm−2 in all of the samples. AC120 allowed the largest IR drop, while the other ACs allowed similar levels of IR drops, indicating that a noticeable ESR was produced within the AC120 electrode. At the lower current density of <1 mA cm−2, where the IR drop was negligible, a longer milling time led to a decrease in the specific capacity at the end of the discharge process. Representative ESR values of the milled ACs at the switching of charge to discharge during the rate GCD tests were calculated and are shown in Table 5. The ESRs of the milled ACs tended to decrease with the current density. The ESR of AC120 was found to be considerably high, while those of the other ACs were comparable regardless of the current density. The comparable ESR values mean that the charge-storage or charge-release performance of ACs was mainly governed by their dynamics of double-layer formation and release, and was hardly related to the electrolyte, contact, and intrinsic resistances.
The gravimetric and volumetric specific capacitances, and the gravimetric and volumetric Ragone plots for all the ACs are shown in Figure 7. The gravimetric specific capacitances of all the ACs were maintained up to the current density of 5 mA cm−2. The nonmilled AC (AC0) displayed the highest gravimetric specific capacitance of 183 F g−1, while the AC subjected to the longest milling (AC120) had the lowest value (<160 F g−1). At the higher current density (>10 mA cm−2), the ACs allowed a decline of the gravimetric specific capacitance, where the degree was dependent on the milling time. AC10 and AC90, which had middle levels of Dave, could retain a high gravimetric specific capacitance. Under a very high current density (>20 mA cm−2), the gravimetric specific capacitance of AC120 was measured to be negligible. From the gravimetric Ragone plots, the highest gravimetric energy density of 39.3 Wh kg−1 was observed on AC0 at the gravimetric power density of 12.0 W kg−1. Except for AC120, very little difference in gravimetric energy density among the type of ACs was observed at the lower gravimetric power density (<1000 W kg−1). Under the very high gravimetric power density (>2000 W kg−1), AC90 displayed the highest gravimetric energy density of all the ACs.
The volumetric specific capacitances of all the ACs were different from the gravimetric ones. At the lower current density (<10 mA cm−2), AC120 showed the highest volumetric specific capacitance of 61.7 F cm−3. Sufficiently milled ACs (AC90 and AC120) could also attain a similar level of the high volumetric specific capacitance. However, under the higher current density (>10 mA cm−2), AC0 and AC120 allowed the volumetric specific capacitance to lower. Only AC90 could largely retain the volumetric specific capacitance. The volumetric Ragone plots indicated that all the ACs showed a comparable volumetric energy density at the lower volumetric power density (<100 Wh L−1). Among them, the highest volumetric energy density of 13.0 Wh L−1 was observed for AC120 at the volumetric power density of 4.3 W L−1. AC90 had the highest ability to keep the volumetric energy density, even under the higher volumetric power density (>100 W L−1). The appropriate milling process enabled us to enhance the volumetric energy density from 4.9 (AC0) to 6.6 Wh L−1 (AC90) even under the high volumetric power density of 1 kW L−1, while the most milled AC (AC120) did not operate at 1 kW L−1. It is true that the differences between the particle properties of AC90 and AC120 were not as large (Dave = 3.0 µm for AC90 and Dave = 2.2 µm for AC120). The results regarding the GCD rate tests revealed that the ball milling process had a large influence on the volumetric performance, rather than on the gravimetric performance. It was also revealed that excessive milling of the AC active material can degrade the high-power performance of the EDLC cell.
Figure 8 shows the cyclic stability of the specific capacitance of the milled ACs at the current density of 10 mA cm−2 under the cell voltage range of 0–2.5 V. The specific capacitance retentions of AC0, ACS10, AC10, AC90, and AC120 were 96%, 93%, 96%, 95%, and 93%, respectively, which guaranteed the initial cycling stability of ACs. Although their long-term stability could not be verified, the effect of the milling process on the cyclic charge–discharge performance was shown to be minor.

3.3. Material and Electrochemical Properties of the ACs with Different Particle Sizes

The petroleum coke-based AC with a very high specific surface area (SBET = 3198 m2 g−1) and with a number of course particles (Dave = 74.9 µm) was pulverized to find its greatest gravimetric or volumetric EDLC performance. The pulverization was executed by means of planetary ball milling under different milling times and different types of zirconia balls. Using five ϕ19.5 mm zirconia balls at a rotation speed of 400 rpm, finely and uniformly pulverized ACs were produced; Dave = 11.6 µm for 10 min (AC10), 3.0 µm for 90 min (AC90), and 2.2 µm for 120 min (AC120). Instead of gaining fine and uniform particles, the AC allowed a decrease in SBET because of the cumulative collisions between the balls and the particles. X-ray diffractometry and Raman spectroscopy revealed that structural changes of the AC hardly occurred during the ball milling. Despite the difference in Dave between the AC90 and AC120 being slight, AC120 displayed a much lower SBET (2448 m2 g−1) than did AC90 (2775 m2 g−1). The pore size distribution analysis verified that pores within the AC degenerated during the ball milling. A trade-off between the pulverization and the porosity maintenance was apparent up to the milling time of 90 min. However, this relation was invalid for the longer milling time (120 min). Under the present ball milling mechanism, the pulverization of particles became saturated, while the pore degeneration subsequently proceeded with the milling time.
The performances of milled ACs as the active materials of EDLC electrodes was explored by means of GCD rate tests. AC0 and AC120 exhibited the maximum gravimetric and volumetric specific capacitance, respectively. However, at the higher current density (>10 mA cm−2), both the ACs allowed noticeable decreases in the specific capacitance. The greatest maintenance of both the gravimetric and volumetric specific capacitance, as well as the high volumetric specific capacitance, which was comparable to that of AC120, was observed on AC90. At the high-power density of 1 kW L−1, the volumetric energy density of the electrode increased from 4.9 (AC0) to 6.6 Wh L−1 (AC90, 35% increment) by the milling process optimization. It was advocated that the smaller size of AC particles was responsible for the decrease in the diffusion resistance of ion-transport within the particles [26]. Even if AC90 allowed the decrease in surface area to form an electric double-layer because of the long-term milling, the electrode densification and the enhanced ion-transportation within the AC pores led to the excellent rate performances. AC120, which was most finely and uniformly pulverized, displayed the poorest rate performances out of all the ACs. The difference in statistic parameters of Dave or D50 between AC90 and AC120 was slight. Based on the percolation theory for carbon particles in an insulating media, the particle size can have an influence on the electric conductivity of the composite [46]. However, judging from the slight difference in Dave between AC90 and AC120, and the low fraction of insulating polytetrafluoroethylene binder in the electrode (10 mass%), the greater rate performance of AC90 was not explainable from a percolation theory. It was revealed that AC90 included milled fine particles and residual large particles at 20–30 µm, while AC120 comprised only fine particles of <6 µm. The much higher electrode bulk density for AC120 (0.39 g cm−3) was clearly attributed to the more finely and uniformly pulverized particles. For the highly filled EDLC electrodes, a wide interparticle gap, which is necessary to assist the impregnation of electrolyte into discrete AC particles, and thus into micro- and meso-pores within the ACs [23,25], was not realized. It was also demonstrated that the electrode using AC90 attained the greatest meso-porosity of 7–50 nm, which could offer fluent ion-transportation connected to the higher rate performance.
The results obtained here indicated that, for ACs with a very high specific surface area (~3000 m2 g−1), particle pulverization was still effective for enhancing the volumetric EDLC performances and the stability against the high current or power density. However, excessive pulverization can rather degrade the EDLC performances of ACs because of excessive electrode densification, which restricts the ion-transportation within pores. In addition to the statistic particle size parameters (Dave or D50), the particle size distribution of AC was also found to be an important factor to determine the EDLC performances.

4. Conclusions

In the present study, the ball milling process was optimized for AC with a very high surface area and course particles, as the active material of EDLC cells using a nonaqueous electrolyte, so as to attain the greatest electrochemical performance. The carbonaceous structure, micro- and meso-porosity, and particle size distribution of the AC were evaluated as a time function of the planetary ball milling. The EDLC electrodes comprising the ACs milled under different conditions were evaluated in the GCD rate and cycle tests, providing their gravimetric and volumetric specific capacitances, Ragone plots, and cyclic charge–discharge stability. Meso- and macro-porosity, and interparticle porosity of the EDLC electrodes produced from the milled ACs were also evaluated.
With the development of pulverization, the AC allowed the decrease in SBET, which was closely related to the area of double-layer formation. The AC milled at 400 rpm for 90 min (AC90) allowed a decrease in SBET from 3198 to 2775 m2 g−1, and thereby a decrease in the gravimetric specific capacitance at the lower current density of <10 mA cm−2. However, it exhibited the greatest maintenance of both the gravimetric and volumetric specific capacitance at the higher current density of >10 mA cm−2. Even at the high volumetric power density of 1 kW L−1, it showed a noticeable volumetric energy density of 6.6 Wh L−1, which was 35% higher than that of the untreated AC. A combination of milled fine particles at <8 µm and residual large particles at 20–30 µm led to the electrode densification (decreased interparticle gap), and the enhanced ion-transportation within the AC pores.
It was also revealed that excessive pulverization did not enhance either the gravimetric or the volumetric performances of the AC, in particular at the higher power density. A much higher electrode bulk density (0.39 g cm−3) was attained by the AC milled for 120 min (AC120), which comprised only fine particles of <6 µm. However, the lowered micro- and meso-porosity and the excessive electrode densification restricted the ion-transportation within the pores, leading to degradation of the high-power performance. Judging from a minor difference in the particle size parameter (Dave or D50) between AC90 and AC120, the particle size distribution of AC was found to be more important in tuning the EDLC performances of highly porous ACs. It was confirmed that the appropriate pulverization of AC particles had potential to enhance the high-power performance of EDLC cells, both from the gravimetric and volumetric viewpoints.

Author Contributions

T.E. designed and performed the experiments, analyzed the results, and wrote the manuscript; Y.K. performed the experiments and analyzed the results; M.T. and D.T. analyzed the results and supervised this research; S.K. designed the experiments, analyzed the results, wrote the manuscript, and administrated this research project. All authors have read and agreed to the published version of the manuscript.

Funding

This work was in part supported by JSPS KAKENHI, under grant number JP19H02121.

Acknowledgments

We would like to thank Makoto Yamaguchi of Akita University for his help with the Raman spectroscopy.

Conflicts of Interest

The authors declare no conflict of interest.

References

  1. Zou, C.; Zhang, L.; Hu, X.; Wang, Z.; Wik, T.; Pecht, M. A review of fractional-order techniques applied to lithium-ion batteries, lead-acid batteries, and supercapacitors. J. Power Sources 2018, 390, 286–296. [Google Scholar] [CrossRef] [Green Version]
  2. Sakka, M.A.; Gualous, H.; Mierlo, J.V.; Culcu, H. Thermal modeling and heat management of supercapacitor modules for vehicle applications. J. Power Sources 2009, 194, 581–587. [Google Scholar] [CrossRef]
  3. Kurzweil, P.; Shamonin, M. State-of-charge monitoring by impedance spectroscopy during long-term self-discharge of supercapacitors and lithium-ion batteries. Batteries 2018, 4, 35. [Google Scholar] [CrossRef] [Green Version]
  4. Liu, C.F.; Liu, Y.C.; Yi, T.Y.; Hu, C.C. Carbon materials for high-voltage supercapacitors. Carbon 2019, 145, 529–548. [Google Scholar] [CrossRef]
  5. Mori, T.; Iwamura, S.; Ogino, I.; Mukai, S.R. Cost-effective synthesis of activated carbons with high surface areas for electrodes of non-aqueous electric double layer capacitors. Sep. Purif. Technol. 2019, 214, 174–180. [Google Scholar] [CrossRef]
  6. Huang, G.; Wang, Y.; Zhang, T.; Wu, X.; Cai, J. High-performance hierarchical N-doped porous carbons from hydrothermally carbonized bamboo shoot shells for symmetric supercapacitors. J. Taiwan Inst. Chem. Eng. 2019, 96, 672–680. [Google Scholar] [CrossRef]
  7. Zhu, Y.; Chen, M.; Zhang, Y.; Zhao, W.; Wang, C. A biomass-derived nitrogen-doped porous carbon for high-energy supercapacitor. Carbon 2018, 140, 404–412. [Google Scholar] [CrossRef]
  8. Sevilla, M.; Ferrero, G.A.; Diez, N.; Fuertes, A.B. One-step synthesis of ultra-high surface area nanoporous carbons and their application for electrochemical energy storage. Carbon 2018, 131, 193–200. [Google Scholar] [CrossRef] [Green Version]
  9. Gopiraman, M.; Deng, D.; Kim, B.S.; Chung, I.M.; Kim, I.S. Three-dimensional cheese-like carbon nanoarchitecture with tremendous surface area and pore construction derived from corn as superior electrode materials for supercapacitors. Appl. Surf. Sci. 2017, 409, 52–59. [Google Scholar] [CrossRef]
  10. Peng, L.; Liang, Y.; Dong, H.; Hu, H.; Zhao, X.; Cai, Y.; Xiao, Y.; Liu, Y.; Zheng, M. Super-hierarchical porous carbons derived from mixed biomass wastes by a stepwise removal strategy for high-performance supercapacitors. J. Power Sources 2018, 377, 151–160. [Google Scholar] [CrossRef]
  11. Pontiroli, D.; Scaravonati, S.; Magnani, G.; Fornasini, L.; Bersani, D.; Bertoni, G.; Milanese, C.; Girella, A.; Ridi, F.; Verucchi, R.; et al. Super-activated biochar from poultry litter for high-performance supercapacitors. Microporous Mesoporous Mater. 2019, 285, 161–169. [Google Scholar] [CrossRef]
  12. Zou, Z.; Liu, T.; Jiang, C. Highly mesoporous carbon flakes derived from a tubular biomass for high power electrochemical energy storage in organic electrolyte. Mater. Chem. Phys. 2019, 223, 16–23. [Google Scholar] [CrossRef]
  13. Gao, Y.; Li, L.; Jin, Y.; Wang, Y.; Yuan, C.; Wei, Y.; Chen, G.; Ge, J.; Lu, H. Porous carbon made from rice husk as electrode material for electrochemical double layer capacitor. Appl. Energy 2015, 153, 41–47. [Google Scholar] [CrossRef]
  14. Raymundo-Pinero, E.; Kierzek, K.; Machnikowski, J.; Béguin, F. Relationship between the nanoporous texture of activated carbons and their capacitance properties in different electrolytes. Carbon 2006, 44, 2498–2507. [Google Scholar] [CrossRef]
  15. Yang, I.; Kim, S.G.; Kwon, S.H.; Kim, M.S.; Jung, J.C. Relationships between pore size and charge transfer resistance of carbon aerogels for organic electric double-layer capacitor electrodes. Electrochim. Acta 2017, 223, 21–30. [Google Scholar] [CrossRef]
  16. Dong, X.L.; Lu, A.H.; Li, W.C. Highly microporous carbons derived from a complex of glutamic acid and zinc chloride for use in supercapacitors. J. Power Sources 2016, 327, 535–542. [Google Scholar] [CrossRef]
  17. Chmiola, J.; Yushin, G.; Gogotsi, Y.; Portet, C.; Simon, P.; Taberna, P.L. Anomalous increase in carbon capacitance at pore sizes less than 1 nanometer. Science 2006, 313, 1760–1763. [Google Scholar] [CrossRef] [PubMed] [Green Version]
  18. Simon, P.; Burke, A. Nanostructured carbons: Double-layer capacitance and more. Electrochem. Soc. Interface 2008, 17, 38–43. [Google Scholar]
  19. Yoshida, A.; Nonaka, S.; Aoki, I.; Nishino, A. Electric double-layer capacitors with sheet-type polarizable electrodes and application of the capacitors. J. Power Sources 1996, 60, 213–218. [Google Scholar] [CrossRef]
  20. Pandolfo, A.G.; Wilison, G.J.; Huynh, T.D.; Hollenkamp, A.F. The influence of conductive additives and inter-particle voids in carbon EDLC electrodes. Fuel Cells 2010, 5, 856–864. [Google Scholar] [CrossRef]
  21. Rennine, A.J.R.; Martins, V.L.; Smith, R.M.; Hall, P.J. Influence of particle size distribution on the performance of ionic liquid-based electrochemical double layer capacitors. Sci. Rep. 2016, 6, 22062. [Google Scholar] [CrossRef] [PubMed] [Green Version]
  22. Dyatkin, B.; Gogotsi, O.; Malinovskiy, B.; Zozulya, Y.; Simon, P.; Gogotsi, Y. High capacitance of coarse-grained carbide derived carbon electrodes. J. Power Sources 2016, 306, 32–41. [Google Scholar] [CrossRef] [Green Version]
  23. Kado, Y.; Imoto, K.; Soneda, Y.; Yoshizawa, N. Correlation between the pore structure and electrode density of MgO-templated carbons for electric double layer capacitor applications. J. Power Sources 2016, 305, 128–133. [Google Scholar] [CrossRef]
  24. Azaïs, P. Manufacturing of Industrial Supercapacitor. Supercapacitor Materials, Systems, and Applications; Béguin, F., Frackowiak, E., Eds.; Wiley-VCH Verlag GmbH & Co. KGaA: Weinheim, Germany, 2013; p. 320. [Google Scholar]
  25. Kado, Y.; Soneda, Y. Void-bearing electrodes with microporous activated carbon for electric double-layer capacitors. J. Electroanal. Chem. 2019, 833, 33–38. [Google Scholar] [CrossRef]
  26. Tanaka, S.; Nakao, H.; Mukai, T.; Katayama, Y.; Miyake, Y. An experimental investigation of the ion storage/transfer behavior in an electrical double-layer capacitor by using monodisperse carbon spheres with microporous structure. J. Phys. Chem. C 2012, 116, 26791–26799. [Google Scholar] [CrossRef]
  27. Nandhini, R.; Mini, P.A.; Avinash, B.; Nair, S.V.; Subramanian, K.R.V. Supercapacitor electrodes using nanoscale activated carbon from graphite by ball milling. Mater. Lett. 2012, 87, 165–168. [Google Scholar] [CrossRef]
  28. Xu, J.; Zhang, R.; Wang, J.; Ge, S.; Zhou, H.; Liu, Y.; Chen, P. Effective control of the microstructure of carbide-derived carbon by ball-milling the carbide precursor. Carbon 2013, 52, 499–508. [Google Scholar] [CrossRef]
  29. Welham, N.J.; Berbenni, V.; Chapman, P.G. Increased chemisorption onto activated carbon after ball-milling. Carbon 2002, 40, 2307–2315. [Google Scholar] [CrossRef]
  30. Choi, W.S.; Shim, W.G.; Ryu, D.W.; Hwang, M.J.; Moon, H. Effect of ball milling on electrochemical characteristics of walnut shell-based carbon electrodes for EDLCs. Microporous Mesoporous Mater. 2012, 155, 274–280. [Google Scholar] [CrossRef]
  31. Müller, B.R. Effect of particle size and surface area on the adsorption of albumin-bonded bilirubin on activated carbon. Carbon 2010, 48, 3607–3615. [Google Scholar] [CrossRef]
  32. Ong, T.S.; Yang, H. Effect of atmosphere on the mechanical milling of natural graphite. Carbon 2000, 38, 2077–2085. [Google Scholar] [CrossRef]
  33. Partlan, E.; Davis, K.; Ren, Y.; Aqul, O.G.; Mefford, O.T.; Karanfil, T.; Ladner, D.A. Effect of bead milling on chemical and physical characteristics of activated carbons pulverized to superfine sizes. Water Res. 2016, 89, 161–170. [Google Scholar] [CrossRef] [PubMed] [Green Version]
  34. Macías-García, A.; Torrejón-Martín, D.; Díaz-Díez, M.Á.; Carrasco-Amador, J.P. Study of the influence of particle size of activate carbon for the manufacture of electrodes for supercapacitors. J. Energy Storage 2019, 25, 100829. [Google Scholar] [CrossRef]
  35. Portet, C.; Yushin, G.; Gogotsi, Y. Effect of carbon particle size on electrochemical performance of EDLC. J. Electrochem. Soc. 2008, 155, 531–536. [Google Scholar] [CrossRef]
  36. Otowa, T.; Tanibata, R.; Itoh, M. Production and adsorption characteristics of MAXSORB: High-surface-area active carbon. Gas. Sep. Purif. 1993, 7, 241–245. [Google Scholar] [CrossRef]
  37. Katagiri, G.; Ishida, H.; Ishitani, A. Raman spectra of graphite edge planes. Carbon 1988, 26, 565–571. [Google Scholar] [CrossRef]
  38. Eckmann, A.; Felten, A.; Mishchenko, A.; Britnell, L.; Krupke, R.; Novoselov, K.S.; Casiraghi, C. Probing the nature of defects in graphene by Raman spectroscopy. Nano Lett. 2012, 12, 3925–3930. [Google Scholar] [CrossRef] [Green Version]
  39. Guizani, C.; Haddad, K.; Limousy, L.; Jeguirim, M. New insights on the structural evolution of biomass char upon pyrolysis as revealed by the Raman spectroscopy and elemental analysis. Carbon 2017, 119, 519–521. [Google Scholar] [CrossRef]
  40. Neimark, A.V.; Lin, Y.; Ravikovitch, P.I.; Thommes, M. Quenched solid density functional theory and pore size analysis of micro-mesoporous carbons. Carbon 2009, 47, 1617–1628. [Google Scholar] [CrossRef]
  41. Gor, G.Y.; Thommes, M.; Cychosz, K.A.; Neimark, A.V. Quenched solid density functional theory method for characterization of mesoporous carbons by nitrogen adsorption. Carbon 2012, 50, 1583–1590. [Google Scholar] [CrossRef]
  42. Piedboeuf, M.L.C.; Léonard, A.F.; Traina, K.; Job, N. Influence of the textural parameters of resorcinol–formaldehyde dry polymers and carbon xerogels on particle sizes upon mechanical milling. Colloids Surf. A Phys. Eng. Asp. 2015, 471, 124–132. [Google Scholar] [CrossRef]
  43. Li, Z.Q.; Lu, C.J.; Xia, Z.P.; Zhou, Y.; Luo, Z. X-ray diffraction patterns of graphite and turbostratic carbon. Carbon 2007, 45, 1686–1695. [Google Scholar] [CrossRef]
  44. Sathyaseelan, B.; Manikandan, E.; Baskaran, I.; Senthilnathan, K.; Sivakumar, K.; Moodley, M.K.; Ladchumananandasivam, R.; Maaza, M. Studies on structural and optical properties of ZrO2 nanopowder for opto-electronic applications. J. Alloys Compd. 2017, 694, 556–559. [Google Scholar] [CrossRef]
  45. Thommes, M.; Kaneko, K.; Neimark, A.V.; Olivier, J.P.; Rodriguez-Reinoso, F.; Rouquerol, J.; Sing, K.S.W. Physisorption of gases, with special reference to the evaluation of surface area and pore size distribution (IUPAC technical report). Pure Appl. Chem. 2015, 87, 1051–1069. [Google Scholar] [CrossRef] [Green Version]
  46. Jing, X.; Zhao, W.; Lan, L. The effect of particle size on electric conducting percolation threshold in polymer/conducting particle composites. J. Mater. Sci. Lett. 2000, 19, 377–379. [Google Scholar] [CrossRef]
Figure 1. XRD patterns and a relationship between the milling time and Id/Ig value for the milled activated carbons (ACs). (a) XRD patterns, (b) Id/Ig value with their Raman spectra.
Batteries 06 00022 g001
Figure 2. Nitrogen adsorption–desorption isotherms of the milled ACs at −196 °C and their pore size distributions. (a) Nitrogen adsorption–desorption isotherms; (b) pore size distributions.
Batteries 06 00022 g002
Figure 3. Surface morphology of the electric double-layer capacitor (EDLC) electrodes using the milled ACs and their particle size distributions. (a) AC0; (b) ACS10; (c) AC10; (d) AC90, (e) AC120.
Batteries 06 00022 g003
Figure 4. Cumulative pore volumes of the disk EDLC electrodes using the milled ACs, obtained by mercury intrusion porosimetry.
Batteries 06 00022 g004
Figure 5. Cyclic voltammetry (CV) curves of EDLC cells using the milled ACs at the scan rates of (a) 1, (b) 10, and (c) 100 mV s−1.
Batteries 06 00022 g005
Figure 6. Specific capacity of milled ACs vs. cell voltage in the GCD rate tests at different current densities. The specific capacity is a time-integral of the current divided by the total mass of AC active material both in the positive and negative electrodes. (a) AC0; (b) ACS10; (c) AC10; (d) AC90; (e) AC120.
Batteries 06 00022 g006
Figure 7. Gravimetric and volumetric specific capacitances of the milled ACs at different current densities and their Ragone plots. (a) Gravimetric specific capacitance; (b) gravimetric Ragone plot; (c) volumetric specific capacitance; (d) volumetric Ragone plot.
Batteries 06 00022 g007
Figure 8. Cyclic stability of the specific capacitance of the milled ACs at the current density of 10 mA cm−2 under the cell voltage range of 0–2.5 V.
Batteries 06 00022 g008
Table 1. Conditions for the galvanostatic charge–discharge (GCD) rate tests.
SequenceCurrent Density 1
(mA cm−2)
Number of CyclesCycle Selected for the Performance Evaluation
10.12Second
20.22Second
30.52Second
41.05Third
52.05Third
65.05Third
71011Sixth
82011Sixth
95011Sixth
1010025Thirteenth
1 Electrode area is 1.13 cm2 (ϕ12 mm).
Table 2. Textural properties of the milled ACs.
Sample NameSBET (m2 g−1)Vtotal (cm3 g−1)Vmicro (cm3 g−1)Vmeso (cm3 g−1)
AC031981.781.270.38
ACS1030731.731.230.37
AC1030411.721.220.37
AC9027551.561.090.34
AC12024481.360.960.28
Table 3. Particle properties of the milled ACs.
Sample NameDave (µm)D25 (µm)D50 (µm)D75 (µm)
AC074.942.570.7135.1
ACS1020.010.626.137.5
AC1011.66.811.719.7
AC903.01.92.84.2
AC1202.21.62.43.3
Table 4. Details of the fabricated electrodes (ϕ12 mm).
Used ACMass of AC in the Electrode (mg)Thickness of the Electrode (mm)AC Bulk Density in the Electrode (g cm−3)
AC011.70.320.32
ACS1010.80.300.32
AC1010.60.300.31
AC9012.10.310.34
AC12012.90.290.39
Table 5. Equivalent series resistances (ESRs) of the milled ACs at the switching of charge to discharge during the GCD rate tests. Unit: Ω.
Current Density (mA cm−2)AC0ACS10AC10AC90AC120
0.146.447.846.146.7141.7
119.115.319.615.2108.0
516.416.216.812.796.8
1013.814.314.111.973.9
5013.314.013.712.5NM 1
10012.513.813.512.6NM 1
1 Not measurable.

