1. Introduction
Changes in working temperature of lithium-ion batteries effect electrochemical reactions. This causes different regions of the battery cell to experience different electrochemical reaction rates. Temperature homogeneity is a new demand in design of thermal management systems for electric vehicle batteries. Lithium-ion batteries have the ability to emerge as an important part of future power demands, including electric vehicles [
1]. When unaccompanied by an efficacious cooling system, the temperature of a lithium-ion battery increases attributable to heat collection. This might cause thermal runaway in the entire battery [
2,
3].
Prevailing water-cooling and air-cooling approaches have been employed to solve the thermal management issue of lithium-ion batteries [
4,
5,
6]. Mohammadian proposed a specific type of pin fin heat sink for thermal management of lithium-ion battery packs [
7]. Three-dimensional transient thermal analysis of an air-cooled module was investigated. The effects of various pin fin configurations, inlet airflow temperatures, inlet airflow velocities, and discharge rates on the efficiency of the battery were studied. It was concluded that employing this kind of fin heat sink in comparison to a heat sink deprived of fins, not only reduces the bulk temperature inside the battery, but also reduces the alteration of the temperature field [
7].
Different experiments were performed on a power type lithium manganese oxide/graphite battery under various conditions. In addition, a lumped battery heat transfer model was developed [
8]. The parameters for reaction heat and Joule heat were determined. The reaction heat and Joule heat accompanied by total heat generation rate was investigated acknowledging the influence of aging temperature, state-of-charge, and current. It was concluded that the experimental results demonstrated good agreement with approximated temperature alteration, under different aging conditions and currents [
8].
The working temperature of lithium-ion batteries is a significant factor which effects the performance of electric vehicles. Notwithstanding, in big working temperatures, lithium-ion battery suffers from aging and safety issues [
9,
10]. Notwithstanding, during application, lithium-ion battery cells are inclined to self-heat owing to the influences of internal resistance [
9,
10].
A battery pack passive thermal management system was experimentally studied [
11]. It was developed and designed by employing a phase change composite material. It was seen that the effect of a rise in thickness of phase change material on temperature of the battery pack is negligible in higher thickness. In addition, the outcomes demonstrate that the temperature gradient is remarkably lesser with phase change composite material in comparison with the case which has no liquid cooling [
11].
A lithium-ion battery pack, which was cooled by a paraffin composite phase change material, was fabricated and designed [
12]. The influence of the composite phase change material on temperature of the battery pack was studied by using discharge tests and it was compared with copper foam composite phase change material, pure paraffin, and natural air-cooling. In addition, a non-thermal equilibrium model was designed by employing the enthalpy procedure. The experimental data demonstrate well agreement with the numerical results, which validate the precision of the numerical model [
12].
A passive thermal management system was investigated for high-energy lithium-ion battery pack applications in abusive or stressful situations [
13]. This was compared with a completely air-cooling method under abuse and normal situations. This investigation demonstrated how phase change material with passive cooling contributes to stopping the transmission of thermal runaway in adjacent cells or a single cell owing to a battery cell catastrophic failure [
13].
The thermal performance of air-cooling with axial flow was investigated for a lithium-ion battery pack [
14]. In addition, a thermal model for a battery pack was numerically solved by considering the fluid governing equations. The outcomes demonstrated that raising the radial interval causes a low average temperature to increase, however it contributes to the temperature homogeneity of the battery pack [
14].
A combined cooling procedure, which integrated the forced internal gas-cooling circle and a liquid cooling plate, was investigated in order to overcome the thermal problem for lithium-ion space battery cells [
15]. Numerical investigations were accomplished by using the computational fluid dynamics procedure. The numerical outcomes indicated that this new thermal management procedure improved the reliability and performance of the space battery system [
15].
In designing all types of thermal management systems, first it is necessary to understand the thermal behavior of the battery, especially the temperature distribution in the absence of a thermal management system, such as heat transfer by means of natural air displacement. This may indicate more sensitive areas of the battery surface, which require more cooling. In this regard, for finding the temperature distribution on the battery surface and understanding the thermal behavior of the battery cell, some experimental and numerical work was done [
16,
17,
18,
19,
20,
21,
22,
23,
24].
Prior investigations have seldom studied the configuration of cooling conduits and the majority of conduit arrangements was direct alongside flow direction. In this investigation, the thermal behavior of a liquid cooling lithium-ion battery cell was studied through simulation. In addition, the three-dimensional CFD (computational fluid dynamic) model of the cooling system was demonstrated concerning decreasing the highest temperature and temperature variation of the cooling system for the lithium-ion battery cell. The purpose of this investigation is to present a design approach of liquid cooling for the lithium-ion battery cell by including different conditions such as constructional parameters of the cooling system.
2. Methodology
In this investigation cold plate including several internal conduits in identical size as the lithium-ion battery cell were located between every two battery cells. The heat, which was generated from the battery cell, was relocated into the cold plate via conduction heat transfer and through contact surface between the battery cell and cold plate. The coolant fluid inside the cooling conduit transfers away the heat.
With the intention of studying the cooling factors of the arrangement, chiefly geometric parameters were considered. The effect of different parameters, such as cooling direction and conduit number distribution was studied. In addition, the parameters of cooling condition, including flow rate of coolant fluid for the modeling were investigated.
In this research, the cold plate and the lithium-ion battery cell were supposed to be isotropic and homogenous for numerical simplicity. The cooling fluid was assumed to be incompressible. Pressure outlet and velocity inlet were selected as the outlet and inlet boundary conditions. The analysis parameters, which were used in this investigation, are given in
Table 1.
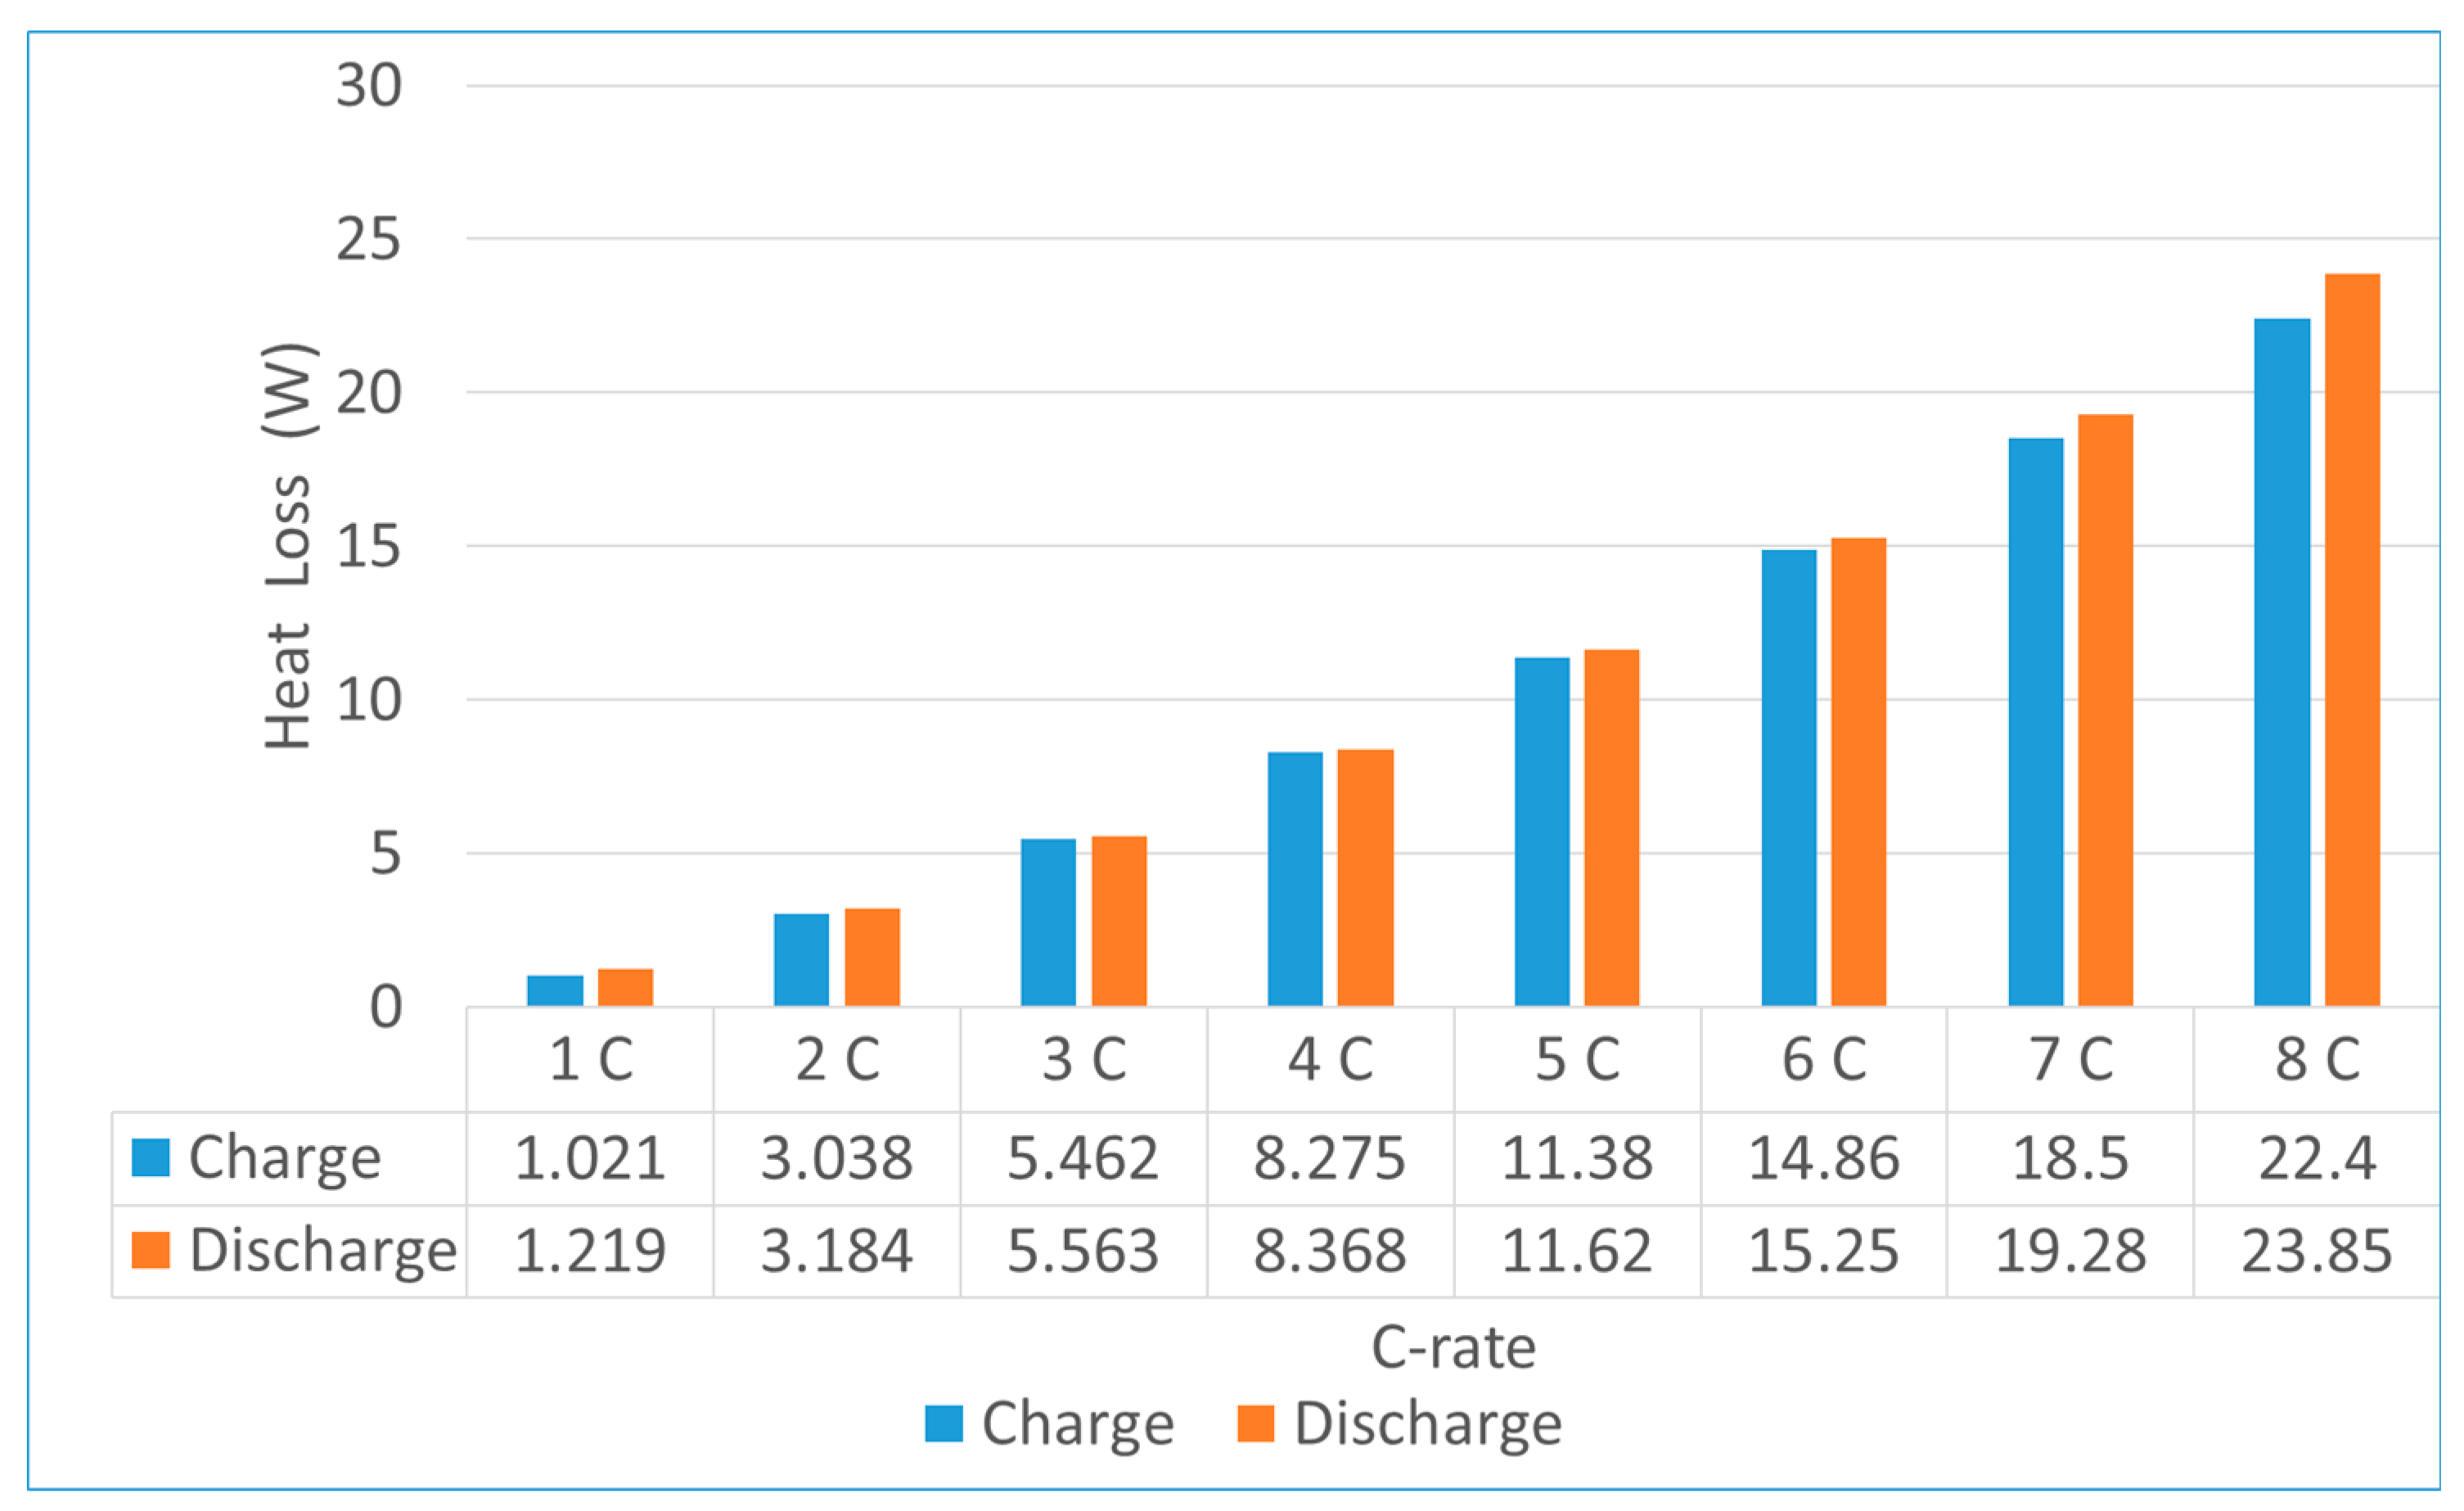
The effect of interface thermal resistance between the cold plate and lithium-ion battery cell was disregarded in this investigation. Accordingly, another surface of the battery cell was considered as natural convection with the heat transfer coefficient equal to 5 W·m
−2·C
−1. The battery cell heat loss as a function of C-rates is shown in
Figure 1. The volumetric heat source of the investigated lithium-ion battery cell was considered 118,070 W·m
−3 at 8 C discharge rate as attested by isothermal battery calorimetry experiments [
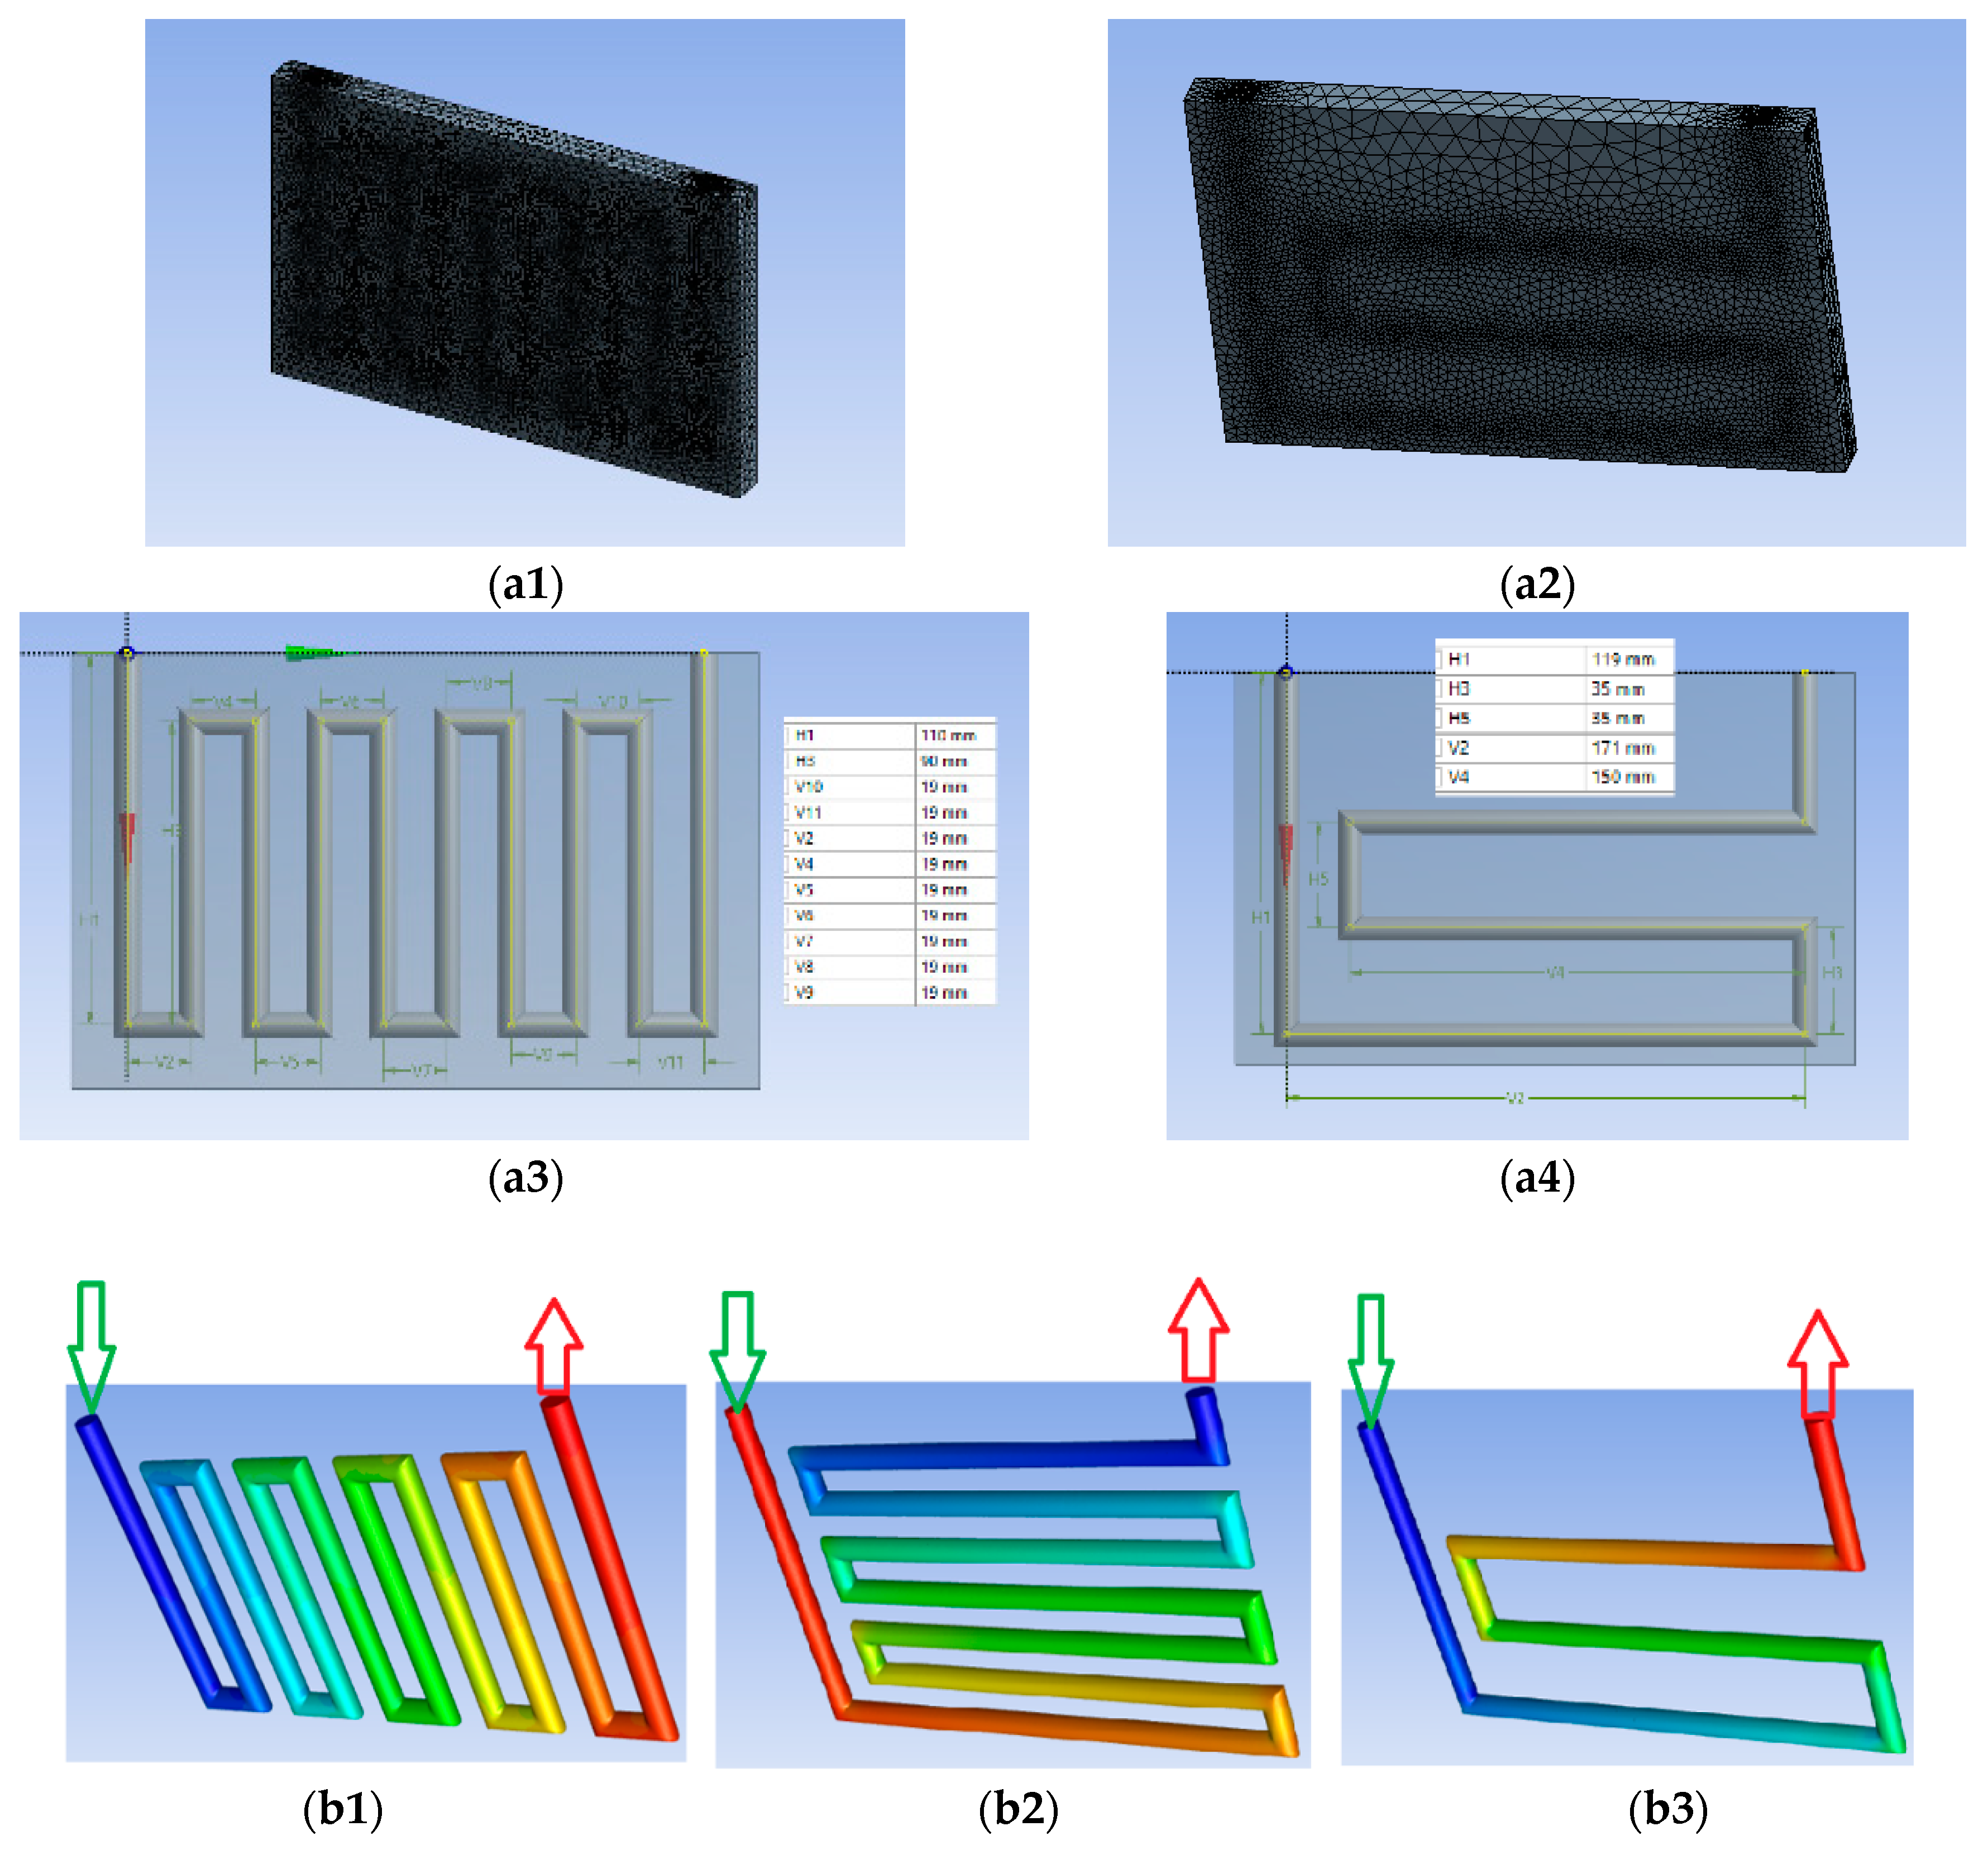
21]. Tetrahedrons mesh grid was adopted. The meshing representation of cold plate and corresponding dimensions are illustrated in
Figure 2. The green arrows demonstrate the flow entering, and the red arrows demonstrate the flow exiting.
3. Numerical Analysis
Liquid water was used as a cooling material in this investigation. The mathematical statement of energy conservation for the liquid water within the confines of the cold plate conduits is:
where
: Density of liquid water;
: Heat capacity of liquid water;
: Temperature of liquid water;
: Velocity vector of liquid water;
: Thermal conductivity of liquid water.
The mathematical statement of energy conservation for the lithium-ion battery is given as follows:
: Average density of the battery;
: Average specific heat;
: Temperature of the battery;
: Thermal conductivity along the width direction;
: Thermal conductivity along the depth direction;
: Thermal conductivity along the height direction;
: Volumetric heat generation rate over the entire battery cell.
4. Result and Discussion
Important parameters were observed and collected throughout the simulation, including temperature distribution on the cold plate surface, the highest and lowest temperature on the heat flux surface, and pressure reduction among outlet and inlet surfaces. Temperature divergence indicates the temperature homogeneity in battery cells. The highest temperature could demonstrate the greatest intense working situation of the battery cell. There are two important parameters, which lead to increases in interior friction among the conduit and cooling fluid: First is the flowing length of the coolant liquid in the conduit. Second is moving through intersections and curvatures in the conduit, because changing the flow orientation leads to velocity reduction of the coolant fluid.
4.1. Pressure Distribution
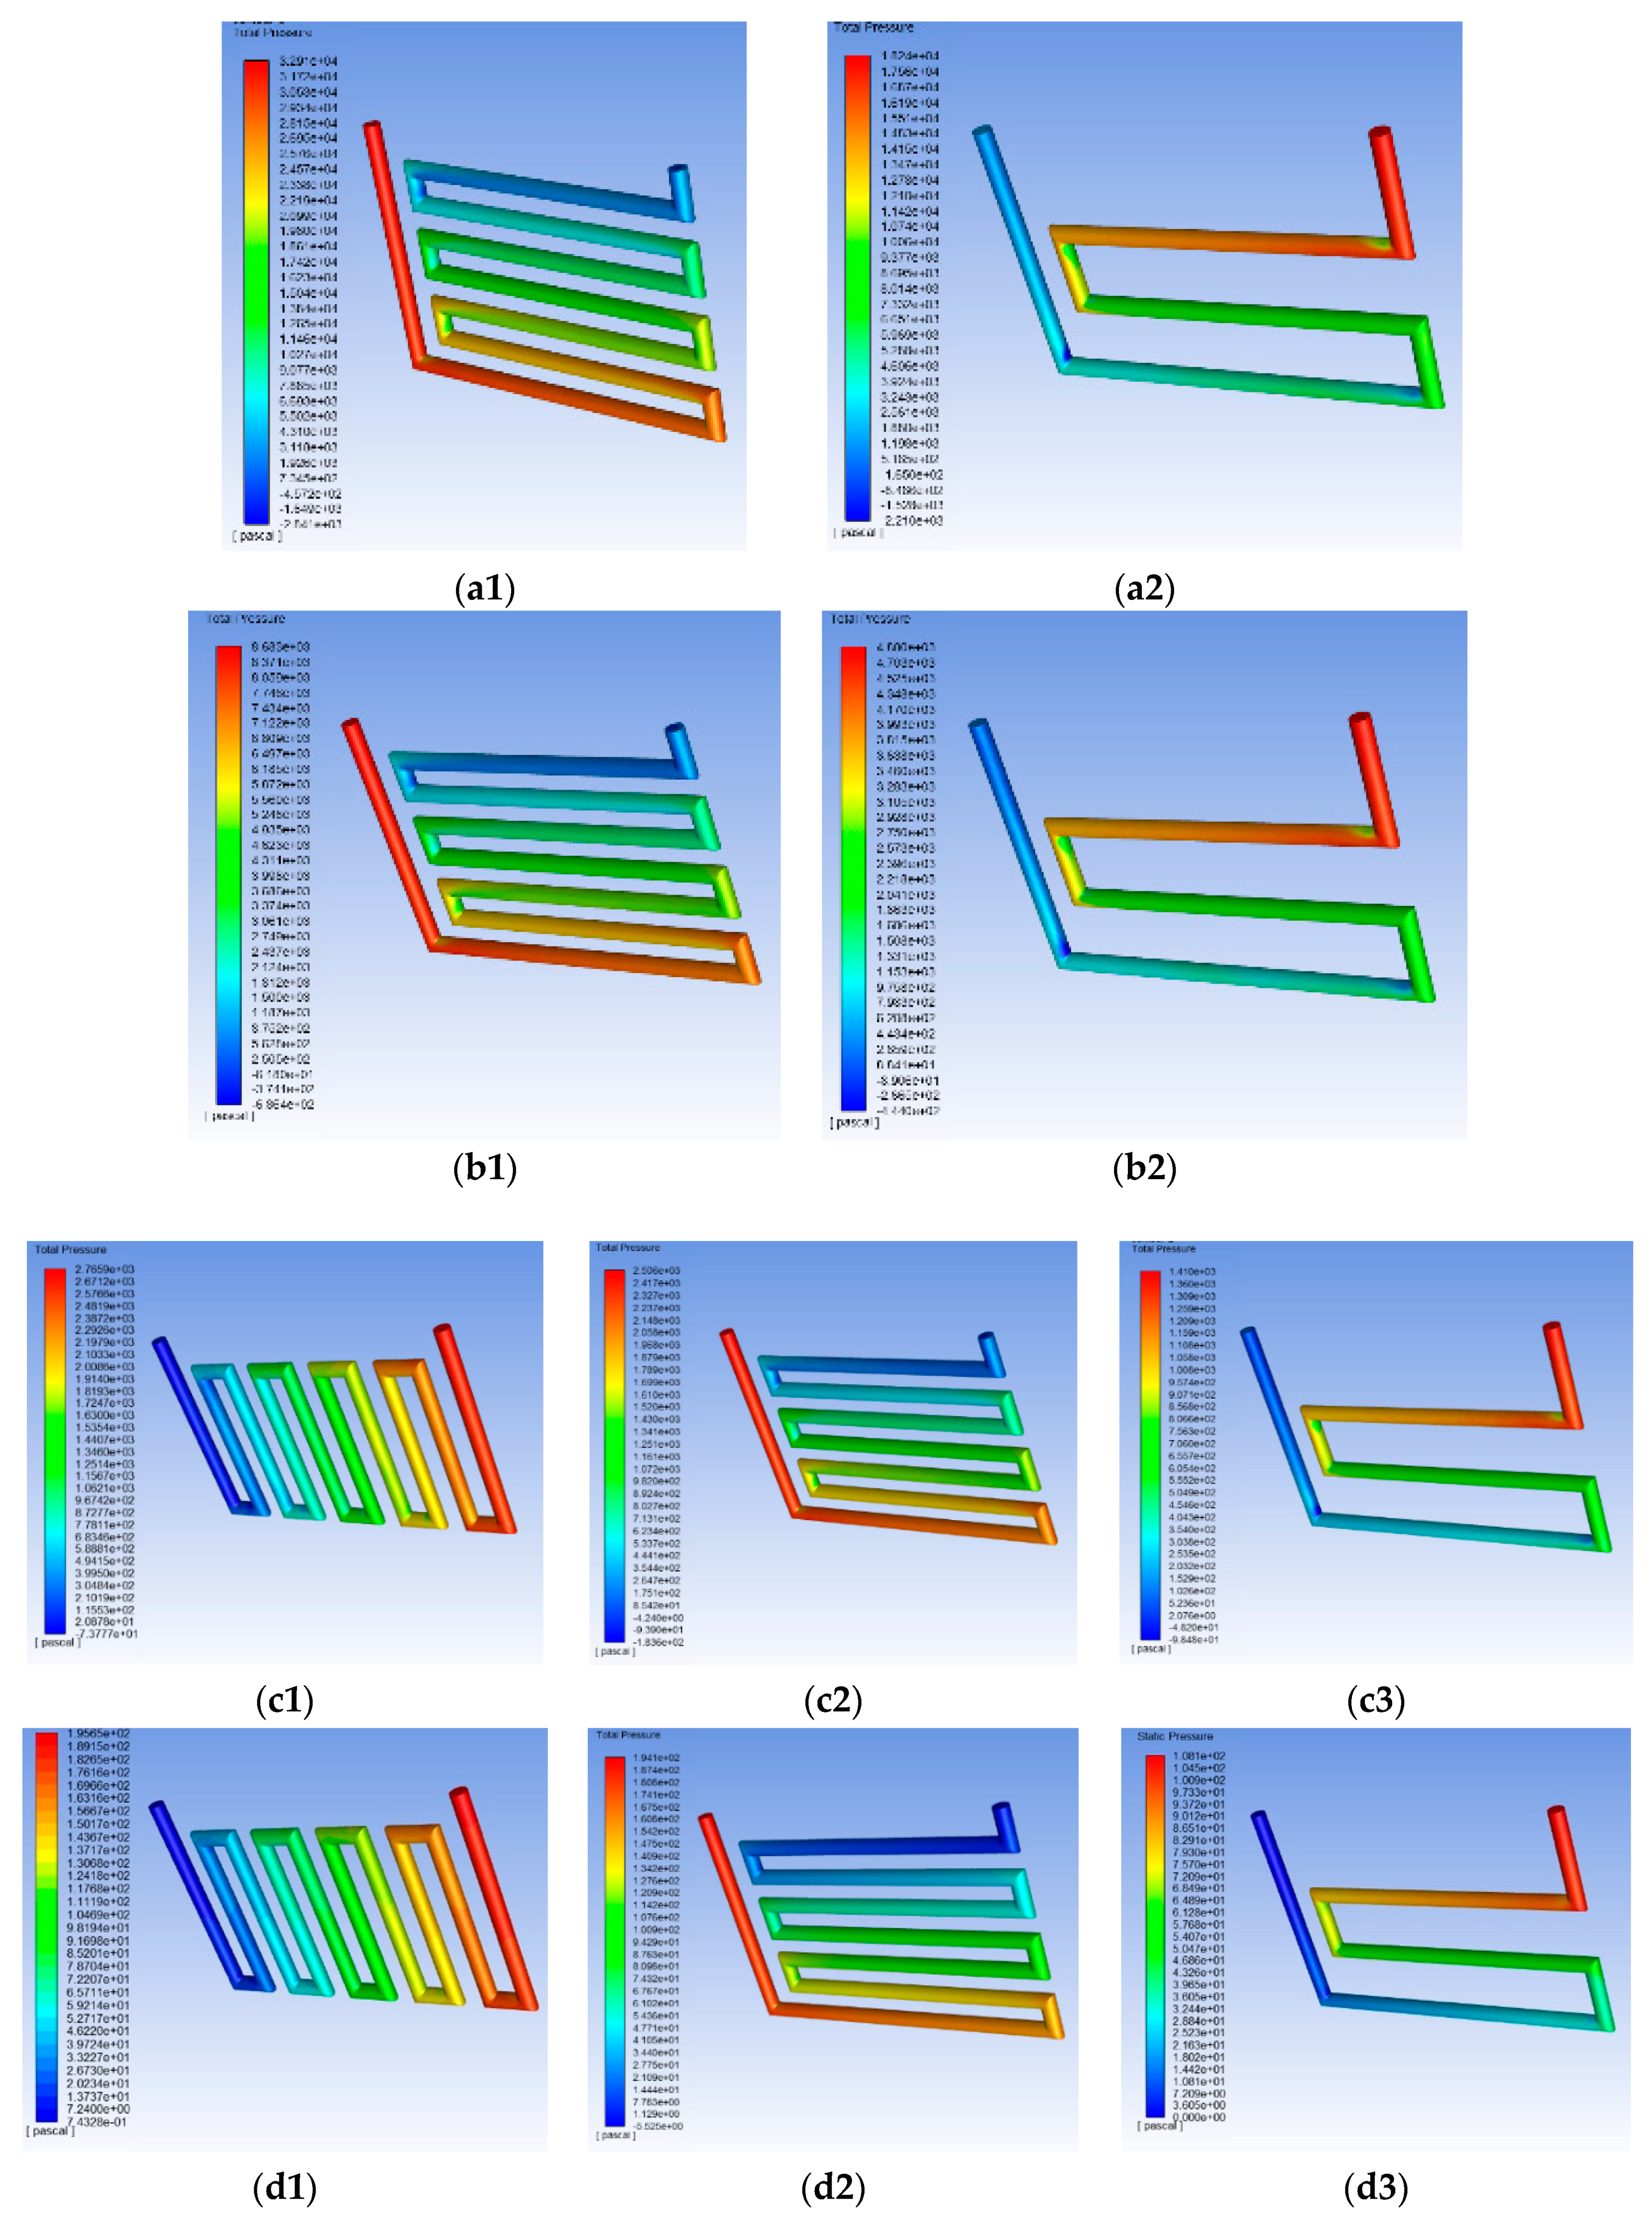
Frictional forces, caused by the resistance to flow, act on a fluid as it flows through the tube. In other words, when the cooling liquid flows through the pipe, frictional forces act as flow resistance. Pressure reduction determines the pump energy, which is required to overcome frictional forces between the cooling liquid and walls. Pressure distribution for different entrance velocity is illustrated in
Figure 3.
The flow resistance is in proportion to contact area among the conduit and coolant fluid. When the coolant fluid moves across the conduit, the contact area among the coolant fluid and the conduit rises incessantly. This causes a fast decrease in the pressure drop. Following the movement of the coolant fluid through the entire conduit, the pressure decline of the coolant fluid in the conduit attains stability. Notwithstanding, the altered orientation of the pressure drop amount is different.
The relative pressure in the conduit is zero when it is empty of cooling liquid.
The pressure at the entrance of the conduit is comparatively big while the coolant fluid moves into the entry of the cooling conduit. Consequently, the pressure drop increases suddenly to the utmost when the coolant fluid moves into the conduit during the course of minute.
The pressure distribution of the conduit is displayed in
Figure 3. The pressure reduction and pressure distribution for every conduit were identical, representing excellent stream consistency. The pressure reduction of the cooling plate varies according to the number of conduits and velocity.
Since the pressure decline is proportional to the needed pumping power, a trade-off should be made between energy consumption and cooling of the battery cell. In some cases, the flow rate could be raised to greater improve the thermal management effectiveness.
While the quantity of conduit number reaches a specified amount, pressure reduction among the entrance and exit of cooling conduits and the flowing resistance attain the largest amount. This causes less efficiency of convective heat transfer for the plate. For entrance velocity of 0.1 m/s, the maximum pressure decline following 8 C discharge for 8 and 4 conduits design is 1.9 and 1 Pascal, correspondingly.
Figure 3 illustrates the pressure decline for the coolant fluid of the cold plate with changing the flow rates and the number of conduits. As illustrated in
Figure 3, the quantity of conduits is changed from 4 to 10 and the velocity is changed from 0.1 to 2 m/s. The pressure decline enhanced by 97% while the quantity of conduits increased from 4 to 10 when the entry velocity was 0.5 m/s. The pressure reduction raised by 1196%, 1188%, and 1315% while the velocity of the coolant increased from 0.1 to 0.5 m/s for conduits quantity equal to 4, 8, and 10, correspondingly.
4.2. Influence of Conduit Numbers and Distribution
Lithium-ion batteries, which are in the central part of the battery pack, are exposed to more heat accumulation attributable to small contact area with the exterior outside space. In these lithium-ion batteries, the heat transfer is bad, and the temperature is larger. Notwithstanding, the outside two lithium-ion batteries have big contact area with the environment and acceptable heat loss conditions, consequently the temperature is lesser. Accordingly, for designing the conduit arrangement in the battery pack, the quantity of conduits in the central of the battery pack module could be further considered, and subsequently diminishes to both ends successively.
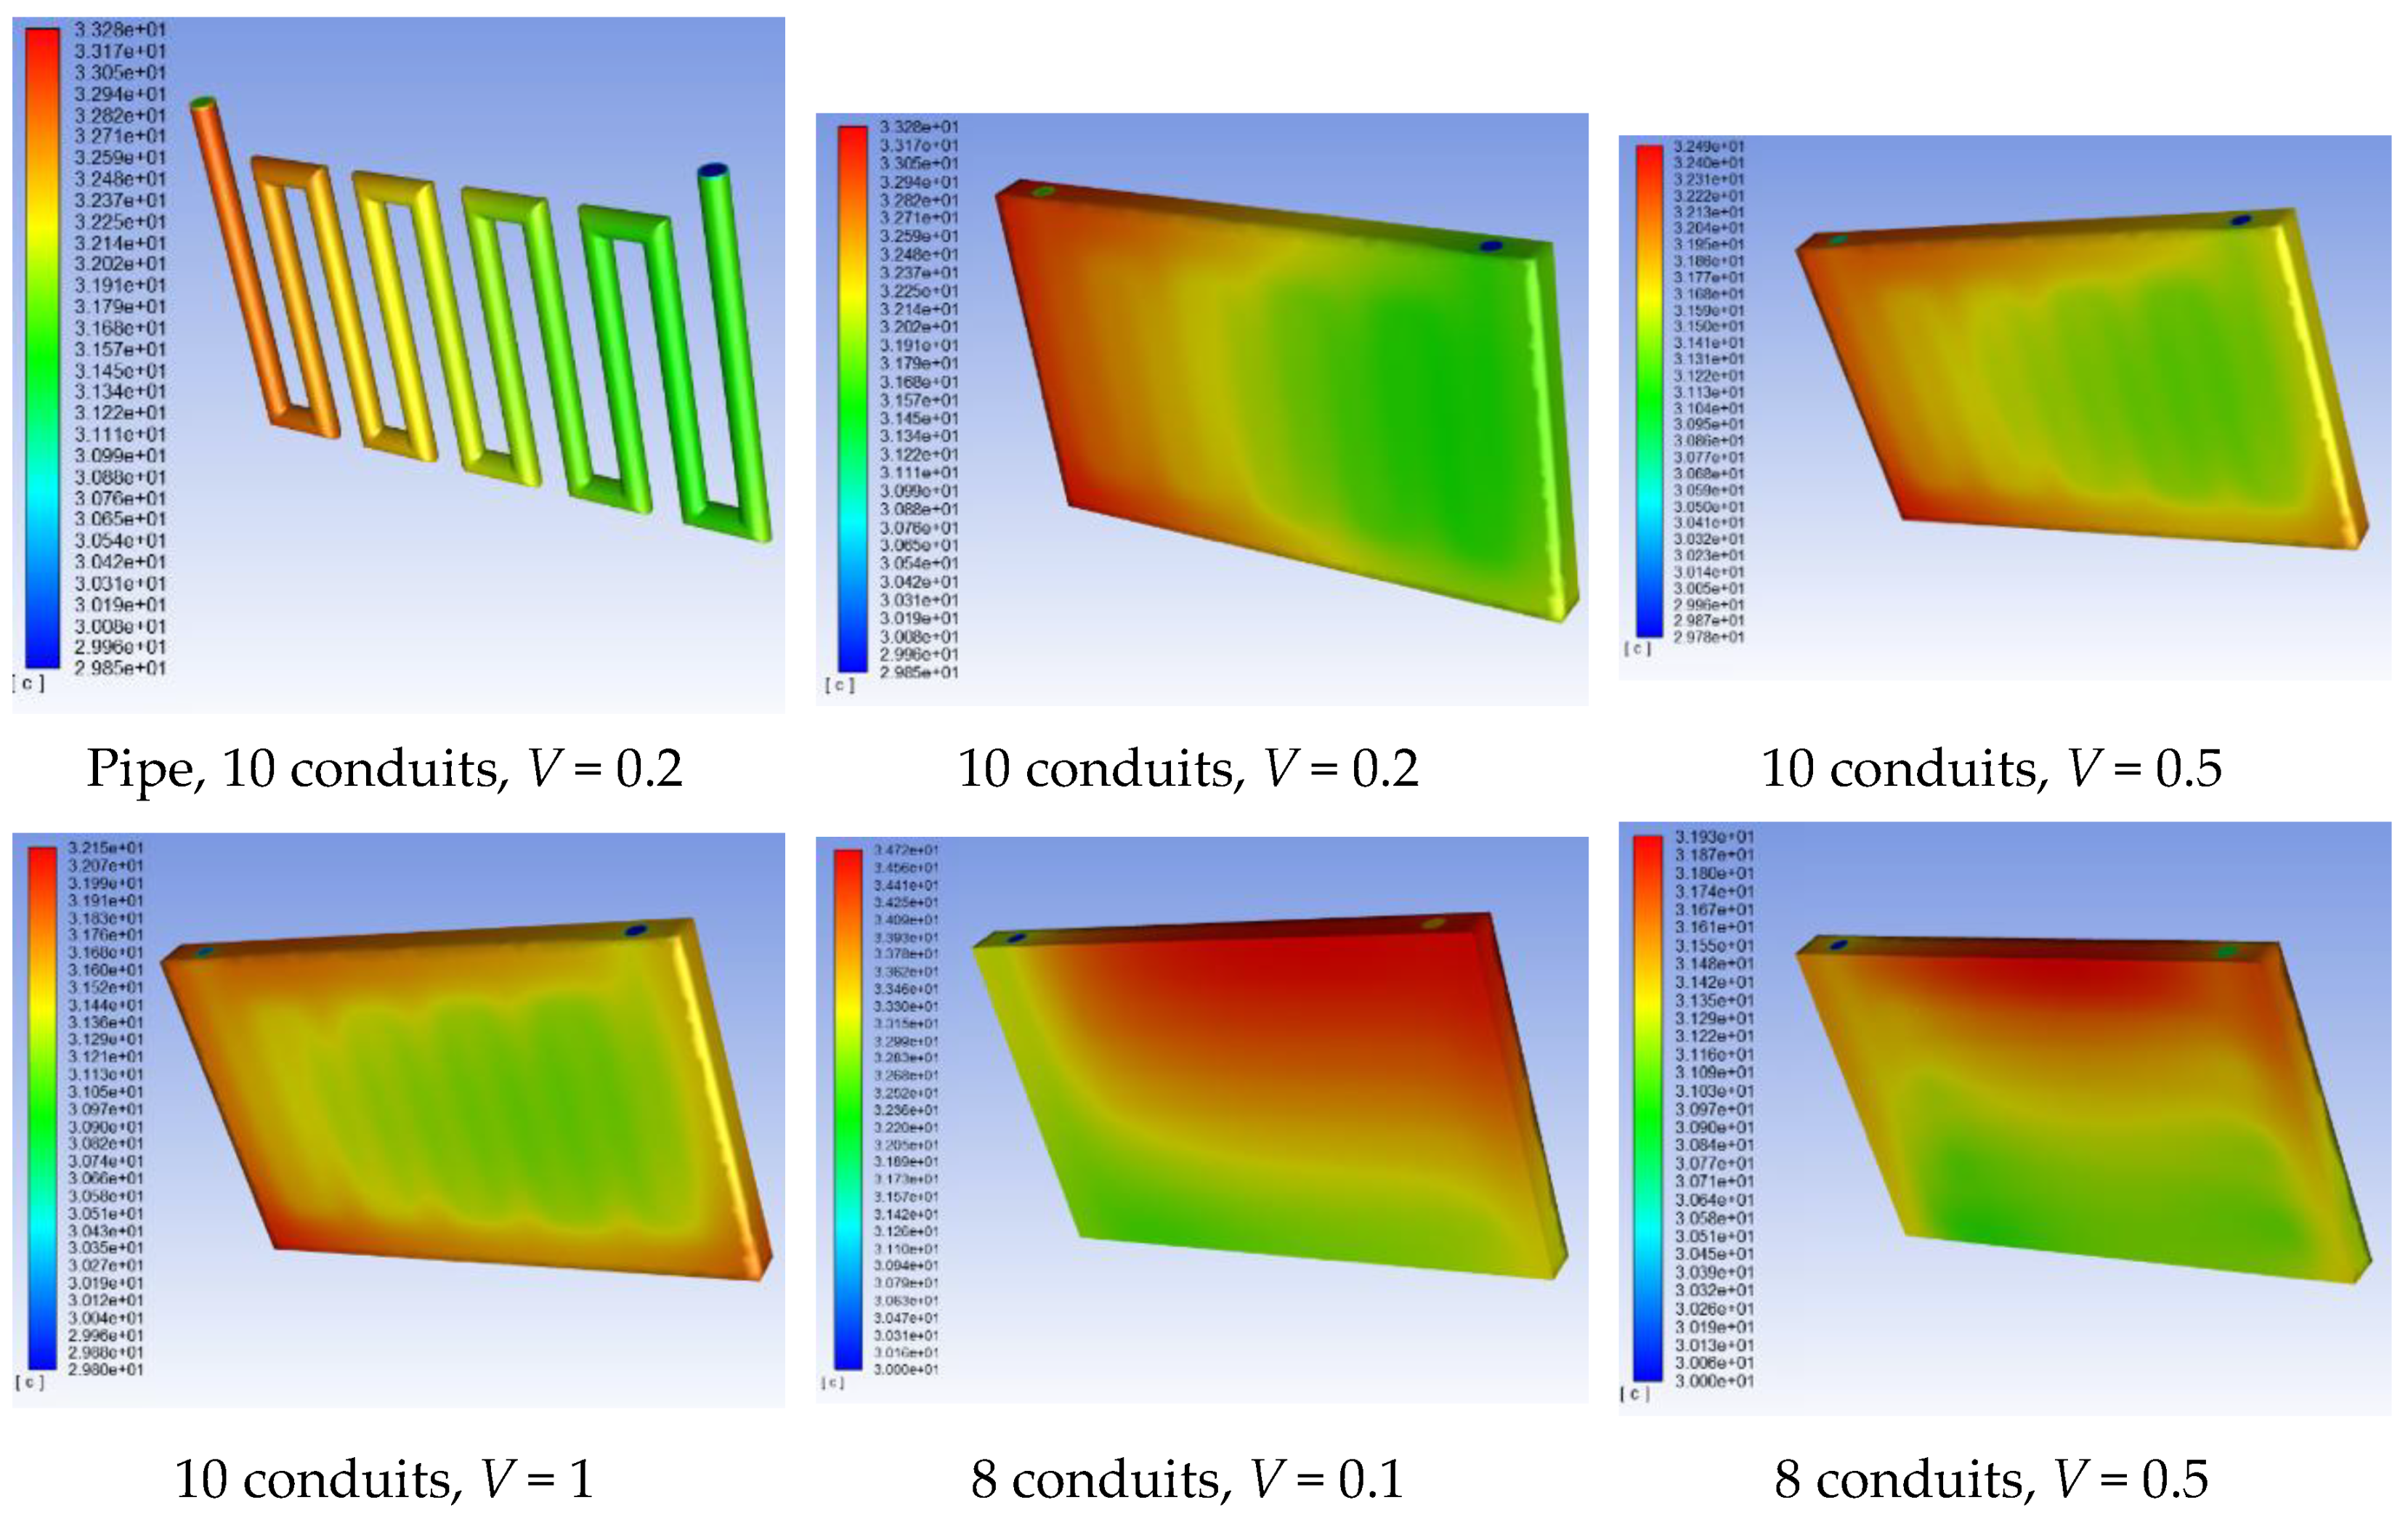
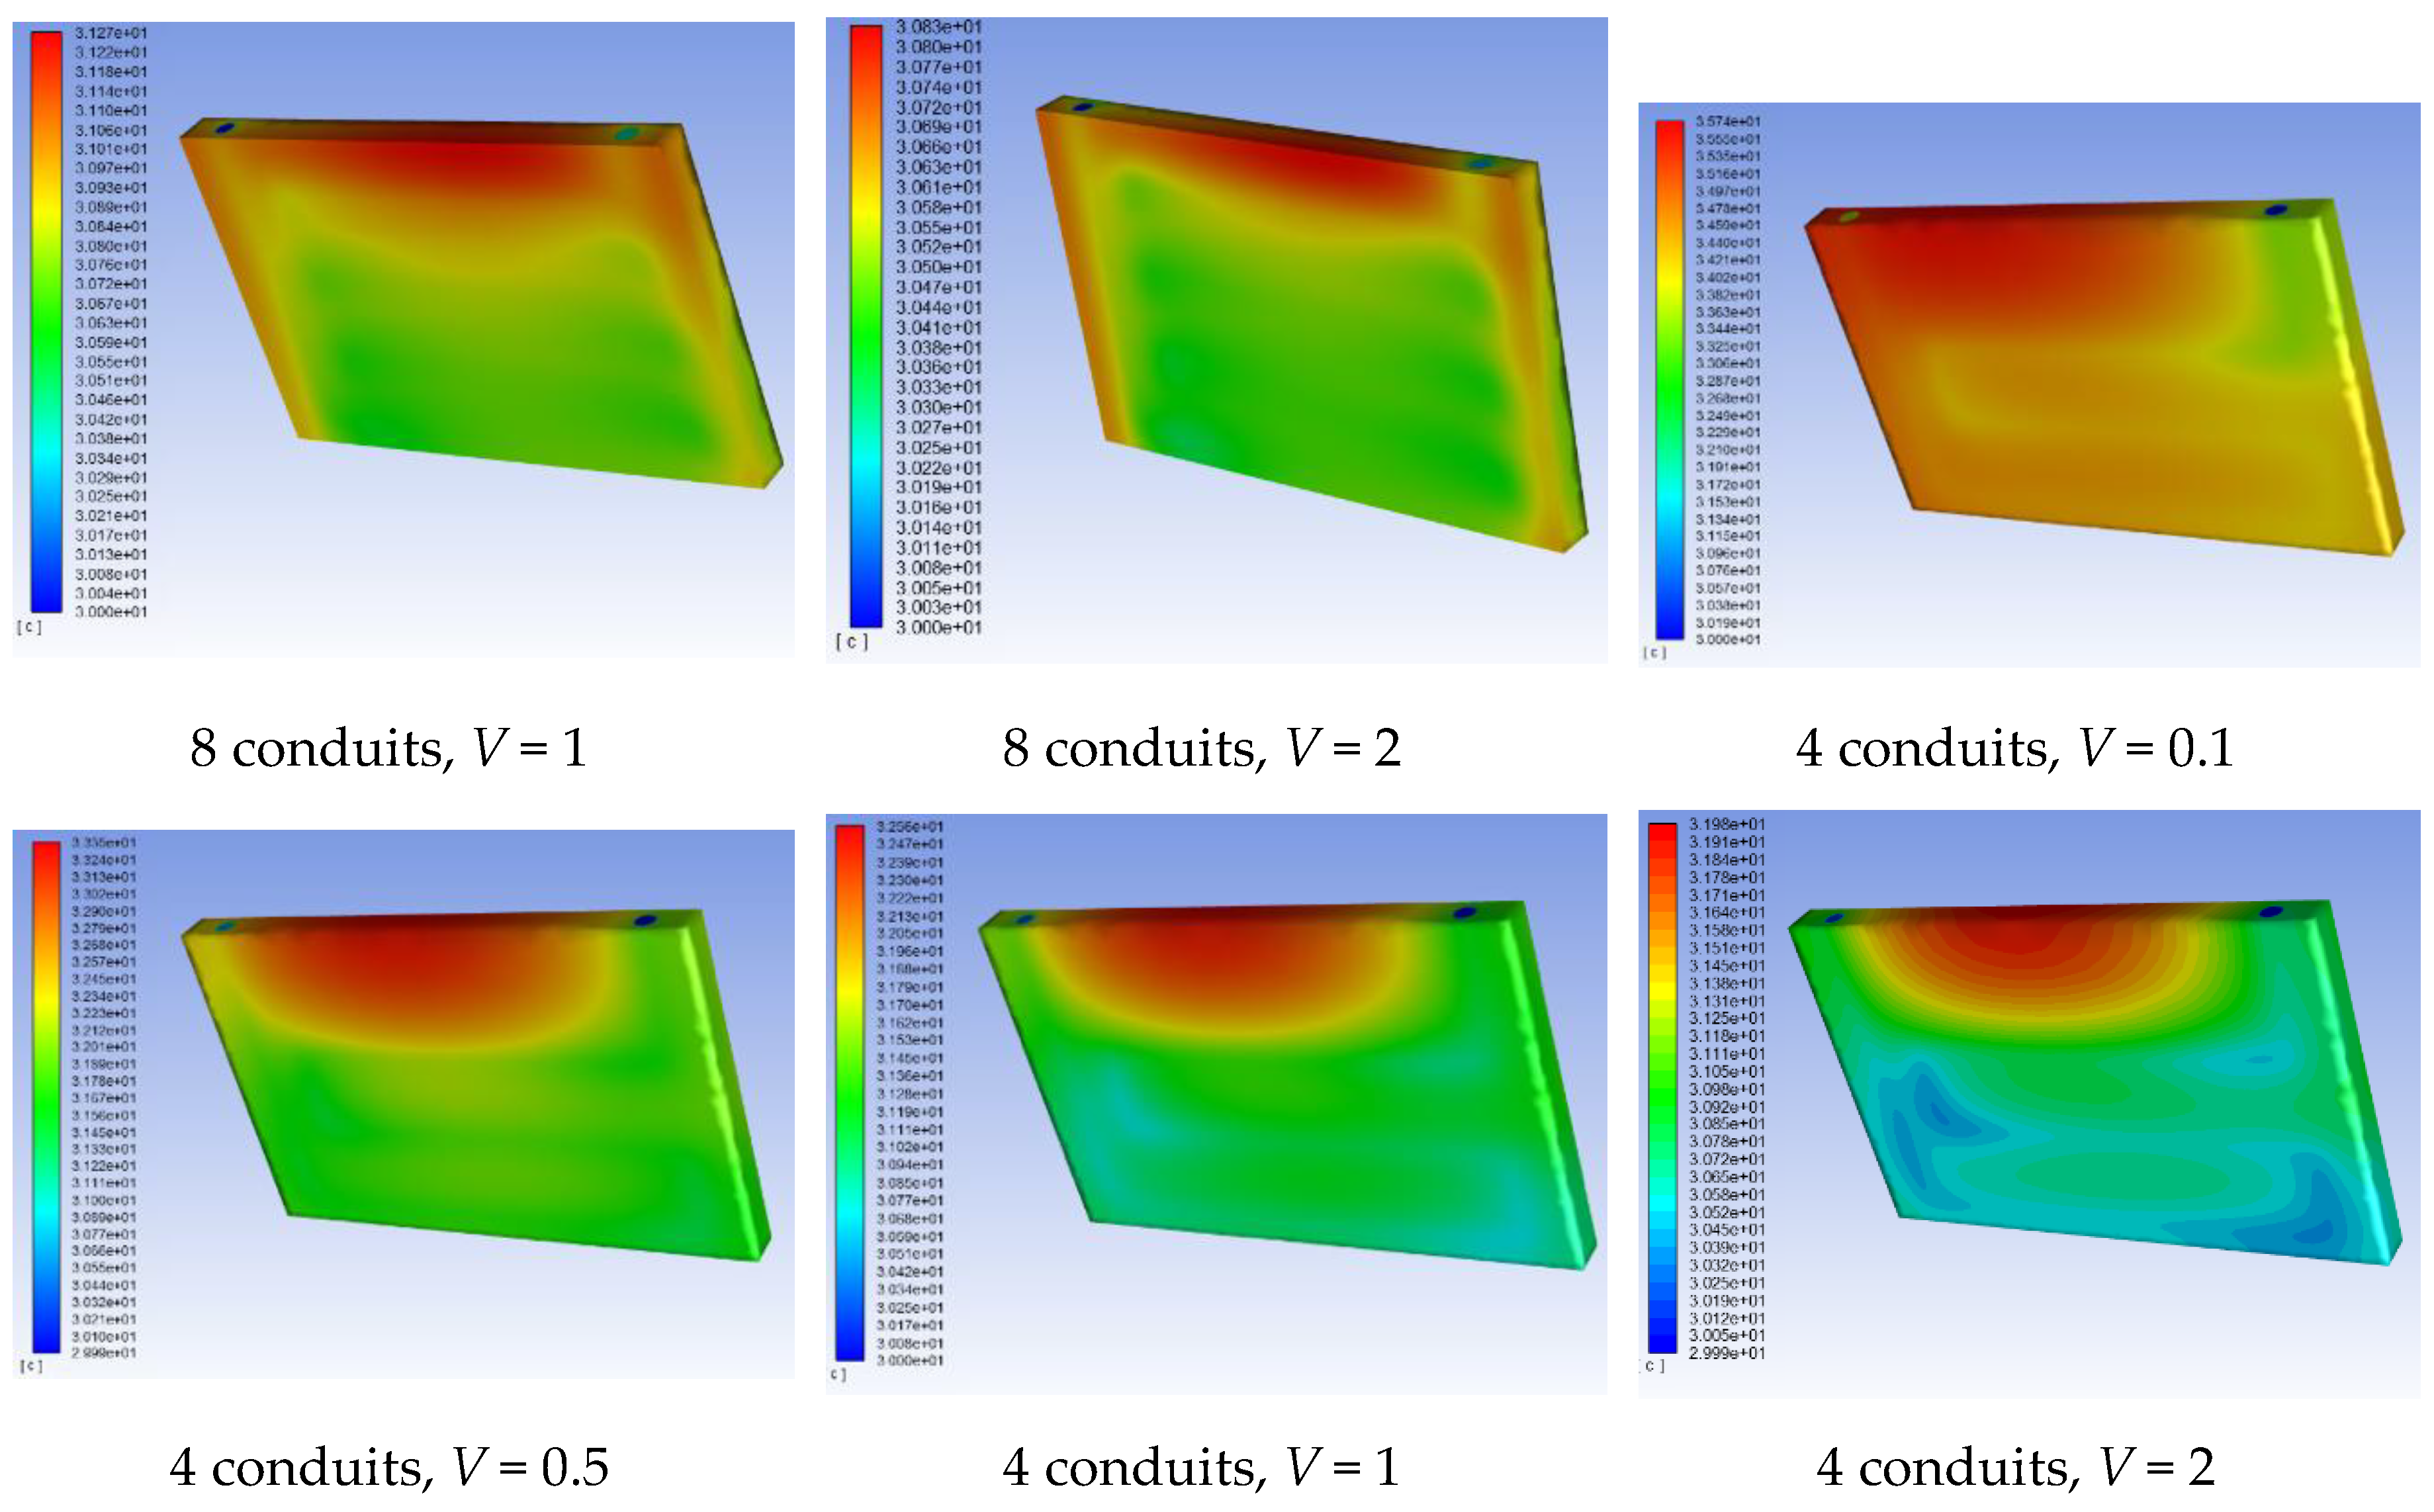
For the purpose of investigating the impact of conduit numbers on cooling performance, different values were considered for the numbers of conduits. The cooling conduits were distributed alongside the length and width orientation of the cold plate, correspondingly. The temperature distributions for dissimilar arrangements with several conduits are illustrated in
Figure 4.
By increasing the number of conduits, two important changes are seen. Firstly, the areas with low temperatures enlarge. Secondly, the greatest temperature declines moderately simultaneously. It can be seen that the amount of divergence of temperature and greatest temperature becomes less; nevertheless, the pressure decline increases by the rise of duct numbers.
The temperature profile on the cooling surface for 10 conduits and for different entrance velocity is shown in
Figure 4. The minimum temperature on the surface of the cold plate is near the entrance end; at the same time the maximum temperature is at the corners of the cold plate nearby the exit end, accompanied by a temperature discrepancy of about 3.28 °C, 2.49 °C, and 2.15 °C for entrance velocity of 0.2 m/s, 0.5 m/s, and 1 m/s, correspondingly. These temperature discrepancies for eight conduits are 4.7 °C, 1.9 °C, 1.2 °C, and 0.8 °C for entrance velocity of 0.1 m/s, 0.5 m/s, 1 m/s, and 2 m/s, correspondingly.
It can be noted that by increasing the duct numbers, the coolant fluid removes more heat. In addition, more homogeneous temperature distribution is achieved. The length of the conduit gets larger along with the rise of conduit numbers. This causes a larger pressure decline among the outlet and entry of the cooling fluid conduit. Consequently, the pump with greater power is required to provide the pressure decline to carry the coolant fluid.
The temperature diminishes moderately along with the enhancement of conduit numbers. By increasing conduit number, the heat transfer between the flowing conduit and coolant fluid increases. This leads to an increase in the cooling capacity of the plate. In all cases, the surface temperature of the cold plate progressively enhanced from entrance end to exit end. The highest temperature variation was lower than 6 °C.
4.3. Effect of Conduit Distribution
The temperature distribution of the surface for 8C discharging is illustrated in
Figure 4. In addition, the highest temperature of the surface with different conduit quantity distribution for 8 C discharging is illustrated in
Figure 4. The outcomes demonstrate that while the quantity of conduits is 10, 8, and 4, the highest temperature after 8C discharging gets to 33.28 °C, 34.7 °C, and 35.7 °C. Consequently, by enhancing the quantity of cooling conduits, the temperature of a liquid-cooled lithium-ion battery could be decreased, nevertheless with the rise of the quantity of conduits, the consequence of decreasing the maximum temperature of the surface is not apparent. For instance, the temperature diminished is fewer than 2 °C from 8 to 10 conduits for 8C discharging and this amount is about 1 °C from 4 to 8 conduits.
Different design conceptualizations for various quantity of conduits distribution are illustrated in
Figure 4. As an illustration, design with 10 conduits demonstrates the conduit quantity of the middle cold plate in the battery pack. The highest temperature following 8C discharge attains 33.28 °C, 34.7 °C, and 35.7 °C for 10, 8, and 4 conduits, accordingly. The heat dissipation effectiveness of design with 10 conduits is more appropriate. The principal cause is that the conduit quantity distribution in the design with 10 conduits is more satisfactory, therefore a more advantageous heat dissipation situation can be acquired adjacent to the region where heat concentrates definitely in the center of the battery pack. The conduit quantity adjacent to the outermost of the battery pack can be decreased to enhance the heat dissipation performance. Between different designs, a case design with 10 conduits acquires the lowest maximum temperature. The worst thermal effectiveness appears for a case design with four conduits, which possesses different flow orientation. For the other cases, differences of maximum temperature exhibit proximate efficiency.
Consecutively while the quantity of conduits raises to 10, the highest temperature for 8C discharge reaches 33.28 °C, 32.49 °C, and 32.15 °C for entrance velocity of 0.2 m/s, 0.5 m/s, and 1m/s, accordingly. In comparison with design with four conduits, the highest temperature of design with eight conduits declines by 1 °C, 1.4 °C, 1.3 °C, and 1.1 °C, correspondingly. Simultaneously, it was observed that the heat dissipation effectiveness of the design with 10 conduits is more appropriate.
5. Conclusions
Taking into consideration the construction expenses and complicacy of the entrance manifold, three designs with dissimilar flow directions were compared to investigate the influence of important parameters such as flow direction. Almost identical tendencies for maximum temperature were seen for all cases. The outcome shows that enhancing the homogeneousness of temperature distribution and decreasing the greatest temperature require a larger pressure decline. For different conditions, a phenomenon was seen of temperature concentration at the border and edge of the cold plate. The big temperature zone is less with the 10 conduits case. Particularly the big temperature concentration is decreased near the exit area for this case. Differently, the large temperature zone is bigger in the case with four conduits. Maximum temperature discrepancies for four conduits were about 5.7 °C, 3.3 °C, 2.5 °C, and 1.9 °C for entrance velocity of 0.1 m/s, 0.5 m/s, 1 m/s, and 2 m/s, correspondingly. The pressure reduction is directly representative of pumping expense. The pressure reduction should be maintained as small as feasible. The quantity of conduits and the velocity have the reverse impact on the pressure reduction. Consequently, in order to achieve a more effective energy efficiency, the quantity of conduits and the velocity could be optimized. The influence of both parameters, velocity, as well as the quantity of conduits on pressure reduction is considerable. Moreover, the more conduits leads to a larger pressure decline. The pressure decline enhanced by 80% while the quantity of conduits increased from 4 to 10. It was concluded that the case design with 10 conduits is the most appropriate design. In future studies different parameters, such as entrance velocity and temperature, number and dimension of conduits, thickness of cold plate, and conduit diameter will be optimized to increase the efficiency of a battery thermal management system.


