Article

Influence of Laser-Generated Cutting Edges on the Electrical Performance of Large Lithium-Ion Pouch Cells

1
Institute of Joining and Welding, Technische Universität Braunschweig, Langer Kamp 8, 38106 Braunschweig, Germany
2
Institute for High Voltage Technology and Electrical Power Systems, Technische Universität Braunschweig, Schleinitzstraße 23, 38106 Braunschweig, Germany
3
Institute for Particle Technology, Technische Universität Braunschweig, Volkmaroder Straße 5, 38104 Braunschweig, Germany
*
Author to whom correspondence should be addressed.
Batteries 2019, 5(4), 73; https://doi.org/10.3390/batteries5040073
Submission received: 5 November 2019 / Revised: 20 November 2019 / Accepted: 26 November 2019 / Published: 3 December 2019
(This article belongs to the Special Issue Lithium-Ion Batteries: Latest Advances and Prospects)

Abstract

:
Laser cutting is a promising technology for the singulation of conventional and advanced electrodes for lithium-ion batteries. Even though the continuous development of laser sources, beam guiding, and handling systems enable industrial relevant high cycle times, there are still uncertainties regarding the influence of, for this process, typical cutting edge characteristics on the electrochemical performance. To investigate this issue, conventional anodes and cathodes were cut by a pulsed fiber laser with a central emission wavelength of 1059–1065 nm and a pulse duration of 240 ns. Based on investigations considering the pulse repetition frequency, cutting speed, and line energy, a cell setup of anodes and cathodes with different cutting edge characteristics were selected. The experiments on 9 Ah pouch cells demonstrated that the cutting edge of the cathode had a greater impact on the electrochemical performance than the cutting edge of the anode. Furthermore, the results pointed out that on the cathode side, the contamination through metal spatters, generated by the laser current collector interaction, had the largest impact on the electrochemical performance.

Graphical Abstract

1. Introduction

Due to continuing human-induced CO2 emissions, the global warming of the earth and associated negative consequences of extreme weather are steadily increasing [1]. The impact of climate change has increased awareness of the population in industrialized countries of environmentally friendly or carbon-neutral behavior. These interests are driving the development of new, greener, and more efficient technologies for the major CO2 producing sectors, which are electrical energy production and individual mobility. To reduce CO2 emissions in the individual mobility sector, electric mobility is considered a key technology [2,3]. In order to maintain the positive CO2 balance of electric mobility, the use of electrical energy from renewable energy sources is required, but also the production of cells must be made more efficient and, therefore, more ecological. In particular, a more efficient large-scale cell production can be achieved by reducing rejects by optimizing existing or developing new technologies, as material costs dominate over operating and investment costs [4].
Lithium-ion pouch cells are considered to be the most effective electrochemical technology. Due to their advantages regarding the high volumetric utilization of the installation space of the battery pack, they are especially well suited for automotive batteries. Because of the possibility to customize the cell geometry, the pouch cell leads to less dead volume compared to conventional cylindrical 18650 cells [5]. Besides, the high volumetric energy densities on battery level pouch cells have high volumetric energy of 466 WhL−1 and a specific energy density of 241 Whkg−1 on cell level (Cathode: LG Chem. NCM 111, Anode: LG Chem. Graphite) [6]. Even though cylindrical 18650 cells have a volumetric energy density, which is about 20% higher than those of pouch cells [5], the homogeneous mechanical behavior during charging and discharging of pouch cells lead to longer cycle lifetime, which is to be considered a long term advantage over the higher energy density [7]. For pouch cells, in general, it is fundamental to cut the endlessly coated electrodes and make them suitable for the following stacking process. It is imperative to look more closely at the cutting process itself since each cut could lead to manufacturing errors in terms of contamination and cutting edge quality [8]. Due to a large number of processes, it is necessary to optimize every step to improve ecological productivity. Figure 1 shows the evolution of the accumulated production rejects of a conventional cell production line schematically.
As shown in Figure 1, each process can contribute to the overall efficiency of the production line. Due to the numerous processes of battery production, even small reject rates can lead to a high overall reject rate and, therefore, to low utilization of raw materials. Already at a reject rate of only 1% per process, the accumulated rejects at the end of the line reach almost 14%. Therefore, each process should be at least in the range of a 4σ reject rate, respectively, with a reject rate of under 0.09% with regard to ecological production. Investigating and improving the singulation process can contribute to accomplishing these high standards.
Besides the established shearing or die-cutting (DIN 8588) [9], laser cutting is becoming increasingly common in cell production lines due to its process-immanent advantages over the contact-based singulation method [10]. Especially for very thick and fragile electrodes, or pure lithium metal anodes, laser cutting is no longer an alternative but state of the art technology due to the lack of contact and the associated lack of mechanical stress [11]. In the following section, we have given a summary of the numerous studies in this field and laser ablation generally.

State of the Art Laser Cutting of Electrodes

The interactions between the material and the laser-generated photons during the cutting process is very dynamic and very complex due to a large number of possible and partly mutually dependent influencing factors. The key factors of a laser cutting plant are wavelength (λ), average power ( P a v g ) , spot size ( d s p o t ) , laser profile and Rayleigh length in focus, cutting speed ( v c ) , the number of passes, and cutting angle. In the case of pulsed laser beam sources, the additional factors are pulse peak power ( P p e a k ) , pulse energy ( E P ) , pulse repetition frequency ( P R F ), and pulse shape, as well as pulse duration (τ). The relevant material properties of the electrode are the composition of the coating (anode/cathode), collector material, coating thickness, collector thickness, absorption coefficient, and degree of compaction of the electrode (Figure 2).
For a simplified description of the influence of the primary process parameters in Figure 2, the secondary parameters energy density (ED) [13], intensity (I), pulse fluence ( H p ), and number of laser pulses per surface increment ( n l i n e ) [13] for pulsed beam sources can be used to explain the ablation or cutting behavior. Considering a certain wavelength, average power, and spot size, these parameters can be adjusted by v c , P R F , and τ. The secondary parameters are defined by the following equations:
E D = P a v g v c   d s p o t [ j c m 2 ]
I = 4   P a v g π   d s p o t 2   f o r   c w   a n d   I P =   4   P P e a k π   d s p o t 2   f o r   p u l s e d   l a s e r   w i t h   P P e a k P a v g P R F   τ   [ W c m 2 ]
H p = E P π   d s p o t 2 [ j c m 2 ]
n l i n e = P R F   ( d s p o t +   τ   v c ) v c [ ]
The energy density describes the energy input per surface increment (cutting length times const. spot size) on the material to be processed, depending on the cutting speed, photonic power, and spot size. This parameter can be used to describe the scalability of the cutting speed for a defined laser/scanner system and material or to define the necessary energy input for a quality cut and the cut-through limit. Since the energy density represents the average power input independent of the peak power, the intensity is necessary to further describe the cutting process with a pulsed laser beam source. In addition, the pulse fluence and the number of pulses, which hit per surface increment, must be specified. Based on the energy density, the intensity, the pulse fluence, and the number of hits per area increment, the amount of material removal and the material removal behavior can be derived. Figure 3 schematically shows the number of hits per surface increment as a function of the v c , P R F , τ, and the d s p o t , as well as the effects on the electrode cutting edge characteristics. The ablation thresholds a and b, as well as the heat-affected zone c shown in Figure 3, can be derived from the mentioned secondary parameters.
As the type of energy input can lead to different removal mechanisms, a comparison of continuous wave (cw) and pulsed systems based on the energy density is only conditionally possible. Here, a distinction can be made between thermal (cw/pulsed) and athermal (pulsed) dominant removal processes. The thermal ablation generally proceeds in three successive phases, and, in the case of a continuous cut, also in parallel phases. In the first phase, the photons are absorbed by the surface and penetrate a near-surface area. In the following second phase, the temperature increases at the surface as a result of the absorption, and in deeper zones by thermal conductive effects. The rising temperature leads to a transformation of the state of matter from solid to liquid and liquid to gas, or directly from solid to gas. In the third phase, the penetration depth increases and thus the melting or evaporation zone, wherein the material is expelled in liquid or gaseous form from the kerf. The material ejection can be further distinguished into fusion, sublimation, and photochemical cutting/ablation. The athermal removal process is characterized by the fact that the duration of the photonic energy input is too short for initiating heat conduction. This removal process can be achieved with pulse durations of less than 10 ps. Furthermore, due to the short exposure time of pulses in the ps and fs range, the spatial extent of the resulting plasma is negligibly small [14]. Considering the high intensities, athermal processes can be further distinguished between sublimation cutting and photochemical ablation.
Figure 4 shows the processes that occur after the first impact of the photons on the processed material. On average, the photons are absorbed in 10 fs, where the photonic energy is converted into thermal energy within 100 fs by electron-electron relaxation of the electrode systems of the covalent bonds. This is followed by an electron-phonon relaxation after about 1 to 10 ps, which leads to a heat transfer of the electrons into the lattice structure. Parallel to this process, the ablation begins, and after about 100 ps, the phonon-phonon relaxation leads to heat conduction [15].
By means of the beam source used in this study, it is possible to generate pulses in the ns range. Due to the relatively long pulse duration of 240 ns, we can only realize a thermally affected cutting process (thermal removal process) with this system [14]. As a result of the composite structure and the associated varying material properties over the thickness of the electrode, it can be assumed that several removal mechanisms take place simultaneously and/or serially during cutting. The cutting of the porous coating will be characterized by a photochemical and sublimation proportion, whereas the cutting of the metallic collector will be characterized by sublimation and a fusion proportion. In addition to the direct interaction between laser and material, a plasma which correlates to the intensity distribution of the laser will also interact with the electrode. This can lead to material removal or thermal loading of the active material, in addition to thermal conduction effects.
The laser-induced plasma is caused by the high intensities of the individual pulses, which leads to strong oscillations of the free electrons, enabling them to knock bounded electrons out of neutrally charged atoms. The avalanching increase of free and strong oscillating electrons leads to a large number of free electrons and positively charged species. The resulting high-energy plasma absorbs the photons of the laser radiation by the inverse Bremsstrahlung (IB) and the photoionization (PI). In this case, IB is considered to be the main absorption mechanism. The photons in this mechanism are absorbed by free electrons as they collide with neutral or ionized species. This leads to an increase in the energy of the electrons and thus to an increase in the degree of ionization and the temperature of the plasma. If the temperature and density of the plasma rise above a certain level, the plasma can shield the area from being cut from the laser radiation. This effect is referred to as the plasma shielding effect [18].
Investigations on cw and pulsed laser beam cutting of electrodes have already been carried out in previous studies. The results showed that the use of single-mode cw fiber lasers made it possible to achieve very high, industry-relevant cutting speeds due to the high average power and the achievable low spot sizes. Studies showed that it was possible to cut an anode (120 µm) with 11,666 mms−1 and a cathode (130 µm) with 10,000 mms−1 with a single-mode cw fiber laser at a wavelength in the infrared range (1070 nm), an average power of 5000 W, and a spot size of 25 µm [19]. This resulted in an energy density of 2000 jcm−2 for the cut-through limit of the cathode and an energy density of 1714 jcm−2 for the anode. The lower required energy density for the anode was probably due to the low collector thickness and the lower degree of compaction. In another study, an anode (50 µm) with a collector thickness of 30 μm was cut with a cutting speed of 2000 mms−1 using a single-mode cw Ytterbium fiber laser (1070 nm, 250 W, and 23 μm spot size). The much lower required energy density of 543 jcm−2 could be explained by the lower material thickness and by the higher intensity [20]. Based on these results, further investigations using the same system showed that compacted (56 μm) and non-compacted anodes (70 μm) with a collector thickness of 20 μm could be cut at a speed of 5000 mms−1 [21]. The low energy density of 217 jcm−2 required for the singulation suggested that the collector thickness was the dominating speed-influencing parameter of the electrode. Considering the strong influence of the collector thickness, as well as the intensity of the focused laser spot, it was plausible that an energy density of 818 jcm−2 at 5000 mms−1 led to a cut-through of an anode (100 µm) with a current collector thickness of 10 μm by using a single-mode cw fiber laser (1070 nm, 450 W, 11 μm spot size) [22]. In principle, the investigations with cw laser systems showed that the achievable chamfer width (total ablated area) was less than 50 μm and increased with increasing energy densities [21].
The trend of these dependencies was also found in investigations with pulsed laser beam sources. In addition to this, the investigations showed that with pulsed beam sources in the nanosecond range, higher pulse repetition frequencies enabled higher cutting speeds and led to a smaller chamfer width [19]. By using an ns pulsed fiber laser (1070 nm, 100 W, 50 μm spot size, 500 kHz, and 30 ns), it was possible for Kronthaler et al. [23] to cut an anode (114 μm) with a collector thickness of 10 μm at a speed of 1200 mms−1. Using the same system parameter, a slightly higher cut-through limit of 1250 mms−1 could be achieved for a 124 μm thick cathode with a collector thickness of 20 μm [23]. From the given parameters, an energy density of 160 jcm−2 resulted, for the cut-through limit, in an intensity per pulse of 3.4 × 10⁸ Wcm−2 and a hit number of 20. Lutey et al. showed in their research that the number of hits per area increment caused an increase in the plasma shielding effect. With higher numbers of hits, a higher average power was needed to realize a cut. At 125 hits per area increment (500 kHz), an energy density of 660 jcm−2 was needed, whereas, with a hit number of 5 (20 kHz), only an energy density of 352 jcm−2 sufficed [24].
Further results on laser cutting of electrodes showed that low energy densities and intensities were necessary for singulation for a smaller wavelength. At a wavelength of 1064 nm, an energy density of 448 jcm−2 and an intensity of 28.5 × 10⁸ Wcm−2 were necessary [24], whereas, at 355 nm, an energy density of 340 jcm−2 and an intensity of 1.7 × 10⁸ Wcm−2 were sufficient to cut a 120 μm thick anode [19]. These results could not be confirmed by studies with a laser in the green electromagnetic spectrum (532 nm, 1 ns, 6 W). For the singulation of an anode (130 µm), with the same collector thickness, an energy density of 560 jcm−2 and an intensity of 50.8 × 10⁸ Wcm−2 were needed. This could be attributed to the fact that the number of hits per surface increment of 165 increased the plasma shielding effect, and thus reduced the maximum cutting speed [25].
In order to realize the most dynamic and fast cutting processes possible in a cutting plant, the beam guidance on the workpiece is conventionally carried out by means of a remote scanner system. As a result of the low mass and the associated low inertia of the deflection mirrors, very high speeds and repetition accuracies can be achieved in the horizontal plane. Due to the varying distance of the electrode to the scanner system, a focus adjustment in the vertical direction is necessary. This adjustment can be produced by means of additional lenses (focus-shifter) or by a static f-theta objective. Considering the static beam refocusing, the advantage of an f-theta objective over a focus shifter is the higher repetition accuracy and wear-freedom. However, the dynamic focus by means of a focus shifter allows us to adjust the working field and to customize the focus in certain areas.

2. Experimental

2.1. Materials

To investigate the influence of the laser process parameters on the properties of the cutting edge and the influence on the electrochemical performance, double-sided coated electrodes with industrially available material components were used. For the anode, the active material SMGA4 (91 wt.%; Hitachi, Japan), with a specific capacity of 360 mAhg−1, was coated on a 10 µm thick copper collector (Sumisho Metallex, Japan). Subsequently, the coating was compacted to a density of 1.5 gcm−3, which results in the porosity of 32.25% and a total thickness of 123 µm. On the cathode side, the active material NMC 111 (90 wt.%; BASF, Germany), with a specific capacity of 165 mAhg−1, was coated on 20 μm thick aluminum collector (Hydro Aluminum Rolled Products, Germany) and compacted to a degree of 2.8 gcm−3. The described compaction led to porosity of 31.35% and a total electrode thickness of 143 µm. For the anode and cathode, a conductivity additive SFG6L (2 wt.% anode, 2 wt.% cathodes; Imerys, Switzerland), a carbon black C65 (2 wt.% anode, 4 wt.% cathodes; Imerys, Switzerland), and a PVDF binder (5 wt.% anode, 4 wt.% cathodes; Solvay, Italy) were utilized. The cell manufacturing was carried out with a 27 µm thick separator (Separion) and a conventional LiPF6 electrolyte (UBE Industries Ltd., Japan). The conductive salt LiPF6 was solved in a concentration of one mole in a solvent consisting of ethylene carbonate (EC), dimethyl carbonate (DMC), and ethyl methyl carbonate (EMC), with a volumetric ratio of the solvent components of 1:1:1. To suppress the evolution of gas during the first charging, the electrolyte contained 2 wt.% of Vinylene Carbonate (VC). As further additives for reducing hydrogen formation at high voltages, the electrolyte contained 3 wt.% of cyclohexylbenzene (CHB).

2.2. Analysis of the Cutting Edge Characteristics

The prescriptive characteristics of the electrode cutting edge are shown in Figure 5a by means of a microsection. These characteristics were determined by light microscopy (VHX 2000 light microscope (LM), Keyence, Osaka, Japan) and laser scanning microscope (VK-X Series 3D Laser Scanning Confocal Microscope (LSM), Keyence, Osaka, Japan). Here, the parameters chamfer width and heat-affected zone (HAZ) were considered to be the significant influencing factors on the electrochemical performance and, therefore, investigated further. The HAZ is defined as an area where the active material is thermally stressed but not removed. The chamfer width is characterized by active material removal and a melt formation zone.
To measure these characteristics, LM and LSM images were taken of the upper side of the electrodes at the cutting edges. The areas of the heat-affected zone and the chamfer width could be clearly separated by a combined measuring method. By means of the LSM topography images (Figure 5b,c), the chamfer width was measured. By subtracting the chamfer width from the entire affected area (LM images), the heat-affected zone could be quantified. For the determination of contaminant products as a result of the laser-material interaction, SEM (FEI Quanta 650, Thermo Fisher, Waltham, MA, USA) and EDX (Oxford X-Max 80 mm2, Oxford Instruments, Abingdon, England) images of the cut electrodes were taken.

2.3. Cell Format and Manufacturing

To evaluate the influence of the cutting edge on the electrochemical performance, pouch cells with 15 compartments were built (total cell capacity about 9 Ah). The relatively high number of compartments was chosen to emphasize the effect of the cutting edge properties of the electrodes, maximizing the effects of the cutting edge characteristics on the electrochemical performance. The surface of the anode coated with active material was 16,484 mm2 and, based on the geometry shown in Figure 6a, gave a cutting edge to surface ratio of 0.030 mm−1. The cathode is defined by an area of 15,209 mm2 and a ratio of cutting edge to the surface of 0.031 mm−1. For the anode, a circumferential overlap of 2.5 mm resulted from the illustrated geometries for the anode and the cathode. This overlap guaranteed the total stress of the cathode as a reference in these examinations and ensured the correct balancing of the compartment.
By means of a z-folding process (prototype plant, Jonas & Redmann, Berlin, Germany), the singularized electrodes were stacked alternating between a separator to form an electrode-separator-composite (ECS). Subsequently, the individual collectors of the electrodes were joined to a tab via ultrasonic welding (Ultraweld F20, Branson Ultraschall, Hannover, Germany). For this purpose, the 15 single anode collectors were welded to a nickel tab with an energy of 200 j, and cathodes collectors to an aluminum tab with an energy of 100 j at an oscillating sonotrode amplitude of 30 µm. Subsequently, the ECS was dried under vacuum for 120 °C for 16 h. In the following step, the ECS was inserted into the pouch bag and filled under argon atmosphere with electrolyte and sealed. Finally, the filled cells were tempered for 4 h at 60 °C to support the complete wetting of the electrodes. The finished assembled cell is shown in Figure 6b [12].

2.4. Cell Diagnostic

After assembly and wetting, the manufactured cells were placed in a climate chamber (WKM Inc., Lachendorf, Germany) at 20 °C and connected to a battery tester (Series XCTS, Basytec Inc., Asselfingen, Germany) with a fixed torque of 2.54 Nm. Due to the high capacity of the battery cells, the tests required a high safety environment. Therefore, the climate chambers were equipped with a fire extinguishing system (Wagner Group Inc., Langenhagen, Germany). In the event of an accident, the climate chamber is flooded with nitrogen gas. Furthermore, an activated carbon filter (Stöbich technology Inc., Goslar, Germany) will filter the exhaust air in the pipe duct.
In our experiments, the cells were formed in two cycles. They were first charged and discharged at 1/10 C, and in the second formation cycle with 1/2 C. Upper and lower cut-off voltages were 4.2 V and 2.9 V, respectively, for all charge-discharge cycles. To characterize the cells, a capacity test at 1/10 C and a pulse test (1 C for 1 s) to determine the internal resistance were performed. After the formation process, the cells were matured over eight days with a state of charge (SOC) of 50% at 20 C. Then, the aging of the cells began with a C-rate test with different discharge-rates from 1/5 to 2 C, which lasted 20 cycles. Long-term cycling was then started at 1 C for 100 cycles. After this, the cyclization was paused, and the internal resistance was measured in a pulse test before the C-rate test was repeated. These aging investigations were repeated periodically until at least 450 cycles were reached. In this study, 5 cells per laser variation were analyzed, and only the long-term cycling was considered.

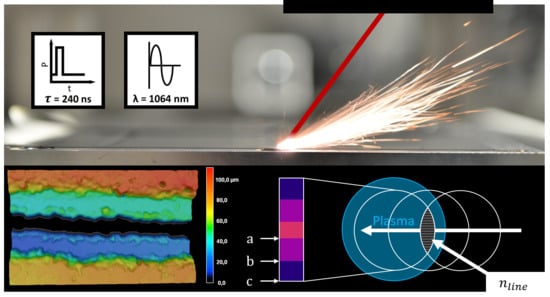
2.5. Laser Cutting Plant and Key Parameter

The laser cutting plant used in this study was an in-house development and construction. Due to its modular structure and the process-immanent advantages of the scanner system, it is suitable for a large number of different electrode formats. The beam source used was a nanosecond pulsed fiber laser with a central emission wavelength of 1059–1065 nm (G4 Pulsed Fiber Laser, SPI Lasers UK Ltd., Southampton, UK). The average power of the fiber laser was 72 W with a peak pulse power of up to 13 kW and an M2 of <1.6. Guidance and focusing of the laser beam were performed by a 3-axis laser beam deflection system (AXIALSCAN 30/FOCUSSHIFTER, Raylase AG, Wessling, Germany) with a working field of 400 × 400 mm2. The first two dimensions of the scanner were needed to drive the spot over the workpiece to create the cutout. The third dimension was needed to ensure a constant spot size of ~74 μm with a focus depth of 0.6 mm on one level over the entire working field. All laser cuts were made in one pass. The fully automated handling system was carried out by simple roll to roll and pick and place operation (Figure 7a), controlled by an Arduino Mega 2560. Since the cut could only be realized in the focus level of the laser spot, a special negative form for the positioning of the electrode had to be built for each electrode format (Figure 7b). The positioning of the electrode was done by negative pressure on holes surrounding the cutting curve. Even though a cutting on the fly was possible with the used remote scanner system, a static cutting operation was used to guarantee constant cutting speed over the complete cutting length and an easy format change.

3. Results and Discussion

The presentation of the results has been divided into three sections. In the first section, the results of the influence of the laser parameters on the cutting edge characteristics, chamfer width, and heat-affected zone have been considered and discussed. The investigations focused on the pulse repetition frequency, the cutting speed, and the pulse length, as well as the influence of the number of hits per surface increment, and intensity at a constant energy density. In the second section, the influence of the cutting edge characteristics and corresponding laser process parameters on the electrochemical performance has been examined. Building on these results, the last section would present further investigations of the cutting process and the cutting edge, explaining the electrochemical behavior.

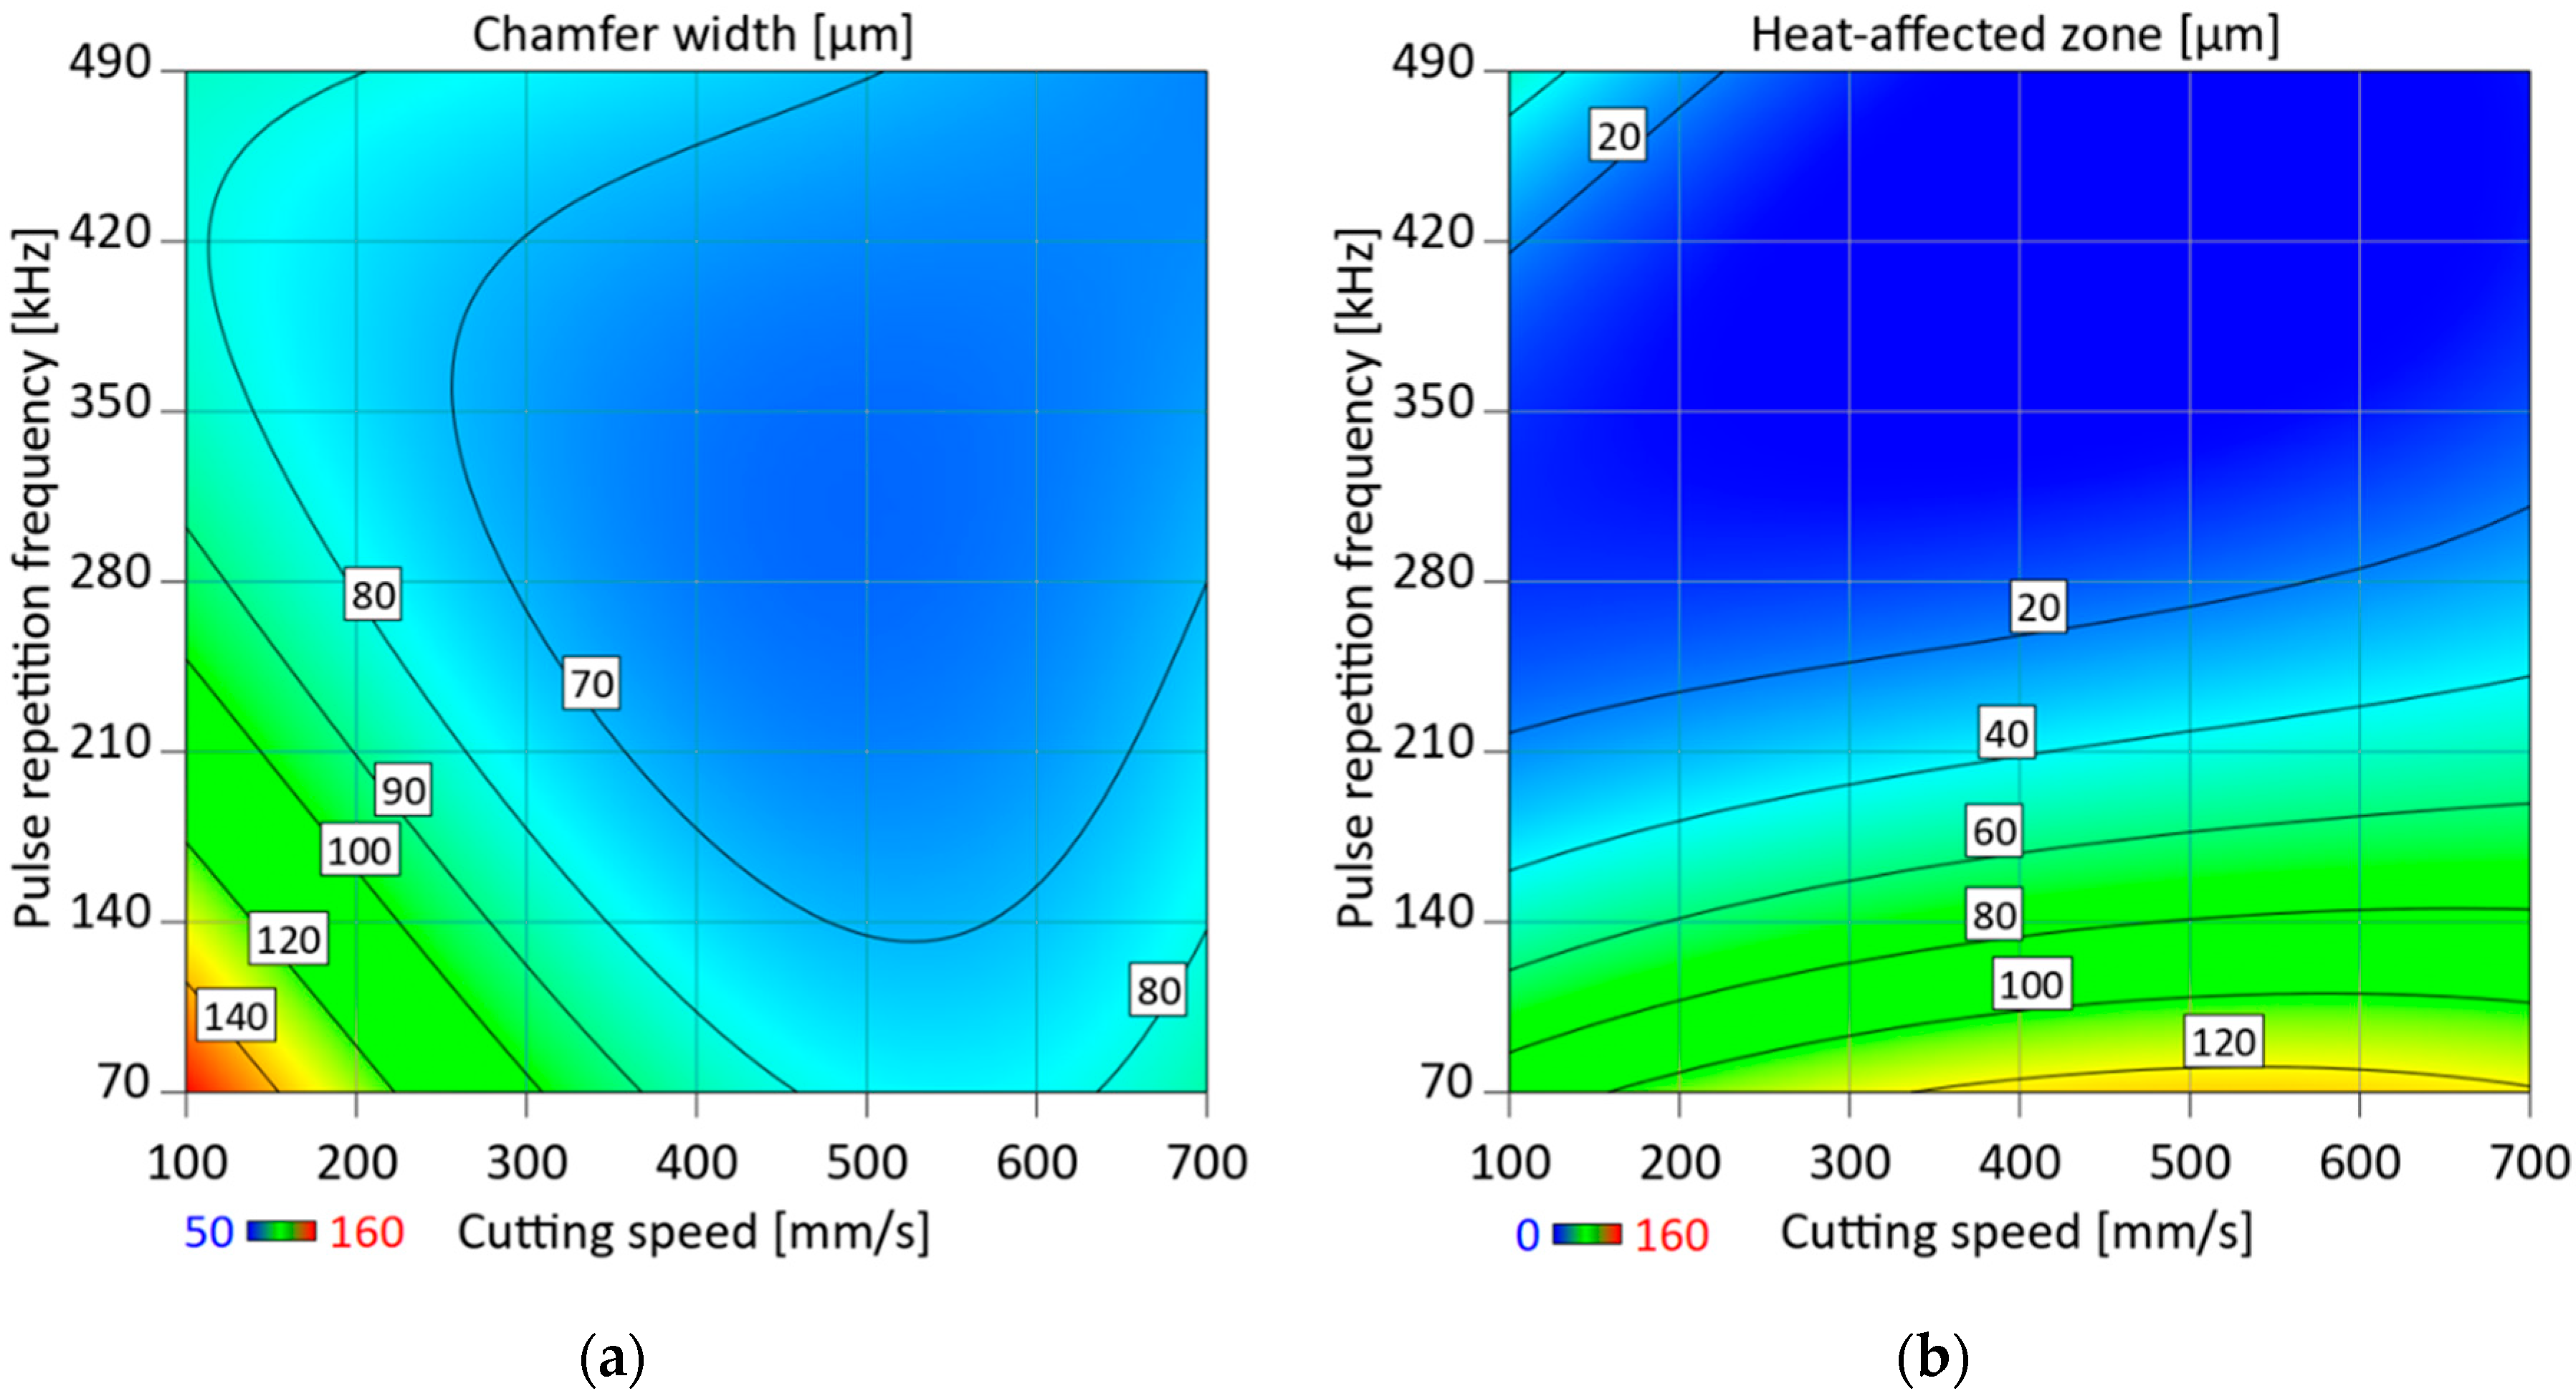
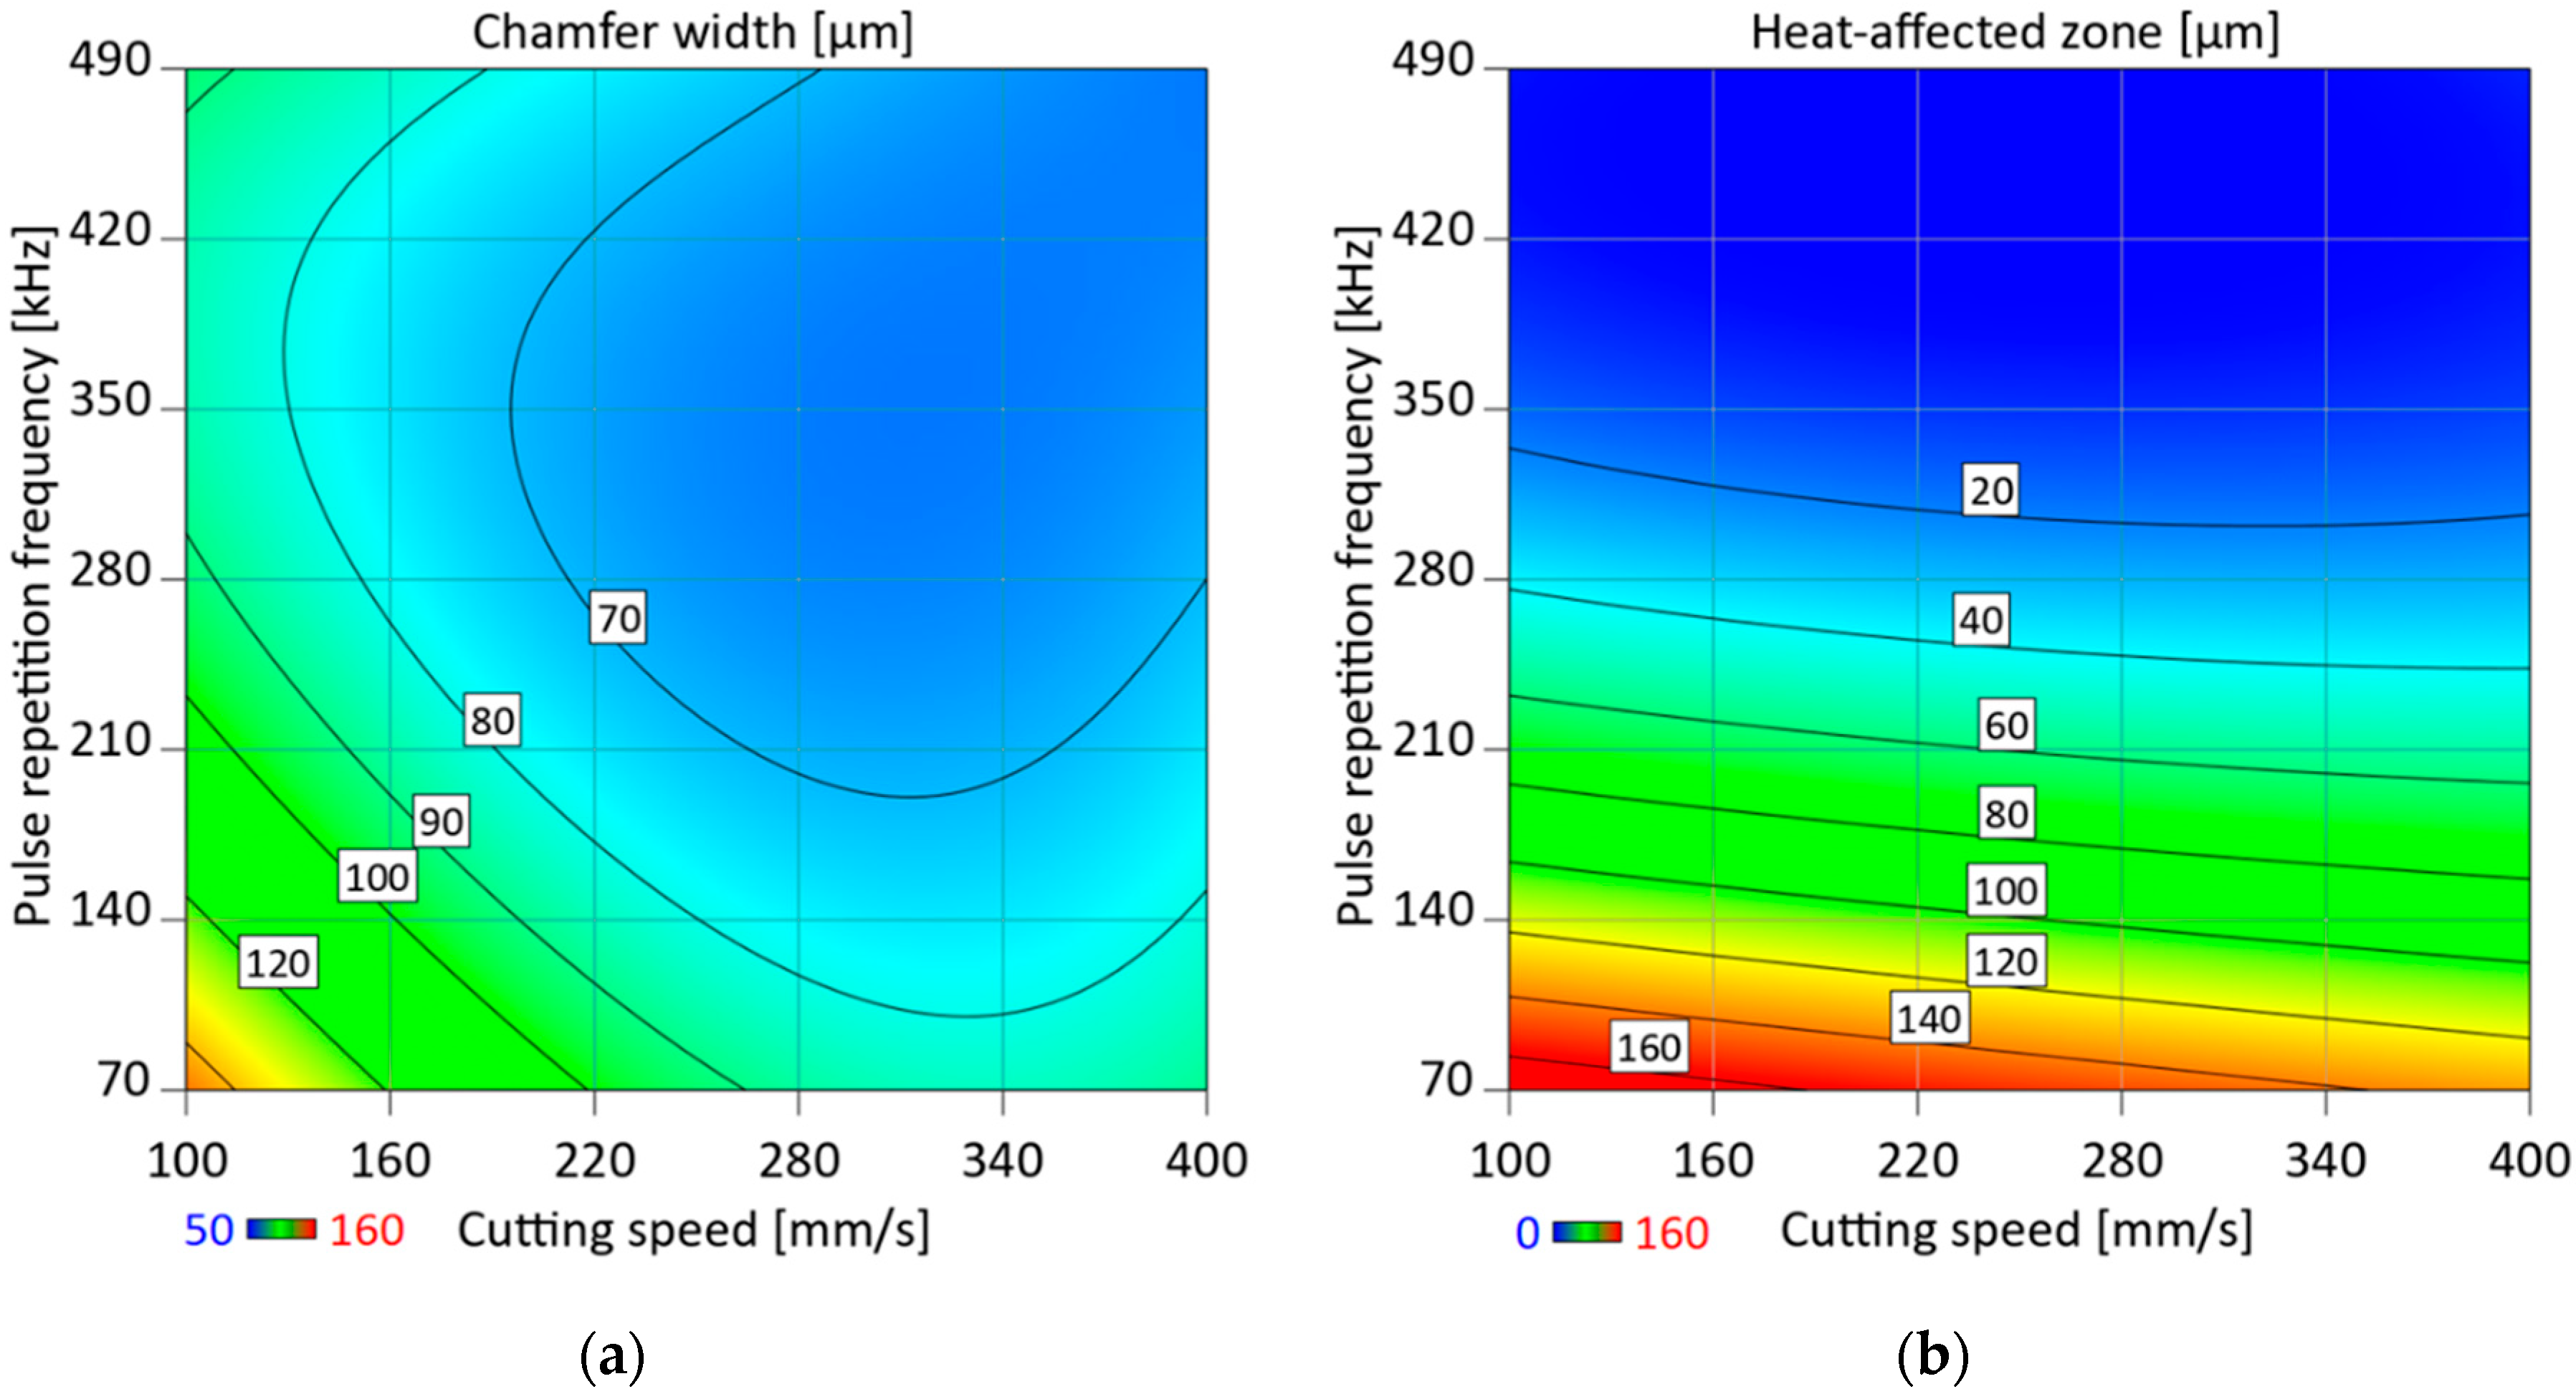
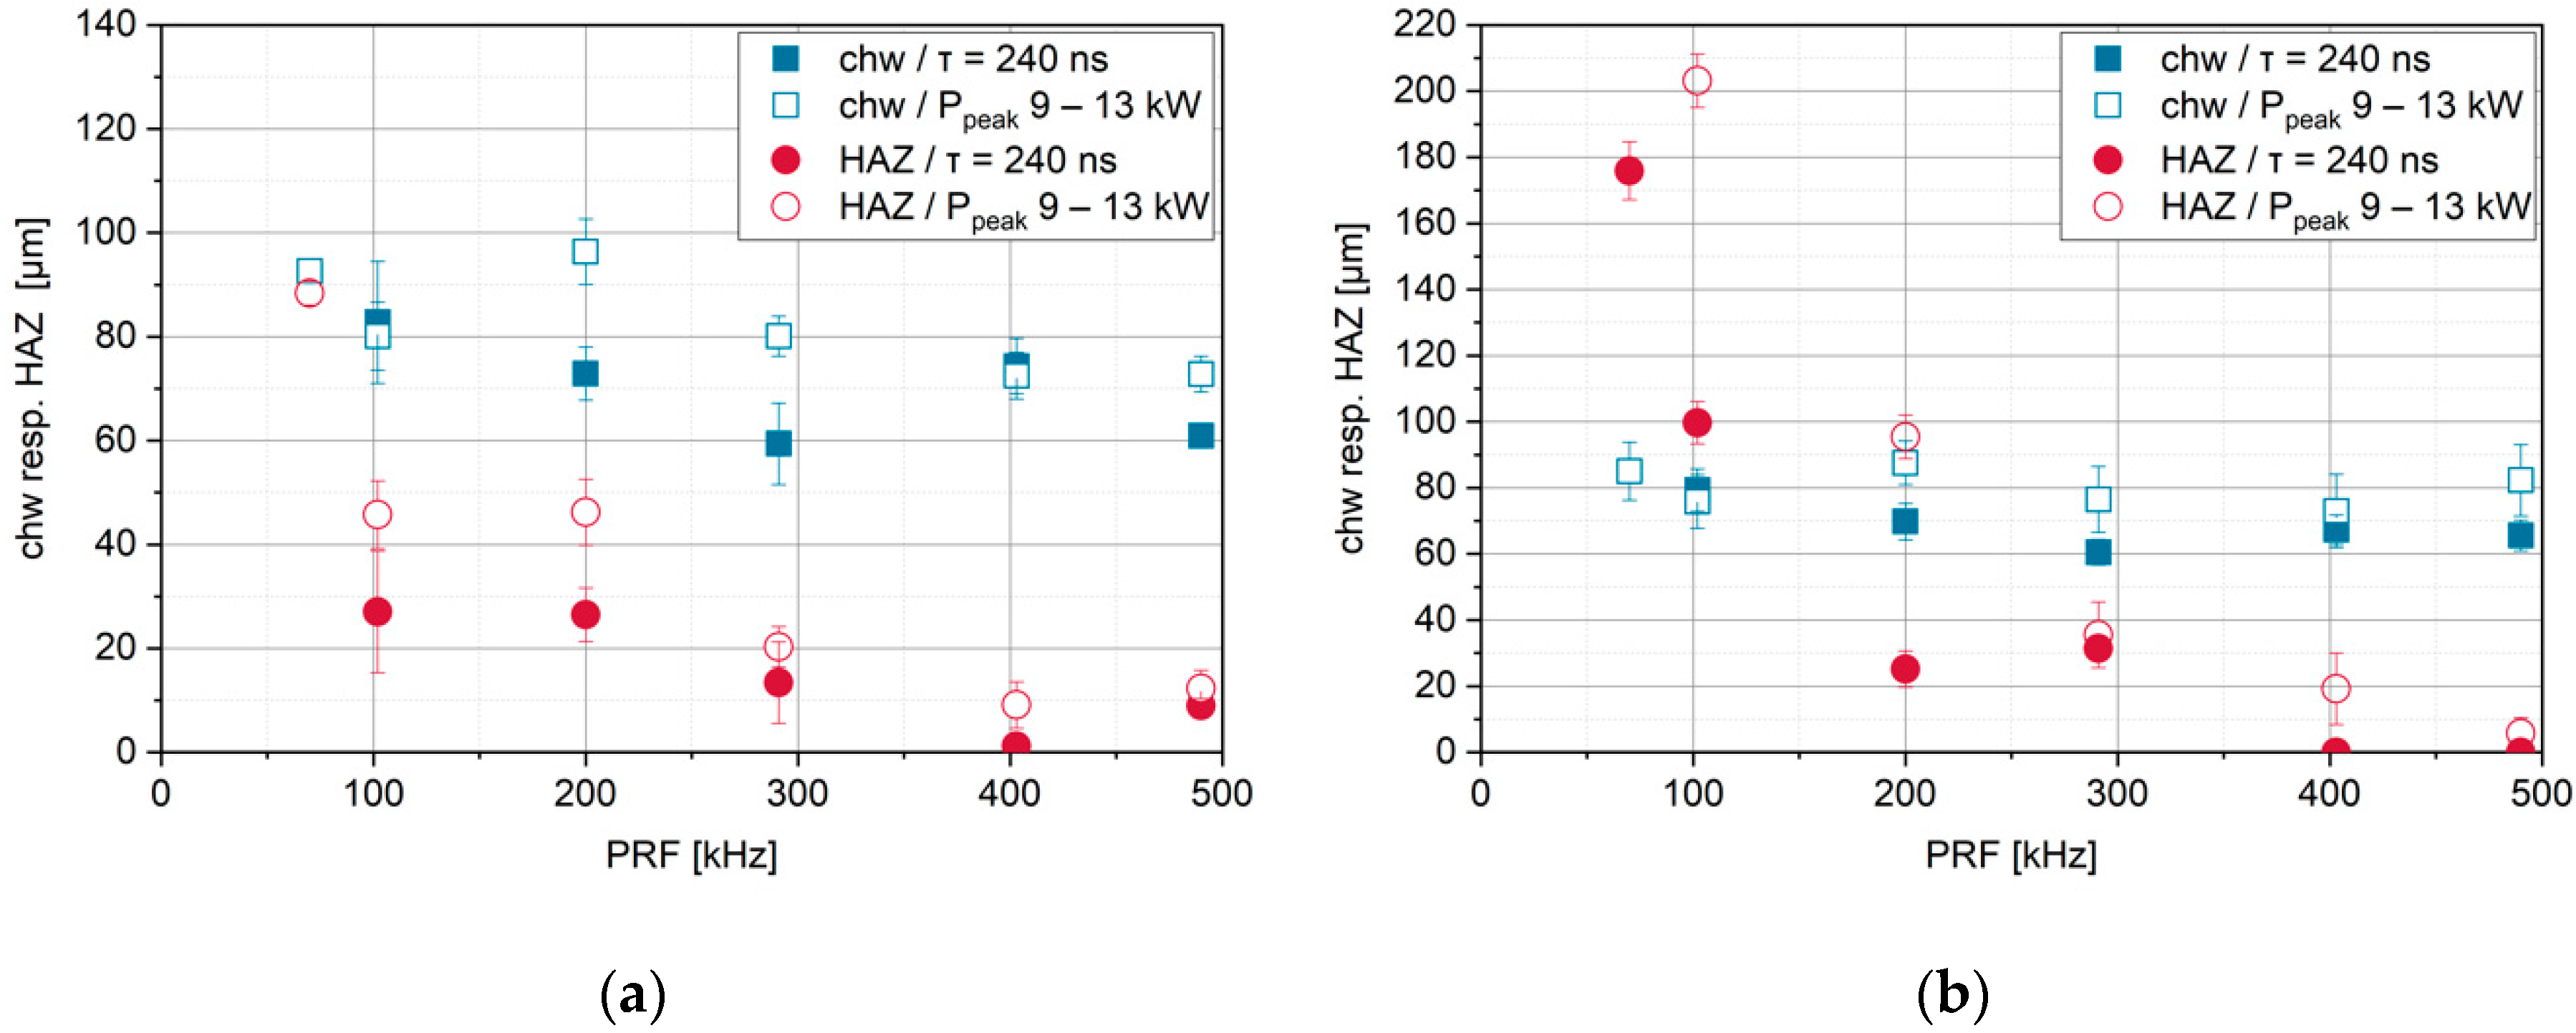
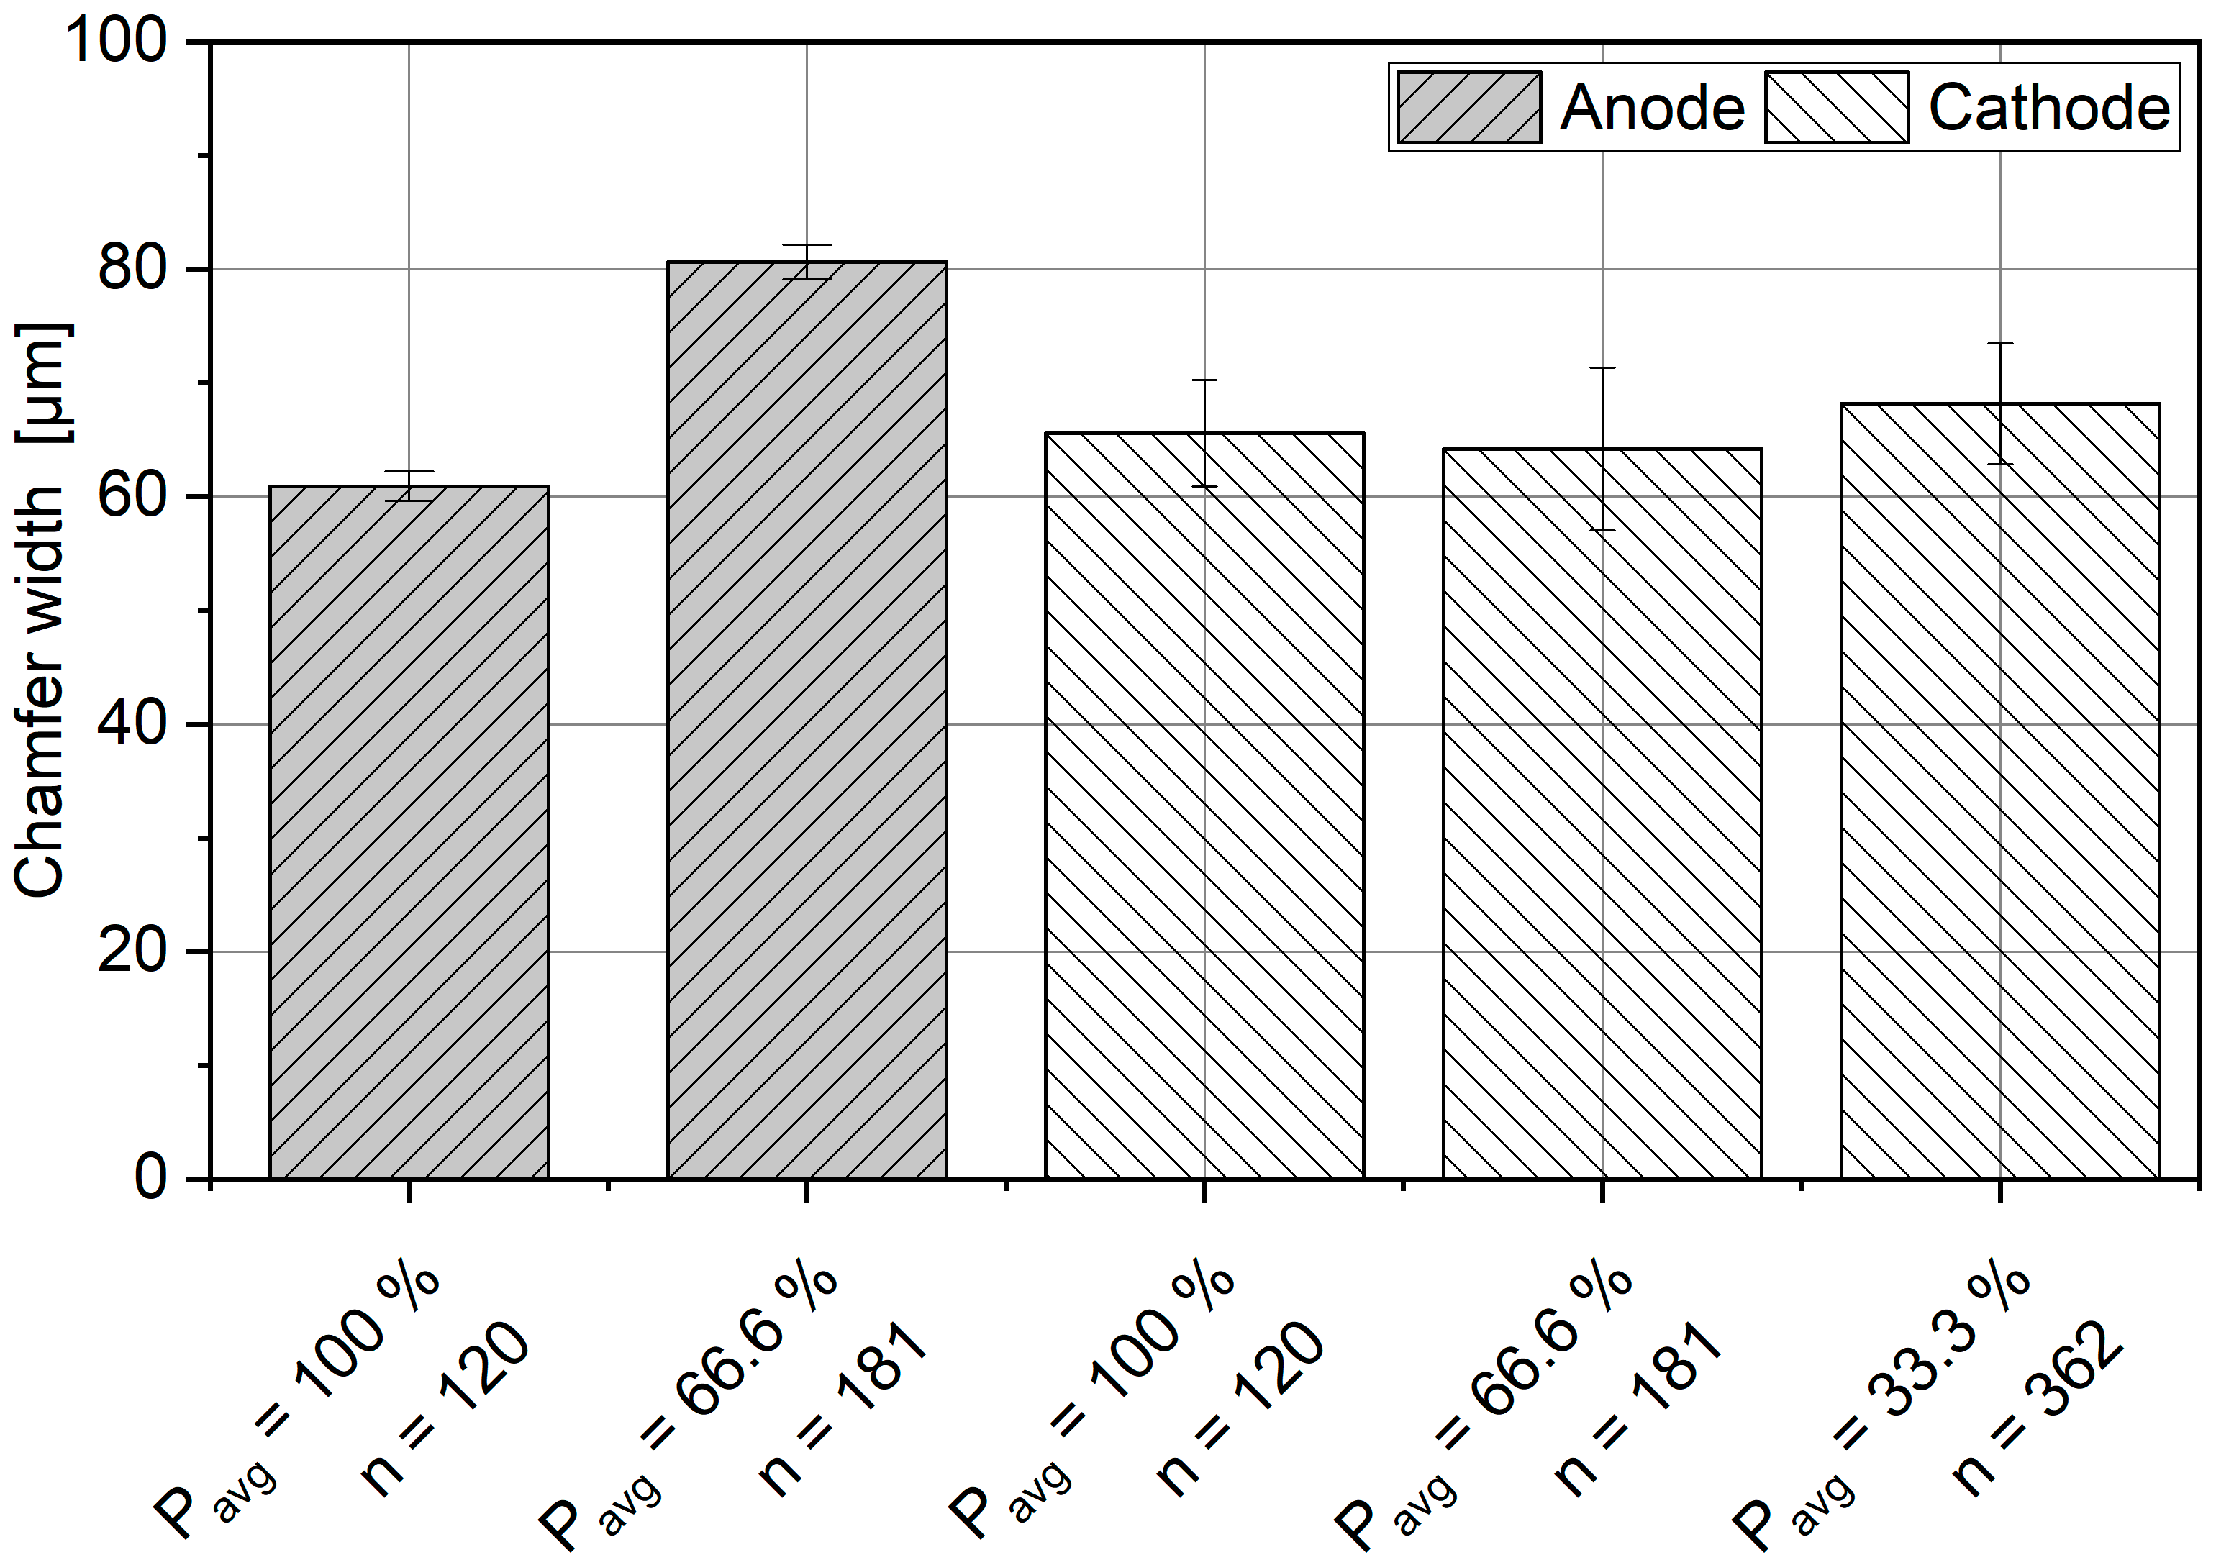
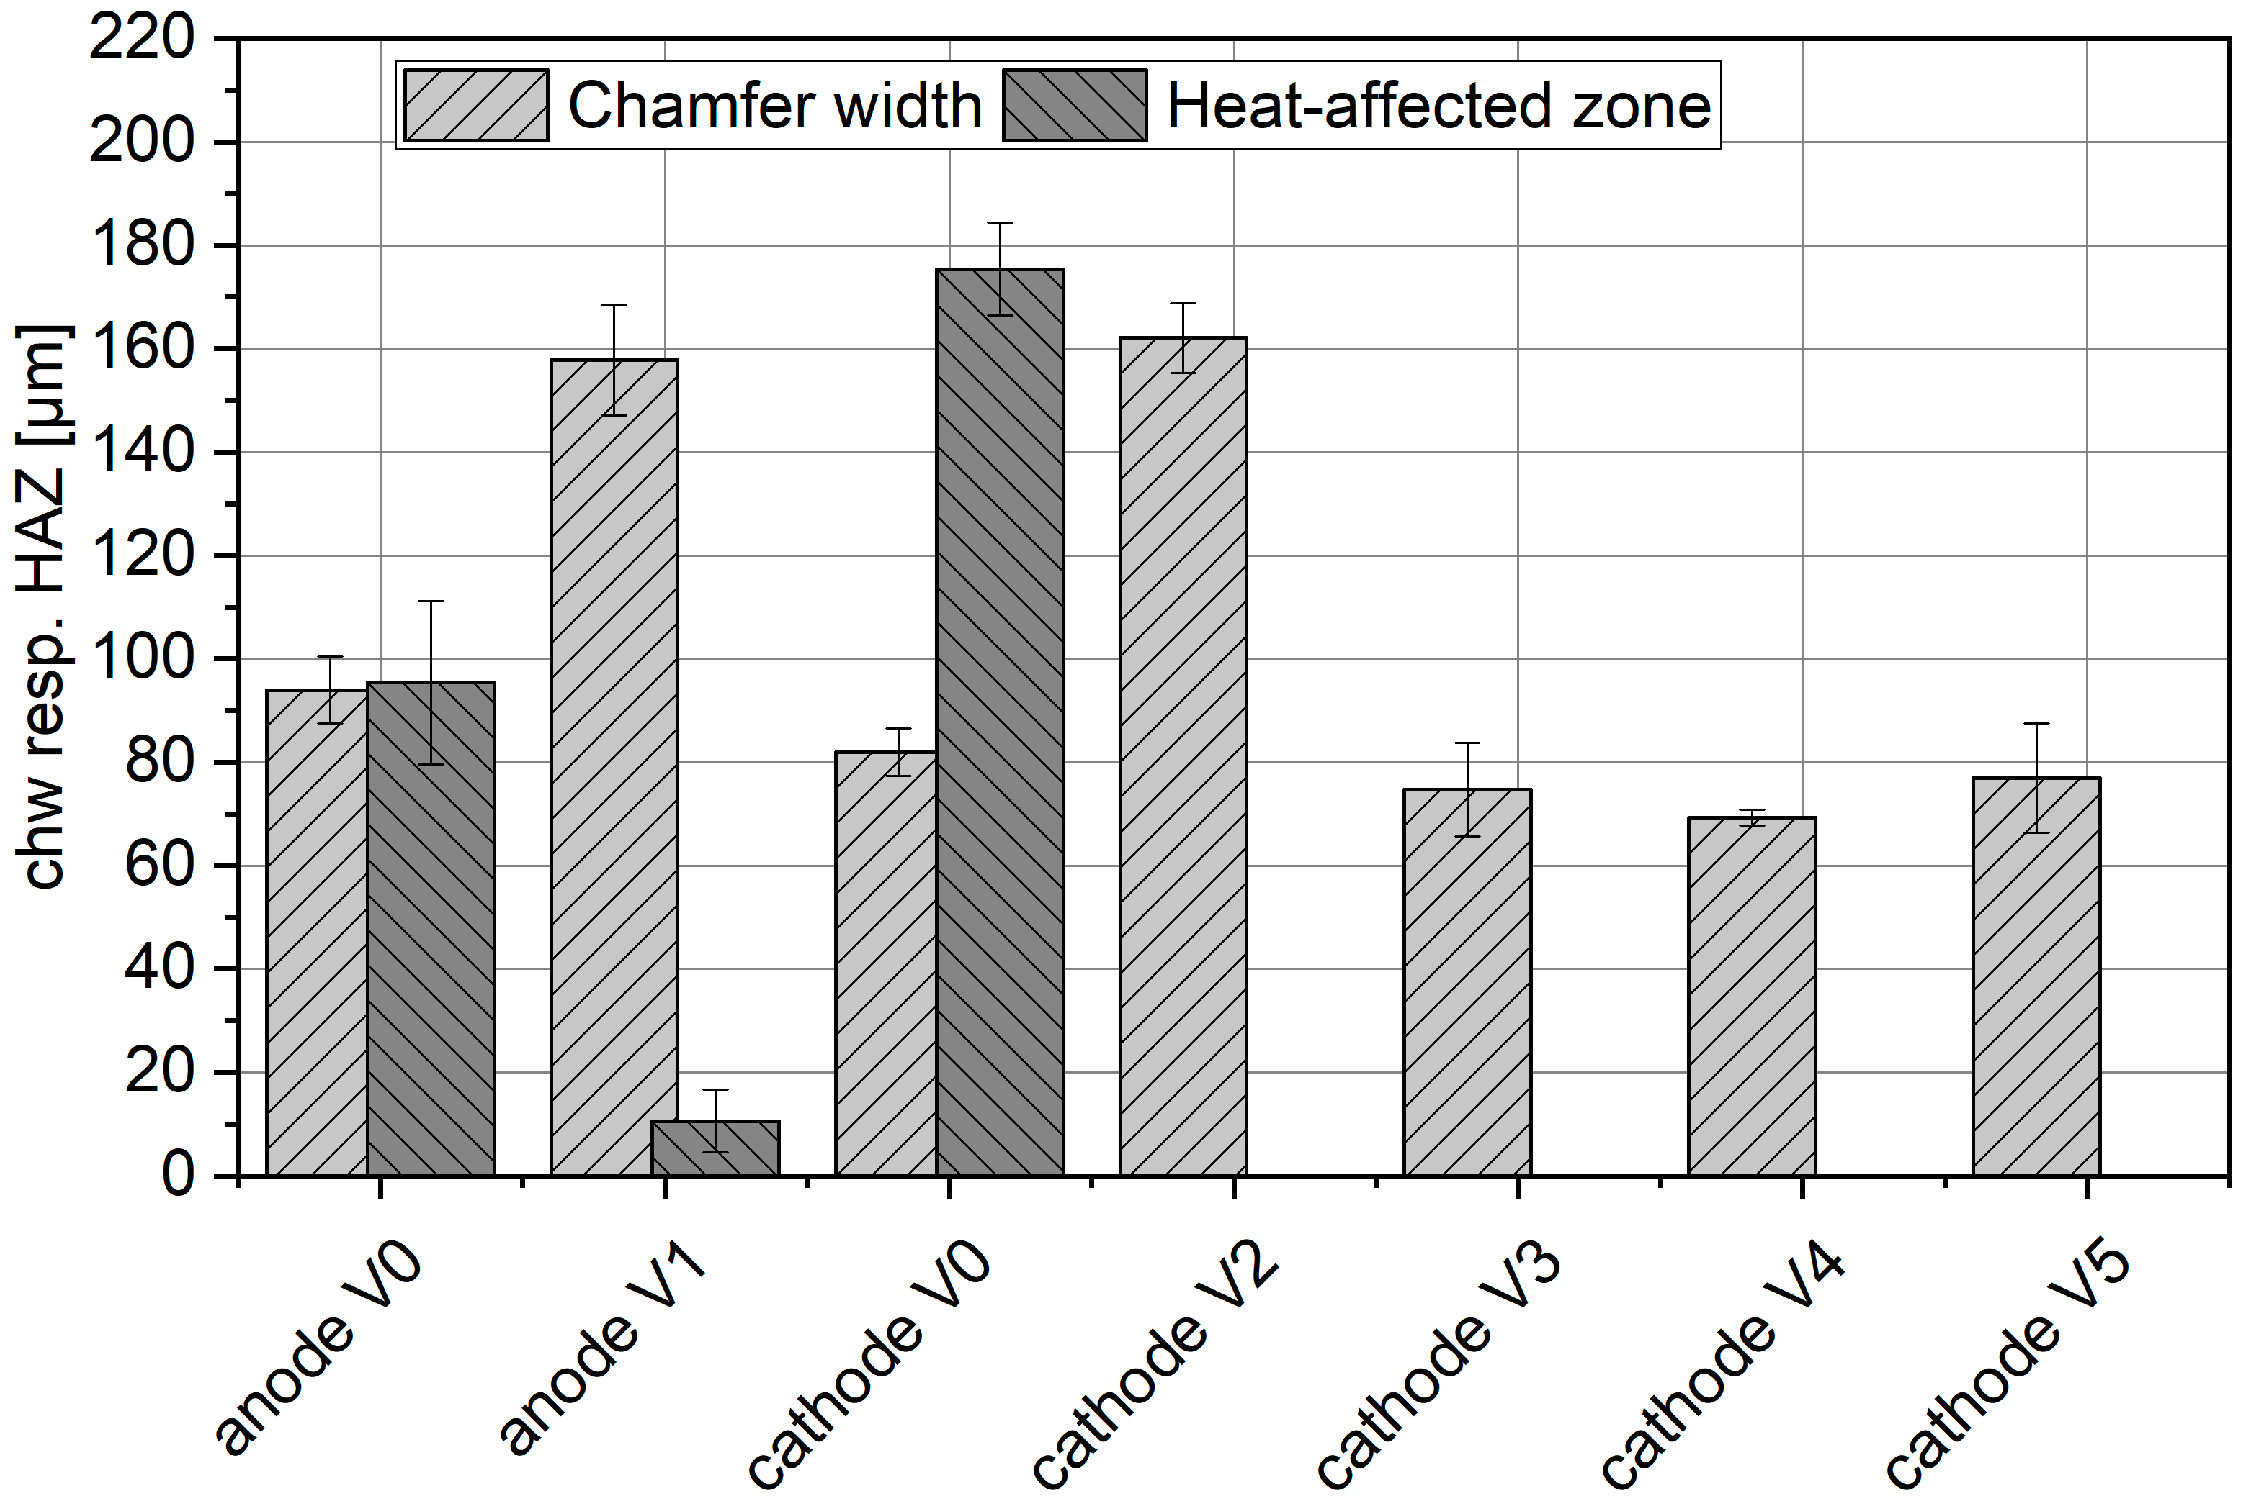
3.1. Influence of the Laser Process Parameters on the Cutting Edge Characteristics

In a first step, we investigated the influence of the laser parameters on the cutting edge properties. For this purpose, the pulse repetition frequency (PRF) and the cutting speed (Vc) were deliberately varied with constant power and pulse duration. The resulting cut edges were evaluated according to the analysis methods presented. On the basis of the obtained data, models could be developed by means of the analysis program Design Expert 11, which describes the examined parameter space. The experimental design was made with a D-optimal strategy and comprised 13 experiments with five repeated measurements each. The response surface model was adapted to the measured values by fitting it to a quadratic polynomial of the form of Response = Intercept * + A + B + AB + AB2 + A2B A2 B2. The results for the anode (Figure 8) showed that both parameters influenced the formation of the chamfer width and the heat-affected zone. In Figure 8a model, it could be seen that the formation of the chamfer width steadily decreased with increasing PRF. This tendency could also be observed with increasing cutting speed. The smallest chamfer width for this model was obtained at the maximum achievable speed of 700 mms−1, with a pulse repetition frequency of 490 kHz. Considering the additional laser parameters, this resulted in a number of hits per area increment of 51 and an energy density of 141 jcm−2. The decrease in the chamfer width with increasing speed or decreasing energy density could be explained by the lower energy input per area. The dependence on energy density has already been confirmed by previous publications [24]. The decrease of the chamfer width with increasing pulse repetition frequency could be attributed to different mechanisms, which result from the adjusted mode of the energy input. Due to the constant average power and the constant pulse duration, the pulse peak power had to drop with increasing pulse repetition frequencies to reduce the energy per pulse. As a consequence, the intensity and the energy decreased with increasing pulse repetition frequency, and thus the width of the threshold intensity or the spot diameter, which led to an ablation, becoming smaller due to the Gaussian intensity distribution. Besides, the increased number of hits of 360 (at 490 kHz and 100 mms−1) could lead to a more intensive harmonic laser-plasma interaction, which reduced the energy impinging on the target by shielding effects and thus reduced the energy density. In addition, the reduced pulsed peak power could lead to a smaller broadening of the plasma formation. Since the plasma was also involved in the removal of material and the thermal load on the surface, the proportion of the total material removal became less at higher frequencies. Literature regarding ns laser-induced breakdown spectroscopy describes threshold pulse fluences for forming a plasma of 1.01 jcm−2 for aluminum and 1.46 jcm−2 for copper. As the smallest pulse fluence at 490 kHz for this System was 3.45 jcm−2, the plasma formation, in general, would always occur for the examined parameter space [26].
From the heat-affected zone model (Figure 8b), it could be seen that increasing the PRF could reduce the heat-affected zone. The cause for the dependence of the thermal load on the PRF could be explained by the reasons given above for the dependence of the chamfer width on the PRF. The correlation of the HAZ with the cutting speed showed the opposite behavior to the chamfer width. As the cutting speed increased, the HAZ increased in the range of 70–350 kHz. This could be explained by the fact that with increasing cutting speed, the chamfer width and the kerf were becoming steadily smaller. This means that less material was removed for higher cutting speeds. Due to the Gaussian intensity distribution and the increasing speed, the energy input profile changed to the effect that the material which was no longer ablated underwent such high thermal stress that there was an optical change. This means that the final product cut with high speed contained a larger active material area that is thermally stressed, which would be completely removed at lower speeds. The investigations on the cathode were carried out in smaller parameter space (Figure 9a) with respect to the speed (100–400 mms−1) because due to the higher material thickness of the collector already at 455 mms−1, the cut-through limit for high PRF was reached. The results for the formation of the chamfer width as a function of the PRF and Vc showed similar tendencies as the anodic model. Both with increasing PRF and with increasing Vc, the chamfer width decreased significantly. The results showed that the smallest chamfer widths could only be achieved through the combination of low energy densities and high PRF. Possible causes for these dependencies could be transferred from the explanations to the anode. The model presented for the development of the heat-affected zone for cathodes (Figure 9b) could be adjusted with an R2 of 0.93 and allowed a 92% reliable prediction. With increasing PRF, the HAZ decreased significantly until it approached zero at 490 kHz. Here, the influence of the cutting speed played only a minor role. Despite the low significance, an increase in the cutting speed led to a reduction in the HAZ. These results were opposite to the results for the anode. The difference in behavior was explained by two facts. Firstly, the intensity and energy difference between the ablation threshold and the thermal stress threshold were smaller for the cathode active material than for the anode active material. Secondly, the ablation threshold of the cathode active material was higher than that of the anode active material.
Further investigations outside of the considered parameter space in the range of very low cutting speeds (50 mms-1) and very high energy densities, respectively, showed that on the cathode and anode cutting edge, either no or very small HAZ could be identified. This was caused by the slope of the intensity distribution and the very high energy input. As a result, the areas that were previously only thermally stressed at lower intensities were subjected to material removal at higher energy densities. Furthermore, the high energy density at 50 mms−1 led to an increase in the ablation area, since the ablation thresholds of the collector and active material differ significantly.
With regard to the strong influence of the PRF on the chamfer width and the HAZ, the influence of the pulse duration and the pulse peak power on different PRF was investigated in a further study. For this purpose, cuts were performed at a constant energy density with a variation of the pulse duration and pulse peak power. Pulse duration was kept constant (240 ns) with the effect that the pulse peak power decreased with increasing frequency (70 kHz: 13 kW, 102 kHz: 6 kW, 200 kHz: 2 kW, 291 kHz: 1 kW, 403 kHz: 0.7 kW, 490 kHz: 0.55 kW). The pulse duration was shortened (240–20 ns) to keep the pulse peak power quasi constant (70 kHz: 13 kW, 102/200/291 kHz: 10 kW, 403/490 kHz: 9 kW). The results for the chamfer width and the heat-affected zone derived from these experiments are shown in Figure 10. The PRF variation with constant pulse duration showed the same tendencies as in the previously presented models in Figure 8 and Figure 9.
A reduction of the pulse length with a quasi-constant pulse peak power led to a larger chamfer width and HAZ, both at the anode and at the cathode (Figure 10). On the anode side, the reduction of the pulse length led to a significant enlargement of the heat-affected zone for the PRF 102 and 200 kHz. Due to the higher PRF and the high intensities, the plasma formed was of higher energy, leading to enhanced thermal stress of the electrode surface and, thus, potentially to a higher ablation. The reduction of the HAZ by the increased frequency of the ns laser pulses was thus determined largely by the low pulse energy. Only by a much greater reduction of the pulse length of less than 10 picoseconds, a cold cutting is possible [14].
The increased chamfer width for the anode and the cathode at higher pulse peak powers at higher PRF confirmed the assumption that was previously made on the anode and cathode model. In addition to the decrease in pulse peak power, the decrease in pulse energy at higher PRF led to a reduction of the chamfer width.
In the following experiment, the scalability of the cutting speed or the influence of the number of hits at constant energy density was investigated (Figure 11). The results for the anode showed that at constant energy density, the chamfer width increased at a reduced rate. A reason for this was the lower intensity and the correlated intensity distribution, as well as the lower energy of the pulse, which narrowed the profile of the material removal threshold. As a result, the geometric distance between a full cut and the ablation of the active material increased (see Figure 3.). In general, the cutting kerf, as well as the entire area in which material was removed, became smaller as a result. Because of the displacement of the removal thresholds, a larger chamfer width was produced at lower speeds for a specific energy density.
The fluence resulting from the reduction of the average power to 33.3% was still 1.15 jcm−2 and was thus above the limit for the formation of plasma for aluminum. Despite the high number of hits, it could be assumed that shielding effects were negligible as the intensity was much lower, and the larger plasma formation led to increased removal of the active material. When the average energy was reduced to one-third of the maximum power, no cut could be made through the copper collector at a frequency of 490 kHz for the energy density being studied. Due to the strong reduction of the pulse energy and peak pulse power, the beam could no longer be coupled because of the low absorption of the copper. When cutting copper, it is first heated by the radiation until it oxidizes [10]. As soon as the material oxidizes, the radiation can be much better coupled into the material, and only then leads to the sufficiently high absorption of the laser radiation for a complete cut.
Cathode investigations showed similar tendencies, which were much less pronounced. Compared to the anode, the cathode could be cut at 33% of the maximum average power, although the cathode’s aluminum collector was twice as thick as the anode’s copper collector. The results basically showed that the necessary energy density could be used as a second parameter to define a cut-through limit.

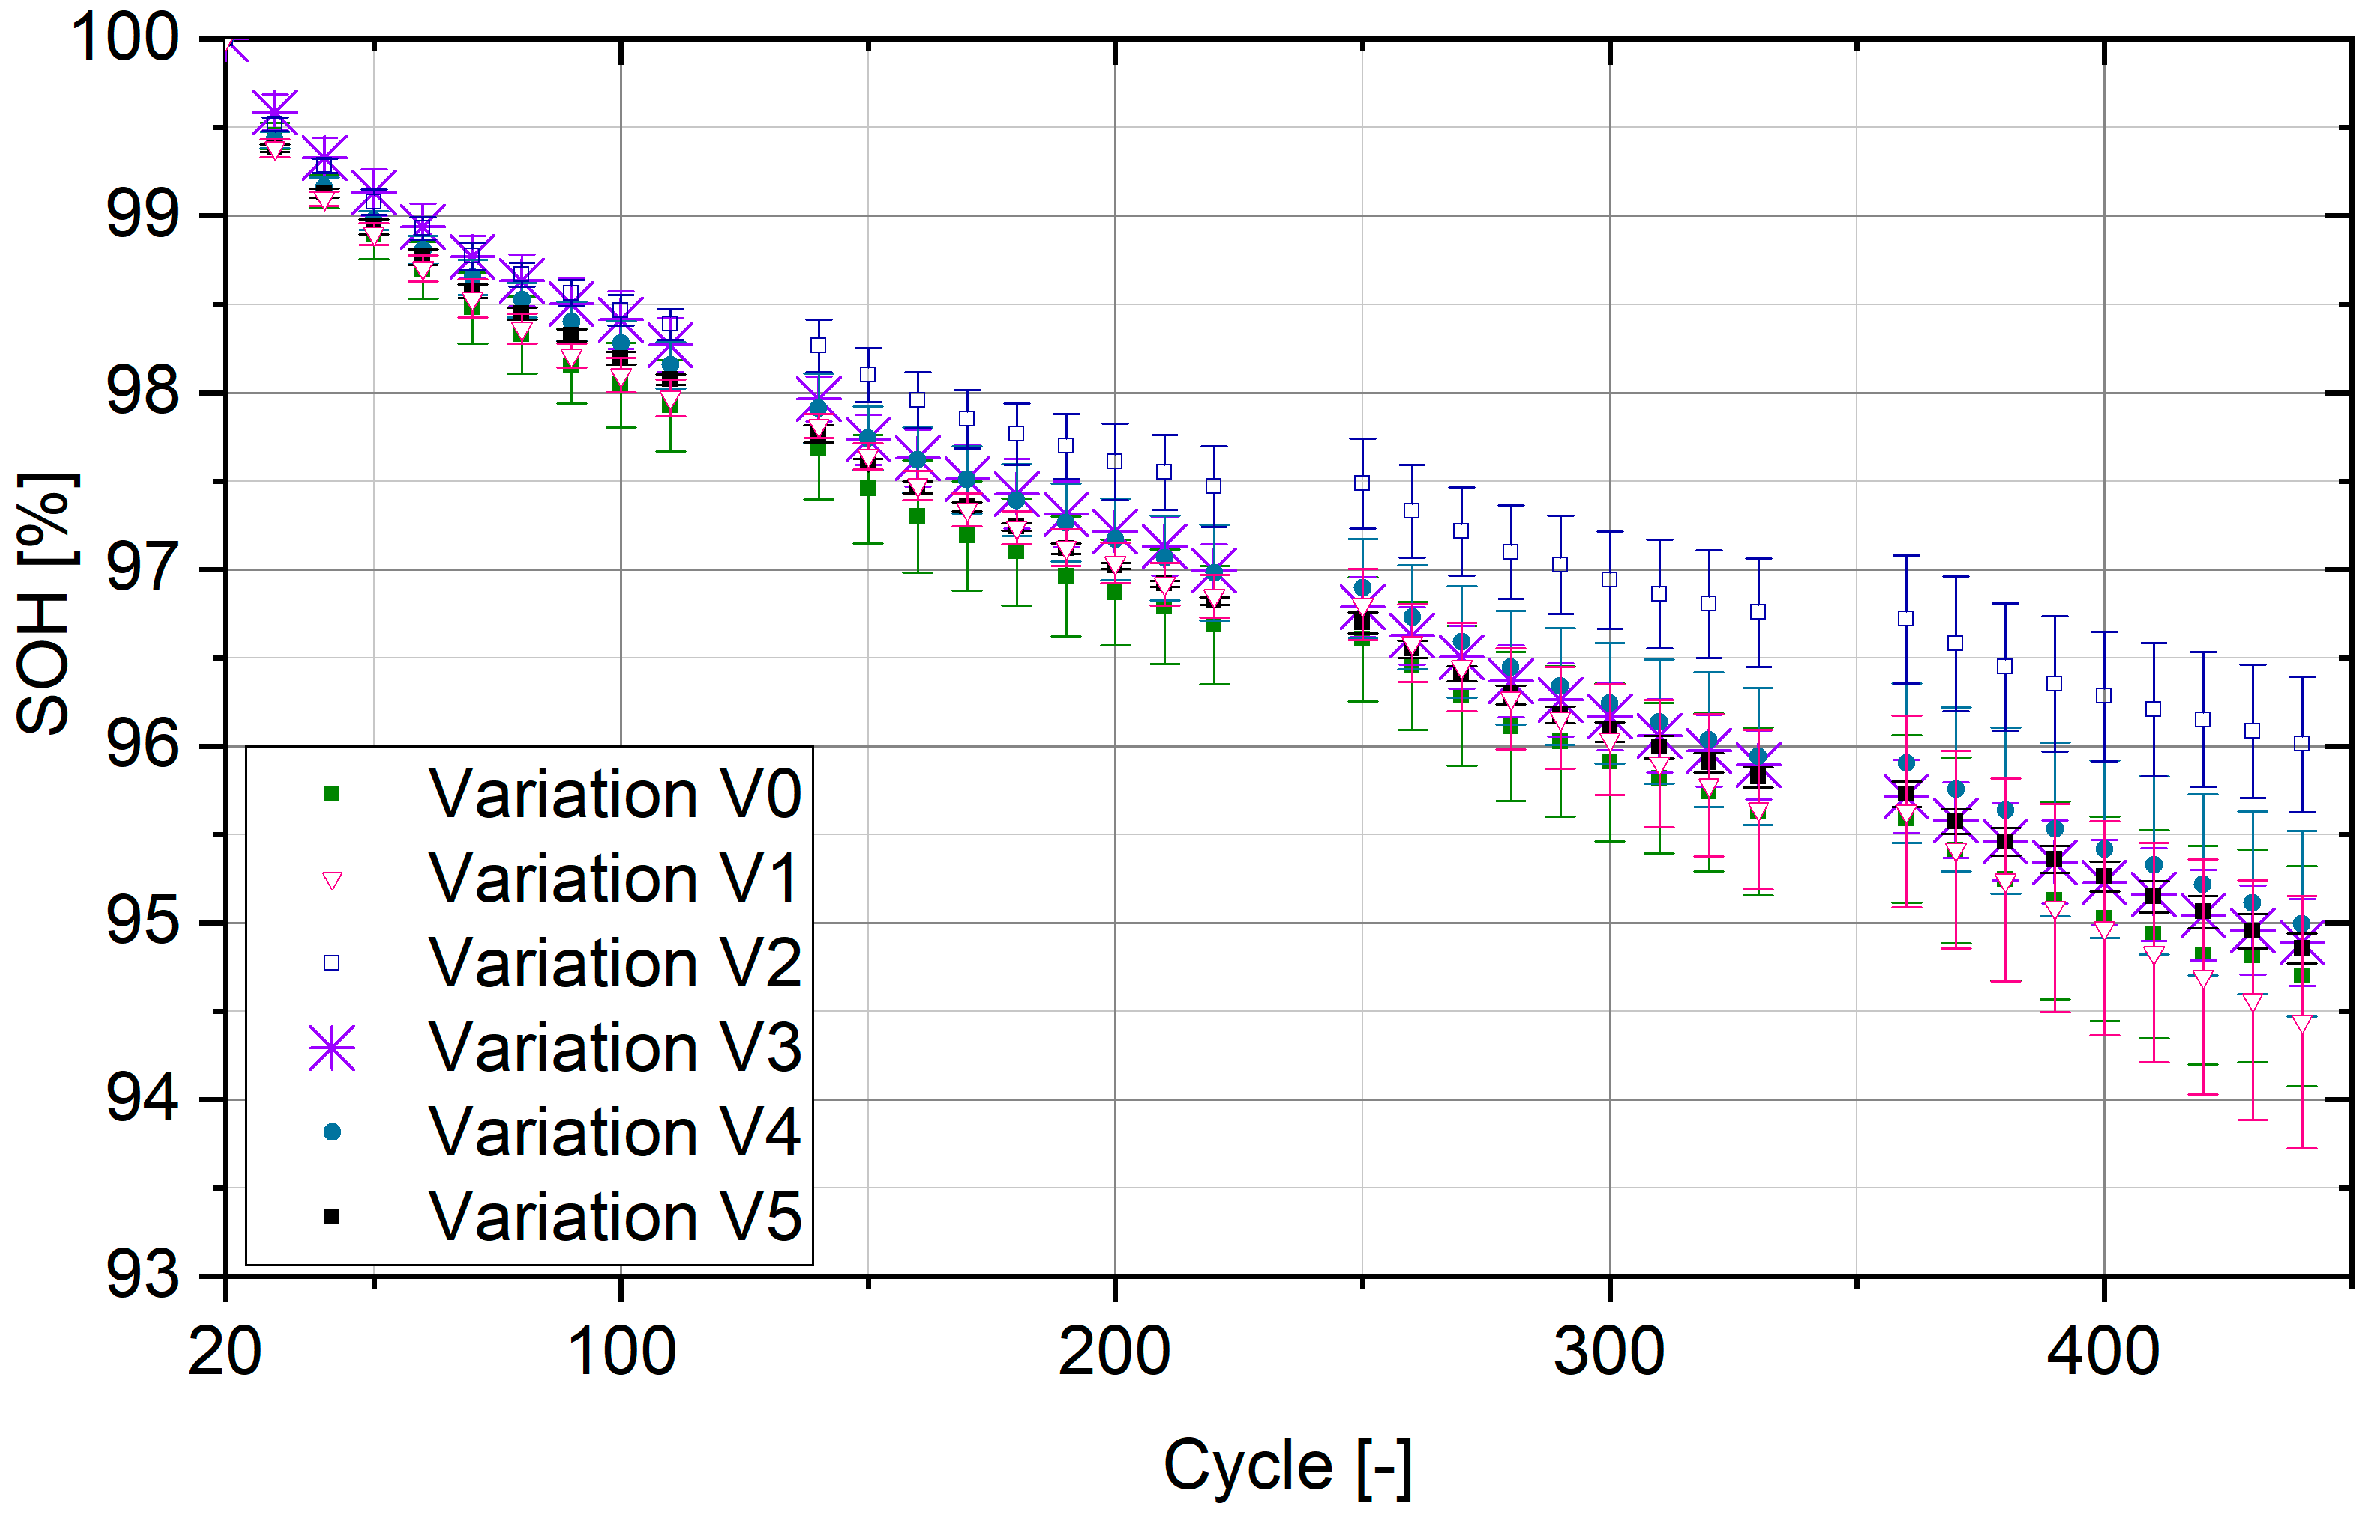
3.2. Influence of the Cutting Edge Characteristics and the Process Parameters on the Electrochemical Performance

Based on the knowledge gained from the experiments, a parameter study was developed to investigate the influence of the presented product and process properties on the electrochemical performance of the electrode, or the cell. In a first study, a cell was built with anodes and cathodes cut using the same laser and system parameters. The parameter configuration for this cell was referred to as V0 and served as a reference system for the variation of the parameter configuration. This parameter configuration was very reliable in terms of possible fluctuations in the focus position and the layer thickness. In a first limitation, it was examined whether the cutting edge on the anode side, or the cathode side, had a greater influence on the electrochemistry and, thus, the performance of the cell. In further experiments, only the cutting edge of the performance controlling electrode was examined. For the first experiments, cells with anodes (V1) and cathodes (V2) with a very large chamfer width were built. To produce this very large chamfer width, the electrodes were cut with a very high energy density and intensity. In the following, the parameters PRF (V3), Vc (V4), and τ (V5) were varied at a constant energy density at the electrode. Based on the parameter configurations shown in Table 1, it was possible to evaluate the previously presented cutting edges characteristics and process characteristics with regard to their influence on the electrochemical performance of the cell.
The evaluation of the electrochemical performance showed that the cutting edge of the cathode exerted the greater influence. Therefore, the influence of cut edge characteristics and process configurations at the cathode was investigated. In the following, the characteristics chamfer width and heat-affected zone have been shown for the examined parameter configurations V0 to V5.
The comparison of the features in Figure 12 showed that the total affected area consisting of the heat-affected zone and chamfer width was the largest for the reference parameter V0 for both the anode and the cathode. The largest chamfer width with almost identical characteristics showed the parameters V1 for the anode and V2 for the cathode. The further investigations with the parameters V3 to V5 showed, on the cathode side, the smallest influenced area with an average chamfer width of 70 μm to 80 μm.
The investigation of the influence of the presented cutting edge characteristics on the electrochemical performance was carried out by means of the cyclization routine defined in Section 2.4. The result of the diagnosis of the electrochemical performance is shown in the form of normalized cyclization curves in Figure 13. The cyclization curves showed that in comparison to the reference (V0), the cathode cutting edge (V2) exerted a significantly greater influence on the cycle stability than the anode (V1). In this case, the mean value for all cells, with the anode (V1), lied on the mean value of the reference cells (V0) with a similar standard deviation after 350 cycles. The cells with the cathode (V2) were far above this value and thus had significantly higher cycle stability. All tests to determine the influence of the chamfer width (V3–V5) on the cathode side showed that with low chamfer width, no improvement of the cycle stability could be achieved compared to V2. Since the cells V2 to V5 had higher cycle stability than the reference cells V0, the statement could be made that the heat-affected zone on the cathode side had a greater influence on the electrochemical stability of the cell than the chamfer width. Furthermore, the cycling curves of cells V3 and V5 were nearly identical after 350 cycles. From this, it could be deduced that the pulse duration or pulse peak power as process parameters did not exert a significant influence on the electrochemical performance. The cells with cathodes cut at constant line energy at reduced speed (V4) showed greater cycle stability after 350 cycles than the V3 and V5 cells. Despite the optimized process control, the cycle stability of the cells V4 was below that of V2.
The cells V3 to V5 showed a greater capacity drop than the cells from the series V2, although they had a small chamfer width and no heat-affected zone. This was an indication that in addition to the previously known and analyzed product features, another, previously unrecognized feature, influenced the electrochemical performance.

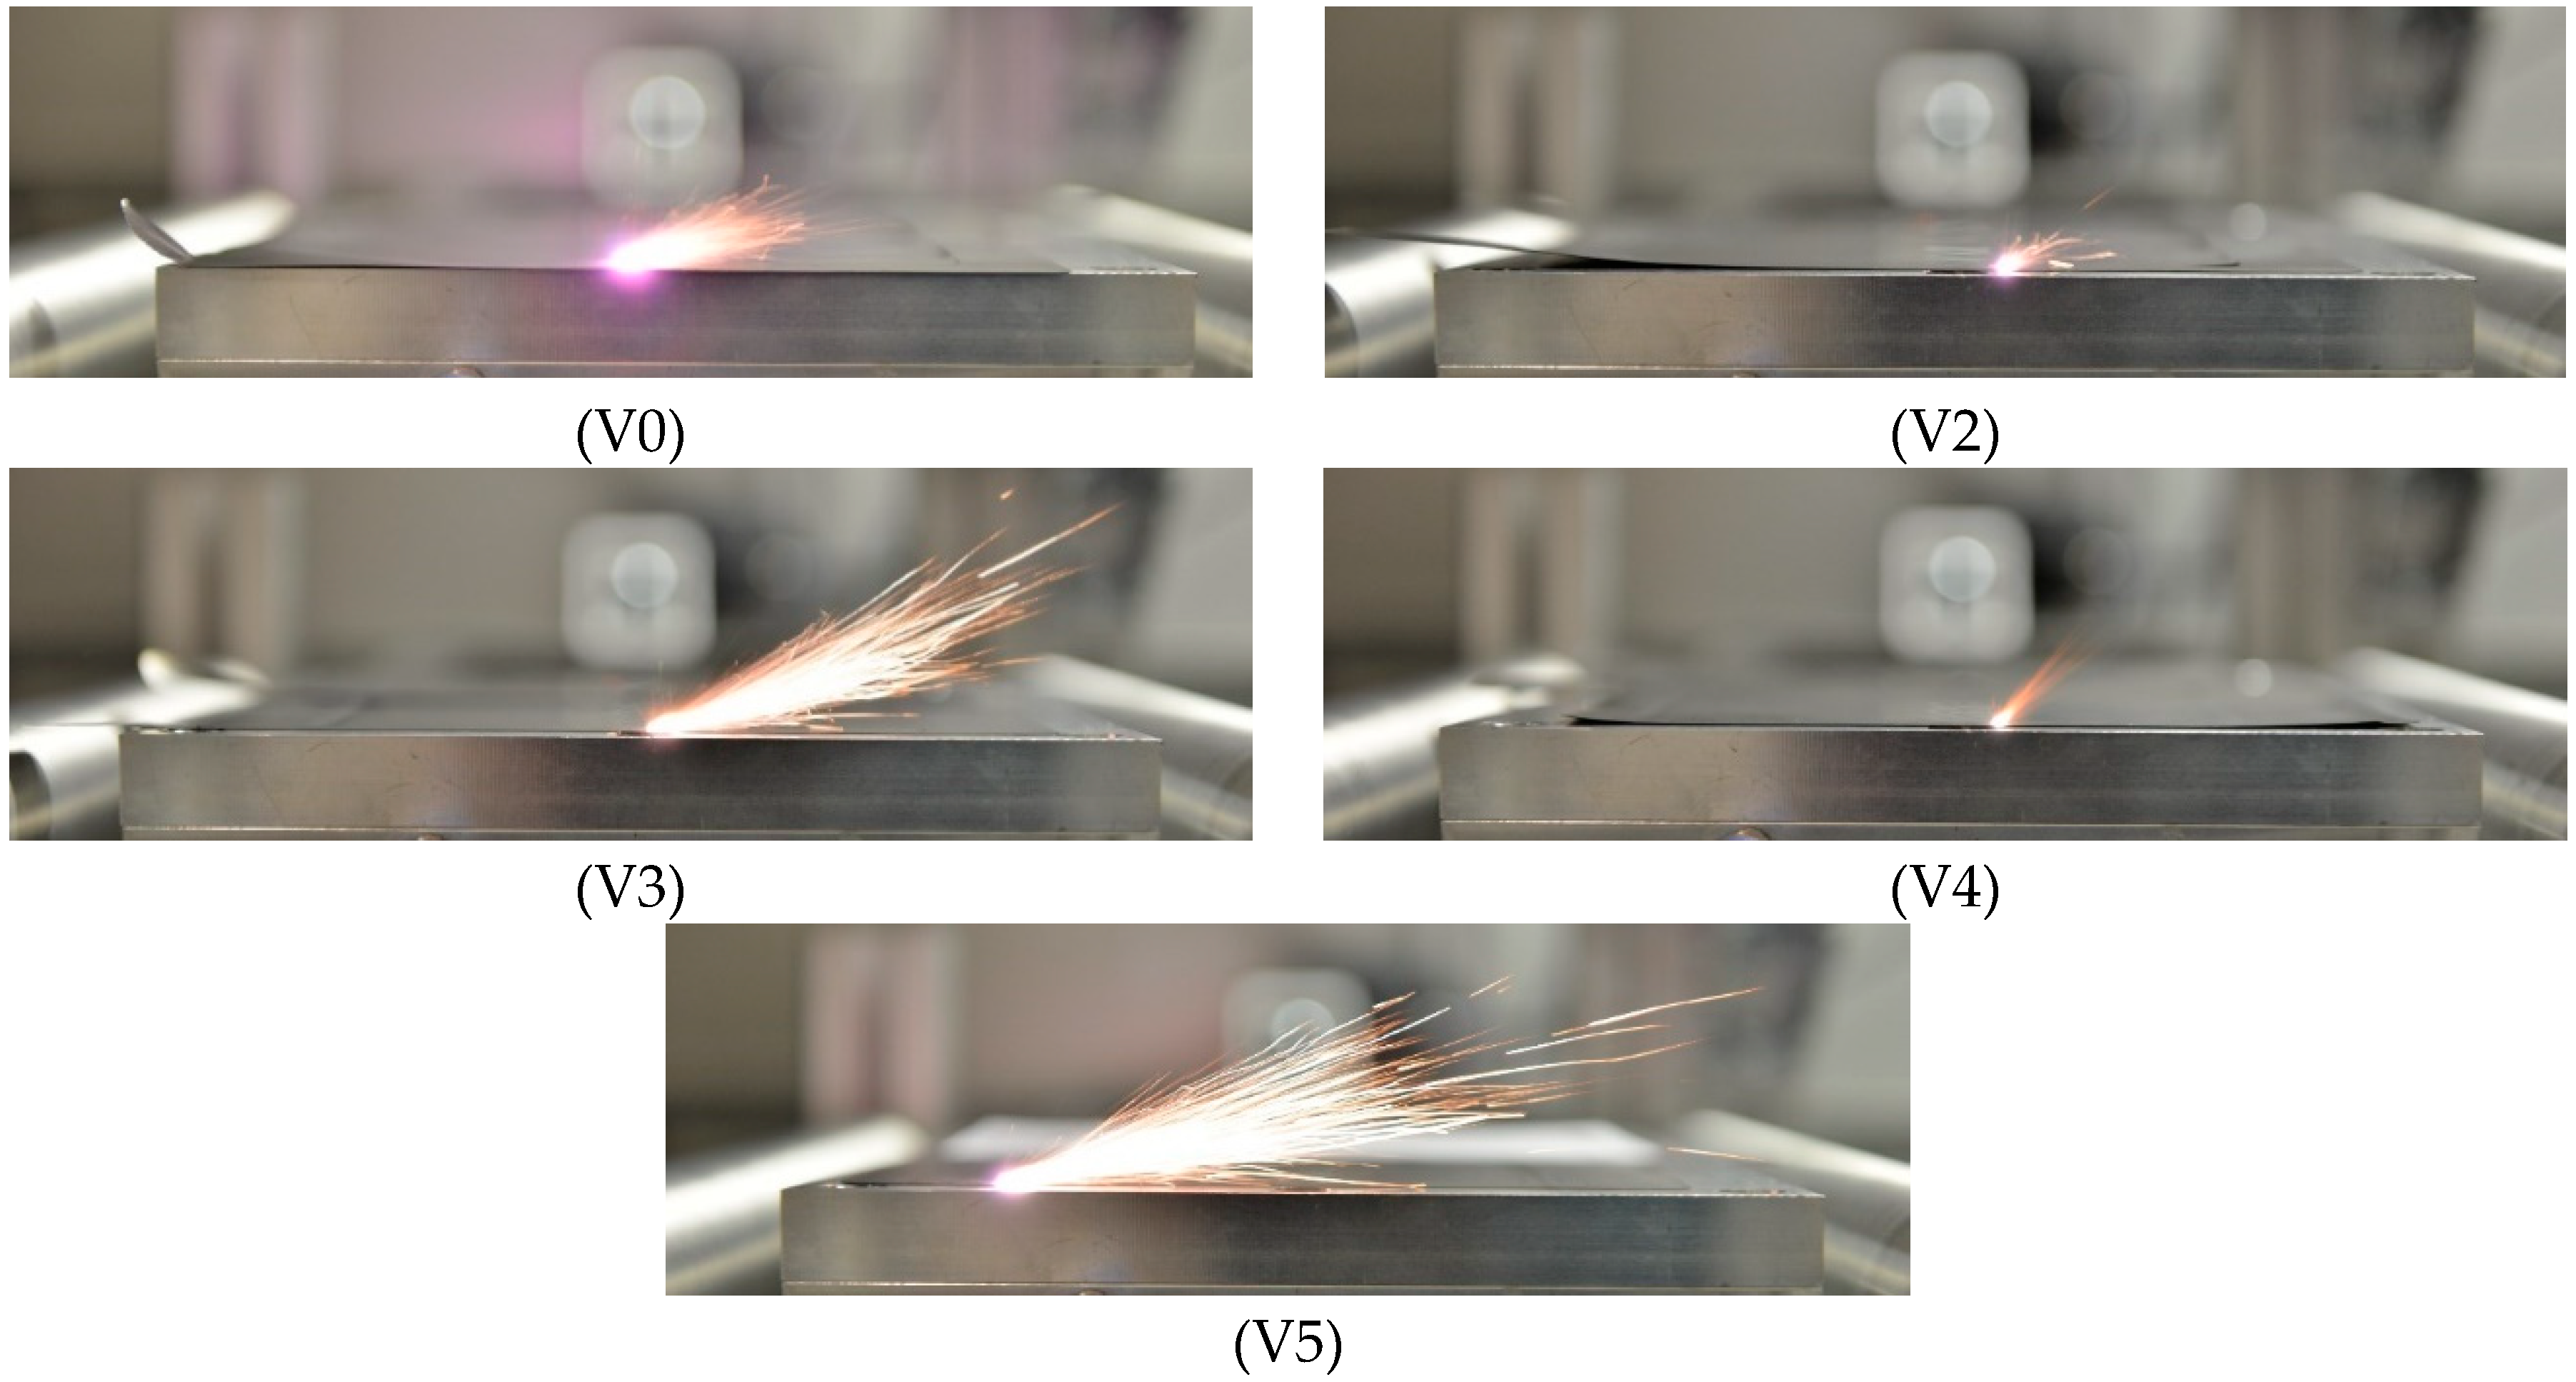
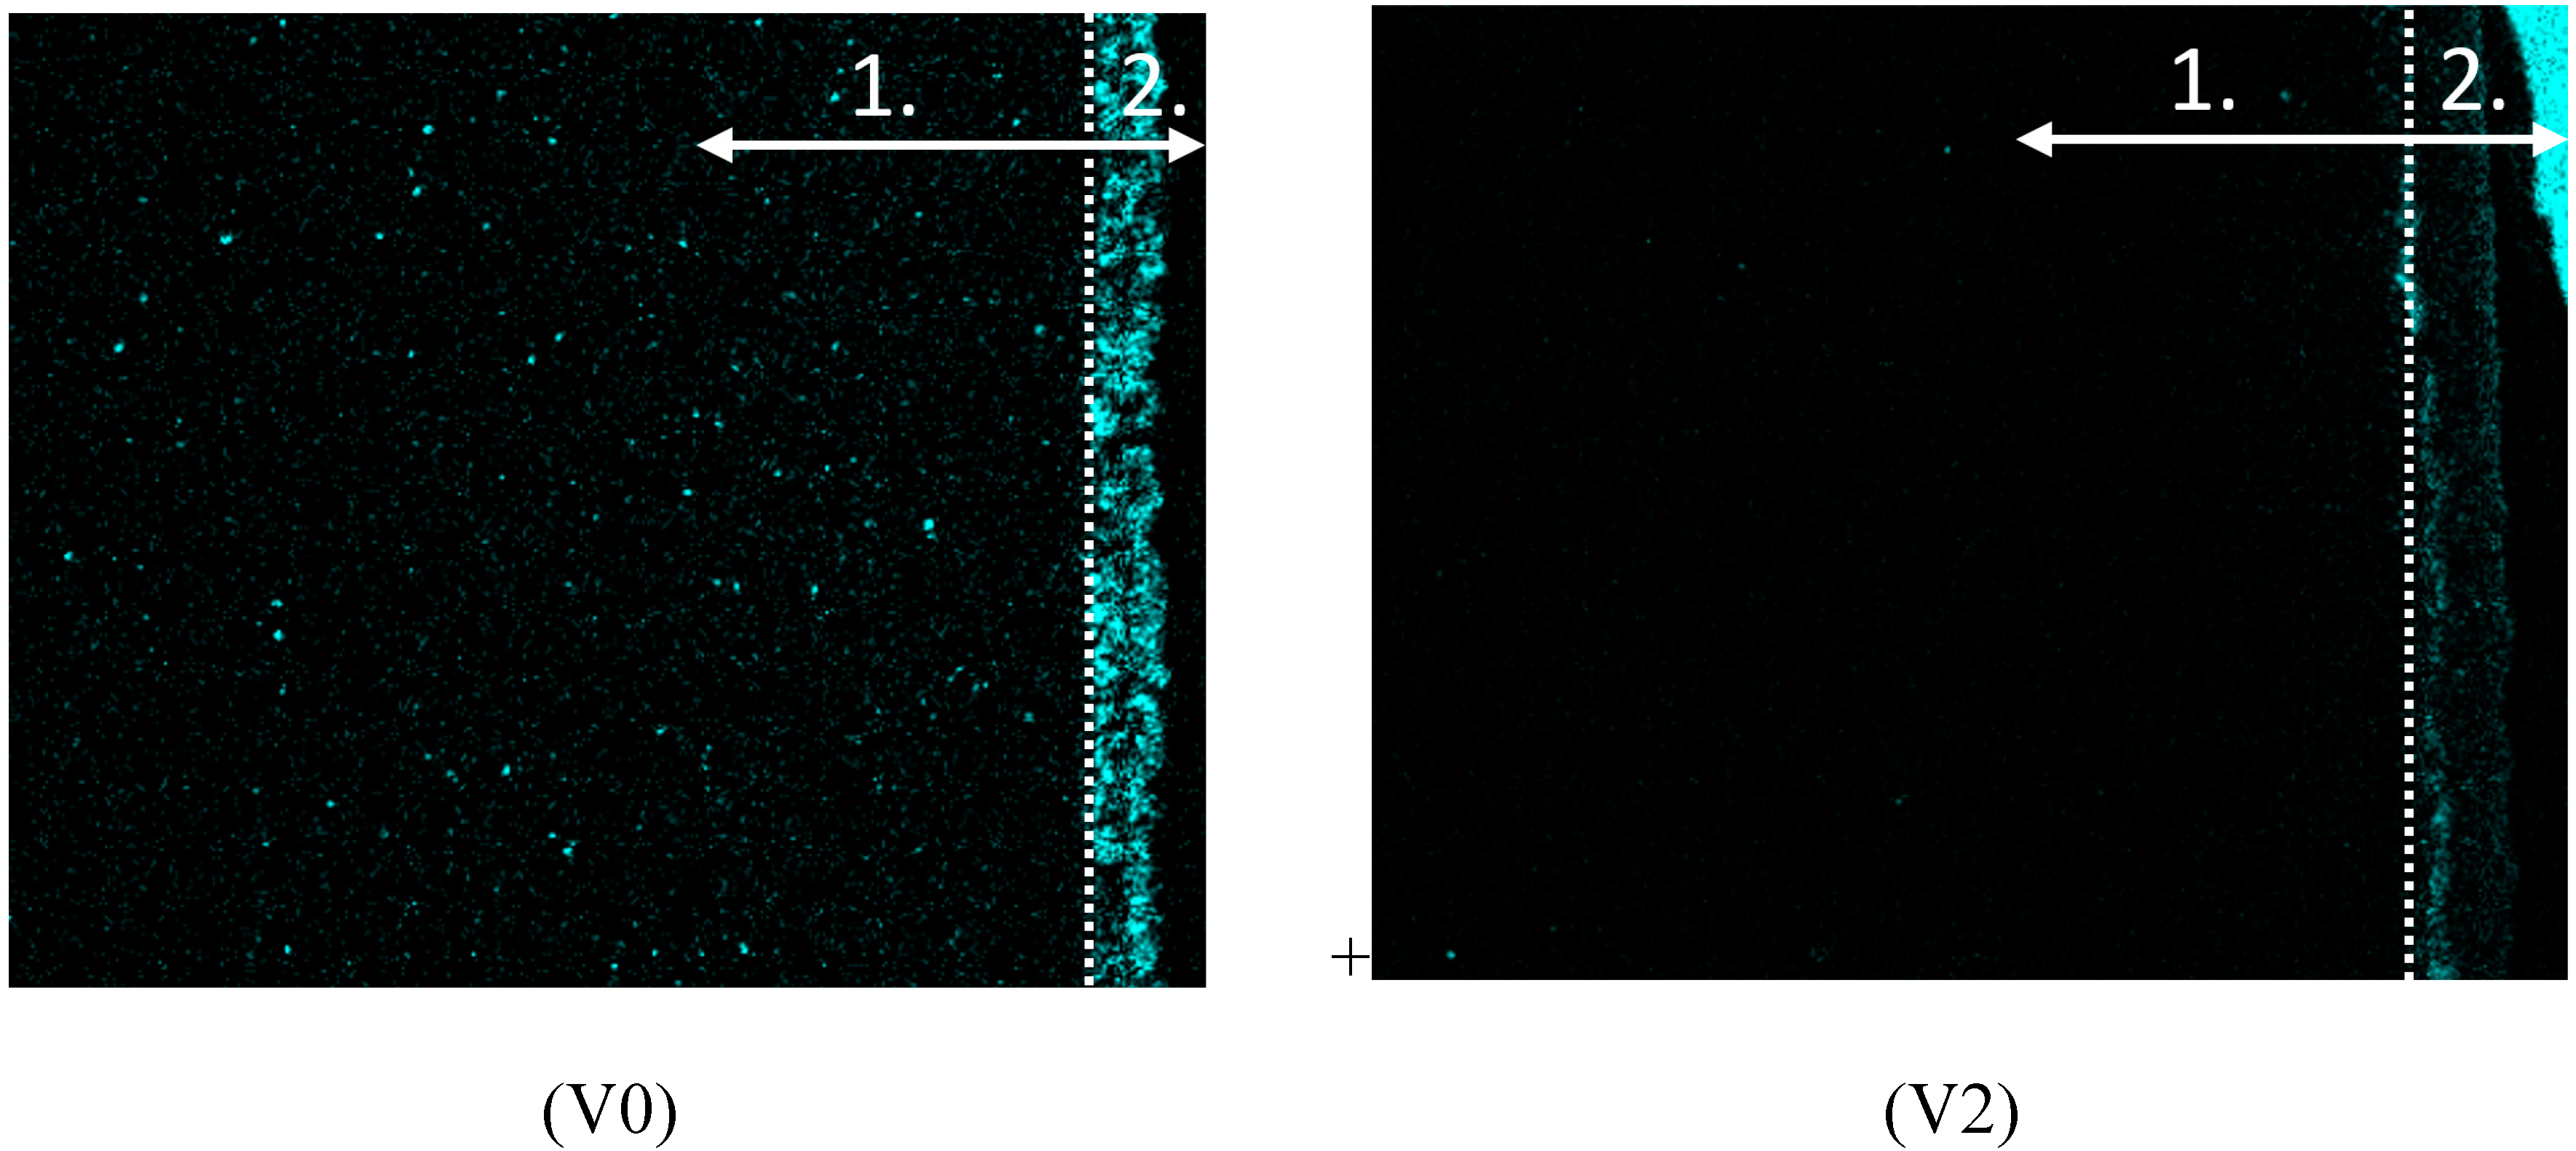
3.3. Further Investigations of the Cutting Process and the Electrode Surface to Explain the Electrochemical Behavior

In addition to the physical characteristics of the cutting edge, it was found that the different parameters led to a different degree of flying sparks, as shown in Figure 14. This could be recorded by imaging techniques. The sparking could lead to contamination of the electrode and thus affect the electrochemical performance. The images showed that with increased pulse repetition frequency (V0 → V3), the distance of the spark flight increased by 2.5 times. This could be explained by the increased number of hits if the cutting speed remained the same. If the number of hits on the active material, as well as on the solid and molten collector, increased, the number and acceleration of the ablation products would increase too. A reduction of the cutting speed with constant line energy (V4) showed a strong reduction of the sparks. The lower level of the spark formation was due to the lower energy and intensity per pulse, as well as the reduced travel speed. The profile of the sparkling flight was very similar to the sparking profile at low pulse repetition frequency and traversing speed (V2). Since variation V2 was cut with a lower pulse repetition frequency than variation V4, this could lead to less contamination of the electrode and thus explain the impairment of the performance of V4 compared to V2.
In addition to the assessment of the flying sparks, the recordings could strengthen the assumptions made in the previous sections concerning the formation of the plasma. A qualitative comparison of the images in Figure 14 showed that V0, V2, and V5 showed a clearly purple-colored plasma formation, whereas, for the other parameters—V3 and V4, the plasma presumably lied below the ablation gas phase, and thus was significantly smaller. This also explained why at shorter pulse lengths or higher pulse peak powers, the material removal and the formation of the HAZ at a constant energy density was greater.
The change in spark travel might lead to a change in the degree of contamination of the electrodes and, thus, in addition to the cut edge quality, adversely affect the electrochemical performance. The contaminations of the electrode were analyzed by SEM/EDX images and are shown in Figure 15. Contamination products in the form of metal spatters could be identified on all electrodes tested. The reference cathode had the strongest metal spatter contaminations. The lowest contamination occurred with the parameter variations V2 and V4.
These results showed that fewer sparks formation led to less contamination of the electrode surface in the area of the cutting edge. Based on the results of the electrochemical diagnosis and the analysis of the cutting edges, it could be assumed that the contaminations on the cathode surface exerted a greater influence on the electrochemical performance than the heat-affected zone and the chamfer width.

4. Conclusions

By means of a pulsed nanosecond fiber laser, electrodes could be cut without significantly affecting the cell cycle stability. The influence of the laser parameters or the cutting edge showed only a small influence on the examined variations. Considering a linear behavior, the parameter V1 led to a theoretical number of cycles of 1670 until the cells reached a state of health (SOH) of 80%. The best parameter V2 resulted in a cycle number of 1760. Since the capacity drop tended to decrease, it could be assumed that the cells would also reach higher cycles up to a SOH of 80%.
The examined characteristics—chamfer width and heat-affected zone—could be adjusted by means of the pulse duration, the pulse repetition frequency, and the cutting speed. In principle, the results showed that the chamfer width decreased with decreasing energy density or with increasing cutting speed. Furthermore, with a constant pulse duration and energy density, higher pulse repetition frequencies could result in a smaller chamfer width. This was probably due to the fact that both the decrease of the energy and the decrease of the intensity led to a geometric shift of the removal and the thermal load threshold. This shift was probably explained by the Gaussian intensity profile and the corresponding slope of the intensity in relation to the spot size, as well as by the intensity and energy-dependent formation of the plasma. The experiments with different pulse durations with the same pulse energy showed, for different pulse repetition frequencies and constant energy density, that the material removal and the thermal load, among the pure laser-material interaction, depended on the plasma or the intensity. The analysis of the size of the heat-affected zone revealed that it was essentially influenced by the pulse repetition frequencies. The cause of this dependency could be explained by the same assumptions that have been made previously for the formation of the chamfer width. Both the anode and the cathode showed similar tendencies. In general, the anode could be cut much faster than the cathode due to the double material thickness of the collector, so that the parameter space for the model development in terms of speed for the cathode turned out smaller than for the cathode.
Investigations to evaluate the influence of the chamfer width and the heat-affected zone on the electrochemical performance of large-sized multicompartment pouch cells showed that the HAZ had a greater influence than the chamfer width. Furthermore, the results showed that contamination products in the form of metal spatter influenced the electrochemical performance more than the width of the chamfer and probably also the HAZ. It could be shown by imaging techniques that with very low speeds and high intensities and pulse energies with a moderate number of hits, metal spatters could be reduced.
Furthermore, it was possible to reduce the melting spatters even for a high number of hits per surface increment with a low traversing speed, intensity, and pulse energy. The results showed, so far, that the formation of the metal spatters was a function of the number of hits per surface increment, the speed of travel, the intensity, and the energy per pulse.

5. Outlook

The results showed that the electrochemical performance of the electrodes, or the cells, was essentially affected by contamination products and less by the chamfer width or heat-affected zone investigated in this study. Based on this knowledge, it is imperative to find out which contaminations and concentrations are to be considered critical with regard to the electrochemical performance. Furthermore, the pulsed ns laser system should be used to investigate which parameters lead to which contaminations and whether the cw laser system offers process-inherent advantages with regard to the contamination of the electrode surface. On the basis of these further investigations, unknown new laser systems could be designed process-safe to fulfill the minimum requirement of four Sigma rejects.

Author Contributions

T.J. and M.W.K. wrote and edited the main parts of the paper, S.H. analyzed the REM/EDX data. L.H. analyzed the electrochemical data. W.H. analyzed the electrochemical data and administered the funding acquisition. K.D. administered the research project. All authors contributed to scientific discussions.

Funding

The results were generated in the project DaLion (03ET6089) funded by the Federal Ministry of Economic Affairs and Energy. The authors express their gratitude for the financial support by the Ministry and for the project management by the ProjektträgerJülich.

Acknowledgments

Hereby I would like to thank my student assistant Julien Essers for his technical support.

Conflicts of Interest

The authors declare no conflict of interest.

References

  1. Pachauri, R.K.; Allen, M.R.; Barros, V.R.; Broome, J.; Cramer, W.; Christ, R.; Church, J.A.; Clarke, L.; Dahe, Q.; Dasgupta, P.; et al. Climate Change 2014: Synthesis Report. Contribution of Working Groups, I. II and III to the Fifth Assessment Report of the Intergovernmental Panel on Climate Change; IPCC, Ed.; IPCC: Geneva, Switzeland, 2014. [Google Scholar]
  2. Trenberth, K.E.; Fasullo, J.T. Tracking Earth’s Energy: From El Niño to Global Warming. Surv. Geophys. 2012, 33, 413–426. [Google Scholar] [CrossRef] [Green Version]
  3. Hettesheimer, T. Strategische Produktionsplanung in Jungen Märkten. Ein Systemdynamischer Ansatz zur Konzeption und Dynamischen Bewertung von Produktionsstrategien am Beispiel der Lithium-Ionen-Traktionsbatterie; Fraunhofer Verlag: Stuttgart, Germany, 2018; ISBN 978-3-8396-1275-0. [Google Scholar]
  4. Schüneman, J.-H. Modell zur Bewertung der Herstellkosten von Lithiumionenbatteriezellen; Sierke Verlag: Göttingen, Germany, 2015; ISBN 978-3-86844-704-0. [Google Scholar]
  5. Choi, J.W.; Aurbach, D. Promise and reality of post-lithium-ion batteries with high energy densities. Nat. Rev. Mater. 2016, 1, 359. [Google Scholar] [CrossRef]
  6. Ding, Y.; Cano, Z.P.; Yu, A.; Lu, J.; Chen, Z. Automotive Li-Ion Batteries: Current Status and Future Perspectives. Electrochem. Energy Rev. 2019, 2, 1–28. [Google Scholar] [CrossRef]
  7. Albright, G. Cylindrical vs. Prismatic Cells: Life, Safety, Cost. Available online: http://www.batterypoweronline.com/images/ Allcell.pdf (accessed on 3 October 2019).
  8. Schröder, R.; Aydemir, M.; Seliger, G. Comparatively Assessing different Shapes of Lithium-ion Battery Cells. Procedia Manuf. 2017, 8, 104–111. [Google Scholar] [CrossRef]
  9. Beuth Verlag GmbH. DIN 8588:2013-08, Fertigungsverfahren Zerteilen_- Einordnung, Unterteilung, Begriffe; Beuth Verlag GmbH: Berlin, Germany, 2013. [Google Scholar]
  10. Jansen, T.; Kandula, M.W.; Blass, D.; Hartwig, S.; Haselrieder, W.; Dilger, K. Evaluation of the Separation Process for the Production of Electrode Sheets. Energy Technol. Available online: https://www.researchgate.net/publication/333333666_Evaluation_of_the_Separation_Process_for_the_Production_of_Electrode_Sheets (accessed on 10 October 2019).
  11. Jansen, T.; Blass, D.; Hartwig, S.; Dilger, K. Processing of Advanced Battery Materials—Laser Cutting of Pure Lithium Metal Foils. Batteries 2018, 4, 37. [Google Scholar] [CrossRef] [Green Version]
  12. Hoffmann, L.; Grathwol, J.-K.; Haselrieder, W.; Leithoff, R.; Jansen, T.; Dilger, K.; Dröder, K.; Kwade, A.; Kurrat, M. Capacity Distribution of Large Lithium-Ion Battery Pouch Cells in Context with Pilot Production Processes. Energy Technol. 2019, 21, 1900196. [Google Scholar] [CrossRef]
  13. Kreling, S. Laserstrahlung mit Unterschiedlicher Wellenlänge zur Klebvorbehandlung von CFK; Shaker: Aachen, Germany, 2015; ISBN 9783844037685. [Google Scholar]
  14. Bliedtner, M. Lasermaterialbearbeitung; Carl Hanser Verlag GMBH: München, Germany, 2013; ISBN 9783446421684. [Google Scholar]
  15. Chichkov, B.N.; Momma, C.; Nolte, S.; Alvensleben, F.; Tünnermann, A. Femtosecond, picosecond and nanosecond laser ablation of solids. Appl. Phys. A 1996, 63, 109–115. [Google Scholar] [CrossRef]
  16. Sundaram, S.K.; Mazur, E. Inducing and probing non-thermal transitions in semiconductors using femtosecond laser pulses. Nat. Mater. 2002, 1, 217–224. [Google Scholar] [CrossRef]
  17. Sugioka, K.; Meunier, M.; Piqué, A. Laser Precision Microfabrication; Springer-Verlag: Heidelberg, Germany; New York, NY, USA, 2010; ISBN 978-3-642-10522-7. [Google Scholar]
  18. Stafe, M.; Marcu, A.; Puscas, N. Pulsed Laser Ablation of Solids; Springer-Verlag: Berlin, Germany; Heidelberg GmbH & Co. KG: Heidelberg, Germany, 2013; ISBN 978-3-642-40977-6. [Google Scholar]
  19. Luetke, M.; Franke, V.; Techel, A.; Himmer, T.; Klotzbach, U.; Wetzig, A.; Beyer, E. A Comparative Study on Cutting Electrodes for Batteries with Lasers. Phys. Procedia 2011, 12, 286–291. [Google Scholar] [CrossRef]
  20. Lee, D. Investigation of Physical Phenomena and Cutting Efficiency for Laser Cutting on Anode for Li-Ion Batteries. Appl. Sci. 2018, 8, 266. [Google Scholar] [CrossRef] [Green Version]
  21. Lee, D.; Oh, B.; Suk, J. The Effect of Compactness on Laser Cutting of Cathode for Lithium-Ion Batteries Using Continuous Fiber Laser. Appl. Sci. 2019, 9, 205. [Google Scholar] [CrossRef] [Green Version]
  22. Lee, D.; Patwa, R.; Herfurth, H.; Mazumder, J. High speed remote laser cutting of electrodes for lithium-ion batteries: Anode. J. Power Sources 2013, 240, 368–380. [Google Scholar] [CrossRef]
  23. Kronthaler, M.R.; Schloegl, F.; Kurfer, J.; Wiedenmann, R.; Zaeh, M.F.; Reinhart, G. Laser Cutting in the Production of Lithium Ion Cells. Phys. Procedia 2012, 39, 213–224. [Google Scholar] [CrossRef] [Green Version]
  24. Lutey, A.H.A.; Fortunato, A.; Carmignato, S.; Ascari, A.; Liverani, E.; Guerrini, G. Quality and Productivity Considerations for Laser Cutting of LiFePO4 and LiNiMnCoO2 Battery Electrodes. Procedia CIRP 2016, 42, 433–438. [Google Scholar] [CrossRef]
  25. Demir, A.G.; Previtali, B. Remote cutting of Li-ion battery electrodes with infrared and green ns-pulsed fibre lasers. Int. J. Adv. Manuf. Technol. 2014, 75, 1557–1568. [Google Scholar] [CrossRef] [Green Version]
  26. Cabalín, L.M.; Laserna, J.J. Experimental determination of laser induced breakdown thresholds of metals under nanosecond Q-switched laser operation. Spectrochim. Acta Part B At. Spectrosc. 1998, 53, 723–730. [Google Scholar] [CrossRef]
Figure 1. Influence of the reject rate of every single process on the total reject rate of a cell production line.
Batteries 05 00073 g001
Figure 2. Relevant primary process parameters and material properties of a continuous wave (cw) and pulsed laser cutting process for electrodes [10,12].
Batteries 05 00073 g002
Figure 3. Laser scanning microscope image of a laser-cut electrode (left); Ablation thresholds depending on the number of hits, intensity, pulse fluence, energy density, as well as the laser- and corresponding plasma-intensity-profile (right): (a) cut-through threshold, (b) ablation threshold, and (c) thermic influencing threshold [10].
Batteries 05 00073 g003
Figure 4. Time-scaled processes during a laser pulse material interaction, based on [16,17].
Batteries 05 00073 g004
Figure 5. Analysis of the prescriptive cutting edge characteristics: (a) Schematic microsection of a laser-generated cutting edge, 1. Chamfer width (chw), 2. The heat-affected zone (HAZ), 3. Melt formation, 4. Ablation, 5. Melt superelevation, α Chamfer angle; (b) LSM image of a cutting edge; (c) Analysis of a cutting edge by LSM data, based on [10].
Batteries 05 00073 g005
Figure 6. Cell format and pouch cell design: (a) Electrode format, (b) Complete pouch cell.
Batteries 05 00073 g006
Figure 7. Laser cutting plant: (a) Front view of the laser cutting plant; (b) Negative form.
Batteries 05 00073 g007
Figure 8. Model for the influence of the pulse repetition frequency and cutting speed on the anode cutting edge: 72 w, 240 ns; (a) Influence on the chamfer width (Cubic fitting: R2 = 0.77, Adjusted R2 = 0.75, Predicted R2 = 0.73); (b) Influence on the heat-affected zone (Cubic fitting: R2 = 0.94, Adjusted R2 = 0.93, Predicted R2 = 0.93).
Batteries 05 00073 g008
Figure 9. Model for the influence of the pulse repetition frequency and cutting speed on the cathode cutting edge: 72 w, 240 ns; (a) Influence on the chamfer width (Cubic fitting: R2 = 0.91, Adjusted R2 = 0.90, Predicted R2 = 0.88); (b) Influence on the heat-affected zone (Cubic fitting: R2 = 0.94, Adjusted R2 = 0.93, Predicted R2 = 0.92).
Batteries 05 00073 g009
Figure 10. Influence of the pulse duration at different pulse repetition frequencies on the chamfer width and heat-affected zone of the anode (a) and the cathode (b) cutting edge.
Batteries 05 00073 g010
Figure 11. Influence of the intensity and the number of hits per area increment on the chamfer width at a constant energy density of 328 jcm−2.
Batteries 05 00073 g011
Figure 12. Response to the parameters, shown in Table 1.
Batteries 05 00073 g012
Figure 13. Capacity fading during the long-time cyclization of the investigated electrode/cell configuration.
Batteries 05 00073 g013
Figure 14. Optical process investigations regarding the flying sparks.
Batteries 05 00073 g014
Figure 15. SEM/EDX analysis of the cathode surface next to the cutting edge: Contamination of the surface by molten aluminum splashes are marked turquoise: 1. Electrode surface, 2. Cut zone.
Batteries 05 00073 g015aBatteries 05 00073 g015b
Table 1. Set laser parameters to investigate the impact on electrochemical performance.
ParameterUnitV0V1V2
AnodeVcmms–130050300
PRFkHz707070
τns240240240
EDjcm–23281968328
IPeakWcm–23.02 × 1083.02 × 1083.02 × 108
nline-1710317
CathodeVcmms–130050300100300
PRFkHz7070490490490
τns24024024024020
EDjcm–23281968328328328
IPeakWcm–23.02 × 1083.02 × 1080.17 × 1080.1 × 1082.09 × 108
nline-17103120362120
Cutting speed (Vc), Pulse repetition frequency (PRF), Pulse duration (τ), Energy density (ED), Intensity (IPeak), Number of laser pulses per surface increment (nline).

