Abstract
High manufacturing cost and thermal stability of Li-ion battery cells are currently the two main deterrents to prolific demand for electric vehicles. A plausible solution to this issue is a modular/scalable battery thermal management system (TMS). A modular TMS can ensure thermal reliability for battery cells of different capacities and size without needing major structural revision besides facilitating mass-production. However, understanding the relationship of heat generation rates with cell capacity and thickness is essential for developing a scalable TMS. The present paper discusses results derived from an experimental investigation undertaken with this purpose. Heat generation rates for LiFePO4 pouch cells of different nominal capacities are measured at discharge rates of 0.33C, 1C and 3C in ambient temperatures ranging between −10 and 50 °C using a custom-designed calorimeter. It is observed that heat generation rates of the LiFePO4 pouch cells become independent of their nominal capacity and thickness if the ambient temperature is regulated at 35 °C. In ambient temperatures lower than 35 °C though, the thin battery cells are found to be generating heat at rates greater than those of thick battery cells and vice-versa at temperatures over 35 °C for all discharge rates.
1. Introduction
Lithium ion (Li-ion) battery packs, as the energy storage system, are at present the largest shareholder controlling 45.3% of the cost of an electric vehicle (EV) [1]. The International Organisation for Standardisation (ISO) recommends that in order to get a quicker return on investment, a basic standard cell design should be used for all EV battery packs [2,3,4,5]. One of the major drawbacks of this standard design though is the thermal stability of Li-ion battery cells. A number of studies have reported that operating a Li-ion battery cell at elevated temperatures can accelerate chemical changes such as electrolytic corrosion, loss of active material, and solid electrolyte interphase growth in cells [6,7,8,9,10,11,12,13,14]. It can also lead to permanent blockage of Li-ion intercalation sites and associated decrease in the electrodes’ surface area available for electrochemical reaction. The phenomenon is termed as irreversible loss of capacity and as per the estimates of Santhanagopalan et al., it could occur over five times faster if the cell is cycled at 45 °C than that at 15 °C [15]. Then, cycling a Li-ion battery cell at temperatures over 85 °C carries a potential risk of an electrochemical breakdown of the anode ultimately pushing the cell into a state of thermal runaway [16,17]. On the other hand, Li-ion batteries are also affected by a largely limited electrode activity and poor charge kinetics at low temperatures. For instance, it was reported that driving range of the Nissan LEAF 2012 drops substantially from 138 miles in ideal conditions to 63 miles in operating temperature of −10 °C [18]. Maintaining battery cell temperature within the recommended limits is thus crucial for safe and efficient operation of Li-ion battery packs.
Evolution of cell temperature profile depends on net energy balance between heat generated and heat dissipated from the battery cell via various mechanisms during charging and discharging duration. Therefore, a deeper understanding of the magnitude of the heat generated by a battery cell and the rate at which it is generated is necessary for reliable and safe cell operation. Although the total heat generation in an operational battery is generally approximated by the sum of the reversible heat and the irreversible heat, it contains other temperature-dependent forms of heat as well. These are the heat of mixing and the heat of phase transition [19]. Ideally, a numerical model is desirable to analyse the key aspects and behavioural change of different components of the total heat. However, owing to the complexity of an electrochemical system, importance of experimental study cannot be undermined [20,21].
Heat generation rate for batteries can be measured experimentally either under isothermal or adiabatic conditions using a commercial or a custom-built calorimeter. In an isothermal heat conduction calorimeter (IHC), battery surface temperature is maintained constant by keeping the cell in full contact with a large heat sink. However, the IHCs tend to produce erroneous results at high discharge rates due to limited heat dissipation ability of the heat sink [22,23]. Naturally, studies involving such calorimeters have been limited to coin cells and small cylindrical cells cycled at low discharge rates [24,25,26,27,28,29,30,31,32,33]. Accordingly, insights gained through them cannot be applied directly to design of a thermal management system (TMS) for large batteries such as those used in EVs. In view of this, it is important to mention a custom-built IHC design, capable of testing comparatively large pouch cells, recently disclosed by Xiao and Choe. The design is based on two thermoelectric devices working as heat pumps and facilitates measurement of heat generation rate of a 15.7 Ah LMO/carbon pouch cell [34].
In contrast adiabatic calorimeters, otherwise known as accelerated rate calorimeters (ARCs) can be used to evaluate battery heat generation rates under normal as well as abusive environments. The ARCs allow the battery cell temperature to increase over time while recording thermal response of the calorimetric material as it transmits heat rejected by the battery cell during the charging/discharging process to a constant temperature heat sink. This information coupled with energy balance between the heat sink and the battery cell is later used to assess the battery heat generation rates [21]. Similar to the IHCs, ARCs too have been previously used by several research groups for analysing thermal behaviour of Li-ion battery cells. A detailed list of all these attempts is available in the report of Schuster et al. along with the data on total heat generated by a 40 Ah LMO/graphite pouch cell for discharge rates ranging between 0.125C and 1C [35]. Among these, the work of Chen et al. [20] is of particular interest mainly because of the wide range of ambient temperatures (−10 to 40 °C) and discharge rates (0.25C to 3C) used for analysing the thermal behaviour of A123 20 Ah pouch cell. It should however be noted that the HDPE slabs, i.e., the calorimetric material, were the only thermal contacts of the test battery cell and no heat sink or any other mechanism for maintaining an isothermal battery surface temperature was incorporated in their calorimeter design. Moreover, according to the details provided, an insulating cover was placed to minimise the heat transfer from the top surface to the surroundings. Schuster et al. have still categorised the custom-designed calorimeter used by Chen et al. as an IHC calorimeter in their list. In a subsequent study, Lin et al. used an ARC to investigate the heat generation characteristics of a 40 Ah pouch cell discharged at 0.33C, 1C, and 2C and at ambient temperatures between −15 and 40 °C [36]. Besides these, a technique based on direct measurements of heat generation rates with a heat flux sensor was recently demonstrated by Drake et al. [37].
2. Purpose of the Present Investigation
It should be acknowledged that the heat generated by a battery of specific chemistry depends on reaction kinetics. Reaction kinetics, in turn, are strongly influenced by operating conditions, namely discharge rate and ambient temperature, and cell design parameters like active particle size, Li-ion diffusion coefficient, cell/electrode thickness etc. [38]. With the information already available in public domain, it might not be too difficult to model the effect of operating conditions on thermal behaviour of a Li-ion pouch cell. However, not many authors have investigated the impact of cell design parameters on heat generation rates of a battery cell suitable for an EV application. Moreover, Table 1 shows that a large variation exists in the nominal capacity of battery cells used in commercially available passenger EVs. With the ISO recommending minimum capacities of 40 and 60 Ah for the two classes of EVs—BEV1 and BEV2, respectively—it is anticipated that scaling up the basic cell design to meet energy requirements of different applications might soon become a general practice. From an engineering perspective, it would thus be beneficial to learn if the nominal capacity of a battery and associated cell thickness has any effect on battery heat generation rates or not. The focus of this research project is therefore on examining the heat generation behaviour of the C/LiFePO4 pouch cells in relation to their nominal capacities. For the sake of this investigation, commercial battery cells of different capacities are sourced from the same manufacturer.

Table 1.
Battery pack size of commercially available passenger electric cars along with nominal capacity of Li-ion cells used in their assembly (adapted from [39]).
3. Experimental
In this work, a test station was constructed using a four-channel, 20 V-100 A battery cycler and a programmable thermal chamber. Commercially available pouch cells with nominal capacities of 8, 15, and 20 Ah were procured from Benergy Tech Co. Ltd., Guangzhou, China, to serve as test batteries. Additionally, an A123 20 Ah LiFePO4 pouch cell was used as a control sample. The parameters characterising physical dimensions of these cells are specified in Table 2.

Table 2.
Physical dimensions of the test battery cells and the A123 20 Ah control sample used in this investigation.
Heat generation rates for batteries operating under varied conditions are generally estimated through a custom-designed calorimeter having known thermal characteristics. Chen et al. introduced an ARC that can be used for characterising heat generation rates for any pouch cell, regardless of cell chemistry. It had a pouch cell sandwiched between two high-density polyethylene (HDPE) slabs, each of them being five times thicker than the pouch cell [20]. However, it was designed for battery cells having high surface area to thickness ratios. Figure 1 shows surface temperature recorded for the three test battery cells subjected to a heat generation characterisation procedure in a sandwich-structured calorimeter proposed by them. Operating temperature was regulated at 10 °C and the constant discharge rate of 2C was maintained using the Arbin BT2000 cycler. Note that for the purposes of this investigation, the operating temperature was the same as ambient temperature and thus both the terms are used interchangeably here. Additionally, steady-state battery surface temperature was noted to be 1~1.2 °C less than the temperature of the thermal chamber for all the experiments.
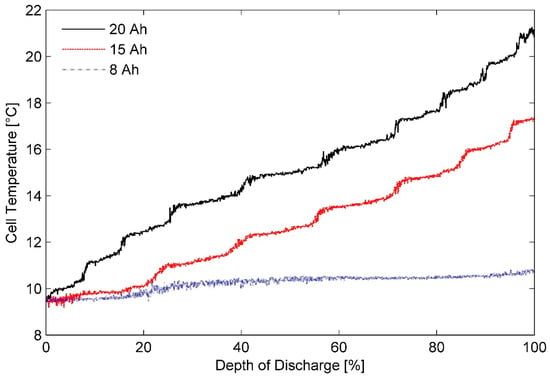
Figure 1.
Battery cell temperature variation for different batteries discharged using 2C current rate in a sandwich-structured calorimeter in ambient temperature of 10 °C.
An ARC should not exchange any heat with its surroundings. It should in fact present a large thermal resistance to them [59]. Nonetheless, Figure 1 illustrates that the thick battery cells are exposed to the ambient environment to a greater degree than the thin pouch cells in the sandwich structured calorimeter. It is therefore evident that thickness of pouch cells is a major factor influencing the effectiveness of this design. Accordingly, to minimise the heat leakage in the present investigation, the aforementioned calorimeter was modified by making the battery cells to sit in slots, made to their size, in the HDPE slabs.
Figure 2 presents (a) schematic of the modified battery calorimeter and (b) surface temperatures measured for the three test batteries at a 3C discharge rate in an operating temperature of 5 °C using the modified set-up. Uniform increase in the surface temperatures for all the three battery cells is seen in Figure 2b. It reflects on the improved capability of the modified calorimeter to test both the thick cells and the thin cells, particularly in harsh operating conditions, i.e. low ambient temperature and high discharge rate.
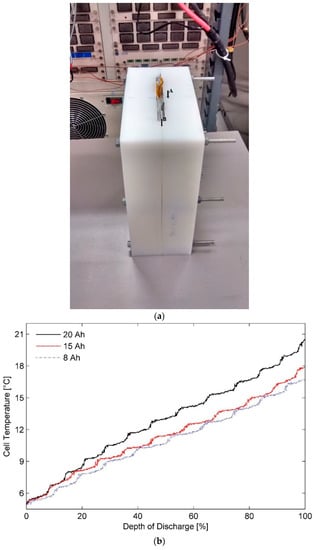
Figure 2.
(a) Modified battery calorimeter, markers showing thermal sensor location, and (b) surface temperature variation for batteries of different capacities in modified calorimeter at the ambient temperature of 5 °C and discharge rate of 3C.
Effective heat transfer from battery cell surface to the HDPE slabs was ensured via application of a layer of silver metal-oxide based thermal grease (thermal conductivity ~3.17 W/m-K and specific gravity ~2.4 ) on the contact surfaces. This modified calorimeter was used in the following test procedure.
3.1. Test Procedure
The constant current (CC) and constant voltage (CV) mode was adopted to fully charge the battery cells. Under this charging regime, all the three test battery cells were first charged at 0.33C till a maximum allowable voltage of 3.65 V was reached. Thereafter, they were taper-charged to a cut-off current of 0.05C while a constant terminal voltage of 3.65 V was maintained. For the A123 20 Ah cell also, the CC-CV mode was applied. However, the current corresponding to the CC stage of the A123 cell was 0.5C and the cut-off current tapered to 0.05C during the CV stage with the cell voltage maintained at 3.6 V. Before starting the test, the test battery cells were fully charged and discharged for a few times. For the discharge process, a 0.5C rate was used for all the cells with the lower cut-off voltage set to 2.0 and 2.5 V for the A123 20 Ah cell and the three test battery cells, respectively. The step serves dual purposes. Firstly, it allows time for development of the solid electrolyte interphase film and prevents corruption of the measured values due to absence of film resistance. Cell capacity available for a specific set of discharge conditions stabilises at the end of this step. Secondly, it functions as a quick quality check for expected performance standards from the three commercial test battery cells.
Prior to the heat characterisation test, the calorimeter was soaked for 12 h in a constant temperature air bath provided by the programmable thermal chamber to minimize the temperature gradient between the calorimeter and the surroundings and hence achieve the approximately ideal condition of zero heat transfer. Afterwards, galvanostatic discharge tests were conducted for all the three test battery cells at ambient temperatures of –10, 5, 20, 35, and 50 °C and the discharge rates of 0.33C, 1C, and 3C. Temperature change in the HDPE slabs was recorded from a thermal sensor strategically placed 6 mm away from the battery surface in the vertical plane passing through the centre of the battery cell and the HDPE slab, i.e., location A in Figure 2a. Placing the temperature sensor in the central plane limits the edge effects of heat transfer from the slab to the surroundings [20]. Furthermore, a rest phase of an hour after completion of the discharge process was included in the test procedure to isolate the heat of mixing produced in the discharging operation. This procedure was repeated four times and average readings a\were used for heat generation estimation.
3.2. Problem Formulation
Key to scaling up an electrochemical system successfully is to examine the dynamic thermal response in relation to its capacity and strategically manage the heat released during the two energy transformation processes, i.e., charging and discharging. Modus operandi accepted for collecting the data fit for this study is direct calorimetry. An underlying assumption that all the heat produced by the electrochemical cell is lost to the calorimetric material forms the basis of this technique. Due to this assumption, the source of heating, in isolation, becomes immaterial to the problem. The dynamic heat generation rate and the temperature histories of heat source are subsequently estimated based on transient temperature readings recorded at discrete times at one or more interior points in the calorimeter. Such dynamic heat transfer problems, usually referred to as inverse heat conduction problems (IHCP), are considered mathematically ill posed. They are also known to be sensitive to random instrumentation errors and noise present in the experiments [20,60].
Several methodologies such as convolution theorem, finite difference method, and finite element method, for solving IHCPs can be found in literature [60,61,62,63,64,65,66]. However, owing to inherent complexities and need for extensive matrix manipulation steps, they were avoided in the present investigation. Instead, the problem formulation is centred on the Fourier’s law of heat transfer and the fundamental law of conservation of energy. Lateral conduction in the calorimeter is considered negligible in comparison to heat flow in the direction normal to the cell surface, which lends the original problem to a single spatial dimension. This assumption is validated through readings from a temperature sensor placed 6 mm away from the surface representing thickness of the battery that shows negligible deviation from the bulk temperature, i.e., location B in Figure 2a. Temperature distribution, T, as a function of time (t) in a slab of homogenous and isotropic material can be described by
where, (~0.49 W/m-K is used in this study) is the thermal conductivity of HDPE, i.e., the calorimetric material while and represent its density and specific heat, respectively. The initial condition of thermal equilibrium between the HDPE slab and the isothermal air bath provided by the thermal chamber is
and a boundary condition of no heat exchange with surroundings at x = L, where, L, represents thickness of the HDPE slab is defined as
Temperature measurements at x = , i.e., location of the sensor corresponding to discrete time steps, during the test cycle are given by
Interestingly, a one-dimensional IHCP with a single unknown surface heat flux at x = 0, a known boundary condition at x = L and a temperature history for one internal location can be converted to a case involving two separate problems. Now, for one of these problems concerning portion of the slab spanning from x = to x = L (say, body 2), boundary conditions at both of its ends are known. As a result, heat transfer through this region of the slab could be analysed like a direct problem. Heat flux entering body 2, q, which is practically equal to flux leaving body 1 (portion of the slab from x = 0 to x = ) via the surface x = is therefore calculated in a direct manner by solving the following equation.
In addition, the battery cell is assumed to be emitting heat equally from both the faces. Total heat flux actually generated by it is therefore twice the calculated value [67]. Lastly, impact of changes in cell thickness on battery heat generation rates cannot be explored if the area of the specific test battery is used for converting the calculated heat flux to heat energy generated by the cell. Therefore, a transformation constant was determined equal to 0.1 by comparing the experimental results obtained for the control sample, i.e., A123 20 Ah cell with the values published by Chen et al. [20] for the same cell. They have addressed the IHCP problem for an A123 pouch cell by applying Beck’s sequential function specification method. This method increases stability of the problem by including information about future steps into it. Control experiments using the A123 20 Ah pouch cell at the temperature of 10 °C and the discharge rates of 0.5C and 2C were performed. Deviation of less than 3% between the heat generation rates estimated herein and those measured by Chen et al. is noticed. The difference is judged acceptable in the context of this work.
4. Results and Discussion
The LiFePO4 pouch cells were subjected to galvanostatic discharge tests over a range of ambient temperatures between −10 °C and 50 °C using the experimental procedure described in Section 3.1. The following section will present the experimental results to illustrate the observed effects of ambient temperature, discharge current, and the depth of discharge on the battery heat generation rate when analysed in conjunction with the battery capacity.
4.1. Effect of Temperature
Figure 3 shows the heat generation rates calculated as a function of depth of discharge for the 8 Ah, the 15 Ah, and the 20 Ah LiFePO4 pouch cells discharged at a 3C rate in operating temperatures of (a) 50 °C, (b) 20 °C, (c) 5 °C, respectively. It can be seen from Figure 3a that up to a DOD of 35%, heat generation rate curves for the 15 Ah and the 20 Ah pouch cell almost overlap each other. As the energy stored in these cells is further depleted, the two curves start to deviate apart. In the DOD range of 40% to 80%, average heat generation rate determined for the 15 Ah battery cell is larger by 0.65 W than that observed for the 20 Ah pouch cell. The difference increases to 1.1 W at the end of the discharge test. In contrast, the heat generation rate of the 8 Ah pouch cell is considerably greater than that of the other two cells almost throughout the discharge process.
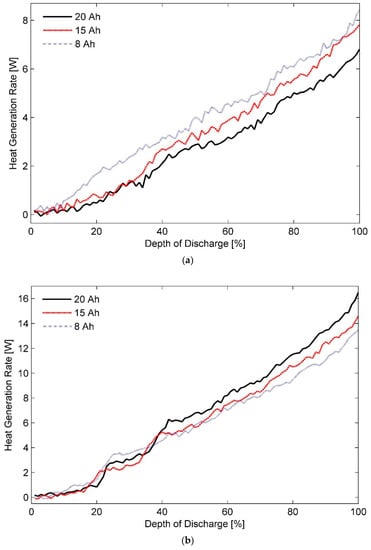
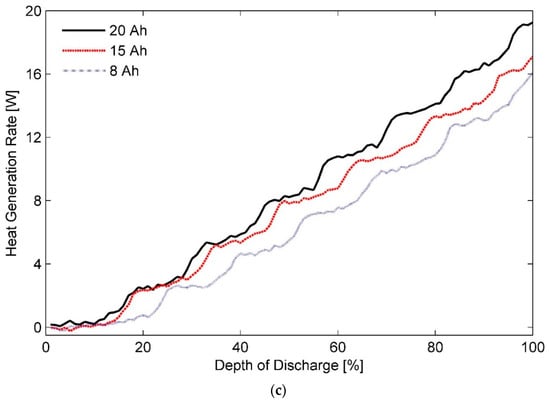
Figure 3.
Estimated heat generation rates for 8, 15, and 20 Ah pouch cells discharged at 3C in ambient temperatures of (a) 50 °C, (b) 20 °C, and (c) 5 °C.
In fact, the 8 Ah pouch cell generates approximately 1.5 W more than the heat produced by the 15 Ah or the 20 Ah cell per second in the DOD range of 20% to 38% and almost 1 W from thereon until 70% DOD. It is also seen that although the heat generation rates for the 8 Ah pouch cell and the 15 Ah pouch cell are approximately equal at the DOD of 95%, an additional 0.7 W has to be dissipated from the 8 Ah cell at the end of discharge process if its temperature has to be maintained at 50 °C. This marked dissimilarity in the heat generation rates of the three pouch cells operating under identical test conditions can be attributed to variation in their internal resistance, which is explained in detail later. High internal resistance results in an increased heat generation rates and subsequently a higher battery cell temperature particularly at sections closer to core of the cell.
Upon comparison of the plots shown in Figure 3a with Figure 3b, a remarkable increase of more than 125% can be noticed in heat generation rate of the 20 Ah pouch cell as the cell operating temperature drops from 50 to 20 °C. It is an indication of poor electrochemical performance and a substantial drop in cyclic efficiency of the Li-ion batteries at low temperatures. Rather surprisingly, the 8 Ah pouch cell experiences only a 60% increase in the rate of heat generation measured under similar conditions. As a result, the 20 Ah pouch cell appears to be generating more heat than both the 15 Ah and the 8 Ah pouch cells at all stages of the test cycle after a DOD of 40% is reached. By the end of the test, total heat generated by the 20 Ah pouch cell exceeds the heat produced by the 8 Ah test battery by as much as 2.5 W; warranting a careful attention in the design of a TMS for the same.
A trend similar to the one observed at 20 °C for the heat generation rates of the three test cells is observed at 5 °C, as seen from Figure 3c. In this case, however, a discernible change in the heat generation rates of the 20 Ah pouch cell is evident right from the beginning of the discharge process. Additionally, amplification of the total heat is noticed for all the three test battery cells, signifying a continuous decay in their performance as the operating temperature is decreased. Reduced mass transfer and sluggish charge kinetics can be considered as primary reasons for it. Nonetheless, ratio of percentage increase in heat generation rates for the 8 Ah pouch cell as a result of shift in operating temperature from 50 to 5 °C is lower than the ratios obtained for the other two test cells. Consequently, the 8 Ah pouch cell, i.e., the thick cell, is considered more efficient in cold climatic conditions than the test battery cells with thin geometry. It can thus be implied that for same nominal capacity, Li-ion cells with thicker electrodes in general are better suited for low temperature applications than the thin pouch cells. A thick electrode normally contains more active material than a thin electrode of same total volume. Accordingly, it delivers a higher capacity at any specific temperature [68].
Transformation of electrical energy to chemical form during charging and vice-versa during discharging of an electrochemical cell is a complex process. It happens in multiple stages that involve transportation of the positive and the negative charge carriers across various parts of the battery cell. A portion of the electrical energy stored in the cell is transformed to heat while overcoming the irreversibility associated with these transportation processes. Various components responsible for this irreversible loss can be listed as follows:
- Resistance offered to diffusion of Li-ions by the solution phase of the porous electrode;
- Resistance presented by the cell separator to Li-ion diffusion;
- Resistance provided by the solid electrolyte interphase to Li-ions;
- Resistance of the solid phase of porous electrode to transfer of electrons across it;
- Resistivity of the current collectors.
All these resistive components are temperature dependent and can be controlled through judicious cell design. Battery cell design can influence both the electrochemical performance and the available capacity of the battery under specific operating conditions. For instance, a thick and heavy current collector by virtue of its high conductivity ensures a uniform current distribution in a cell and minimises any thermal gradients across it [69]. Nevertheless, the principal elements that can affect the internal resistance of a cell and consequentially its heat generation rates under varying ambient conditions are the thickness and the surface area of the electrode.
Theoretically, a thin electrode provides lower internal resistance to Li-ion diffusion in comparison to a thick electrode of the same chemistry and total volume [21,68]. However, under realistic situations, major portions of the thin electrochemical cell structure can be considered to be in close thermal proximity of the ambient environment. Accordingly, at low ambient temperatures, major portions of the layered structure of a thin pouch cell operate at a lower temperature than the internal sections of a cell with thick battery cell. As colder regions of an electrochemical cell are typically more resistive than other areas, high heat generation rate of the 20 Ah or the thin pouch cell relative to the other two test batteries in operating temperatures of 20 °C and below can be explained. In addition, the effective current density corresponding to a specific discharge rate is higher in the thick cell than in the thin cell of the same volume because of its smaller surface area. High current density further heats up the internal layers of the 8 Ah pouch cell leading to an improved mass transport and charge transfer characteristics, thus contributing to a superior discharge performance. Not to mention, the large current collector plates and a high current concentration near the tabs can also be a cause of significant heat generation for batteries with a large form factor. For the same reasons, the physics of the problem is reversed in an ambient temperature of 50 °C at which a thick cell design becomes responsible for the increased irreversible polarisation noticed in the 8 Ah pouch cell.
A modular TMS should however be able to accommodate cells of different sizes and varied thickness ratios without much difficulty and certainly without asking for major structural modifications [70]. It is therefore clear that success of such a system is dependent on establishing a balance between the above-mentioned sources of irreversible heat generation in a Li-ion battery cell. Analysis of the data gleaned in this study suggest that a TMS designed to regulate the temperature of the studied Li-ion pouch cells at 35 °C could meet this criterion, as visible in Figure 4. For internal-combustion engine vehicles, a separate grade of engine oil is used for vehicles operating in cold climates from those that are used in geographic regions typically associated with a hot weather. More research by including other factors such as capacity fade, wear, and cycle life is, however, required to validate if similar to the case of engine-oil, battery cells for an EV can also be divided into two categories, namely:
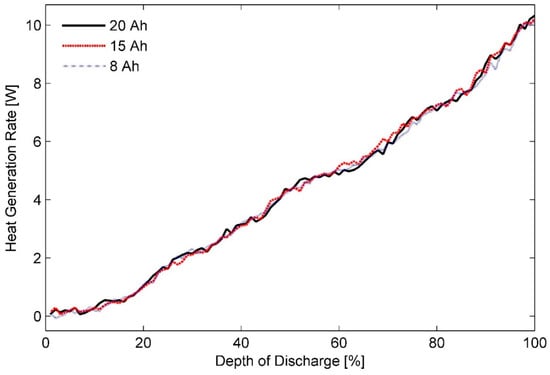
Figure 4.
Heat generation rates measured for 8, 15, and 20 Ah pouch cells in ambient temperature of 35 °C and discharge rate of 3C.
- Thick battery cells for EVs that are to be driven in low ambient temperatures, and
- Thin cells for EVs that could be used in ambient temperatures higher than 35 °C.
4.2. Comments on the Presence of a ‘Second Discharge Plateau’
Two low frequency fluctuations in the heat generation curves of a A123 20 Ah LiFePO4 cell were reported by Chen et al. [20]. They observed that the fluctuations were more noticeable for battery cells operating with a surface temperature greater than 20 °C. Such waverings giving an impression of a secondary discharge plateau have previously been witnessed for batteries with LiMnO4 electrodes. Their presence in LiMnO4 batteries is generally attributed to a double phase change phenomenom. Owing to this, Chen et al. suggested the existence of double phase change in LiFePO4 batteries as well.
Reports indicating presence of a second discharge plateaus for batteries with NiOOH electrodes can also be found in literature [71,72,73,74]. Nevertheless, it should be pointed out that formation of an insulating film at the NiOOH/substrate interface has been suggested as the reason behind the appearance of the second plateau. It is believed that the insulating film causes the conductivity of active material to reduce progressively during the discharge cycle until a stage where electrode resistance becomes constant is reached. A sharp increase in resistance and as a result in heat generation rates is again seen towards the end of the cycle signifying complete saturation of active material surface with Ni(OH)2 [75]. Further research investigating temperature-dependent changes in cell topology and microstructure would thus be required to ascertain the primary reason behind the fluctuations in heat generation rates of LiFePO4 cells.
Figure 5 displays heat generation rates for the 20 Ah test battery (a) at an ambient temperature of 50 °C with different discharge rates of 0.33C, 1C, and 3C, (b) at the discharge rate of 1C with the ambient temperatures ranging between −10 °C and 50 °C and (c) at 2C and 10 °C and their comparison with those measured for the A123 20 Ah pouch cell.
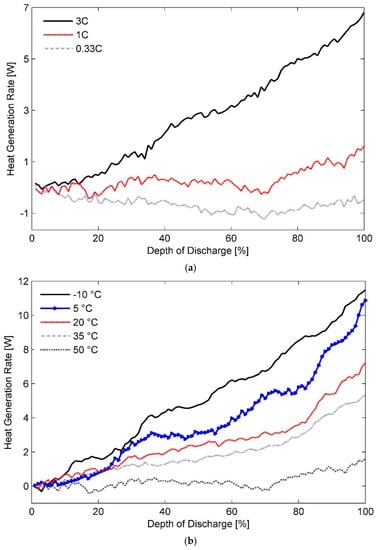
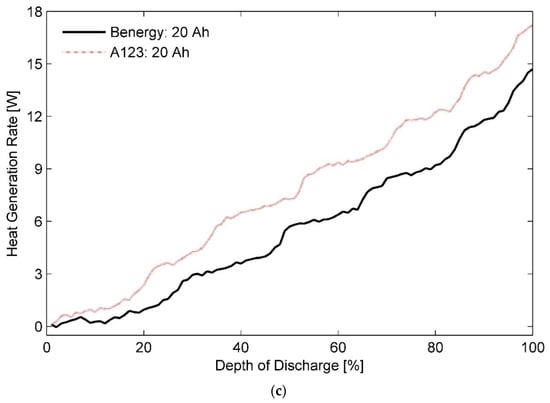
Figure 5.
Heat generation rates measured for the 20 Ah LiFePO4 pouch cell (a) in an ambient environment of 50 °C for different discharging rates, (b) effect of ambient temperature on secondary plateauing at discharge rate of 1C, and (c) their comparison with heat generation rates for the A123 20 Ah battery cell at 2C and 10 °C.
It can be seen from Figure 5a that heat generation rates corresponding to a 0.33C discharge rate are of endothermic nature, which makes it hard to identify the region of double phase change in the cycle. Irreversible heat is almost negligible at low C-rates (and high ambient temperatures). This means that the observed endothermic heating effect is a marker of endothermic chemical reaction or reversible heat in the cell. Structural changes associated with Li-ion deintercalation causes an entropy increase at the anode. Monoclinic to hexagonal phase transition at the cathode further reinforces this endothermic heating effect.
At higher discharge rates, a plateau-like feature is visible at DOD of approximately 35% and subsequently at around DOD of 80%. Further, Figure 5b shows that the number of fluctuations increases to three and more at operating temperatures lower than 20 °C. To ascertain the reason for this behaviour, heat generation rates for the 20 Ah test battery cell and the A123 20 Ah reference cell estimated at operating temperature of 10 °C and 2C discharge rate are compared in Figure 5c. The results indicate presence of several heat generation rate plateaus at low ambient temperatures for the A123 20 Ah battery cell as opposed to two distinct regions reported by Chen et. al. [20]. Phase lag, i.e., time elapsed between heat generation and heat measurement, due to large calorimeter time constants may have caused this noticeable waviness resulting in plateau-like features. However, further investigation in this regard could prove useful.
More importantly, Figure 5c shows a remarkable difference of 2.5 W in the heat generation rates measured for the two batteries, i.e., the 20 Ah test battery cell and the A123 20 Ah reference cell. In general, reducing the particle size of the positive electrode is known to result in a higher battery capacity. Accordingly, A123 cells employ nanophosphate chemistry with a particle size of 36.5 nm [76] as opposed to an average particle size of 300 nm used by other manufacturers [77,78]. However, it has been shown that the influence of active particle size on heat generation rates at discharge rates less than 2C is next to negligible [79]. Therefore, the observed variation in the rates of heat generation can be attributed to difference in the thickness of the two battery cells.
Based on the above information, it can be concluded from the data shown in Figure 5c that the test battery cell generates much less heat in low ambient temperatures than a 20% thinner cell of the same nominal capacity. It validates the inferences drawn in Section 4.1 about the effect of temperature on heat generation in cells of different thicknesses.
4.3. Effect of Discharge Rate
Figure 5a is a representation of heat generation rate plotted as a function of discharge rate for the test batteries in an ambient temperature of 50 °C. It is seen in the figure that magnitude of heat generation rate increases considerably with the discharge rate. Similar behaviour can be expected for all other operating temperatures residing within the safety margins of Li-ion battery cells.
Estimated heat generation rates as a function of DOD for the three test batteries at a discharge rate of 1C and ambient temperatures of (a) 20 °C, (b) 35 °C, and (c) 50 °C are shown in Figure 6a–c, respectively. In addition, inferences about thermal behaviour of these cells at a discharge rate of 0.33C with different ambient temperatures of (a) 20 °C, (b) 35 °C, and (c) 50 °C can be made from the data presented in Figure 7. Furthermore, a concise list of measured heat generation rates for the three test batteries at different ambient temperatures and discharge rates is presented in Table 3. It gives an indication of the upper bound and the lower bound for heat generation rates expected from a LiFePO4 pouch cell of specified capacity under typical operating conditions.
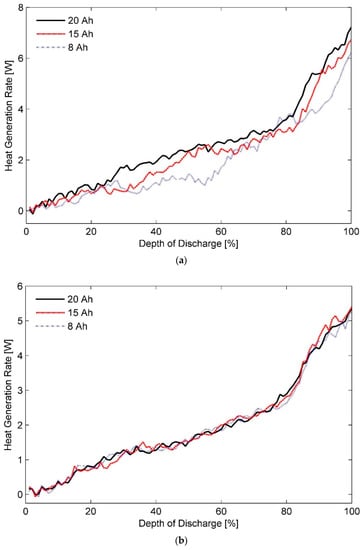
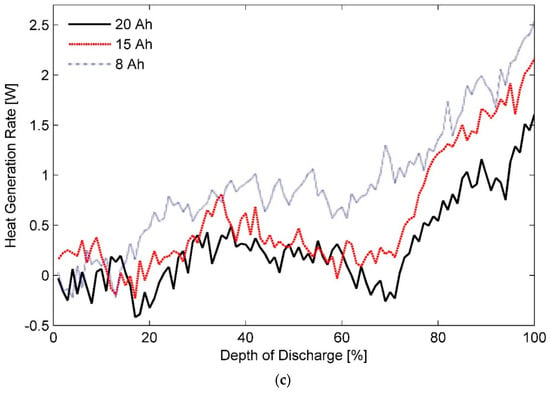
Figure 6.
Heat generation rates for the three test battery cells during the constant current discharge process at a rate of 1C under ambient temperatures of (a) 20 °C, (b) 35 °C, and (c) 50 °C.
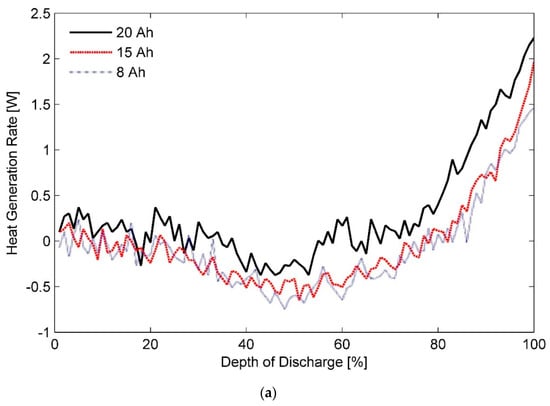
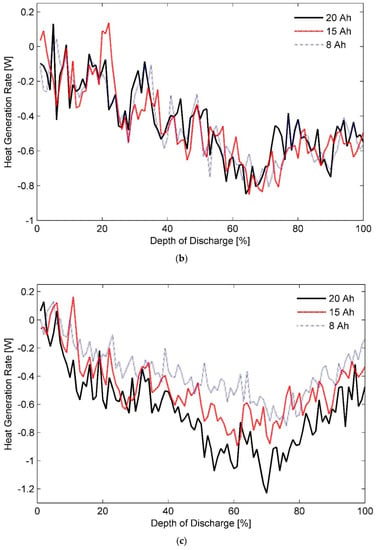
Figure 7.
Heat generation rates for the three test battery cells during the constant current discharge process at a rate of 0.33C under ambient temperatures of (a) 20 °C, (b) 35 °C, and (c) 50 °C.

Table 3.
Summary of estimated heat generation rates for the three test battery cells under varied operating conditions.
Heat generation rates for a battery cell with a porous electrode are influenced by transportation rate of Li-ions, from particle surface to the reaction site, driving the de-intercalation process at the negative electrode and the intercalation process at the positive electrode/electrolyte interface. It has also been identified that because of large difference in the value of Li-ion diffusion coefficient in the solid () and the liquid phase (), transients in the solid portion of the electrode and in the bulk of electrolyte are of different orders of magnitude [80,81]. Consequently, for reaction rates of 1C or less, Li-ion diffusion in the negative electrode acts as a rate limiting mechanism for the discharge process. At a discharge rate of 3C, it switches to Li-ion transport in the electrolyte. In addition, Li-ion motion occurs along a non-linear trajectory owing to constraints provided by olivine type structure of LiFePO4 particles [82].
As such, reducing the electrode thickness reduces the instant diffusion thickness, which is the distance from internal phase boundary to particle surface, and the material utilisation as particles do not get sufficient time to absorb the charge carriers. In contrast, increasing electrode thickness while keeping the cell capacity constant increases the effective active material loading per unit volume. As a result, cell porosity is decreased whereas active-material coating thickness is increased, which causes the Li-ion diffusion path in the solid electrode to become longer, causing an increase in the concentration polarisation and subsequently the heat generation rates [75,80]. It can explain almost overlapping heat generation rates for the three test batteries at certain stages of the characterisation test performed at discharge rates lower than 1C. However, judging by the profiles shown in Figure 3, Figure 4, Figure 5, Figure 6 and Figure 7, it can be concluded that the effect of diffusion thickness on battery heat generation rates overshadows the influence of dissimilar transients for solid and electrolyte phases of a battery cell on its thermal behaviour.
Additionally, predominantly non-linear heat generation profiles recorded for a 1C discharge process, shown in Figure 6, can be described by an S-shaped curve. It has been noted in literature that the variation of entropic coefficient with DOD for LiFePO4 electrodes exhibit a similar trend [21]. It gets magnified in form of entropic heat and is subsequently reflected in the heat generation rates. However, the ratio of reversible heat to irreversible heat is an inverse function of current. Consequently, the effect of reversible heat on the profile of total heat diminishes progressively as the discharge rate is increased leading to a quasilinear behaviour seen in Figure 3.
Lastly, it can be seen from Figure 7a that for an operating temperature of 20 °C and at a discharge rate of 0.33C, the total heat generated by LiFePO4 is endothermic for the initial-half of the discharge cycle. Afterwards, it switches to an exothermic mode in the second part of the cycle. In contrast, it is endothermic throughout the whole cycle for operating temperatures of 35 °C and 50 °C as seen from Figure 7b, and Figure 7c, respectively. Accordingly, a smaller-sized TMS would be required for maintaining the Li-ion battery pack at a uniform temperature of either 35 or 50 °C than say at 25 °C. From a safety perspective though, an operating temperature of 35 °C takes precedence over an operating temperature of 50 °C. Thus, operating the battery TMS at 35 °C not only facilitates a modular battery TMS design but also assists in vehicle light-weighting by restricting the passive load of an EV to a minimum level.
5. Conclusions
Heat generation rates for Li-ion battery cells are known to exhibit a strong dependency on discharge rate, ambient temperature, and DOD. However, it is anticipated that this relationship may change based on the nominal capacity of a battery cell. Therefore, in this work, heat generation rates for LiFePO4 pouch cells of different nominal capacities were experimentally measured at various DODs under an assortment of operating conditions described by a set of values for ambient temperature and discharge rate. Effect of cell/electrode thickness on battery heat generation rates was also included in the analysis. To facilitate accurate measurements, a custom-designed calorimeter was used. It is an improvement over previous calorimeter presented by Chen et al. [20] and enables heat generation estimation for pouch cells of varied surface area to thickness ratios.
The experimental results reveal that for operating temperatures greater than 35 °C, heat generation rates for thin battery cells are lesser than the rates measured for thick battery cells of equivalent nominal capacity. In contrast, it is observed that transformation process of electrical energy to chemical energy in ambient temperatures lower than 35 °C is much more efficient for the battery cells with thick electrodes than that for the thin battery cells. The difference is greater for higher discharge rates; regardless of the operating temperatures. Additionally, it is noticed that the effect of Li-ion transportation rate limiting mechanisms on battery heat generation rates is negligible in comparison to the effect of electrode thickness. Lastly, it is also observed that at an operating temperature of 35 °C, heat generation rates for all the three test battery cells, irrespective of their nominal capacities, are equal. The phenomenon is witnessed for all the test discharge rates.
Author Contributions
Conceptualisation, S.A.; Methodology, S.A.; investigation, S.A.; formal analysis, S.A. and A.K.; resources, A.K. and S.A.; writing—original draft preparation, S.A.; writing—review and editing, S.A. and A.K.; project administration, S.A.; supervision, A.K.; funding acquisition, A.K.
Funding
This research was funded by the Cooperative Research Centre for Advanced Automotive Technology (AutoCRC), Australia through a block grant for the project titled: Battery Charge, Mechanical and Thermal Management System Development (1–112).
Acknowledgments
We are thankful to Weixiang Shen from Swinburne University of Technology, Australia for several lengthy discussions on the subject. In addition, continuous support provided by Alec Papanicolaou in setting up the experimental test bench is duly recognized.
Conflicts of Interest
The authors declare no conflict of interest.
References
- Tie, S.F.; Tan, C.W. A review of energy sources and energy management system in electric vehicles. Renew. Sustain. Energy Rev. 2013, 20, 82. [Google Scholar] [CrossRef]
- Rothgang, S.; Baumhöfer, T.; van Hoek, H.; Lange, T.; De Doncker, R.W.; Sauer, D.U. Modular battery design for reliable, flexible and multi-technology energy storage systems. Appl. Energy 2015, 137, 931–937. [Google Scholar] [CrossRef]
- Arora, S.; Shen, W.; Kapoor, A. Review of mechanical design and strategic placement technique of a robust battery pack for electric vehicles. Renew. Sustain. Energy Rev. 2016, 60, 1319–1331. [Google Scholar] [CrossRef]
- Arora, S.; Kapoor, A.; Shen, W. Application of Robust Design Methodology to Battery Packs for Electric Vehicles: Identification of Critical Technical Requirements for Modular Architecture. Batteries 2018, 4, 30. [Google Scholar] [CrossRef]
- Kulkarni, A.; Kapoor, A.; Arora, S. Battery Packaging and System Design for an Electric Vehicle. SAE Int. 2015. [Google Scholar] [CrossRef]
- Gauthier, M.; Carney, T.J.; Grimaud, A.; Giordano, L.; Pour, N.; Chang, H.H.; Fenning, D.P.; Lux, S.F.; Paschos, O.; Bauer, C.; et al. Electrode-Electrolyte Interface in Li-Ion Batteries: Current Understanding and New Insights. J. Phys. Chem. Lett. 2015, 6, 4653–4672. [Google Scholar] [CrossRef] [PubMed]
- Liu, P.; Wang, J.; Hicks-Garner, J.; Sherman, E.; Soukiazian, S.; Verbrugge, M.; Tataria, H.; Musser, J.; Finamore, P. Aging Mechanisms of LiFePO4 batteries deduced by electrochemical and structural analyses. J. Electrochem. Soc. 2010, 157, A499–A507. [Google Scholar] [CrossRef]
- Amine, K.; Liu, J.; Belharouak, I. High-temperature storage and cycling of C-LiFePO4/graphite Li-ion cells. Electrochem. Commun. 2005, 7, 669–673. [Google Scholar] [CrossRef]
- Biensan, P.; Simon, B.; Peres, J.P.; De Guibert, A.; Broussely, M.; Bodet, J.M.; Perton, F. On safety of lithium-ion cells. J. Power Sources 1999, 81–82, 906–912. [Google Scholar] [CrossRef]
- Ramadass, P.; Haran, B.; White, R.; Popov, B.N. Capacity fade of Sony 18650 cells cycled at elevated temperatures: Part I. Cycling performance. J. Power Sources 2002, 112, 606–613. [Google Scholar] [CrossRef]
- Maleki, H.; Deng, G.; Anani, A.; Howard, J. Thermal stability studies of Li-ion cells and components. J. Electrochem. Soc. 1999, 146, 3224–3229. [Google Scholar] [CrossRef]
- Arora, S.; Shen, W.; Kapoor, A. Designing a Robust Battery Pack for Electric Vehicles Using a Modified Parameter Diagram. SAE Tech. Paper 2015. [Google Scholar] [CrossRef]
- Arora, S.; Kapoor, A.; Shen, W. A novel thermal management system for improving discharge/charge performance of Li-ion battery packs under abuse. J. Power Sources 2018, 378, 759–775. [Google Scholar] [CrossRef]
- Arora, S.; Tammi, K. A Hybrid Thermal Management System with Negative Parasitic Losses for Electric Vehicle Battery Packs. In Proceedings of the ASME 2018 International Mechanical Engineering Congress and Exposition, Pittsburgh, PA, USA, 9–15 November 2018. [Google Scholar]
- Santhanagopalan, S.; Zhang, Q.; Kumaresan, K.; White, R.E. Parameter estimation and life modeling of lithium-ion cells. J. Electrochem. Soc. 2008, 155, A345–A353. [Google Scholar] [CrossRef]
- Yang, H.; Amiruddin, S.; Bang, H.; Sun, Y.; Prakash, J. A review of Li-Ion cell chemistries and their potential use in hybrid electric vehicles. J. Ind. Eng. Chem. 2006, 12, 12–38. [Google Scholar]
- Arora, S.; Kapoor, A. Mechanical Design and Packaging of Battery Packs for Electric Vehicles. In Behaviour of Lithium-Ion Batteries in Electric Vehicles: Battery Health, Performance, Safety, and Cost; Pistoia, G., Liaw, B., Eds.; Springer International Publishing: Cham, Switzerland, 2018; pp. 175–200. [Google Scholar]
- Ji, Y.; Wang, C.Y. Heating strategies for Li-ion batteries operated from subzero temperatures. Electrochim. Acta 2013, 107, 664–674. [Google Scholar] [CrossRef]
- Arora, S. Selection of thermal management system for modular battery packs of electric vehicles: A review of existing and emerging technologies. J. Power Sources 2018, 400, 621–640. [Google Scholar] [CrossRef]
- Chen, K.; Unsworth, G.; Li, X. Measurements of heat generation in prismatic Li-ion batteries. J. Power Sources 2014, 261, 28–37. [Google Scholar] [CrossRef]
- Bandhauer, T.M.; Garimella, S.; Fuller, T.F. Temperature-dependent electrochemical heat generation in a commercial lithium-ion battery. J. Power Sources 2014, 247, 618–628. [Google Scholar] [CrossRef]
- Lu, W.; Prakash, J. In situ measurements of heat generation in a Li/mesocarbon microbead half-cell. J. Electrochem. Soc. 2003, 150, A262–A266. [Google Scholar] [CrossRef]
- Bandhauer, T.M.; Garimella, S.; Fuller, T. A Critical Review of Thermal Issues in Lithium-Ion Batteries. J. Electrochem. Soc. 2011, 158, R1–R25. [Google Scholar] [CrossRef]
- Bang, H.; Yang, H.; Sun, Y.K.; Prakash, J. In situ studies of LixMn2O4 and Li xAl0.17Mn1.83O3.97S0.03 cathode by IMC. J. Electrochem. Soc. 2005, 152, A421–A428. [Google Scholar] [CrossRef]
- Kim, J.S.; Prakash, J.; Selman, J.R. Thermal characteristics of LixMn2O4 spinel. Electrochem. Sol. State Lett. 2001, 4, A141–A144. [Google Scholar] [CrossRef]
- Kobayashi, Y.; Kihira, N.; Takei, K.; Miyashiro, H.; Kumai, K.; Terada, N.; Ishikawa, R. Electrochemical and calorimetric approach to spinel lithium manganese oxide. J. Power Sources 1999, 81–82, 463–466. [Google Scholar] [CrossRef]
- Kobayashi, Y.; Miyashiro, H.; Kumai, K.; Takei, K.; Iwahori, T.; Uchida, I. Precise electrochemical calorimetry of LiCoO2/graphite lithium-ion cell understanding thermal behavior and estimation of degradation mechanism. J. Electrochem. Soc. 2002, 149, A978–A982. [Google Scholar] [CrossRef]
- Lu, W.; Belharouak, I.; Park, S.H.; Sun, Y.K.; Amine, K. Isothermal calorimetry investigation of Li1+xMn2-yAlzO4 spinel. Electrochim. Acta 2007, 52, 5837–5842. [Google Scholar] [CrossRef]
- Onda, K.; Kameyama, H.; Hanamoto, T.; Ito, K. Experimental study on heat generation behavior of small lithium-ion secondary batteries. J. Electrochem. Soc. 2003, 150, A285–A291. [Google Scholar] [CrossRef]
- Saito, Y.; Kanari, K.; Takano, K. Thermal studies of a lithium-ion battery. J. Power Sources 1997, 68, 451–454. [Google Scholar] [CrossRef]
- Song, L.; Evans, J.W. Electrochemical-thermal model of lithium polymer batteries. J. Electrochem. Soc. 2000, 147, 2086–2095. [Google Scholar] [CrossRef]
- Yang, H.; Prakash, J. Determination of the reversible and irreversible heats of a LiNi 0.8Co0.15Al0.05O2/natural graphite cell using electrochemical-calorimetric technique. J. Electrochem. Soc. 2004, 151, A1222–A1229. [Google Scholar] [CrossRef]
- Thomas, K.E.; Newman, J. Heats of mixing and of entropy in porous insertion electrodes. J. Power Sources 2003, 119–121, 844–849. [Google Scholar] [CrossRef]
- Xiao, M.; Choe, S.-Y. Theoretical and experimental analysis of heat generations of a pouch type LiMn2O4/carbon high power Li-polymer battery. J. Power Sources 2013, 241, 46–55. [Google Scholar] [CrossRef]
- Schuster, E.; Ziebert, C.; Melcher, A.; Rohde, M.; Seifert, H.J. Thermal behavior and electrochemical heat generation in a commercial 40 Ah lithium ion pouch cell. J. Power Sources 2015, 286, 580–589. [Google Scholar] [CrossRef]
- Lin, C.; Xu, S.; Li, Z.; Li, B.; Chang, G.; Liu, J. Thermal analysis of large-capacity LiFePO4 power batteries for electric vehicles. J. Power Sources 2015, 294, 633–642. [Google Scholar] [CrossRef]
- Drake, S.J.; Martin, M.; Wetz, D.A.; Ostanek, J.K.; Miller, S.P.; Heinzel, J.M.; Jain, A. Heat generation rate measurement in a Li-ion cell at large C-rates through temperature and heat flux measurements. J. Power Sources 2015, 285, 266–273. [Google Scholar] [CrossRef]
- Arora, S.; Shen, W.; Kapoor, A. Critical analysis of open circuit voltage and its effect on estimation of irreversible heat for Li-ion pouch cells. J. Power Sources 2017, 350, 117–126. [Google Scholar] [CrossRef]
- Arora, S.; Shen, W.; Kapoor, A. Neural network based computational model for estimation of heat generation in LiFePO4 pouch cells of different nominal capacities. Comput. Chem. Eng. 2017, 101, 81–94. [Google Scholar] [CrossRef]
- Worldwide C. 2016 Chevrolet Spark Specifications. 2016. Available online: https://media.chevrolet.com/media/us/en/chevrolet/vehicles/spark-ev/2016 (accessed on 10 November 2019).
- Worldwide C. 2015 Chevrolet Spark Specifications. 2015. Available online: https://media.gm.com/media/us/en/chevrolet/vehicles/spark-ev/2015.html (accessed on 10 November 2019).
- Authority, G. 2017 Chevrolet Bolt EV. 2016. Available online: https://media.chevrolet.com/media/us/en/chevrolet/vehicles/bolt-ev/2017 (accessed on 10 November 2019).
- Cole, J. New Specs for 2015 e-Golf Released By VW, Launches Later This Year. 2014. Available online: http://insideevs.com/volkswagen-releases-details-2015-e-golf/ (accessed on 10 November 2019).
- Rovito, M. 2015 VW e-Golf Ushers in an Era of Interchangeable Drivetrains for Every Volkswagen Model; CHARGED—Electric Vehicles Magazine, Isentropic Media, 2015. Available online: https://chargedevs.com/features/the-2015-vw-e-golf-ushers-in-an-era-of-interchangeable-drivetrains-for-every-volkswagen-model/ (accessed on 10 November 2019).
- Cole, J. 2017 Volkswagen e-Golf: 35.8 kWh Battery, 124 Mile/200km Range (Update). Inside EVs. 2016. Available online: http://insideevs.com/2017-volkswagen-e-golf-35-8-kwh-battery-124-miles200km-real-world-range/ (accessed on 10 November 2019).
- Buchmann, I. BU-1003: Electric Vehicle (EV); Cadex Electronics Inc., 2016. Available online: http://batteryuniversity.com/learn/article/electric_vehicle_ev (accessed on 10 November 2019).
- Idaho National Laboratory. 2013 Ford Focus Electric Advanced Vehicle Testing—Baseline Testing Results. 2015. Available online: https://www.energy.gov/sites/prod/files/2015/02/f19/fact2013fordfocus.pdf (accessed on 10 November 2019).
- Ford Motor Company. FOCUS 2016—Electric Engine Specifications. 2016. Available online: http://www.ford.com/cars/focus/specifications/engine/ (accessed on 10 November 2019).
- Roper, L.D. Mercedes B-Class ED 2015. 2016. Available online: http://www.roperld.com/Science/MercedesBClassED.htm (accessed on 10 November 2019).
- Huffman, J.P. 2014 BMW i3 vs. 2014 Mercedes-Benz B-Class Electric Drive. Car and Driver. 8 September 2014. Available online: https://www.caranddriver.com/reviews/comparison-test/a15110584 (accessed on 10 November 2019).
- Lofton, B. Kia Soul EV Battery System. EV Hangar. 2016. Available online: https://www.evhangar.com/system/battery-systems/sys-batt-kia-soul-ev/ (accessed on 10 November 2019).
- Hope, J. 2019 Kia Soul EV Specifications. 2019. Available online: https://www.kiamedia.com/us/en/models/soul-ev/2019/specifications (accessed on 10 November 2019).
- Moloughney, T. 2017 BMW i3 Specs Revealed with Some Surprises. The Electric BMW i3. 2016. Available online: https://insideevs.com/news/331741/2017-bmw-i3-specs-revealed-with-some-surprises/ (accessed on 10 November 2019).
- Blanco, S. Updated 2017 BMW i3 Goes 114 Miles with New 33-kWh Battery; AOL Inc., 2016. Available online: https://www.autoblog.com/2016/05/01/updated-bmw-i3-114-miles-new-33-kwh-battery (accessed on 10 November 2019).
- Mitsubishi Motors North America Inc. Main Drive Battery; Mitsubishi Motors, 2016. Available online: http://www.mitsubishicars.com/imiev/specifications (accessed on 10 November 2019).
- Idaho National Laboratory. BEV Battery Testing Results 2012 Mitsubishi iMiev—VIN 4550; Advanced Vehicle Testing Activity, 2014. Available online: https://www.energy.gov/sites/prod/files/2015/02/f19/batteryiMiev4550.pdf (accessed on 10 November 2019).
- EVSpecifications. 2019 Nissan Leaf S Plus - Specification and Price. 2019. Available online: https://www.evspecifications.com/en/model/68ad67 (accessed on 10 November 2019).
- Kane, M. Here is the Nissan LEAF e+62 kWh battery: Video. InsideEVs. 2019. Available online: https://insideevs.com/news/342009/here-is-the-nissan-leaf-e-62-kwh-battery-video/ (accessed on 10 November 2019).
- McCullough, J.P. Calorimetry of Non-Reacting Systems Prepared Under the Sponsorship of the International Union of Pure and Applied Chemistry Commission on Thermodynamics and the Thermochemistry; Scott, D.W., Ed.; Elsevier Science: Burlington, NJ, USA, 2013. [Google Scholar]
- Reeve, T.H. The Method of Fundamental Solutions for Some Direct and Inverse Problems; University of Birmingham: Birmingham, UK, 2013. [Google Scholar]
- Alifanov, O.M. Inverse Heat Transfer Problems; Springer Science & Business Media: Berlin, Germany, 2012. [Google Scholar]
- Alifanov, O.M.; Artyukhin, E.A.; Rumyantsev, S.V. Extreme Methods for Solving Ill-Posed Problems with Applications to Inverse Heat Transfer Problems; Begell House: New York, NY, USA, 1995. [Google Scholar]
- Jarny, Y.; Ozisik, M.; Bardon, J. A general optimization method using adjoint equation for solving multidimensional inverse heat conduction. Int. J. Heat Mass Transf. 1991, 34, 2911–2919. [Google Scholar] [CrossRef]
- Beck, J.; Blackwell, B.; Haji-Sheikh, A. Comparison of some inverse heat conduction methods using experimental data. Int. J. Heat Mass Transf. 1996, 39, 3649–3657. [Google Scholar] [CrossRef]
- Lesnic, D.; Elliott, L.; Ingham, D. Application of the boundary element method to inverse heat conduction problems. Int. J. Heat Mass Transf. 1996, 39, 1503–1517. [Google Scholar] [CrossRef]
- Huang, C.-H.; Wang, S.-P. A three-dimensional inverse heat conduction problem in estimating surface heat flux by conjugate gradient method. Int. J. Heat Mass Transf. 1999, 42, 3387–3403. [Google Scholar] [CrossRef]
- Beck, J.V.; Blackwell, B.; Clair, C.R.S., Jr. Inverse Heat Conduction: Ill-Posed Problems: James Beck. 1985. Available online: https://www.thermalfluidscentral.org/e-books/book-intro.php?b=44 (accessed on 10 November 2019).
- GatesEnergyProducts. Section 3—Sealed Nickel-Cadmium Cells and Batteries. Rechargeable Batteries Applications Handbook; Newton: Newnes, NSW, Australia, 1998; pp. 35–151. [Google Scholar]
- Gu, H. Mathematical analysis of a Zn/NiOOH cell. J. Electrochem. Soc. 1983, 130, 1459–1464. [Google Scholar] [CrossRef]
- Arora, S. Design of a Modular Battery Pack for Electric Vehicles. Ph.D. Thesis, Swinburne University of Technology, Melbourne, Australia, 2017. [Google Scholar]
- Ahlberg, E.; Palmqvist, U.; Simic, N.; Sjövall, R. Capacity loss in Ni–Cd pocket plate batteries. The origin of the second voltage plateau. J. Power Sources 2000, 85, 245–253. [Google Scholar] [CrossRef]
- Barnard, R.; Crickmore, G.T.; Lee, J.A.; Tye, F.L. The cause of residual capacity in nickel oxyhydroxide electrodes. J. Appl. Electrochem. 1980, 10, 61–70. [Google Scholar] [CrossRef]
- Leger, C.; Tessier, C.; Ménétrier, M.; Denage, C.; Delmas, C. Investigation of the second discharge plateau of the β (III)-NiOOH/β (II)-Ni (OH) 2 system. J. Electrochem. Soc. 1999, 146, 924–932. [Google Scholar] [CrossRef]
- Motupally, S.; Jain, M.; Srinivasan, V.; Weidner, J.W. The role of oxygen at the second discharge plateau of nickel hydroxide. J. Electrochem. Soc. 1998, 145, 34–39. [Google Scholar] [CrossRef]
- Mao, Z.; De Vidts, P.; White, R.E.; Newman, J. Theoretical analysis of the discharge performance of a NiOOH/H 2 cell. J. Electrochem. Soc. 1994, 141, 54–64. [Google Scholar] [CrossRef]
- Finley, T.D. Battery Degradation Modeling For Vehicle Applications. 2014. Available online: https://uwspace.uwaterloo.ca/handle/10012/8830 (accessed on 10 November 2019).
- Zaghib, K.; Mauger, A.; Groult, H.; Goodenough, J.B.; Julien, C.M. Advanced electrodes for high power Li-ion batteries. Materials 2013, 6, 1028–1049. [Google Scholar] [CrossRef] [PubMed]
- Wang, W.L.; Jin, E.M.; Gu, H.-B. Electrochemical Performance of Lithium Iron Phosphate by Adding Graphite Nanofiber for Lithium Ion Batteries. Trans. Electr. Electron. Mater. 2012, 13, 121–124. [Google Scholar] [CrossRef]
- Wu, W.; Xiao, X.; Huang, X. The effect of battery design parameters on heat generation and utilization in a Li-ion cell. Electrochim. Acta 2012, 83, 227–240. [Google Scholar] [CrossRef]
- Churikov, A.V.; Ivanishchev, A.V.; Ivanishcheva, I.A.; Sycheva, V.O.; Khasanova, N.R.; Antipov, E.V. Determination of lithium diffusion coefficient in LiFePO4 electrode by galvanostatic and potentiostatic intermittent titration techniques. Electrochim. Acta 2010, 55, 2939–2950. [Google Scholar] [CrossRef]
- Arora, S. A Novel Technique for Estimation of the Solid Electrolyte Interphase Film Resistance for Li-Ion Batteries. In Proceedings of the ASME 2018 International Mechanical Engineering Congress and Exposition, Pittsburgh, PA, USA, 9–15 November 2019. [Google Scholar]
- Laffont, L.; Delacourt, C.; Gibot, P.; Wu, M.Y.; Kooyman, P.; Masquelier, C.; Tarascon, J.M. Study of the LiFePO4/FePO4 Two-Phase System by High-Resolution Electron Energy Loss Spectroscopy. Chem. Mater. 2006, 18, 5520–5529. [Google Scholar] [CrossRef]
© 2019 by the authors. Licensee MDPI, Basel, Switzerland. This article is an open access article distributed under the terms and conditions of the Creative Commons Attribution (CC BY) license (http://creativecommons.org/licenses/by/4.0/).