1. Introduction
As an increasing percentage of energy is produced from renewable energy sources, electrochemical energy storage devices are in increasing demand, in order to integrate it into the electric power supply [
1]. One of the most promising systems to store and to provide electric energy in grid-scale is the redox flow battery [
2]. A significant advantage of redox flow batteries is the complete separation of power and energy capacity. Both characteristics can be adjusted by altering the size or the number of electrochemical cells in the battery stack or the volume of electrolyte solution in external reservoirs. As redox flow batteries have no geographic limitations compared to other large-scale energy storage technologies such as pumped hydro or compressed air storages, this flexible setup means that the redox flow battery system can be customized to specific applications [
3].
Redox flow batteries store chemical energy and generate electric energy by a chemical redox reaction. The redox reaction takes place at two electrodes, usually separated by an ion exchange membrane. This configuration provides the flexibility to combine various redox couples for redox flow batteries [
4]. The most widely studied chemistry, which has been commercialized up to a MWh-scale redox flow battery, is all-vanadium technology [
5]. For this chemistry, the redox couples V
3+/V
2+ and VO
2+/VO
2+ are dissolved in an aqueous electrolyte solution. The use of vanadium ions in both the positive and the negative electrolyte cycles offers the possibility to compensate for electrolyte imbalances and capacity losses due to cross-contamination.
Even today, redox flow batteries both as single cells on a laboratory-scale and as stacks are mostly characterized by overall performance measurements [
6]. By comparing different parameters such as efficiencies in galvanostatic or constant power cycles, polarization curves, or limiting charge or discharge current densities, the materials and layout of a cell are validated [
7,
8]. Furthermore, cell geometries and electrolyte flow rate or physical and chemical properties of the porous electrode, such as compression or oxidative pretreatment, are examined. Due to the two- or multidimensional structure, redox flow batteries are complex insofar, as local inequalities can exist. Overall performance studies of course provide numerous indicators on how to improve redox flow batteries. Such investigations take account of local inhomogeneity within an electrode, but there is no local resolution of the cell performance.
Most all-vanadium redox flow battery setups use porous carbon electrodes as a reaction surface. In these conventional flow frames the electrolyte is forced to flow through the porous electrode without any free flow as in the flow field structures. The electrolyte solution should be uniformly distributed throughout the porous electrode to maximize the performance of the battery [
9]. A conventional flow frame regulates the electrolyte flow simply by the distribution structure at the inlet and at the outlet of the cell. Due to the specific design and the use of anisotropic materials, such as the graphite electrode, local inhomogeneity cannot be completely avoided. However, it can be reduced by suitable adjustments of the flow frame or a better selection of the electrode porosity and permeability.
An uneven distribution of the electrolyte flow can limit the battery operation in various ways. A local undersupply with electrolyte solution can lead to local overpotential during the charging process. Overpotential may cause decomposition of the aqueous electrolyte solution and, thus, the formation of hydrogen at the anode or carbon corrosion on the cathode [
10,
11]. This process not only reduces the capacity of a battery: the decomposition may also irreversibly destroy the electrolyte, and the flammable hydrogen that escapes is a major safety risk. In addition, an insufficient supply of the electrolyte solution to the porous electrode may cause the formation of gas pockets within the cell. Such spots increase the internal resistance of the battery, increasing the operating losses [
12].
Since general experimental methods do not offer any spatially resolved information, two-dimensional characteristics in the electrode area must be obtained in a different way. To obtain such knowledge from the inside of the battery, characteristics like electrolyte flow distribution, local electrochemical conversion or even temperature distribution are analyzed by multi-physics models coupled with computational fluid dynamics [
13,
14,
15]. These predictions, however, are based on assumptions and cannot automatically represent the real conditions of the redox flow battery. Experimental validation of computer models requires new locally-resolved measurement methods for redox flow batteries. Of special interest are locally-resolved investigations of the current density distribution within the porous electrode area. The local current density and the gradient in the current density distribution provide a strong basis for conclusions of the performance and about the conditions in the redox flow battery.
For more than 20 years, locally-resolved measurements have supported research on fuel cells. Since the functionality of a redox flow battery is quite similar to that of a fuel cell, locally-resolved measurement methods developed for fuel cell research can be adapted for the investigation of redox flow batteries. Clement et al. [
16] take up this idea and provide an overview of established techniques in their publication. Hall sensors determine the local current density by measuring the magnetic induction caused by the electric current [
17,
18]. Hall sensors can measure high currents and can be used in wide temperature ranges. Due to the size of a hall sensor the maximum number of units on a specific area is limited [
19]. Hard-wired shunt resistors are simple to implement into electrochemical cells as a segmented electrode [
20]. However, they can only be installed at one of the end electrodes. The current density is measured by a voltage drop at the shunt, which is proportional to the current flowing through the separate trace. Printed circuit boards with mounted shunts operate by the same method [
21,
22]. Printed circuit boards are characterized by their ease of assembly into the test cell. The machine production allows an almost arbitrary resolution of the measurement [
19]. One of the major differences between all-vanadium redox flow batteries and fuel cells, however, is the reaction medium. The main component of the all-vanadium redox flow battery electrolyte is semi-concentrated sulfuric acid.
Locally-resolved measurements of the current density distribution are a very powerful tool for understanding and improving redox flow batteries. To date, published studies demonstrate the interest in these methods [
16,
23,
24,
25,
26]. Clement et al. measure the current density distribution in a square 9 cm
2 all-vanadium redox flow battery with a segmented electrode on a printed circuit board [
16]. The gold-plated surface of the printed circuit board is protected by a fully segmented plate with integrated flow channel structures. Bhattarai et al. [
23] use the voltage distribution and Hsieh et al. [
20] use the current density distribution to study square 100 cm
2 all-vanadium redox flow batteries with hard-wired shunt resistors. In contrast to Clement et al., both examine traditional flow frame configured batteries with porous graphite felt electrodes. The main advantage of hard-wired shunt resistors is the simple installation of the measuring technology in terms of the measurement setup and the chemical resistance. While Clement et al. require a customized flow plate made of chemically resistant material to protect their gold-plated printed circuit board, Bhattarai et al. and Hsieh et al. use regular bipolar plate materials to build the segmented electrodes. However, problems, such as accurate compression and contact to the electrode, are reported [
24]. In addition, Hsieh et al. [
24] and Clement et al. [
16] report the unfavorable influence of a not fully segmented flow plate due to the lateral current spread.
Another important parameter for designing redox flow batteries is the electrolyte flow through the porous electrode. In a conventional flow frame setup with flow-through configuration, the electrolyte flow is regulated by the distribution structures of the flow frame at the electrolyte inlet and the electrolyte outlet and by the physical properties (e.g., porosity and permeability) of the graphite felt. Due to the porous nature of the electrode, Darcy’s law predicts a uniform velocity along the electrode [
13]. In redox flow batteries the electrolyte local velocity and the resulting local flow distribution along the electrode cannot be directly measured during operation. In fuel cell research various experimental studies on the visualization of flow behavior in single cells have been published [
27]. Different technologies such as X-ray radiography [
28], neutron radiography [
29,
30], magnetic resonance imaging [
31,
32] or optical visualization using transparent test cells [
33,
34] were used to analyze the water distribution and gas flow inside fuel cells. Clement et al. describe in their study that the current density distribution mirrors the electrolyte flow. However, there was no further investigation of the electrolyte flow behavior. Bhattarai et al. fear that lateral current spread due to uneven local resistances in the electrode of the test cell dominates the current density distribution [
23]. For this reason, they use open circuit voltage distribution mapping and SOC mapping to analyze the electrolyte flow in redox flow batteries [
25,
26]. In addition, studies have been published on the use of infrared thermography, X-ray computed tomography and thermal energy dissipation to investigate the electrolyte flow in all-vanadium redox flow batteries [
35,
36,
37]. In general, studies start as small laboratory-size experiments and are then scaled up to large cells and stacks [
38]. For this reason, it is important that a measuring method can be adapted to the different sizes.
A segmented electrode on a printed circuit board is a comparably attractive method for measuring the current density distribution of redox flow batteries during operation. A printed circuit board can be flexibly scaled in size, form, and number of segments to the respective geometry of the cell, ensuring both even compression and contact resistances in the setup.
This study presents a novel advanced measurement setup with a segmented electrode on a printed circuit board for locally-resolved current density measurement in all-vanadium redox flow batteries. A special carbon coating protects the measurement setup from the corrosive electrolyte solution and thereby allows direct integration into the battery. Thus, the current density distribution of a laboratory test cell with an electrode area of 40 cm2 was experimentally examined during galvanostatic charge and discharging. Different limitation effects during operation were visualized and, in addition, the electrolyte flow in the test cell was investigated. Compared to state-of-the-art locally-resolved measurement methods, the printed circuit board electrode increased the sensitivity of such experiments. For the first time, current density distribution was measured during initialization of the all-vanadium redox flow battery, enabling the reaction path of V3+ oxidation in the positive half-cell to be visualized.
2. Results and Discussion
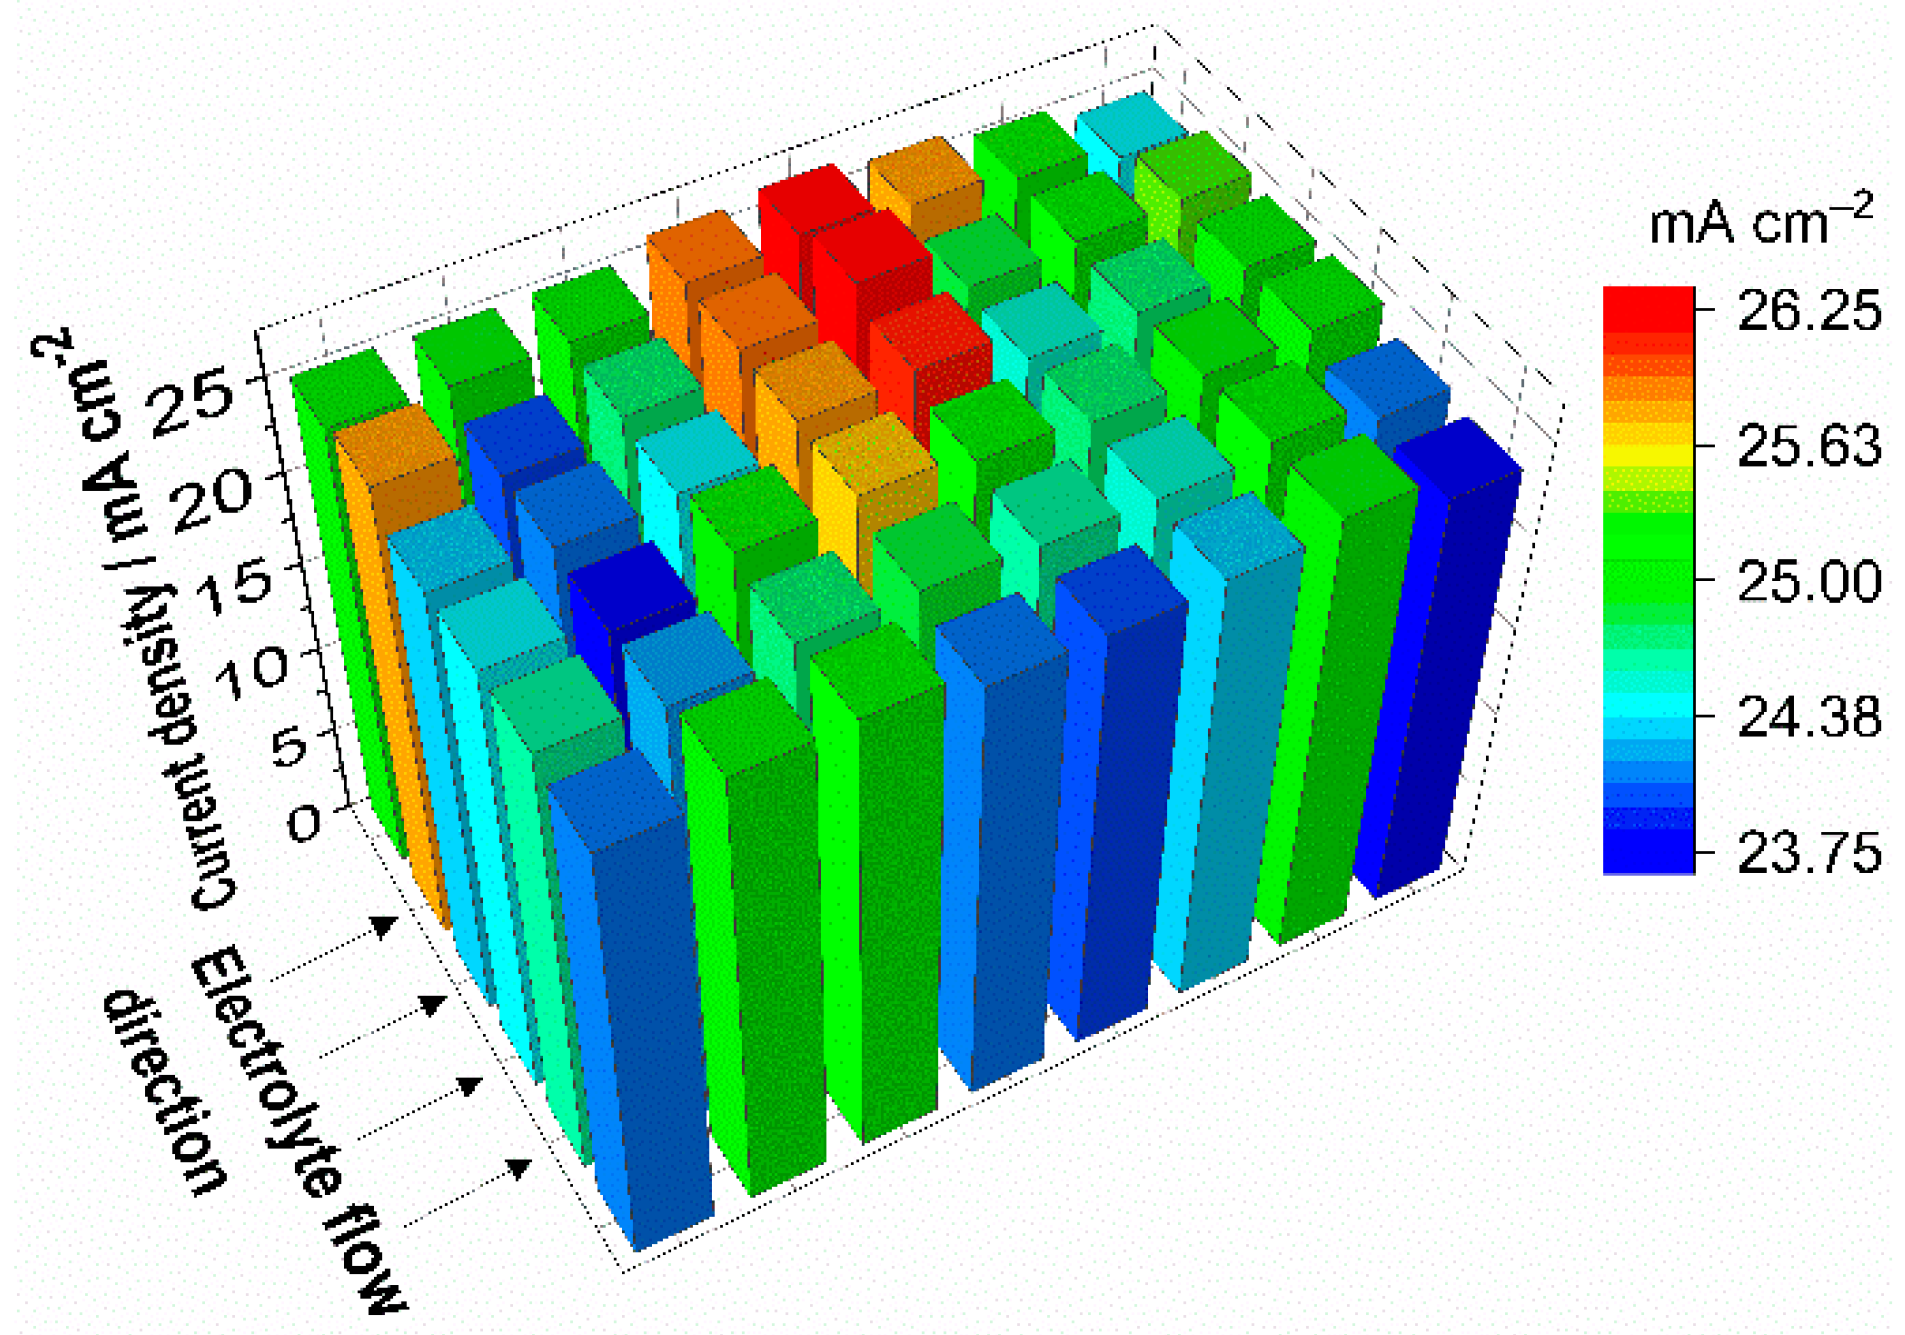
Figure 1 presents the current density distribution at the cathode while the test cell is discharged with 25 mA cm
−2 and 2.5 mL min
−1 cm
−2 for both electrolytes, starting at SOC 50%. The 3D bar diagram shows local deviations of current density of more than ±5%. However, no vectored gradient that can be explained by any characteristic of the battery, such as mass transport limitation, can be identified.
At comparable operating conditions with similar flow frame design Hsieh et al. monitor local deviations in the current density distribution of more than ±20% of the average current density [
24]. Limitation caused by the electrolyte conversion can be regarded as marginal due to the absence of a characteristic gradient in the current density distribution and the very low reaction conversion at 25 mA cm
−2 with the relatively high electrolyte flow of 2.5 mL min
−1 cm
−2 (λ > 100). In this context, the stoichiometric factor λ represents the flow rate condition and is shown in Equations (1) and (2):
The stoichiometric factor λ is the ratio of the electrolyte flow rate Q and the stoichiometric flow rate Qst. For charging and discharging λ is calculated by the electrolyte flow dV/dt, the state of charge of the electrolyte SOC, the number of electrons transferred n, the concentration of vanadium in the electrolyte c and the Faraday constant F. The stoichiometric factor then can be increased both by increasing the current I or just reducing the retention time t in the test cell.
A non-uniform pressure distribution of the printed circuit board electrode and, therefore, non-uniform contact resistances can also be eliminated as a source of the local current values due to the screwing of the test cell by the aluminum end plates. The printed circuit board itself exhibits low tolerances in fabrication and resistance, and the influence of the measurement setup on the test cell can be regarded as negligible. The local effects in the current density distribution can, therefore, be attributed to inconsistency in the test cell. Most likely, the porous graphite felt electrode shows the largest influence on the current density distribution presented in
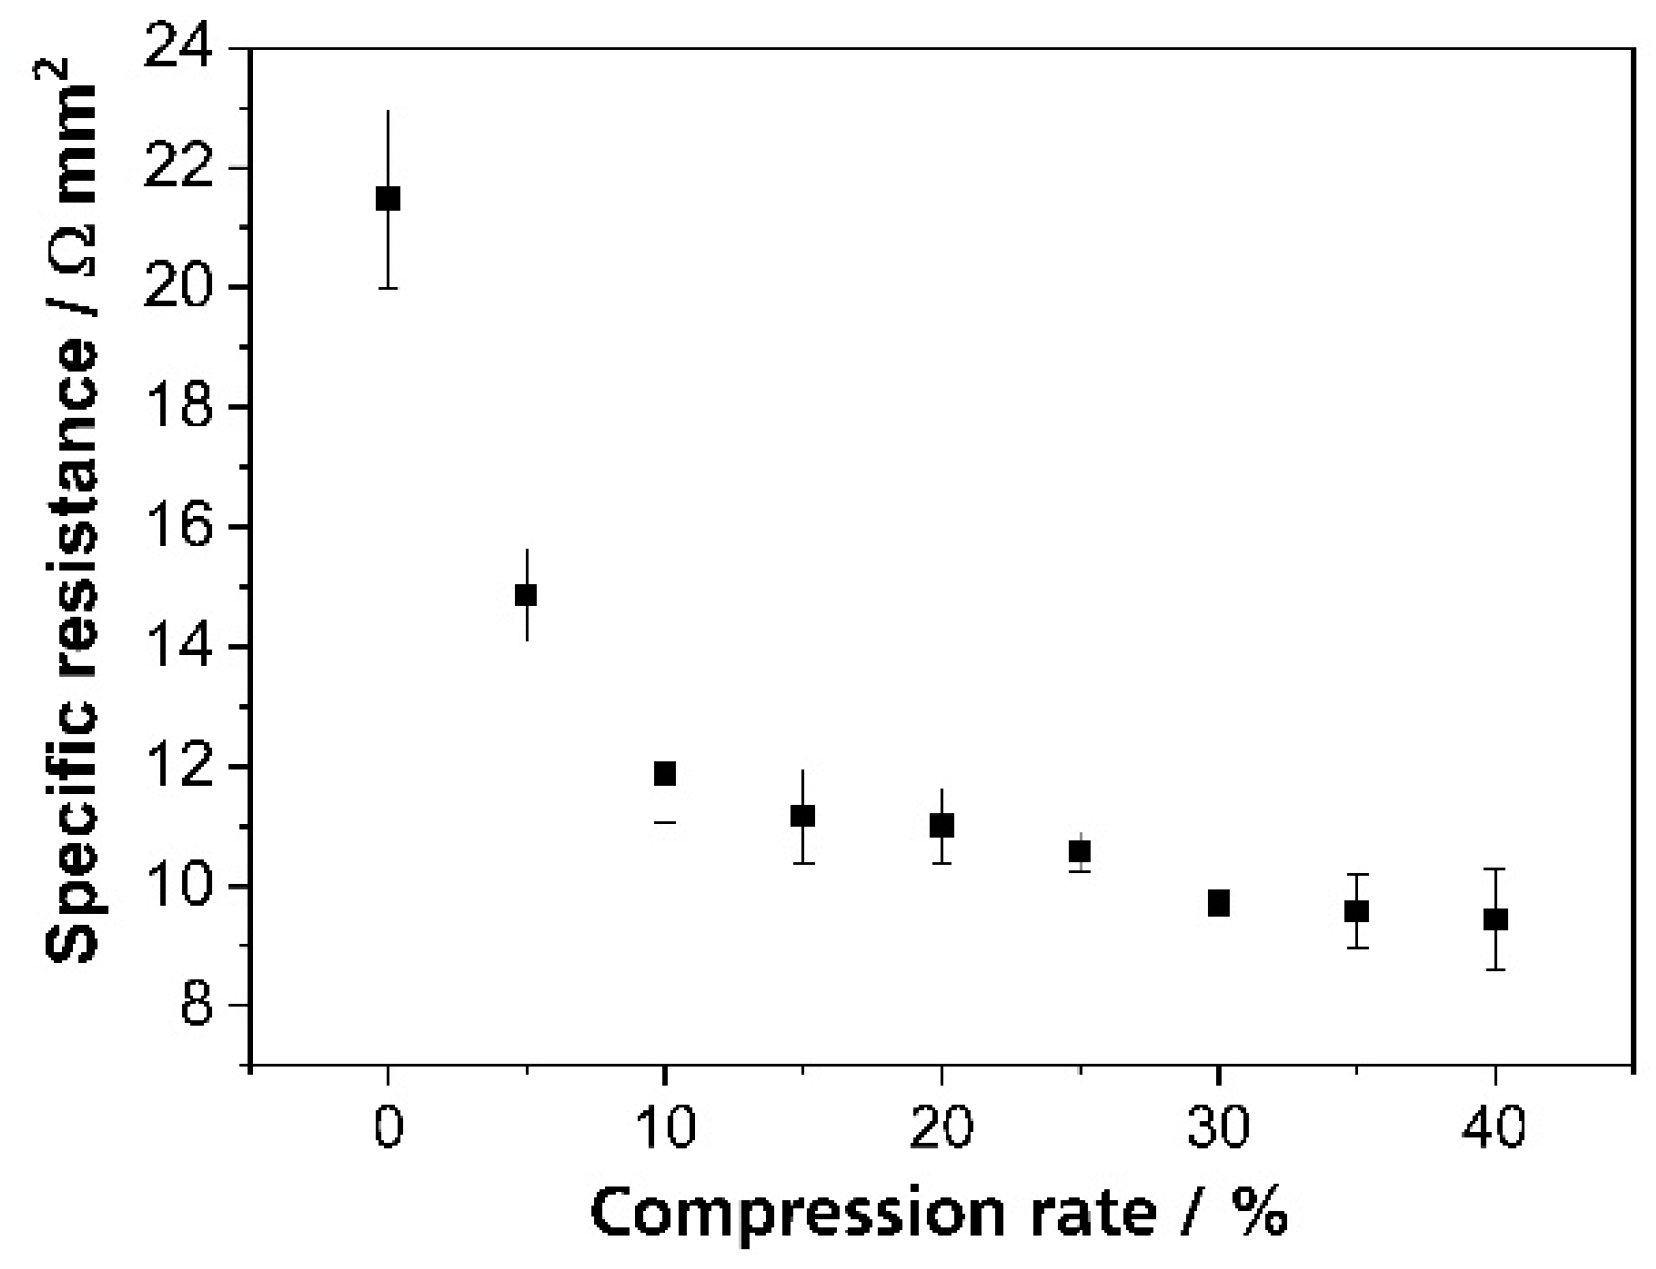
Figure 2. In the test cell a GFA5 graphite felt was used as a porous electrode and was compressed to around 75% of its original thickness. To adjust the compression during assembly of the test cell, the thickness of the graphite felt was measured at nine points. The measured thickness was in the range of 4.8 mm to 5.4 mm due to tolerances in the manufacturing process, and the average thickness was about 5.2 mm. Due to the non-uniform thickness of the graphite felt, different local compression rates in the electrode occur after assembling the test cell. Since the flow frame including spacer and the sealing form a pocket thickness for the porous electrode of 3.9 mm there is local compression from 72% to 81% of the original thickness in the test cell.
The electrical resistance of the GFA5 graphite felt is a function of its compression. In addition, a higher compression leads to smaller contact resistances between the porous electrode and the bipolar plate. Non-uniform compression of the graphite felt in the redox flow battery results in non-uniform contact resistances along the electrode surface.
Figure 2 shows the specific electric resistance of the GFA5 graphite felt at different compression rates.
The specific electrical conductivity of the graphite felt increases with higher compression [
39]. Since the electric current follows the path of smallest resistance, anisotropy in the compressed felt, and the resulting contact resistance cause local inhomogeneity in the current distribution. In previously published studies, Clement et al. [
16] and Hsieh et al. [
24] describe a uniform current density distribution during charging and especially at low charge currents and high flow rates. This can be expected due to a low electrochemical conversion rate under these conditions. Hence, the influence of the electrolyte on the inhomogeneity of the battery can be regarded as marginal. The local electrical resistance of the porous electrode, therefore, provides a plausible explanation for the deviations from the average current density. The observed characteristic of the graphite felt demonstrates the importance of considering such boundary conditions in the investigation of locally-resolved current density distributions in redox flow batteries.
Typically, redox flow battery test cells in laboratory-scale are tested with galvanostatic cycling tests. By analyzing locally-resolved current density distributions in the porous electrode, weak spots of the cell structure or cell configuration with local overpotential can be detected to improve the battery performance.
Figure 3a shows the current and the voltage of a test cell with an integrated printed circuit board during galvanostatic cycling with 50 mA cm
−2 and an electrolyte flow rate of 2.5 mL min
−1 cm
−2. The cut-off voltages for this experiment were set from 0.8 V to 1.6 V. In the voltage curve, four areas of significant interest are highlighted. These areas mark operating points during charging (i), shortly before the end of charging (ii), during discharging (iii) and shortly before the end of discharging (iv).
The current density distribution while charging the redox flow battery is almost uniform for the total electrode area during the complete charging process. Local deviations from about ±5% are recorded, but without a characteristic shape. Almost no difference between
Figure 3b during charging and
Figure 3c close to the end of the process is observed. The current density distribution indicates that charging the battery under the presented conditions is not limited by mass transport. Charging the battery in this case is simply terminated when the maximum charging voltage is reached, due to the electrochemical window of the aqueous electrolyte. Clement et al. describe the same result in their study [
16].
The current density distribution during discharge shows different behavior from during charging process, which is presented in
Figure 3d,e. Mid-way through discharge, the current density distribution is roughly uniform for the entire electrode area, while close to the end of discharge a significant inhomogeneity in the current density can be observed. The current density decreases constantly as it passes from the electrolyte inlet to the electrode and finally the electrolyte outlet. Maximum differences of more than ±10% are measured. This gradient of the current density distribution can be observed during discharge at various currents with similar intensity. Unlike the charging process, the discharge is strongly influenced and dominated by a limitation of mass transport.
The observed current density distributions during galvanostatic charge and discharge tests were comparable to the experimental results from Hsieh et al. in their square-shaped redox flow test cell [
24]. Hsieh et al. recorded slightly larger gradients from the inlet to the outlet of the cell, but in their study the cutoff voltage for discharging was set to 0.7 V. Due to their hand-built hard-wired measurement setup, their accuracy is lower, and the measurements show larger maximum and minimum values, especially during operation at low electrochemical conversion. In general, both studies confirm the measured current density distributions during the galvanostatic operation of all-vanadium redox flow batteries.
Since there is a correlation between current density distribution and electrolyte flow, this effect can be used to investigate the electrolyte flow. To generate a significant gradient in the current density distribution, the test cell is discharged close to cutoff voltage. The domination of the cell performance by the mass transport limitation thereby can be achieved by increasing the rate of the electrochemical reaction from V
5+ to V
4+. Since no transport limitation can be observed during the charging process, the electrolyte flow is investigated during discharging.
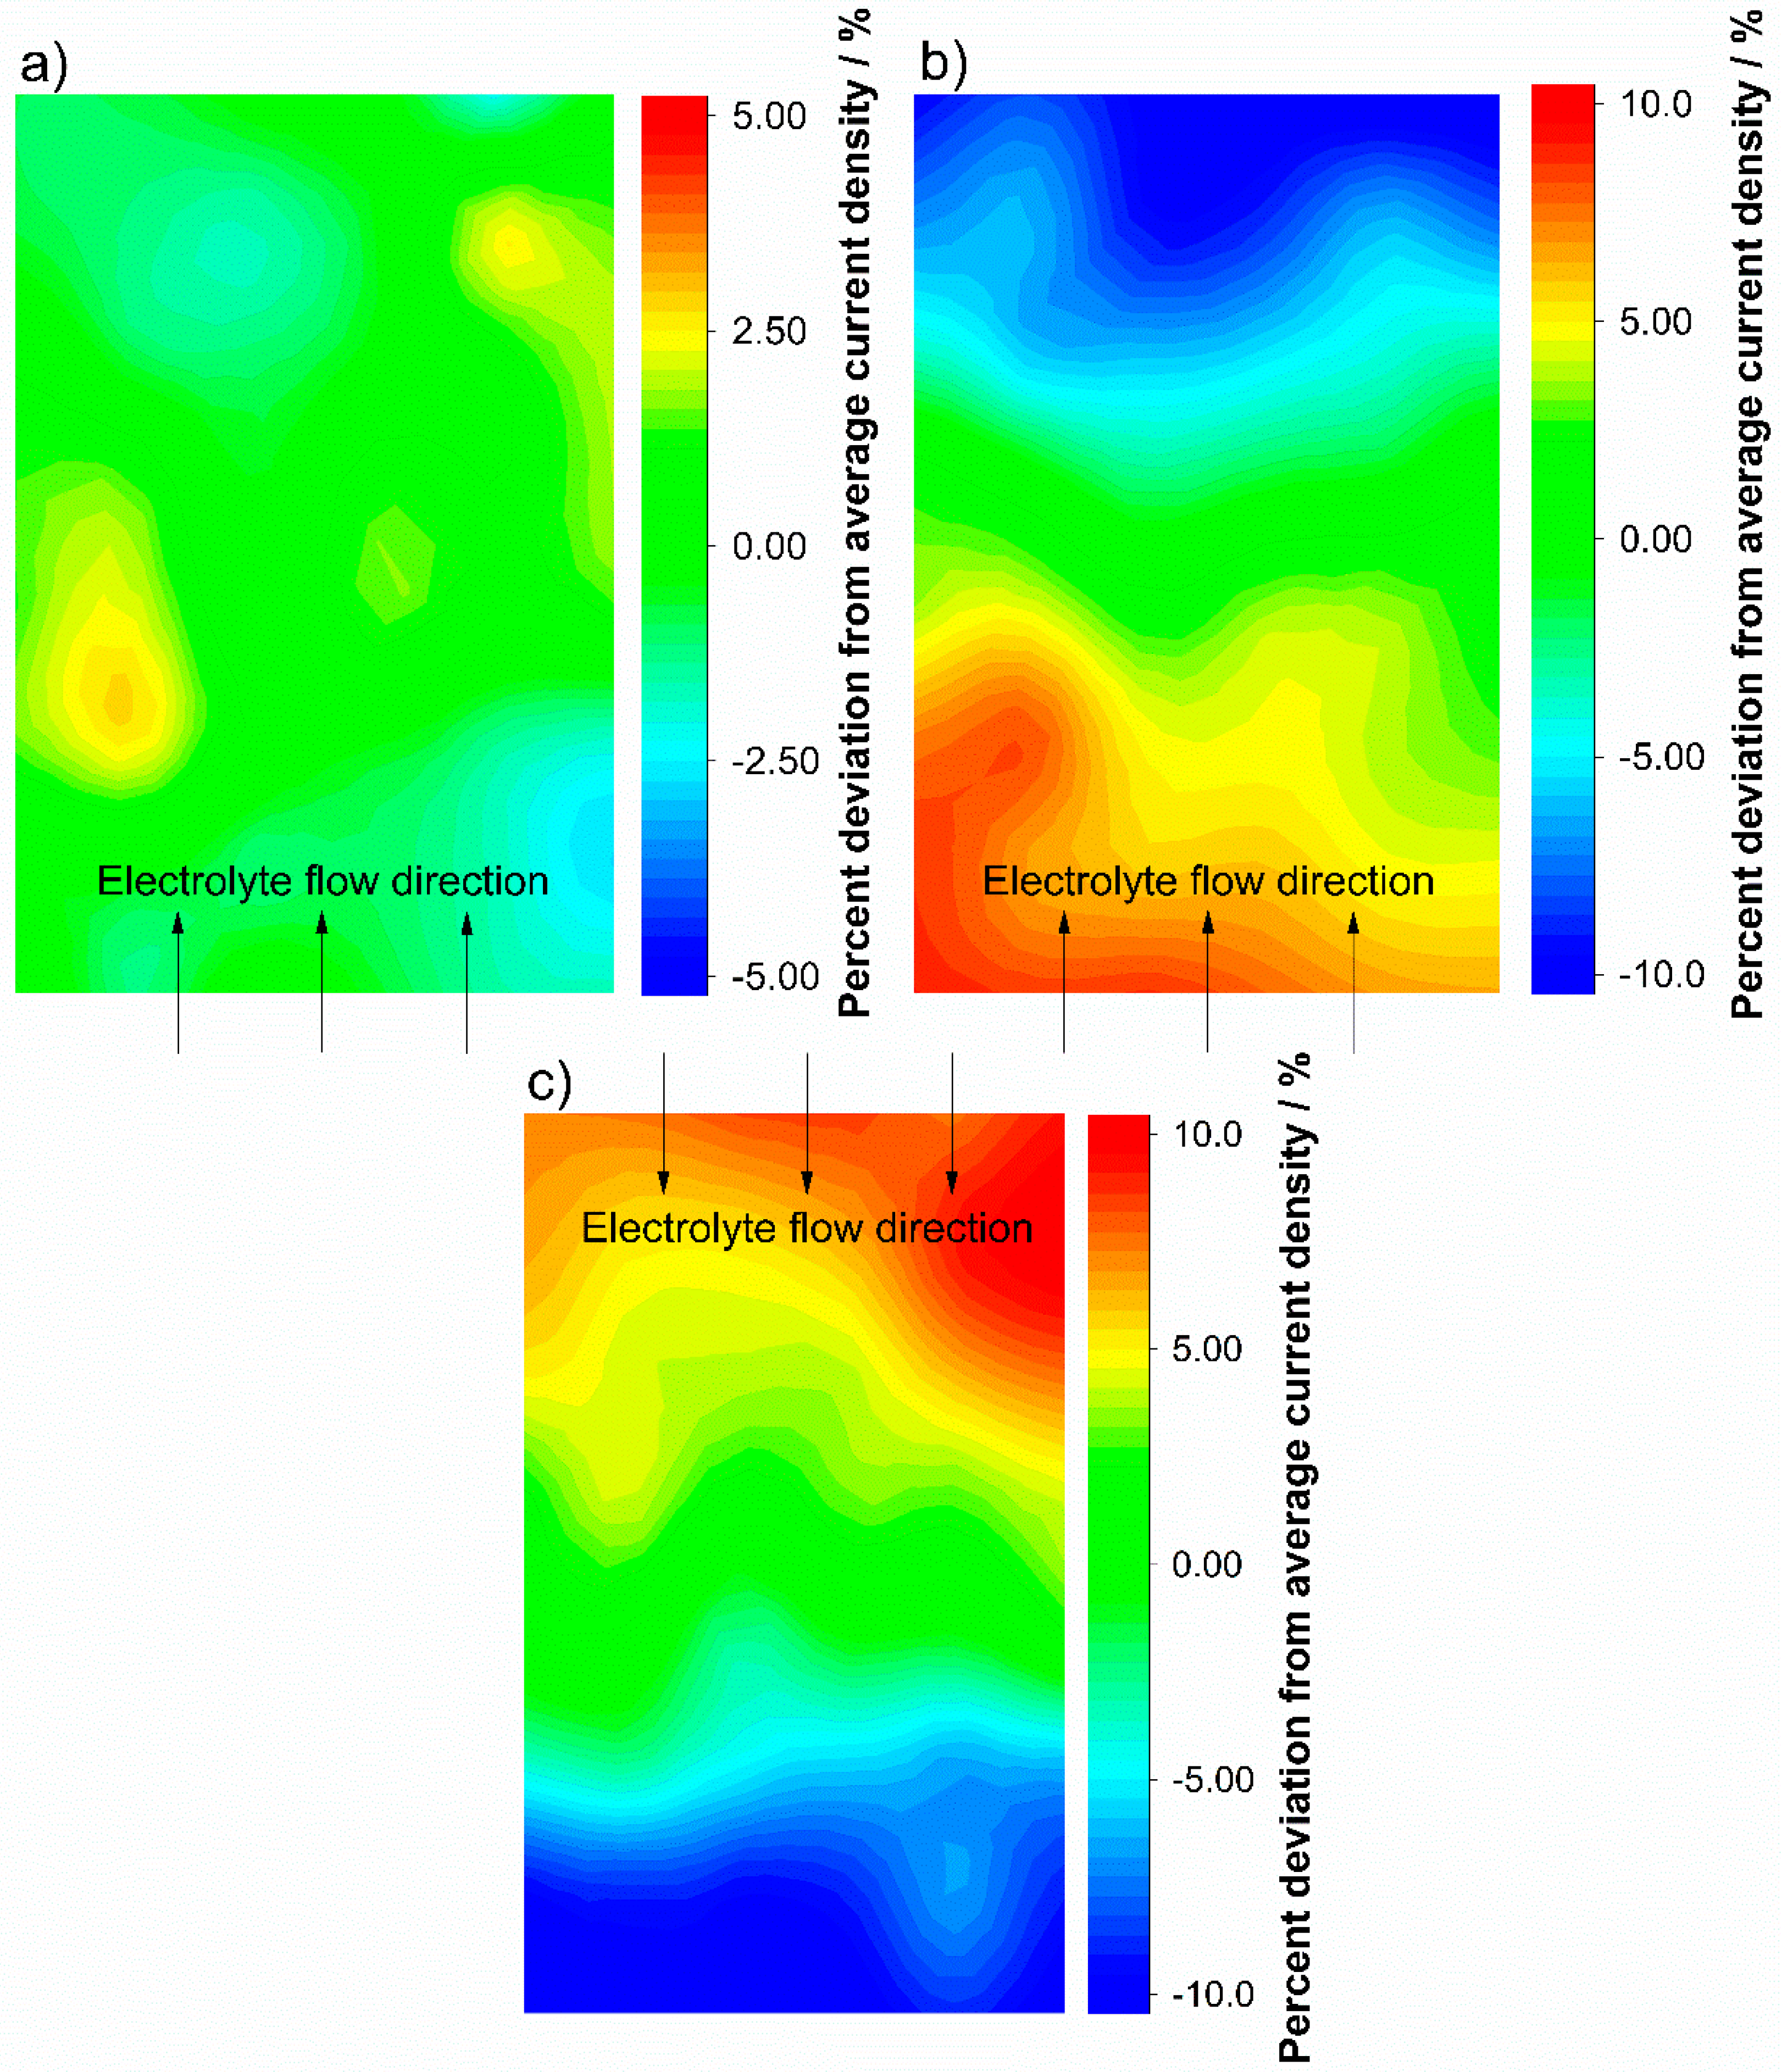
Figure 4 shows the current density distribution during discharge of the test cell with different flow rates and flow directions.
During discharge of the battery with 100 mA cm
−2 at an electrolyte flow rate of 2.5 mL min
−1 cm
−2, the current density distribution depicted in
Figure 4a is very uniform for the entire electrode area. By reducing the electrolyte flow rate to 0.5 mL min
−1 cm
−2, the stoichiometric factor was decreased from approximately λ ≈ 30 (a) to λ ≈ 6.5 (b) and (c) to a level which induced a significant concentration change resulting in the limitation of mass transport. From the electrolyte inlet to the electrolyte outlet, the diagram in
Figure 4b presents deviations larger than 20% of the average current density with a continuous slope. The gradient of the current density distribution mainly follows the concentration gradient of the electrolyte and, thus, roughly indicates the electrolyte flow. To prove this correlation,
Figure 4c shows the current density distribution under the same operating conditions from discharge with 100 mA cm
−2 and an electrolyte flow rate of 0.5 mL min
−1 cm
−2, but with reversed electrolyte flow for both half-cells from the now top inlet to the bottom. The current density distribution flipped in the same way as the electrolyte flow, and the result itself presents the same behavior. The high current densities are located at the electrolyte inlet region of the electrode, and the current density uniformly decreases towards the outlet. This supports the conclusion that in this measurement setup the current density distribution correlates with the concentration gradient and visualizes the electrolyte flow.
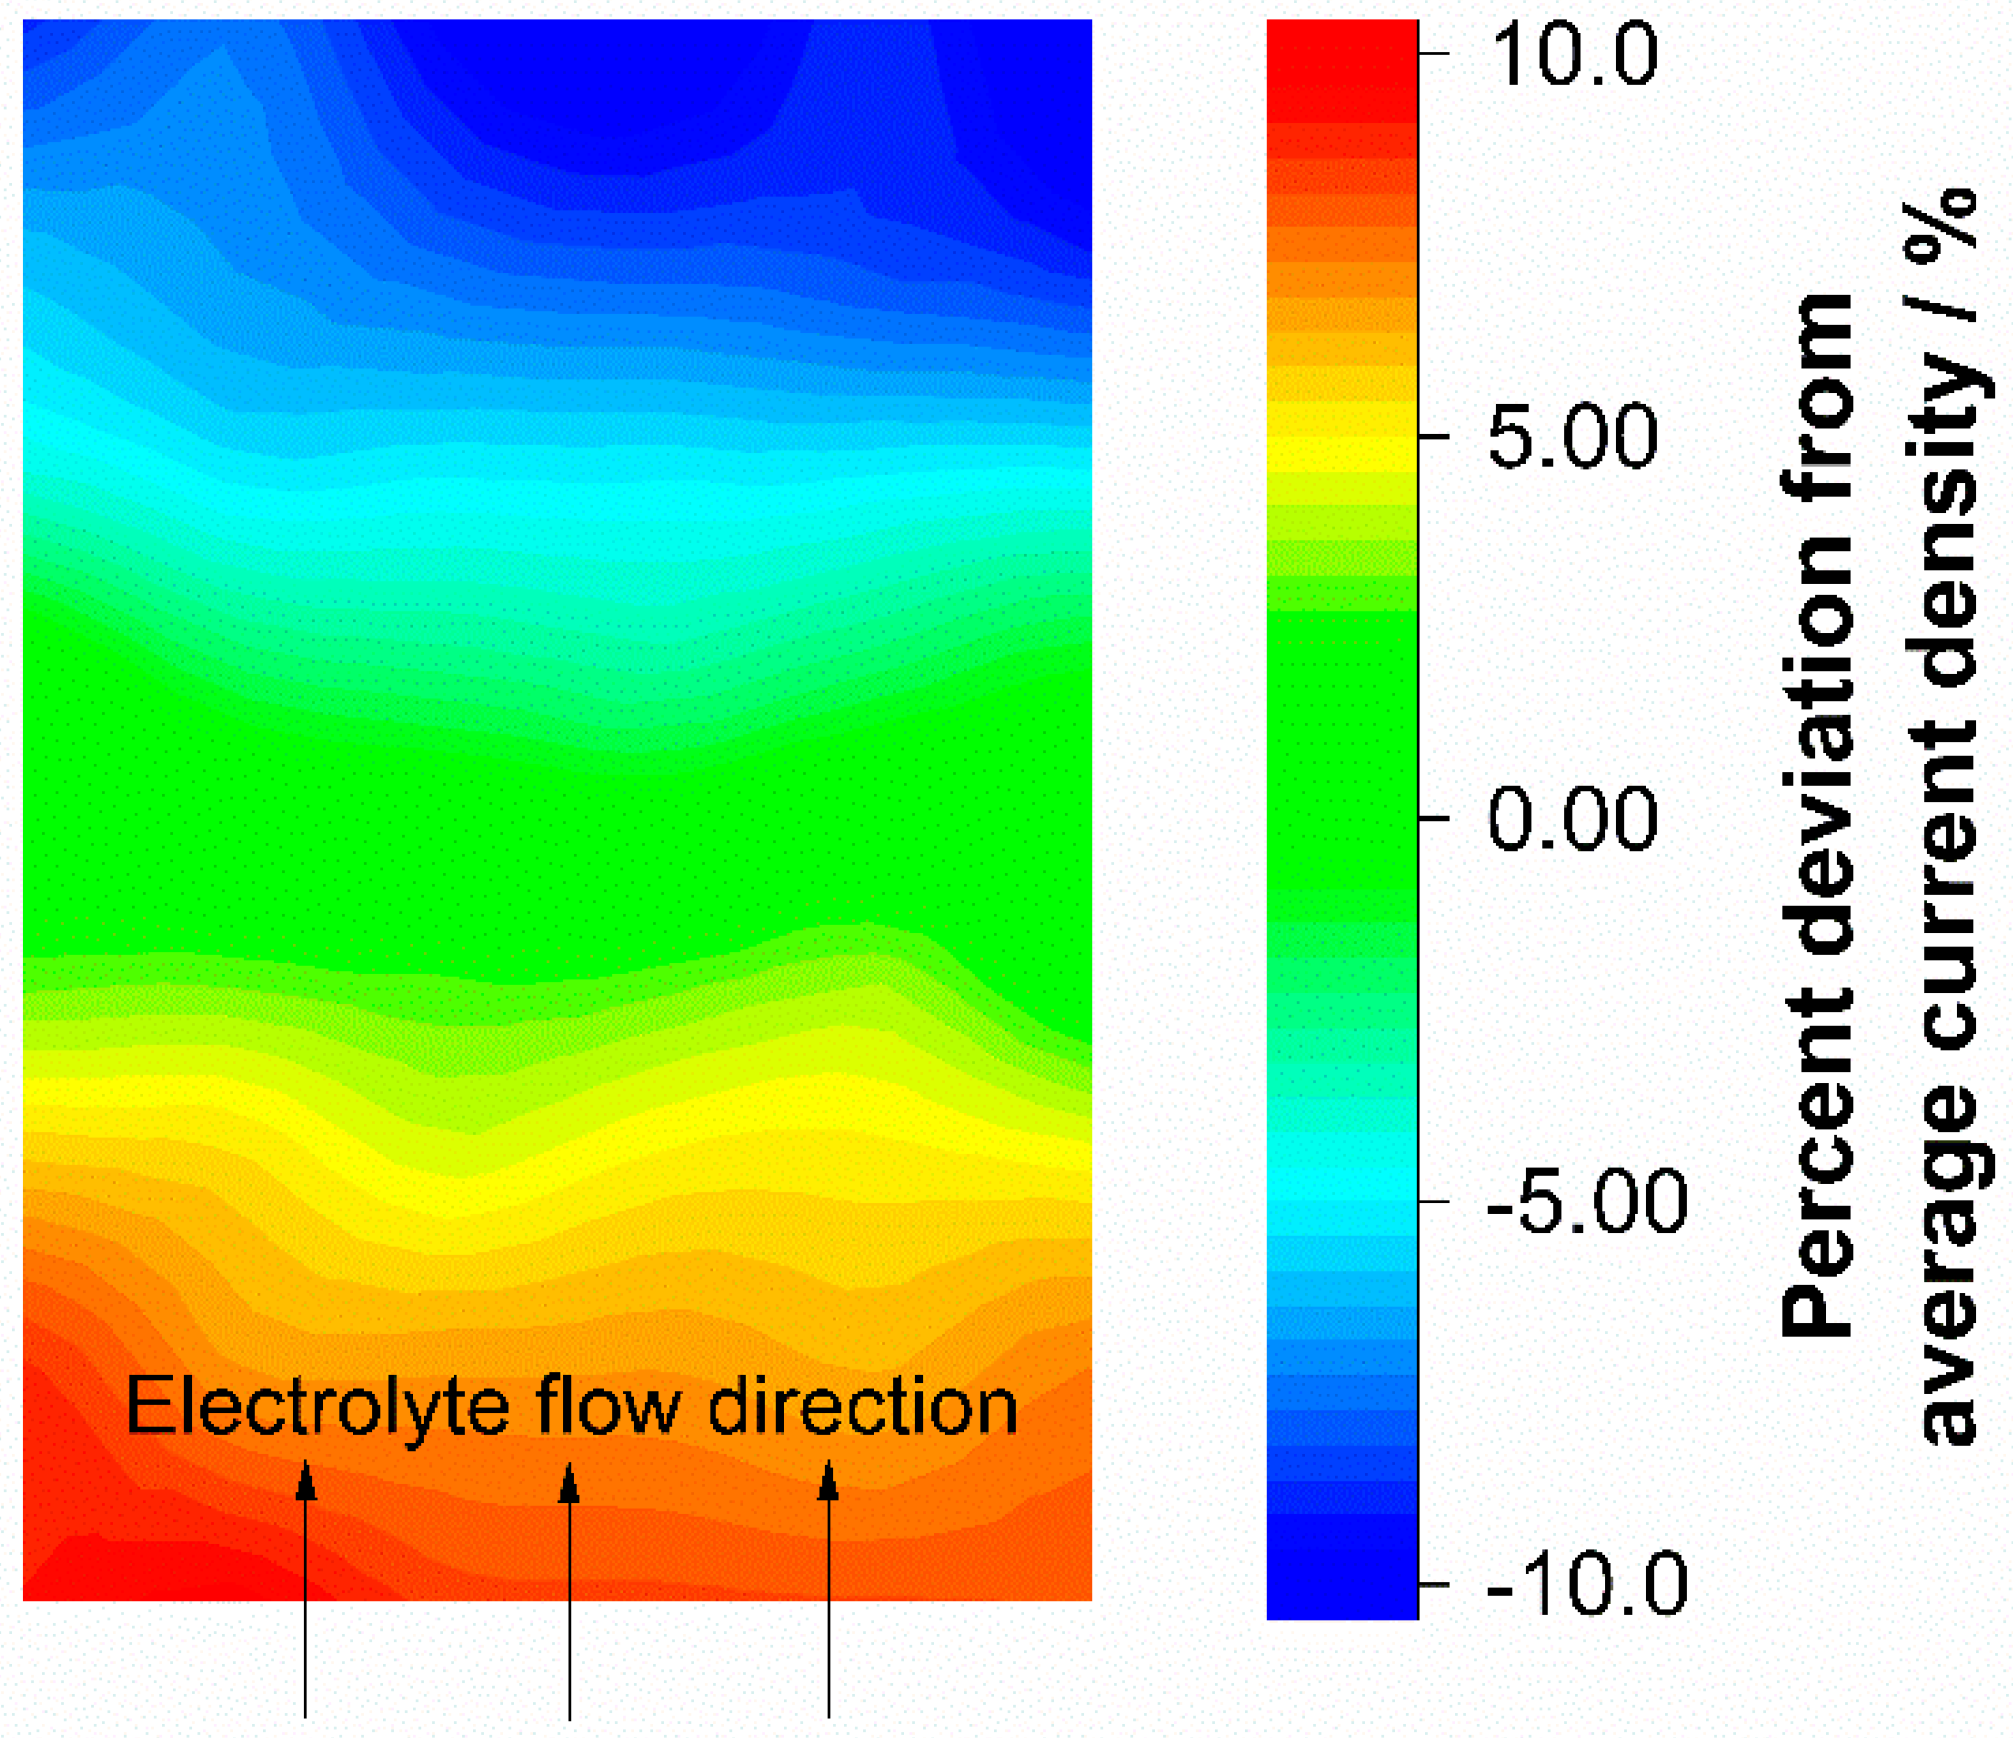
In experiments under normal operating conditions with high λ the current density distribution is dominated by the ohmic resistances of the test cell. When measuring with higher electrolyte conversion the redox flow battery reaches the mass transport limited region, and the current density distribution follows the concentration gradient of the electrolyte. As a result, the current density distribution visualizes the electrolyte flow. Nevertheless, positive or negative deviations at certain points which do not match with the gradient of the current density distribution are presumably caused by the electrode properties. The level of deviation induced by ohmic resistance mainly depends on the charge or discharge current. If two experiments are performed in the same test cell with the same discharge current but different electrolyte flow rate, the ohmic resistance part of the current density distribution—connected to the discharge current—should be same for both tests. Hence, the ohmic resistance part of the current density distribution (the measured current density per segment) can be subtracted to obtain the current density distribution, mirrored by the mass transport limitation of the electrolyte flow.
Figure 5 shows the current density distribution for which only the mass transport limitation was considered.
The current density distribution diagram in
Figure 5 shows the difference between the values in
Figure 4a,b. The resulting diagram of the deviations also shows a gradient from the electrolyte inlet to the electrolyte outlet. Since the ohmic resistance part of the current density distribution is regarded as an offset for the mass transport dominated operation of the test cell, the current density distribution does not feature deviations at certain points. The current density distribution in the test cell results in a relatively smooth slope of the current density gradient. The gradient is evenly distributed over the entire electrode area. The current density distribution during battery operation dominated by mass transport limitation mirrors the electrolyte flow, and proves that the test cell flow frame supplies the porous electrode area as desired and without critical hotspots occurring with a local undersupply.
The accuracy of a locally-resolved measurement method is essential for the interpretation and further use of the experimental results. A complete segmentation of the investigated half-cell is not feasible since the electrolyte solution supports the ionic conduction inside the electrode segments even when the porous electrode would be segmented. In preliminary studies, the graphite felt was segmented to avoid smearing of the current. The segmentation was achieved by separating graphite felt by an insulating woven filter medium with properties such as porosity and specific weight similar to the GFA5 electrode. The experiments indicated that even small modifications of the porous electrode affect the current density distribution compared to the original configuration. For this reason, it was important not to modify the test cell except for the segmented electrode on the printed circuit board.
The machine-made printed circuit board electrode offers a higher accuracy (around ±2% of the measurement setup) than hand-built hard-wired segmented electrodes. Small deviations in the current density distribution in the accuracy range of the printed circuit board can be measured in the test cell. The sensitivity of the measurement setup is tested by investigations of the test cell at operating conditions where only a very small inhomogeneity of the current density distribution occurs. While charging the test cell with 25 mA cm
−2 at an electrolyte flow rate of 2.5 mL min
−1 cm
−2 there is only a small change in the electrolyte concentration gradient, and the current density distribution is a result of different effects. Due to the high λ > 100 at this operation point there is no mass transport limitation, and the current density distribution is mainly dominated by ohmic resistances and activation losses. For two experiments at the same flow rate and the same charging current, the electrolyte flow structure in the test cell is varied. By comparing the resulting current density distribution, the accuracy of the measurement setup is demonstrated. The mapping presented in
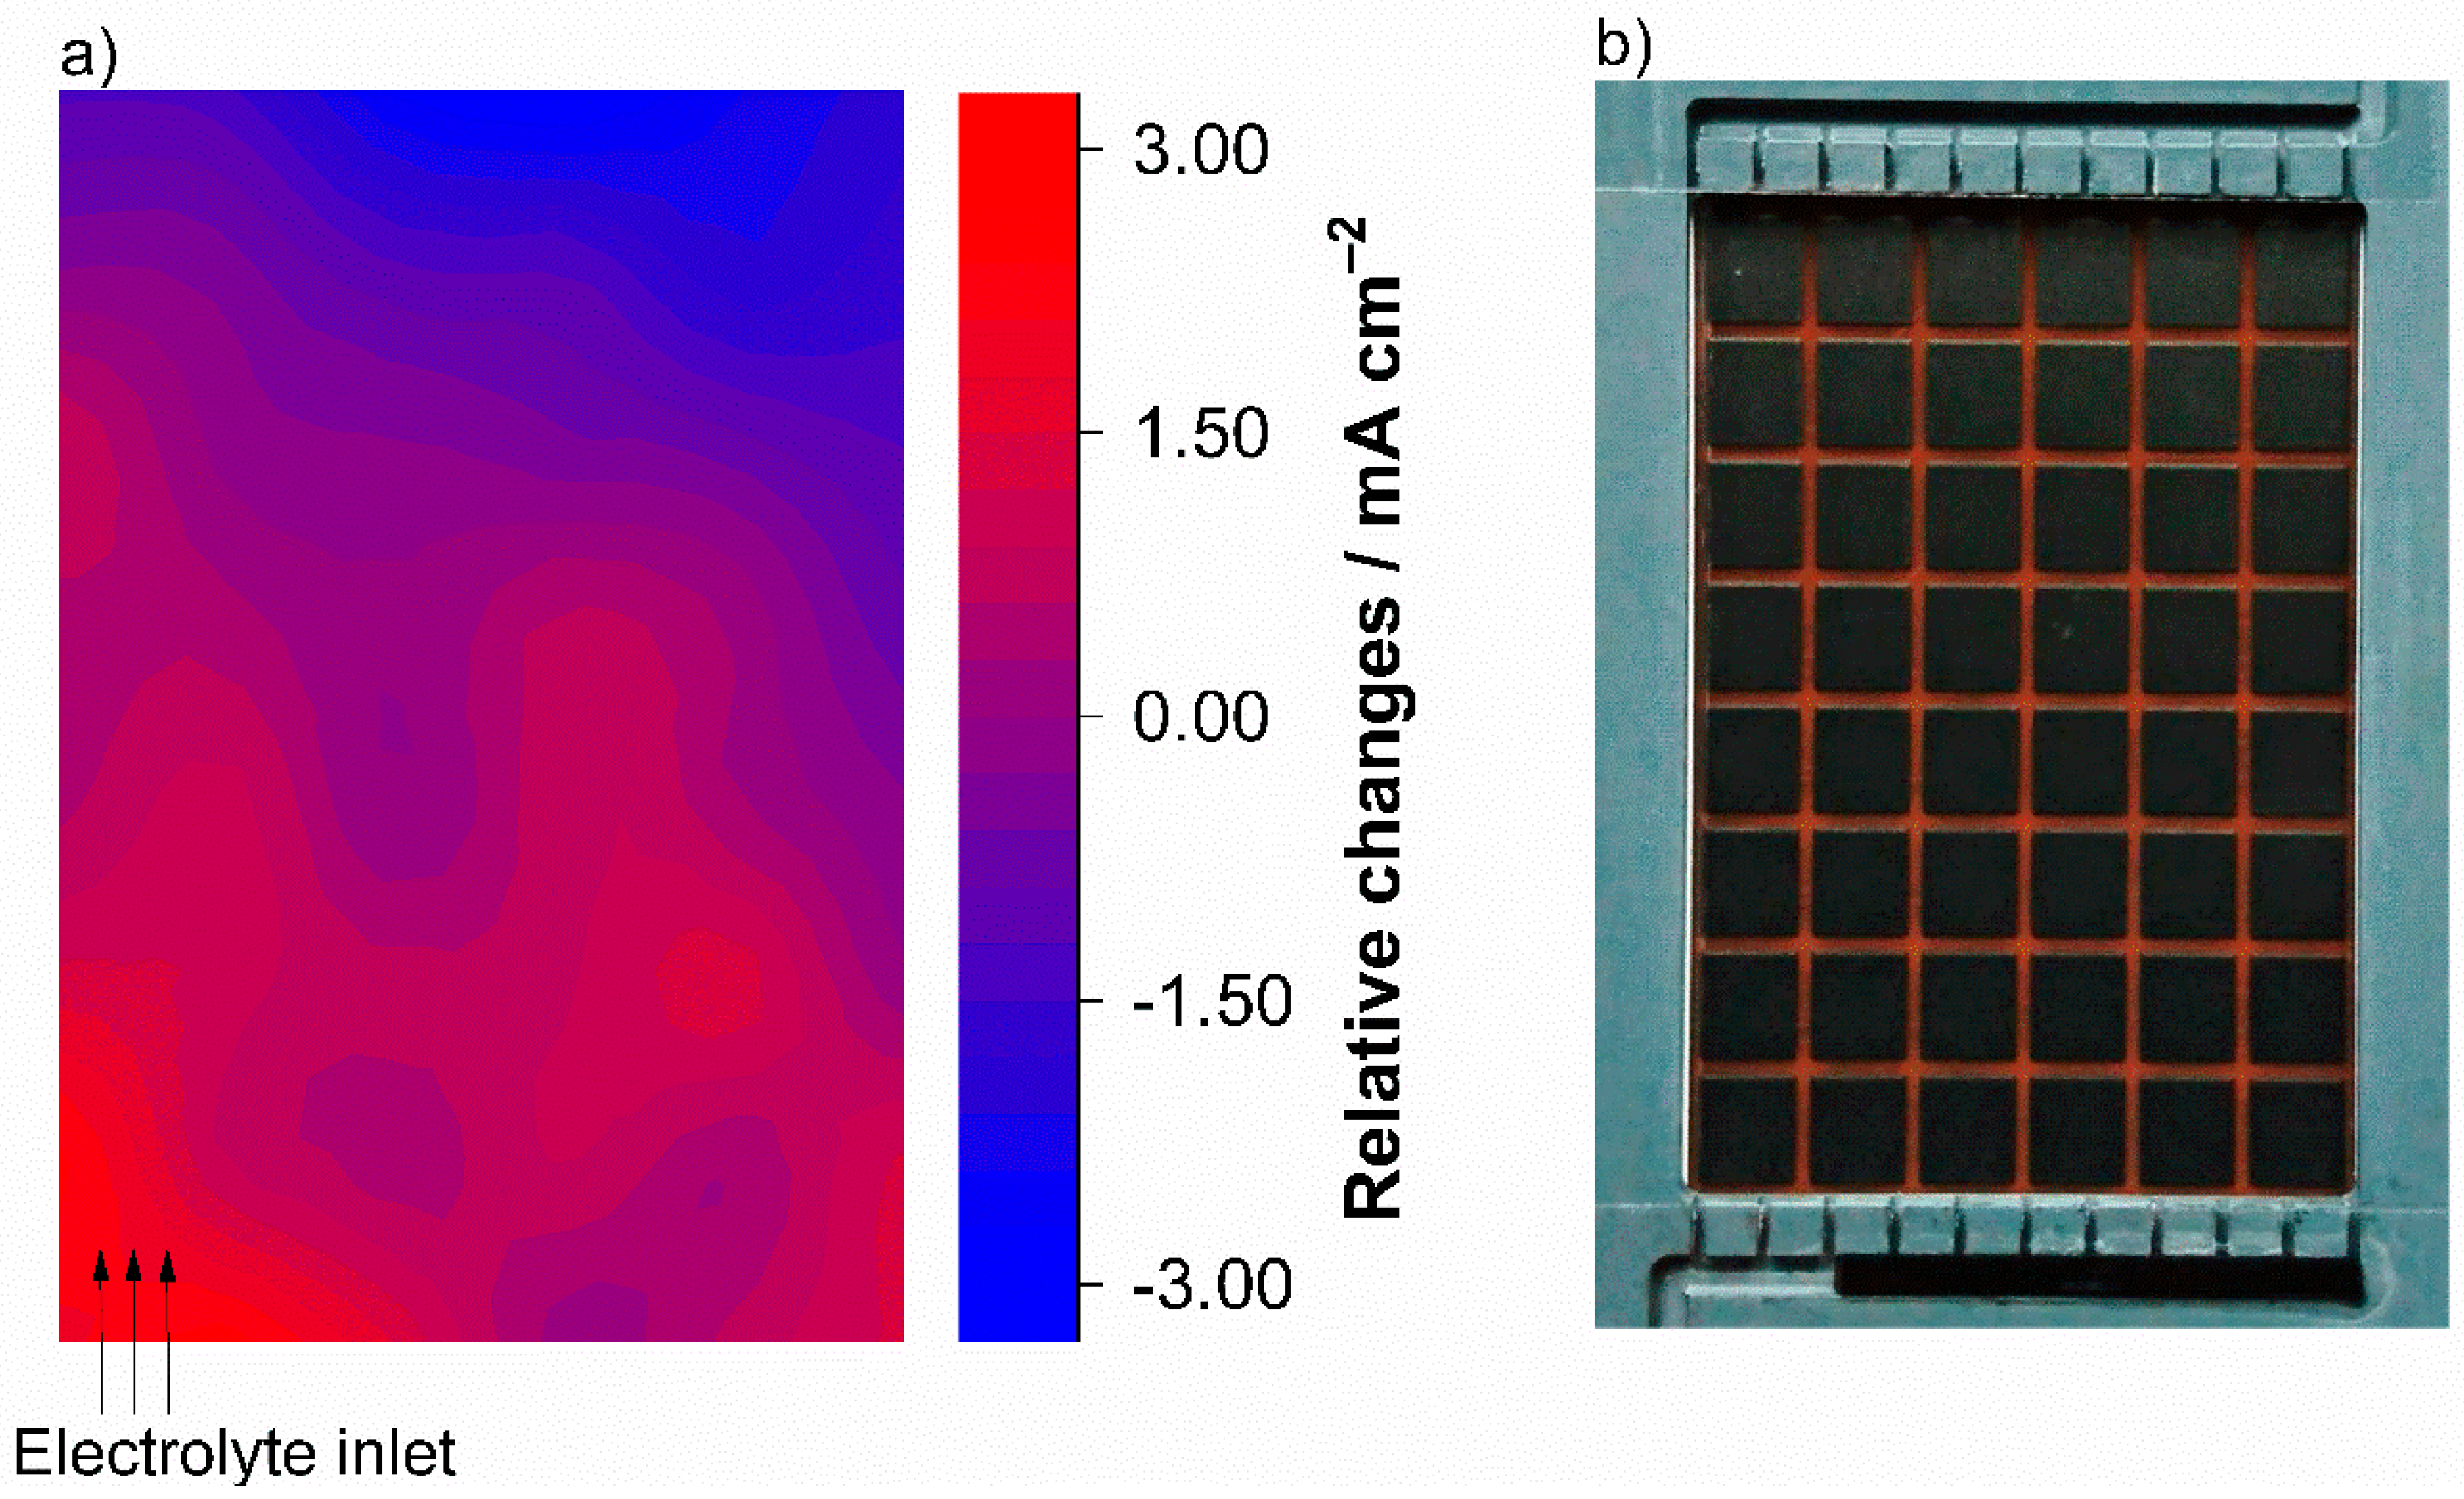
Figure 6 shows the differences in the current density distributions of the test cell at a modified electrolyte inlet.
In the first measurement the test cell was cycled in standard configuration. For the second measurement, the electrolyte inlet structure was partially blocked as shown in
Figure 6b. Under the same operating conditions, with an electrolyte flow rate of 2.5 mL min
−1 cm
−2 and 25 mA cm
−2, the electrolyte inlet was varied from completely open to only a quarter on the left of the flow frame. Due to the low electrolyte conversion (at SOC 50%, λ > 100) the current density distribution for both experiments show similar results. Mass transport limitation did not cause any gradients in the current density distribution. When the two experiments are compared, it can be seen that the blocked electrolyte flow results in relative changes in the current density distribution. The deviations in the current density distribution are plotted in
Figure 6a. Starting from the left side of the electrolyte inlet, the deviation forms a circular gradient and thus again seems to mirror the electrolyte flow in the porous electrode. Only the differences between both experiments are mapped.
For all-vanadium redox flow batteries, two coupled redox reactions are applied for storing energy:
Before the first charging of the battery, or after mixing both electrolyte solutions for regeneration, both electrolytes consist of an equilibrium of V
3+ and V
4+. To get from this theoretical SOC of −50% to the normal charge and discharge mode, the electrolyte solutions must be pre-charged. This initial step is often referred to as initialization. During initialization, at the positive electrode the V
3+ is converted to V
4+ and at the negative electrode V
4+ is converted to V
3+. Roznyatovskaya et al. describe how the electrochemical reaction from V
3+ to V
4+ in the cathode half-cell reaction during initialization is not a straightforward reaction and proceeds via a more complicated reaction path [
40]. If during initialization the reaction would follow the direct path from V
3+ to V
4+, the current density distribution of the test cell would be expected to be similar to the regular charging.
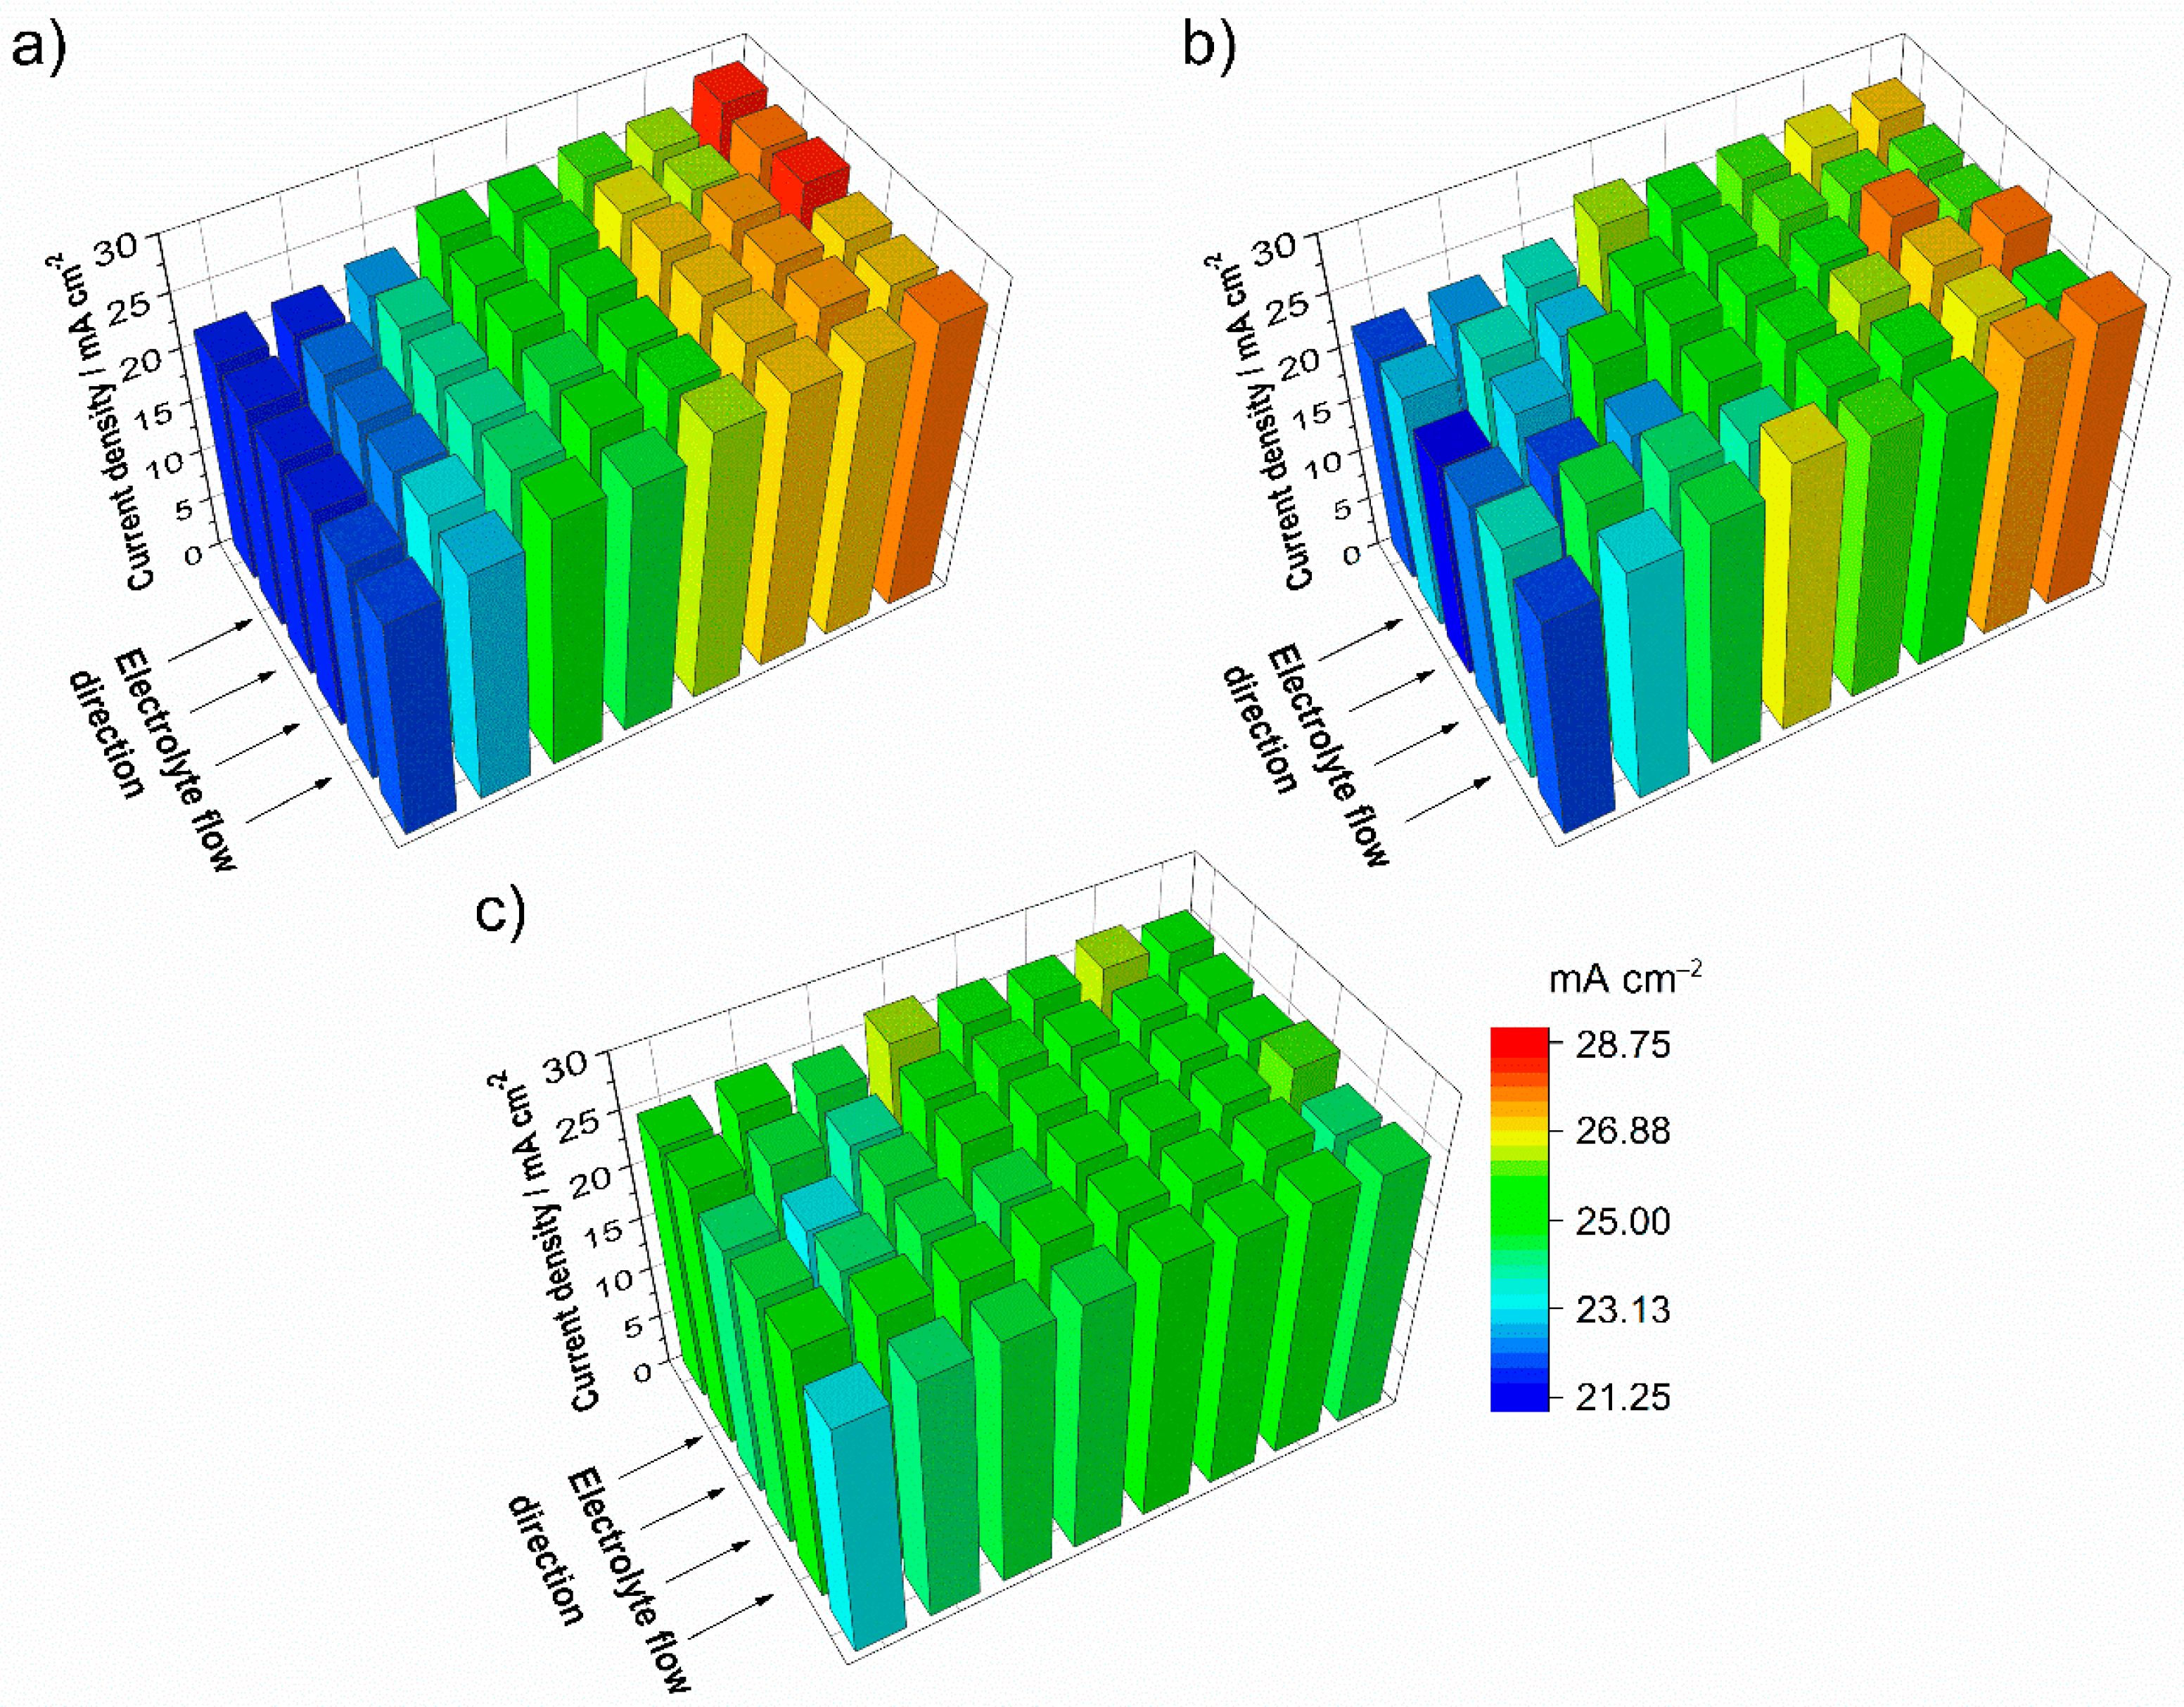
Figure 7 presents the current density distribution of the positive electrode during galvanostatic initialization with 25 mA cm
−2.
During initialization, the current density distribution of the positive electrode, where V
3+ is converted to V
4+, varies with the SOC. After the start of charging (25 mA cm
−2) at the theoretical SOC of −50% the current density distribution is depicted in
Figure 7a. At this operation point the current density distribution displays a gradient from the electrolyte inlet to the electrolyte outlet of the test cell with a constant slope from around −15% to +15% of the average current density. The previously shown experiments during charging did not feature any gradients of the current density distribution due to the limitation by the cut-off voltage. A domination of the local current density by mass transport limitation would result in a reversed gradient of the current density distribution from the electrolyte inlet to the electrolyte outlet. The current density distribution measured in this experiment is assumed to confirm the study of Roznyatovskaya et al. Directly after entering the electrode area, V
3+ very slowly reacts to V
4+. Subsequently V
4+ oxidizes to V
5+. With a longer stay in the half-cell, V
5+ and V
3+ ions comproportionate into two ions of V
4+, triggering a self-catalytic reaction. The further trend of the current density distribution with proceeding initialization, presented in
Figure 7b at SOC −25%, follows the reaction kinetics of the formation of V
4+ and displays the same direction of the gradient but with less intensity. The intensity of the current density distribution gradient decreases as the initialization progresses, reaching conditions close to regular charging, as shown in
Figure 7c at SOC 0%. After this point, the current density distribution is very uniform over the entire electrode area.
3. Experimental
To achieve an accurate measurement of the local current density, it is important to minimize the effects on the battery of structural changes to the configuration.
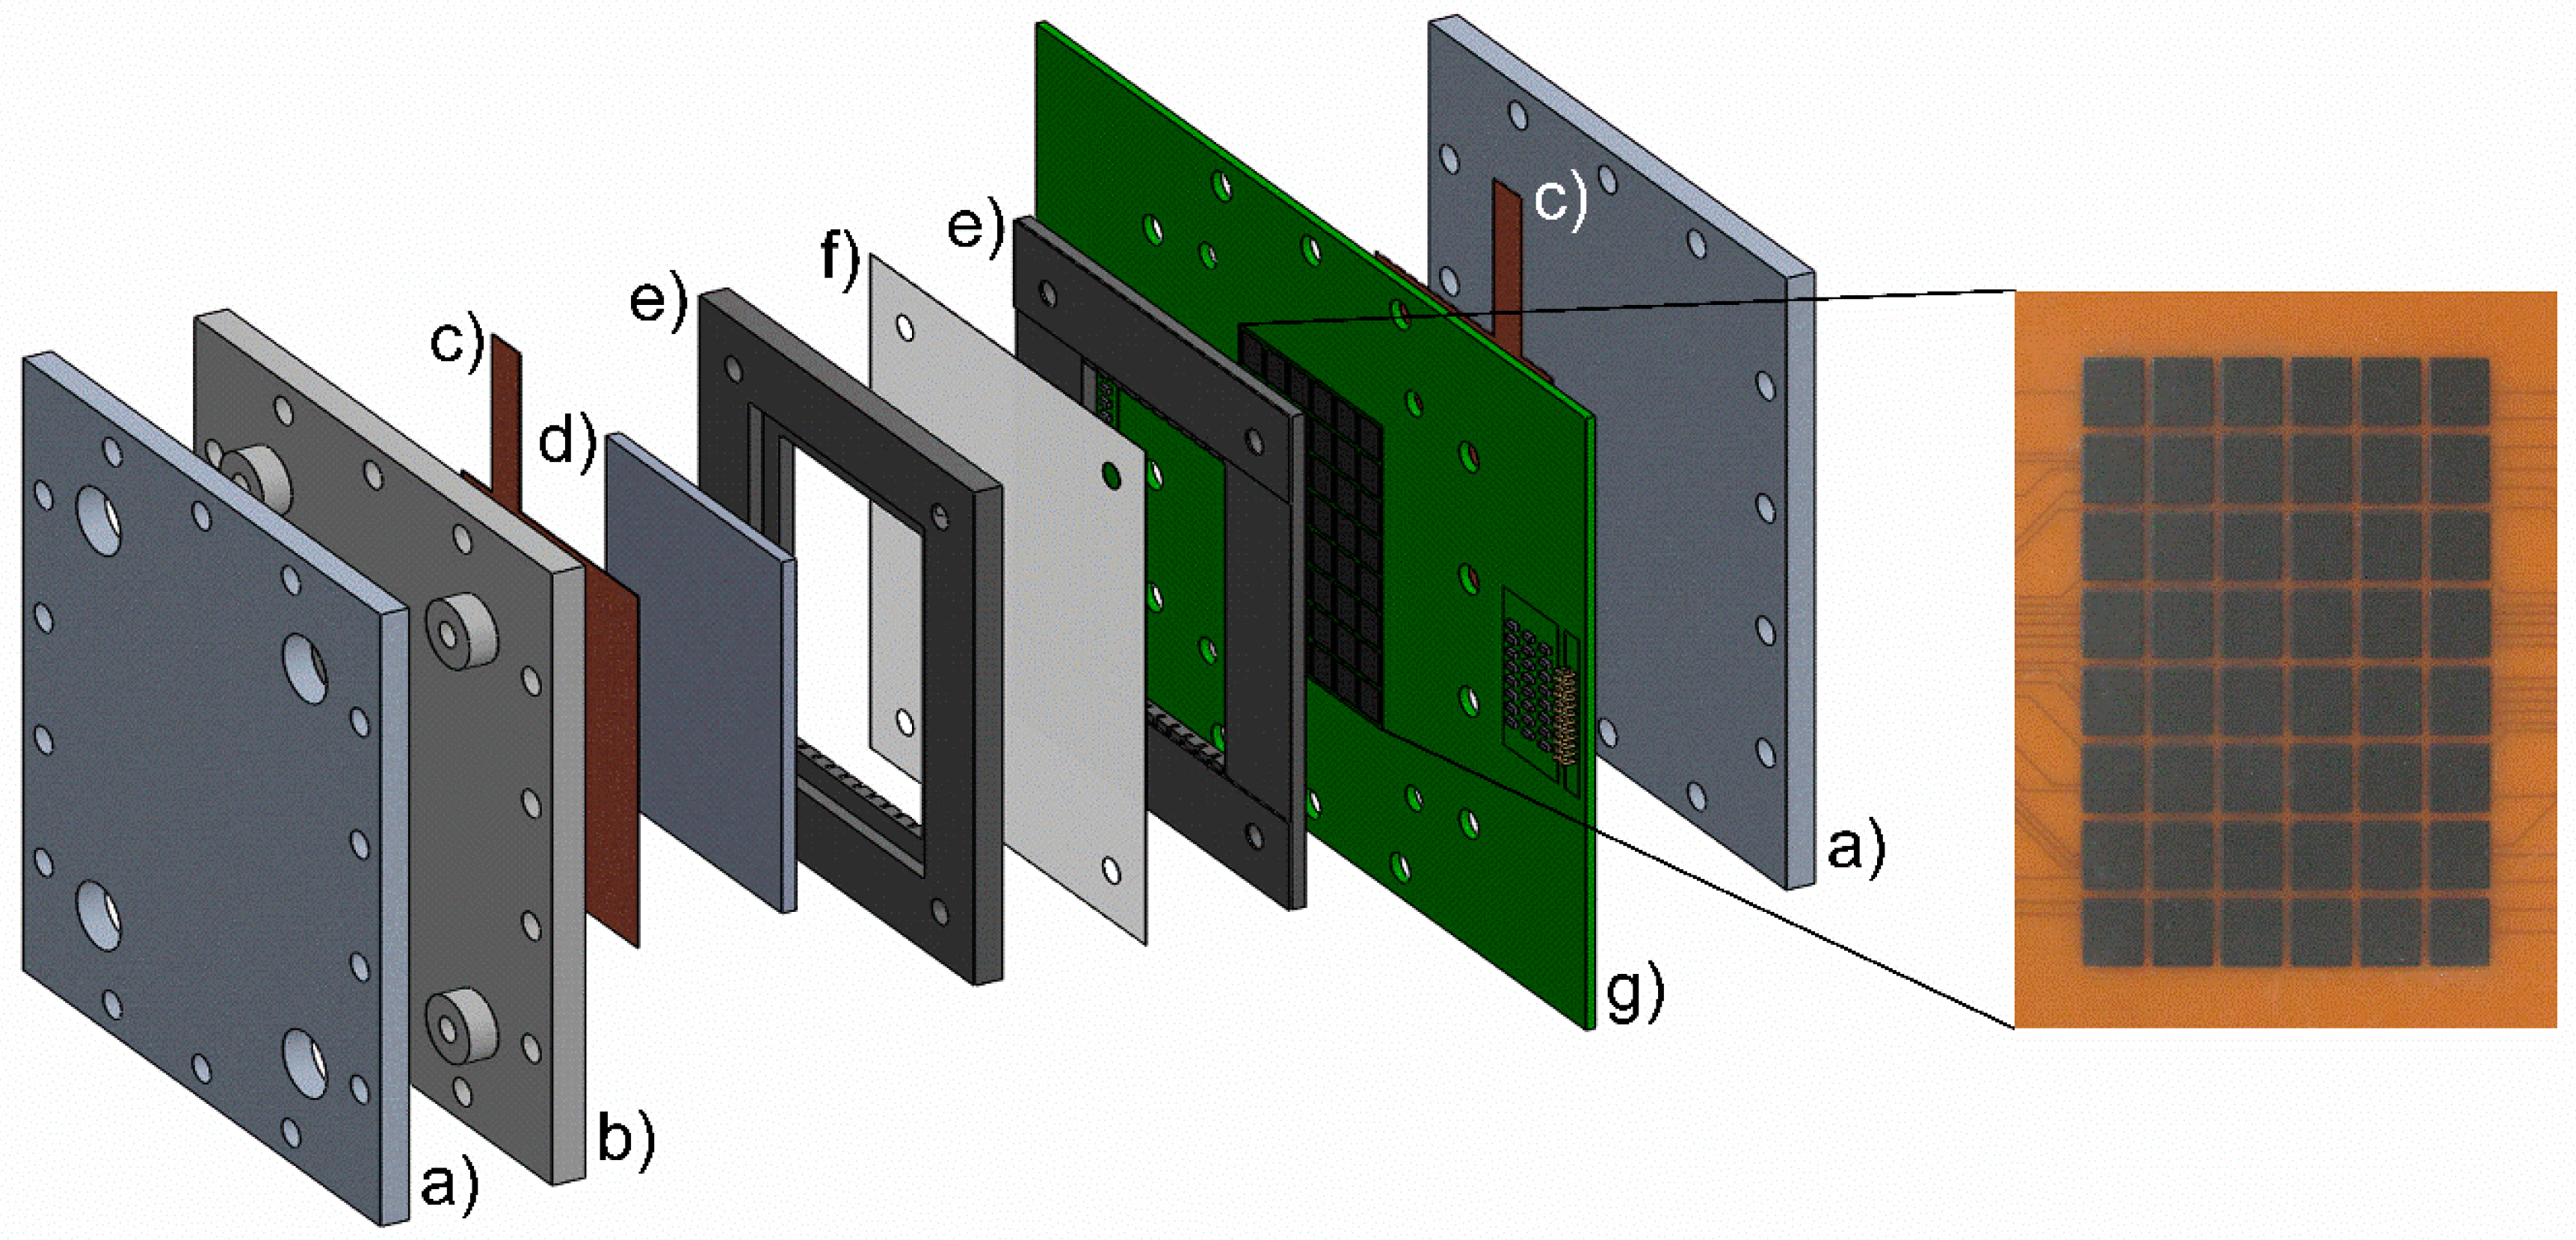
Segmented current collector—A printed circuit board with segmented contact areas was fabricated. This printed circuit board can be integrated as a bipolar plate/internal current collector in a redox flow test stack/cell to measure local current densities. The segmented current collector is arranged at the front side of the printed circuit board with 48 single current collector segments. The single segments with a size of 8.5 mm by 7.5 mm and 1 mm spacing are placed uniformly in a pattern of 8 by 6 on the electrode area of 40 cm
2. The fully-segmented electrode allows the current conduction only in through-plane direction without lateral spread. The reverse side is designed as a common current collector. The front side and the reverse side of the printed circuit board are connected by traces. In every trace from the front side segment to the current collector, a shunt resistor is soldered onto the printed circuit board at which the voltage drop is measured. Based on the voltage drop at a known shunt resistor, the local current density is calculated. The electrolyte solution of all-vanadium redox flow batteries consists of semi-concentrated sulfuric acid (~2 M) and vanadium sulfates (~1.5–1.8 M). The electrolyte solution is very corrosive in the charged state. Clement et al. use a fully-segmented flow plate to prevent the contact of the printed circuit board and electrolyte solution [
16]. To minimize both the complexity of the setup and the structural alteration of the characteristic components, and to avoid lateral current spread of the measurement equipment, the printed circuit board needs to be integrated directly into the redox flow battery. The segmented current collector and the common current collector on the reverse side of the printed circuit board in this study were coated with a protective carbon ink. The carbon ink consists of graphite as the conductive component and a phenol resin as the binder, and can be applied by screen printing. Graphite and phenol resin are chemically stable in the electrolyte and are also used in commercial bipolar plates. For the presented measurements a conductive coating with a thickness of 20 µm was applied. The chemical stability of the printed circuit board was determined in galvanostatic cycle tests.
Since the local effects in redox flow batteries may appear in a very small range, the accuracy of the printed circuit board, including electrodes, traces, and shunt resistors, is of great importance. In contrast to hand-built hard-wired fabrication, a segmented electrode on a printed circuit board is machine-made. This means that a minimal deviation of the resistances in the trace from the segmented electrode to the current collector can be achieved. In addition, the size, the placement, and the layer thickness of the electrode segments is very consistent. The printed circuit board used in this study has deviations of less than 2% in the ohmic resistance for the 48 segmented channels and therefore is suitable for localized investigations of redox flow batteries.
Measurement setup—Charge and discharge experiments with the 40 cm2 laboratory cell were operated with BaSyTec GSM Battery Test System (BaSyTec GmbH, Asselfingen, Germany). Before assembling the test cell, the resistances of the individual traces from the shunt resistor to the ground reference on the collector electrode were determined by electrochemical impedance spectroscopy using a ModuLab 2100A potentiostat (Solartron Analytical, Farnborough, UK). The electrolyte solution was circulated through the system with two adjustable membrane pumps SIMDOS® 10 (KNF Neuberger GmbH, Freiburg, Germany). The flow rate can be varied between 0.1 and 100 mL min−1. The printed circuit board was connected to a data acquisition system NI USB-6225 (National Instruments Germany GmbH, München, Germany) to measure the voltage drop with a resolution of 15 bit at the analog digital converter. The measured data were read and evaluated by a software based on LabVIEW (National Instruments Germany GmbH, München, Germany).
Cell configuration—The measurement setup consisted of an all-vanadium redox flow laboratory test cell in a conventional flow frame design with thick felt electrodes. Compared to previous studies a rectangular flow frame with a total area of 40 cm
2 and an electrode dimension of 7.7 by 5.2 cm was used. The battery was assembled with a fumasep
® FAP-450 anion-exchange membrane (FUMATECH BWT GmbH, Bietigheim-Bissingen, Germany), a double layer graphite felt SIGRATHERM
® GFA5 (SGL CARBON GmbH, Wiesbaden, Germany), and bipolar plates FU 4369 (Schunk Kohlenstofftechnik GmbH, Heuchelheim, Germany). The graphite felts were thermally pretreated with 400 °C for 1 h and were compressed to 75% of their original thickness in the cell. The vanadium electrolyte solution from GfE (Gesellschaft für Elektrometallurgie mbH, Nürnberg, Germany) contained 0.8 M VOSO
4/0.4 M V
2(SO
4)
3 in 2 M H
2SO
4 and 0.05 M H
3PO
4. In order to prevent oxidation from the anolyte electrolyte in the air, the reservoir of the V
2+/V
3+ solution was aerated with nitrogen.
Figure 8 shows the assembly of the 40 cm
2 laboratory single cell with an integrated printed circuit board for locally-resolved measurements and a detailed picture of the segmented electrode area. The battery was charged with constant current up to 1.6 V and discharged with constant current up to 0.8 V.
Evaluation and visualization of the data—The measurement data—the voltage drop at the shunt resistors—were recorded once per second. The local current density was calculated by the ohmic law and the specific electrode area per segment. For reliable evaluation of the experiment, the presented data were averaged over five seconds. The relevant results were graphically edited and then presented in a diagram. In the literature two methods for the graphical evaluation of locally-resolved distributions have been established: A 3D bar diagram shows the measured current density at the respective measuring point, and a 2D contour diagram shows the smoothed data as a percentage deviation from the average current density.


