Abstract
This paper presents a fully embedded state of health (SoH) estimator for widely used C/LiFePO4 batteries. The SoH estimation study was intended for applications in electric vehicles (EV). C/LiFePO4 cells were aged using pure electric vehicle cycles and were monitored with an automotive battery management system (BMS). An online capacity estimator based on incremental capacity analysis (ICA) is developed. The proposed estimator is robust to depth of discharge (DoD), charging current and temperature variations to satisfy real vehicle requirements. Finally, the SoH estimator tuned on C/LiFePO4 cells from one manufacturer was tested on C/LiFePO4 cells from another LFP (lithium iron phosphate) manufacturer.
Keywords:
accelerated ageing; battery management system; battery management system (BMS); calendar ageing; cycling ageing; electric vehicle; embedded algorithm; incremental capacity analysis; incremental capacity analysis (ICA); lithium-ion battery; lithium iron phosphate; LFP; LiFePO4; remaining capacity; state of health (SoH) 1. Introduction
The electrochemical storage system management remains challenging in electric vehicles (EV). Lithium-ion batteries appear as a promising alternative to address current energy needs in various applications such as electric vehicles (EV) and hybrid electric vehicles (HEV). A reliable State of health (SoH) estimation is mandatory to deal with the exact remaining energy available in the battery and thus to compute the vehicle remaining range. More broadly, a precise battery state knowledge is essential for EV development [1,2,3,4,5,6,7,8]. In this study focusing on pure electric vehicle, the remaining capacity is the most relevant parameter. State of health (SoH) is then defined as the ratio of the maximum capacity in the current state and the maximum capacity at the beginning of battery life (BoL) while, in case of HEV, the SoH can also be defined relative to the remaining available power instead of the capacity. Equation (1) presents the SoH percentage definition used in this work:
The challenge of this work is to get an online and embedded SoH estimation compatible to the constraints of the EV. Indeed, the EV is rarely fully discharged and its DoD (depth of discharge) ranges usually from 40% to 80% during cycling and with charge regime ranging from C/6 to C/3. Namely, the estimator has to be able to measure the “maximum capacity in the current state” during the nominal use of the vehicle, i.e., without a full discharge of the battery (otherwise the vehicle is out of order). State of health has to be calculated by the battery management system (BMS) using sensors and electronic commonly used in vehicles embedded applications. This automotive electronic system should thus deal with strong cost constraints and wide environmental variations.
The instrumentation required to determine the SoH should be as simple as possible to ensure that the cost of the BMS is reasonable. The algorithms studied in this paper use only measurements of voltage, current and temperature, which are already present in the BMS. No active stimulation device of the cell is used (current injection for example).
The algorithms proposed use the cell response in real operating conditions of an electric vehicle. The classical methods usually employ the charge phase as the basis of analysis because this phase is much better controlled than the discharge. It is therefore necessary to obtain as much information as possible from the current, voltage and temperature measurements during the charging phases of the battery.
Approaches to estimate SoH may consist of using dynamic estimation of the parameters of an equivalent model. This requires adaptive algorithms such as estimators or observers ([9,10]), genetic algorithm [11] or neural networks [12]. Some authors suggest mixing several methods [12]. These algorithms often require a large amount of computing time and memory allocation, which can be annoying in some applications (e.g. EV).
An original method proposed by Guo et al. [13] is based on monitoring the evolution of the charging curves over the life of the battery. The algorithm for identifying the numerous parameters can be quite complex and the operation on partial charging curves (charging cycles starting from a state of charge different from one cycle to another) remains to be tested.
A method often used to estimate SoH is by using a coulometric counter. To take into account the constraints related to electric vehicles, the voltage thresholds reached during the cycle of operation of the vehicle are used [14]. Nonetheless, a steep charging curve is required which is not the case for C/LiFePO4 cells. The proposed estimator is based on the well-known incremental capacity analysis (ICA) method [15]. If ICA is very powerful when applied in a controlled environment, it has hardly ever been used with uncontrolled environmental variations to propose an online capacity estimator considering EV constraints. Few authors proposed papers dealing with ICA implementation as an embedded SoH estimator. Weng et al. [16] proposed an embedded ICA implementation using a mathematical fit as data filter. They claim satisfying results. Nonetheless, they worked with small capacity cells and above all, they do not study the influence of environmental variation such as temperature or DoD on their estimator. Han et al. [17] also proposed a very interesting ICA implementation to directly obtain the dQ/dU curve through the “point counting method”. This method is a way to implement the ICA with very few computing power, but does not provide robustness to environmental variations.
In this study, ICA is implemented on large capacity cells and with industrial constraints such as costs reduction, reliability as the main guidelines.
This work was divided in three main parts. First, large capacity cells were cycled using an EV driving profile to obtain aged cells. Secondly, on each aged cell, charging cycles were performed with temperature, charging current and depth-of-discharge changing. Thirdly, using recordings of these cycles, an ICA based SoH estimator was developed.
Next paragraph introduces the incremental capacity analysis method. The following one presents the experimental process and the last one deals with embedded and ICA implementation and results.
2. ICA Presentation
Incremental capacity analysis is an electrochemical technique, which provides information about the internal cell state using only the cell voltage and current measurements [18,19,20,21]. The incremental capacity (IC) depicts a capacity change associated with a voltage step and the IC curve equation is given by:
where Q is the charged capacity and UCell the cell voltage. Dubarry et al. [15] state that each peak in the increment capacity curve has a unique shape, intensity, and position, and it exhibits an electrochemical process taking place in the cell. Regarding C/LiFePO4 cells, ICA allows to focus on graphite electrode phases when observing the charging curve (cell voltage function of capacity). ICA is particularly relevant with C/LiFePO4 chemistry because the cell voltage (UCell) does only vary in a 150 mV range while charging state vary from 10% to 90% (Figure 1a). Thereby, a direct voltage analysis is inaccurate to determine any state of the battery for this battery technology. On the contrary, ICA allows to analyses the voltage curve shape (slopes and plateaus) instead of absolute value. To do so, Figure 1b,c present the algorithm applied to get the ICA curve from a voltage measurement and thus highlight the initial curve plateaus.
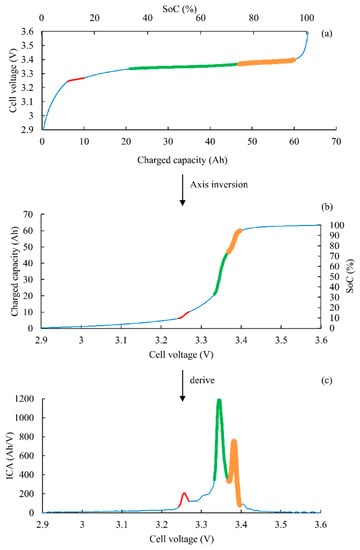
Figure 1.
(a) LiFePO4-C charging curve at C/20; (b) Incremental Capacity (IC) construction; (c) IC curve.
Three main peaks are observed on the IC curve, corresponding to the three voltage plateaus on the cell voltage versus state of charge UCell = f(SoC) curve. The peaks observed in the incremental capacity curves (Figure 1c) correspond to the staging in the graphite negative electrode, convoluted with a single and very broad plateau of the LFP phase transformation on the positive electrode between 5% and 95% of SoC. Thus, all variations on the UCell = f(SoC) curve in this SoC range are due to the graphite negative electrode.
Graphite is an insertion material with a layered structure [19,22,23]. During the insertion process (i.e., battery charging), lithium ions are inserted between graphene layers. Insertion occurs in several phases depending on the quantity of lithium ion inserted (i.e., the battery SoC). In other words, the active phase reflects the state of the negative electrode and Figure 2 shows the graphite structure corresponding to different phases. Each plateau in Figure 1a corresponds to the cohabitation of two graphite phases [20].
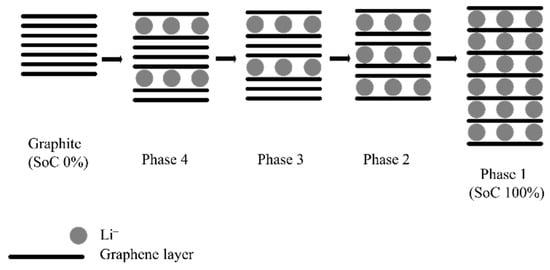
Figure 2.
Graphite phases from discharged to fully charged graphite electrode (from [24]).
Numerous papers are using ICA as a powerful tool to analyze cell capacity degradation [15,18,19,20] or even degradation mechanisms [17,25]. Cell capacity is mainly deduced from peaks amplitude or area.
3. Experimentation
This section describes the experimental process of this study. Ageing process results and ICA implementation are presented in the next section.
3.1. Accelerated Ageing Process
The first step of this study is to produce aged cells using an accelerated ageing process. 60 Ah LiFePO4-C prismatic cells are charged and discharged using an EV driving cycle. The New European Driving Cycle (NEDC), translated from speed profile to current profile using a small passenger car model, is considered for discharging the battery up to 2.5 V. Discharge average rate is C/3. CC-CV charge is then performed at a C/3 current, up to 3.7 V. In order to accelerate the capacity loss, cells are stored in a climatic chamber at 50 °C, still respecting the manufacturer recommendations. 700 charge-discharge cycles were done to reach 30% of capacity loss (i.e., SoH = 70%).
Charge and discharge cycles are done using a power test bench. Two cells are connected in series on each channel to increase the aged cell number.
An industrial battery management system (BMS) made by the manufacturer EVE System was adapted to the experiment and used to perform voltage, current and temperature continuous recording during cycling ageing. This point is very important: all dataset used to develop SoH algorithms are from an industrial BMS, with measures representatives of a real situation. The measurement accuracies are 1 mV for voltage, 0.1 A for current and less than 1 degree for temperature. The BMS also manages the balancing process between two series cells at the end of charge process. Figure 3 illustrates the BMS adapted with external 4-wires measures (2 for balancing circuit, 2 for voltage measurement).
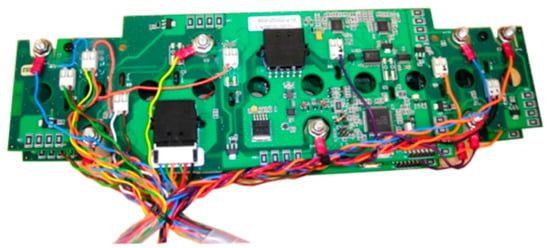
Figure 3.
BMS with external measures.
In addition to cycling ageing, calendar ageing is also accomplished. Cells are kept at 50 °C, fully charged, without voltage floating.
At the end of the accelerated ageing process, eight cells are produced (four cells per ageing type, respectively at 70%, 80%, 90% and 100% SoH).
3.2. Electric Vehicle Charging Cycles
Once ageing cells are available, next step is to record different charging curves with environmental variations. Indeed, the main goal of this study is to develop a SoH estimator robust to temperature, current and DoD variations. Thus, several charging cycles are done and recorded with these 3 parameters separately varying. Only charging cycles are considered because, in an EV application, charging is the most controlled and repetitive phase of the battery use to deduce SoH.
3.2.1. Variable Depth-of-Discharge (DoD)
An electric vehicle is usually partially discharged and then charged up to 100% SoC. Depth-of-Discharge varies accordingly to the mission profile. DoD is rarely equal to 100% (i.e., SoC = 0% at the beginning of charge), in the practical use of EV. As a consequence, different DoD result in truncated charging curves and thus could significantly cause impact on the ICA algorithm.
To do so, 32 charging cycles are performed on different ageing cells with SoH ranging from 100% down to 70% and DoD varying from 30% to 100% with a 10% step. Charging occurs always after a partial discharge from 100% SoC. Charging profile is CC-CV at C/3. Charging temperature is 25 °C.
3.2.2. Variable Charging Current
Charging current can vary depending on the charge method using either vehicle internal charger or quick external charger for example, but also on the electric outlet used. Whereas quick charging can be considered as an exception in the vehicle life, the SoH estimator has to work for all charging current supplied by the internal charger regardless of the electric outlet (i.e., usually with a current from C/10 to C/4).
Sixteen charging cycles are performed on different ageing cells with a SoH ranging from 100% SoH down to 70% and with C/3, C/6, C/10 and C/20 currents. Temperature is set to 25 °C.
3.2.3. Variable Charging Temperature
The last parameter taken into account is the temperature. According to the manufacturer datasheet, charging temperature can only vary from 0 °C to 40 °C. Outside these limits, charging is not possible.
Sixteen charging cycles are also performed on different ageing cells varying from 100% SoH down to 70% SoH and at 5 °C, 10 °C, 20 °C and 40 °C, respectively. Charging current is set to C/3 in this case.
4. Embedded ICA Implementation and Results
Most authors practice an ICA with a very low current (C/20 or lower) with a DoD of 100% to record a fully defined curve and thus extract accurate information about ageing mechanisms. A C/20 charge is not acceptable for EV application. So, the aim of this study consists of proposing an IC measurement that reflects the cell remaining capacity during normal operation of the vehicle. Moreover, normal BMS measurements have to be precise for the chosen algorithm. ICA is then suitable for an online SoH estimator, as the method only needs voltage, current and temperature inputs.
The first section shows the sensitivity of the ICA to the battery ageing for EV application. The second part deals with the robustness of this estimator.
4.1. Capacity Estimation from ICA
Figure 4 shows several ICA curves from charging datasets of a C/LiFePO4 cell during the cycling accelerated ageing process. The 100% DoD at 50 °C was chosen to accelerate ageing, even if it is not a representative EV type of use. The C/3 constant current charging cycle is commonly used and allows a full recharge in 3 hours. In Figure 4, the most obvious variation is a diminution of the last peak while capacity reduces. This peak-3 decrease highlights a capacity loss due to loss of lithium inventory (LLI) when the LiFePO4-C prismatic cells considered are charged and discharged using an EV driving cycle (NEDC). The smaller decrease of the peaks 1 and 2 may indicate a lower loss of active material (LAM). So, the decrease of the peak-3 area measured using ICA may provide an estimation of the capacity fade and thus can be used as an efficient SoH estimator for the LiFePO4-C cells considered. A slight right shift of the curves is also observed. It corresponds to an equivalent series resistance (ESR) rise. During charging, this induce a voltage increase and thus a right shift of the ICA.
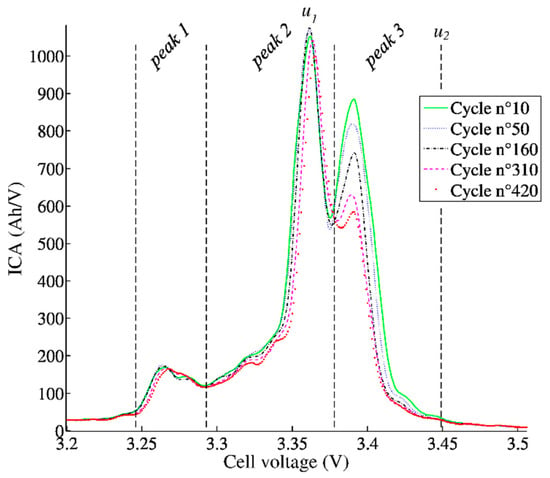
Figure 4.
IC curves evolution during the cycling accelerated ageing (C/3 and 50 °C).
A first SoH estimator using ICA was proposed based on the peak 3 area. It can be easily demonstrated that the area under the IC curve is an image of the cell capacity between two voltage limits (u1 and u2) (Figure 5):
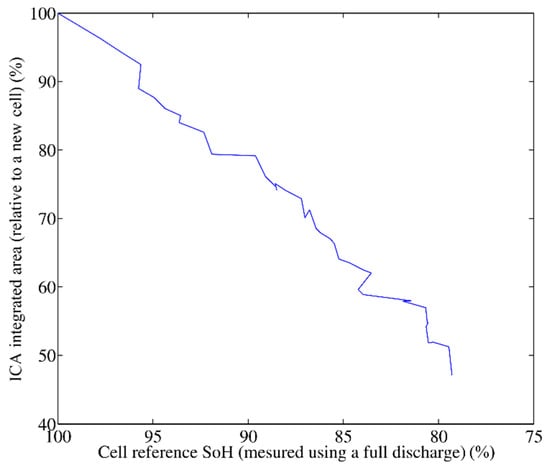
Figure 5.
Integrated area function of the cell SoH.
A good estimate of SoH can be made with the area under peak 3. This latter phenomenon is fully described on a dedicated paper [26]. Since peak 3 is amortized and shifted with aging, it is not easy to calculate a representative area. In this paper, a robust protocol and method are proposed in order to estimate the SoH.
The aim is to ensure the operation of the algorithm in all conditions and throughout the battery state of health. To calculate this area, it is necessary to integrate the ICA curves between the two voltages u1 and u2. As shown in Figure 4, the beginning of peak 3 shifts to higher potentials as the battery ages. Moreover, since ICA is carried out for a positive current, this shift to the right corresponds to an increase of the ESR. Any increase in the ESR leads to a shift to the right of the integration terminals.
If the integration limits were fixed, the integrated area would not always correspond to peak 3’s window, but would eventually take into account a part of peak 2 that shifts to the right too. An integration bounds detection algorithm has therefore been developed to overcome this issue. This includes two following steps:
- -
- Take the absolute maximum of the IC curve that corresponds to the maximum of peak 2. The first voltage limit u1 is taken at this peak 2’s maximum instead of beginning of the peak 3 because it allows for better detection of any deformation of peak 3 with ageing. Indeed, the beginning of peak 3 may vanish with aging and therefore becomes difficult to detect. Contrarily, peak 2’s maximum becomes more stable with aging.
- -
- Define u2 at a fixed distance from u1, to ensure the area calculated under peak 3 is integrated over a fixed voltage interval. Thus, a decrease in the integrated area corresponds to a loss of capacity and not the integration width.
Regarding the operation conditions, this method leads to very good results and allows to compute the remaining cell capacity with an error smaller than 2%. Figure 5 shows the area evolution as a function of the remaining capacity. Note that the linearity is consistent with Equation (3). Once this relation is known, it is possible to measure the cell capacity with computing the ICA in order to measure the area and then, by using this law, obtain the capacity. The linearization of the measurements in Figure 5 gives Equation (4).
This estimator provides thus a SoH estimation in this quite ideal operation conditions with set temperature, current and DoD. Next paragraphs propose a sensitivity analysis of this latter estimator to these parameters to be implemented on an EV application.
4.2. Implementation Robust to Charging Cycles Variations
4.2.1. Depth of Discharge Effect on ICA
The depth of discharge is first investigated considering usual DoD for EV application ranging from 50% to 100%. Three ICA curves with different DoD are presented in Figure 6 for a SoH = 80%. Charging current is C/3 and temperature is set to 25 °C. Two main observations can be established. The DoD has a significant impact on the ICA curve shape and thus the peak 3 area. It is worth mentioning that the third peak is not well defined at C/3 when DoD becomes larger. Likewise, only a partial ICA is recorded and thus the low voltage part of the ICA is not available when the DoD is lower (i.e., SoC is high at the beginning of the charge). These observations highlight that the area under the ICA may depend on the DoD.
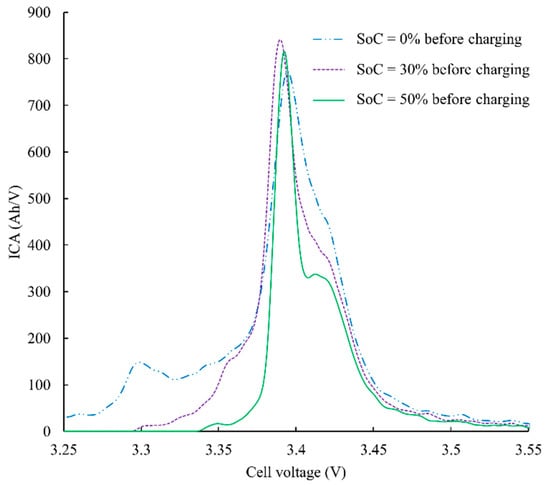
Figure 6.
IC curves deformation function of the DoD (C/3-25 °C-SoH 80%).
This latter point is very critical for an EV application. To overcome this issue, the SoH estimator has to be the most robust possible to any variation of the DoD. As explained in Section 2, ICA peaks corresponds to voltage plateaus on the UCell = f(SoC) curve and may be related to the cohabitation of two graphite phases. Regarding the EV application, at relatively high charging current, the graphite electrode never reaches the thermodynamic stability during the charging at C/3 rate and thus, graphite phases are not well defined. In our application, the IC measurement cannot be performed under perfect thermodynamic condition leading to artefacts on the IC curves. Conversely, at low charging rate (e.g. C/20), the DoD does not have a significant impact on the ICA. Nevertheless, this latter effect of the DoD is beyond the scope of the paper.
In the case of an EV charging cycle, the charging current cannot be low enough to allow the DoD impact to be neglected. The developed solution is to add a pause during the charge, just prior to the ICA peak 2 at a SoC close to 50%. This allows the graphite electrode to reach the thermodynamic stability before the charge continues and ICA is computed. So, the graphite electrode is closer to the stability state than without the pause. Moreover, as the pause is always done at the same state (prior to peak 2), ICA is computed in similar conditions whatever the DoD. The optimal pause time to reach a satisfying stability in a reduce time was experimentally determined to be 30 minutes. The battery is placed in an open circuit during those 30 minutes. Nevertheless, a C/3 charge with a 30-minute pause remains much quicker than a C/20 charge without pause. Moreover, the SoH identification will not be done systematically with each recharge of the vehicle but occasionally.
Figure 7 shows different ICA with different DoD and with a pause of 30 minutes prior ICA peak 2. Curves are very close together and much better defined than in previous case (see Figure 6).
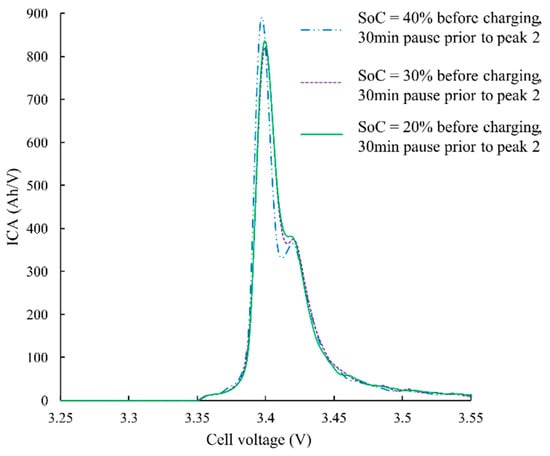
Figure 7.
IC curves for different DoD and a pause of 30 minutes prior ICA peak 2.
Using this new ICA algorithm including a pause on aged cells with SoH ranging from 100% down to 70% at a C/3 charging current and a DoD between 80% and 60%, the remaining cell capacity is estimated within 4% error. Figure 8 illustrates the linear law (cf. Equation (5)) linking the measured area under the ICA and the cell capacity. It is important to note that for each SoH, several measurements are performed with different DoD. Nonetheless, the linear behavior observed in Figure 8 still remains valid with our new algorithm and the relevance of the pause is illustrated through the estimated area for a given capacity and for various DoD.
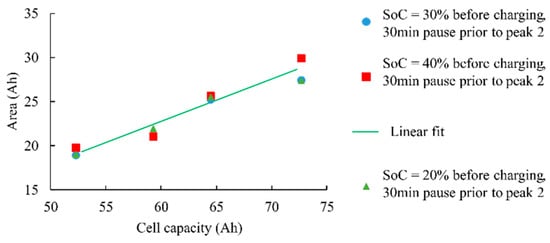
Figure 8.
Measured area function of cell capacity for various DoD and with pause before peak 2 (C/3-25 °C).
4.2.2. Charging Current Effect on ICA
As previously introduced, the pause before the ICA peak 2 allows the graphite electrode to reach the thermodynamic stability prior to the ICA measurement. It is now proven that this pause is an efficient method to get similar ICA curves whatever the DoD, as it deletes the “history” of the cycle. This section investigates the charging C-rate impact because high charging current has a similar effect on the thermodynamic stability of graphite. Figure 9 presents IC curves of a SoH = 80% cell with different charging current and without the pause prior to peak 2. ICA deformation and peak shifting are distinctly noticeable. As shown in Figure 9, the charging current rate has a significant impact on the IC curves. Surprisingly, peak 3 starts to disappear when the C-rate increases. To overcome this issue, the same solution (pause before peak 2) is thus used to make the ICA from peak 2 maximum uniform, whatever the charging current.
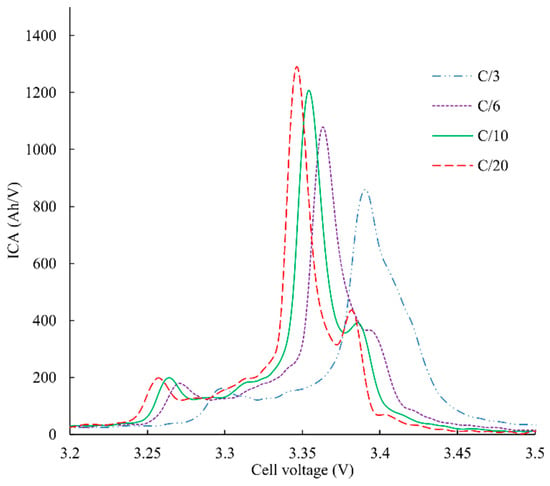
Figure 9.
ICA deformation function of the charging current (100% DoD-25 °C-SoH 80%).
A second effect of the charging current is a right or left shift of ICA curves. Because of the cell ESR, in charge, the higher the current is, the higher the measured voltage. Nevertheless, as integration limits (from peak 2 maximum) are dynamically detected, this right shift does not impact the measured area. Figure 10 sums up final results with the pause before peak 2. As for DoD impact, the pause allows to measure very close areas whatever the charging current and lead to a 3% accurate SoH estimator. Equation (6) gives the linear fit of the equation, linking cell capacity to the ICA area.
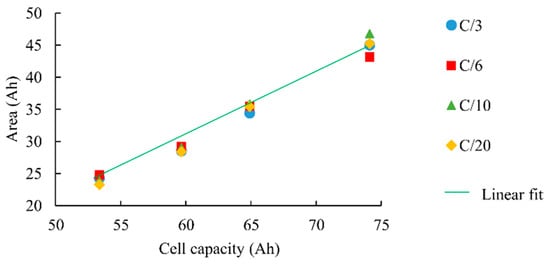
Figure 10.
Measured area function of cell capacity for various charging currents and with pause before peak 2 (100% DoD-25 °C).
4.2.3. Temperature Effect on ICA
The last parameter studied in this work is the temperature. As a majority of chemical reactions, the graphite lithiation is activated by the temperature. In addition, the cell ESR reduces with temperature increase. Figure 11 shows different ICA with the pause before peak 2 and at different temperatures. The ESR variation is clearly visible. Another interesting point is the fact that the pause before peak 2 is not sufficient to cancel the effect of the temperature on the graphite lithiation: ICA at a high temperature is still better defined and the area is bigger. Figure 12 represents the area integrated as a function of the cell capacity and for different temperatures (Equation (7) gives the mean linear fit). This confirms the trend of the Figure 11 regarding the fact that the area is higher at high temperatures.
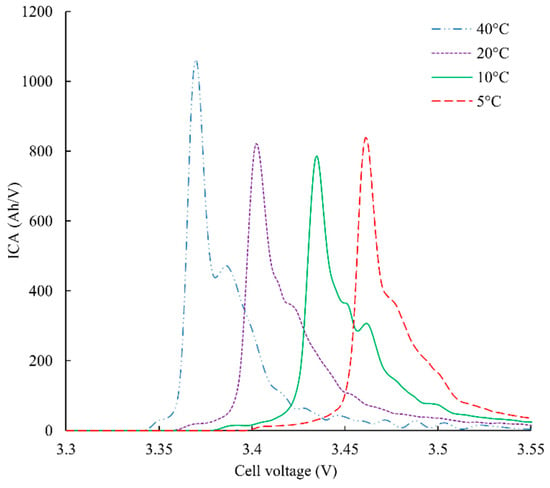
Figure 11.
Temperature impact on ICA with pause prior to peak 2 (C/3-100% DoD-SoH 80%).
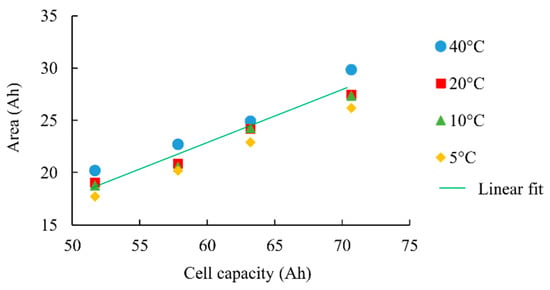
Figure 12.
Measured area function of cell capacity for various temperatures and with pause before peak 2 (C/3-100% DoD).
It is thus not possible to have a single linear law giving the cell capacity from the measured area. Instead of this, a temperature compensation of the law is used. Offset and slope of the law are indexed to the temperature. Using this method, a 4% accurate SoH estimator is obtained with several different cells.
5. Conclusions and Outlook
A powerful nonintrusive state-of-health estimator based on ICA measurement is proposed. This estimator is implementable on classic BMS for EV application and robust to DoD, current and temperature changes. In this work, a complete experimental part including accelerated ageing and many charge cycles with temperature, current and DoD variations was performed. A deep analysis of the impact of these latter parameters on the ICA was investigated to propose an innovative method to get the remaining capacity using embedded ICA. Most of previously papers using ICA as capacity estimator are not able to propose a method to obtain the cell capacity from partially discharged cells regardless the environmental conditions of the measure. Using the pause prior to peak 2 allows estimating the remaining capacity with a 4% accuracy even though the temperature ranges between 5 °C and 40 °C, with the current between C/20 and C/3, and the DoD between 80% and 60%.
The calibration of the capacity law function of the ICA area was done using a 60Ah C/LiFePO4 cell. The same ageing process and same environmental variations measures were also done on another C/LiFePO4 of 72 Ah from another manufacturer. It was demonstrated that the same law is efficient for both cells. This point is very interesting and means that it is not necessary to proceed to a time-consuming ageing process to calibrate the law in case of the use of a new cell. It also suggests an interesting robustness if a cell manufacturer can process the change. Finally, the same methodology (with some adaptations) was implemented on lithium manganese oxide batteries with a SoH estimation accurate within 4% [27].
Present work focused on separately variations only. Temperature, DoD and current effect were studied unitarily. Next part of this work will be to assemble all variations in a unique law and to check its efficiency in EV conditions. The final validation step will be to integrate the algorithm in an embedded BMS and to check its efficiency during a long period of use on a real EV. It should lead to a more accurate state-of-charge computation and thus should allow to reduce the safety margin, increasing the range of the vehicle.
Author Contributions
E.R., A.S., P.V., F.M. and Y.B. conceived and designed the experiments; E.R. performed the experiments; E.R., A.S., P.V., F.M. and Y.B. analysed the data; E.R., A.S., P.V., F.M. and Y.B. wrote the paper.
Funding
This research was funded by National French Association for Technological Research (ANRT) and the company EVE System.
Conflicts of Interest
The authors declare no conflicts of interest.
References
- Khaligh, A.; Li, Z. Battery, Ultracapacitor, Fuel Cell, and Hybrid Energy Storage Systems for Electric, Hybrid Electric, Fuel Cell, and Plug-In Hybrid Electric Vehicles: State of the Art. IEEE Trans. Veh. Technol. 2010, 59, 2806–2814. [Google Scholar] [CrossRef]
- Chan, C.C. The State of the Art of Electric, Hybrid, and Fuel Cell Vehicles. Proc. IEEE 2007, 95, 704–718. [Google Scholar] [CrossRef]
- Cheng, K.W.E.; Divakar, B.P.; Wu, H.; Ding, K.; Ho, H.F. Battery-Management System (BMS) and SOC Development for Electrical Vehicles. IEEE Trans. Veh. Technol. 2011, 60, 76–88. [Google Scholar] [CrossRef]
- Choi, M.E.; Lee, J.S.; Seo, S.W. Real-Time Optimization for Power Management Systems of a Battery/Supercapacitor Hybrid Energy Storage System in Electric Vehicles. IEEE Trans. Veh. Technol. 2014, 63, 3600–3611. [Google Scholar] [CrossRef]
- Zandi, M.; Payman, A.; Martin, J.P.; Pierfederici, S.; Davat, B.; Meibody-Tabar, F. Energy Management of a Fuel Cell/Supercapacitor/Battery Power Source for Electric Vehicular Applications. IEEE Trans. Veh. Technol. 2011, 60, 433–443. [Google Scholar] [CrossRef]
- Carter, R.; Cruden, A.; Hall, P.J. Optimizing for Efficiency or Battery Life in a Battery/Supercapacitor Electric Vehicle. IEEE Trans. Veh. Technol. 2012, 61, 1526–1533. [Google Scholar] [CrossRef]
- Lièvre, A.; Sari, A.; Venet, P.; Hijazi, A.; Ouattara-Brigaudet, M.; Pelissier, S. Practical Online Estimation of Lithium-Ion Battery Apparent Series Resistance for Mild Hybrid Vehicles. IEEE Trans. Veh. Technol. 2016, 65, 4505–4511. [Google Scholar] [CrossRef]
- Jaguemont, J.; Boulon, L.; Venet, P.; Sari, A. Lithium Ion Battery Aging Experiments at Sub- Zero Temperatures and Model Development for Capacity Fade Estimation. IEEE Trans. Veh. Technol. 2015, 65, 4328–4343. [Google Scholar] [CrossRef]
- Haifeng, D.; Xuezhe, W.; Zechang, S. A new SOH prediction concept for the power lithium-ion battery used on HEVs. In Proceedings of the 2009 IEEE Vehicle Power and Propulsion Conference, Dearborn, MI, USA, 7–10 September 2009. [Google Scholar]
- Remmlinger, J.; Buchholz, M.; Soczka-Guth, T.; Dietmayer, K. On-board state-of-health monitoring of lithium-ion batteries using linear parameter-varying models. J. Power Sources 2013, 239, 689–695. [Google Scholar] [CrossRef]
- Chen, Z.; Mi, C.C.; Fu, Y.; Xu, J.; Gong, X. Online battery state of health estimation based on Genetic Algorithm for electric and hybrid vehicle applications. J. Power Sources 2013, 240, 184–192. [Google Scholar] [CrossRef]
- Watrin, N.; Blunier, B.; Miraoui, A. Review of adaptive systems for lithium batteries State-of-Charge and State-of-Health estimation. In Proceedings of the IEEE Transportation Electrification Conference and Expo (ITEC), Dearborn, MI, USA, 18–20 June 2012. [Google Scholar]
- Guo, Z.; Qiu, X.; Hou, G.; Liaw, B.Y.; Zhang, C. State of health estimation for lithium ion batteries based on charging curves. J. Power Sources 2014, 249, 457–462. [Google Scholar] [CrossRef]
- Le, D.; Tang, X. Lithium-ion Battery State of Health Estimation Using Ah-V Characterization. In Proceedings of the Annual Conference of the Prognostics and Health Management Society, Montreal, QC, Canada, 25–29 September 2011. [Google Scholar]
- Dubarry, M.; Liaw, B.Y. Identify capacity fading mechanism in a commercial LiFePO4 cell. J. Power Sources 2009, 194, 541–549. [Google Scholar] [CrossRef]
- Weng, C.; Cui, Y.; Sun, J.; Peng, H. On-board state of health monitoring of lithium-ion batteries using incremental capacity analysis with support vector regression. J. Power Sources 2013, 235, 36–44. [Google Scholar] [CrossRef]
- Han, X.; Ouyang, M.; Lu, L.; Li, J.; Zheng, Y.; Li, Z. A comparative study of commercial lithium ion battery cycle life in electrical vehicle: Aging mechanism identification. J. Power Sources 2014, 251, 38–54. [Google Scholar] [CrossRef]
- Dubarry, M.; Liaw, B.Y.; Chen, M.-S.; Chyan, S.-S.; Han, K.-C.; Sie, W.-T.; Wu, S.-H. Identifying battery aging mechanisms in large format Li ion cells. J. Power Sources 2011, 196, 3420–3425. [Google Scholar] [CrossRef]
- Dubarry, M.; Truchot, C.; Liaw, B.Y. Cell degradation in commercial LiFePO4 cells with high-power a18nd high-energy designs. J. Power Sources 2014, 258, 408–419. [Google Scholar] [CrossRef]
- Groot, J. State-of-Health Estimation of Li-ion Batteries: Cycle Life Test Methods. Ph.D. Thesis, Division of Electric Power Engineering, Chalmers University of Technology, Göteborg, Sweden, 2012. [Google Scholar]
- Kassem, M.; Bernard, J.; Revel, R.; Pelissier, S.; Duclaud, F.; Delacourt, C. Calendar aging of a graphite/LiFePO4 cell. J. Power Sources 2012, 208, 296–305. [Google Scholar] [CrossRef]
- Alzieu, J.; Robert, J. Accumulateurs au Lithium; Techniques de L’ingénieur: Saint-Denis, France, 2005. [Google Scholar]
- Buchmann, I. Batteries in a Portable World: A Handbook on Rechargeable Batteries for Non-Engineers, 3rd ed.; Cadex Electronics Inc.: Richmond, BC, Canada, 2011. [Google Scholar]
- Sole, C.; Drewett, N.; Hardwick, L.J. In situ Raman study of lithium-ion intercalation into microcrystalline graphite. R. Soc. Chem. Faraday Discuss. 2014, 172, 223–237. [Google Scholar] [CrossRef] [PubMed]
- Dubarry, M.; Truchot, C.; Liaw, B. Synthesize battery degradation modes via a diagnostic and prognostic model. J. Power Sources 2012, 219, 204–216. [Google Scholar] [CrossRef]
- Rivière, E.; Venet, P.; Bultel, Y.; Sari, A.; Ménière, F. LiFePO4 Battery State of Health Online Estimation Using Electric Vehicle Embedeed Incremental Capacity Analysis. In Proceedings of the IEEE-Vehicular Power and Propulsion Conference 2015, Montreal, QC, Canada, 9–22 October 2015. [Google Scholar]
- Rivière, E. Détermination In-Situ de L’état de Santé de Batteries Lithium-ion Pour un Véhicule Electrique. Ph.D. Thesis, University of Grenoble-Alpes, Grenoble, France, November 2016. [Google Scholar]
© 2019 by the authors. Licensee MDPI, Basel, Switzerland. This article is an open access article distributed under the terms and conditions of the Creative Commons Attribution (CC BY) license (http://creativecommons.org/licenses/by/4.0/).