Article

Lifetime Prediction of Lithium-Ion Capacitors Based on Accelerated Aging Tests

Univ Lyon, Université Claude Bernard Lyon 1, Ecole Centrale de Lyon, INSA Lyon, CNRS, Ampère, F-69100 Villeurbanne, France
*
Author to whom correspondence should be addressed.
Batteries 2019, 5(1), 28; https://doi.org/10.3390/batteries5010028
Submission received: 18 December 2018 / Revised: 12 February 2019 / Accepted: 26 February 2019 / Published: 5 March 2019
(This article belongs to the Special Issue Batteries and Supercapacitors Aging)

Abstract

:
Lithium-ion Capacitors (LiCs) that have intermediate properties between lithium-ion batteries and supercapacitors are still considered as a new technology whose aging is not well studied in the literature. This paper presents the results of accelerated aging tests applied on 12 samples of LiCs. Two high temperatures (60 °C and 70 °C) and two voltage values were used for aging acceleration for 20 months. The maximum and the minimum voltages (3.8 V and 2.2 V respectively) had different effects on capacitance fade. Cells aging at 2.2 V encountered extreme decrease of the capacitance. After storing them for only one month at 60 °C, they lost around 22% of their initial capacitance. For this reason, an aging model was developed for cells aging at the lowest voltage value to emphasize the huge decrease of the lifetime at this voltage condition. Moreover, two measurement tools of the capacitance were compared to find the optimal method for following the evolution of the aging process. It was proved that electrochemical impedance spectroscopy is the most accurate measurement technique that can reveal the actual level of degradation inside a LiC cell.

1. Introduction

The performance of Energy Storage Systems (ESSs) depends on several factors such as current, voltage, and temperature. The operating and environmental conditions have an important impact on their behavior. Accelerated aging tests are usually applied to these devices for the aim of developing aging law. These laws can be used in management systems that are integrated with ESSs to predict the remaining time before their failure.
The accelerated aging tests can be divided into two categories: calendar aging and cycling aging [1,2,3,4]. The behavior of an ESS during its storage is tested in calendar aging. The impacts of the temperature and the voltage on the lifetime are studied throughout this type of tests. However, ESSs during charge or discharge suffer from a different kind of aging, especially when the applied currents are very high. This is cycling aging whose corresponding tests could be done also at very low or high temperatures to further accelerate the process.
Lifetime of Lithium-ion Batteries (LiBs) and Supercapacitors (SCs) was frequently studied in the literature [5,6,7,8,9]. SCs have a longer lifespan than LiBs and a better behavior at low and higher temperatures. Nonetheless, their energy density is much lower than that of LiBs. The new technology of SCs, Lithium-ion Capacitors (LiCs), possesses an improved energy density, around triple the one of conventional SCs. Since they combine the negative electrode of LiBs with the positive electrode of SCs, they have intermediate electrical characteristics [10]. Several combinations of electrodes have been evaluated for ensuring the most optimal features of the hybrid device [11,12]. The majority of commercial LiCs are composed of a negative electrode of carbon pre-doped with lithium and a positive electrode of activated carbon. The pre-lithiation of the negative electrode can be done using multiple methods such as ensuring a direct contact between lithium metal and the carbon electrode, short-circuiting the carbon electrode with a lithium metal electrode or adding lithium excess in the positive electrode [13]. Commercial cells developed by JM Energy and JSR Micro include a sacrificial lithium electrode that serves as a lithium source for carbon pre-lithiation. Others developed by General Capacitors comprise lithium stripes that are in direct contact with the negative electrode at which pre-lithiation occurs [14]. The negative electrode in LiCs is oversized with respect to the positive electrode in order to benefit from the total capacitance of the positive electrode [11,15].
Since LiCs are a new technology, a limited number of publications had studied their aging. An advantage of over-sizing the negative electrode remains in reducing the effects of the Solid Electrolyte Interface (SEI), which is the main destructive aging mechanism of this type of electrodes as found in LiBs [16,17]. However, the impacts of the SEI could not be completely suppressed. For example, in [18], during continuous cycling of a LiC, the capacity decreased because of the growth of the SEI at the surface of the negative electrode, which induced the increase of its resistance. As a result, an important number of cyclable lithium ions was lost and the potential of the positive electrode drifted to high positive values. Usually, the potential of the positive electrode should not exceed 4 V vs. Li/Li+ [19]. Otherwise, a formation of Lithium Fluoride (LiF) at the negative electrode could happen [19]. Moreover, accelerated aging tests were applied in [20] on commercial LiCs that belong to three different manufacturers. A calendar test at 60 °C and 3.8 V resulted in a 10% decrease of the capacity after 5000 hours while another at 0 °C and 3.8 V caused a decrease of less than 2%. Therefore, it was found that the highest the temperature is, the greater the degradation becomes. In addition, cycle aging tests showed that the depth of discharge does not affect the degradation of the capacity of a LiC. However, another study proved that calendar aging of specific commercial LiCs extremely depends on their state of charge [21].
A LiC has a particular operating principle. Each potential of the cell reflects a different chemical composition [15]. At 3 V, which is the open circuit voltage of a commercial LiC right after its assembly, the positive electrode of activated carbon is at the approximate neutral state. When discharging the cell from 3 to 2.2 V, some of the lithium ions that are pre-intercalated into the negative electrode des-intercalate from carbon layers and migrate towards the positive electrode where they accumulate. However, when charging the cell from 3 to 3.8 V, the anions forming the salt of the electrolyte accumulate at the surface of the activated carbon and the cations of the salt intercalate into the negative electrode. Therefore, at 2.2 and 3.8 V, the double layer formed at the activated carbon positive electrode includes different ions and the degree of lithiation of the negative electrode increases from 2.2 to 3.8 V. For this reason, calendar aging at both voltage values will be analyzed in this paper so the effects of both chemical compositions could be compared.
Accelerated aging tests were applied to several cells as it will be described in Section 2 of the paper. To track the evolution of the aging process, the capacitance and the equivalent series resistance of the cells can be measured using frequency or time domain measurements. Section 3 will explain why the frequency domain measurements were chosen to follow the properties of the LiCs. In addition, Section 4 will present the results of the capacitance decrease and the equivalent series resistance increase found from frequency domain measurements over an aging time of 20 months. Based on the evolution of these parameters with respect to the aging time, an aging model will be developed in Section 3 for cells that aged at the lowest voltage value.

2. Experimental Setup

Twelve prismatic LiCs were divided into two equal groups and mounted in two climatic chambers at 60 °C and 70 °C. In each chamber, the voltage of three cells was maintained constant at 2.2 V while the voltage of the rest of the cells was maintained at 3.8 V. Cells used during these tests belong to the “Ultimo” prismatic series developed by JM Energy and JSR Micro. The capacitance of the cells is equal to 3300 F and they can operate over a large temperature window, from −30 °C to 70 °C. Three similar cells were tested per aging condition to guarantee accurate and reproducible results.

3. Comparison of Frequency and Time Domain Measurements

After placing the LiCs in the climatic chambers at high temperatures, their capacitance and equivalent series resistance were measured using electrochemical impedance spectroscopy (EIS). This measurement tool in the galvanostatic mode consists on fixing the potential of a cell, applying a small sinusoidal current at different frequencies and then measuring the impedance using the corresponding voltage response. The amplitude of the sinusoidal current was chosen to be 5 A. Moreover, prior to each measurement process, the voltage of the cell was maintained constant for 30 min. These periodic measurements were done at high temperatures without getting the LiCs off from the climatic chambers. To check whether additional measurements should be done, the LiCs were taken off the climatic chambers after 109 days and their properties were measured using frequency and time domain measurements at 25 °C. In [15], these measurement techniques are explained in details.

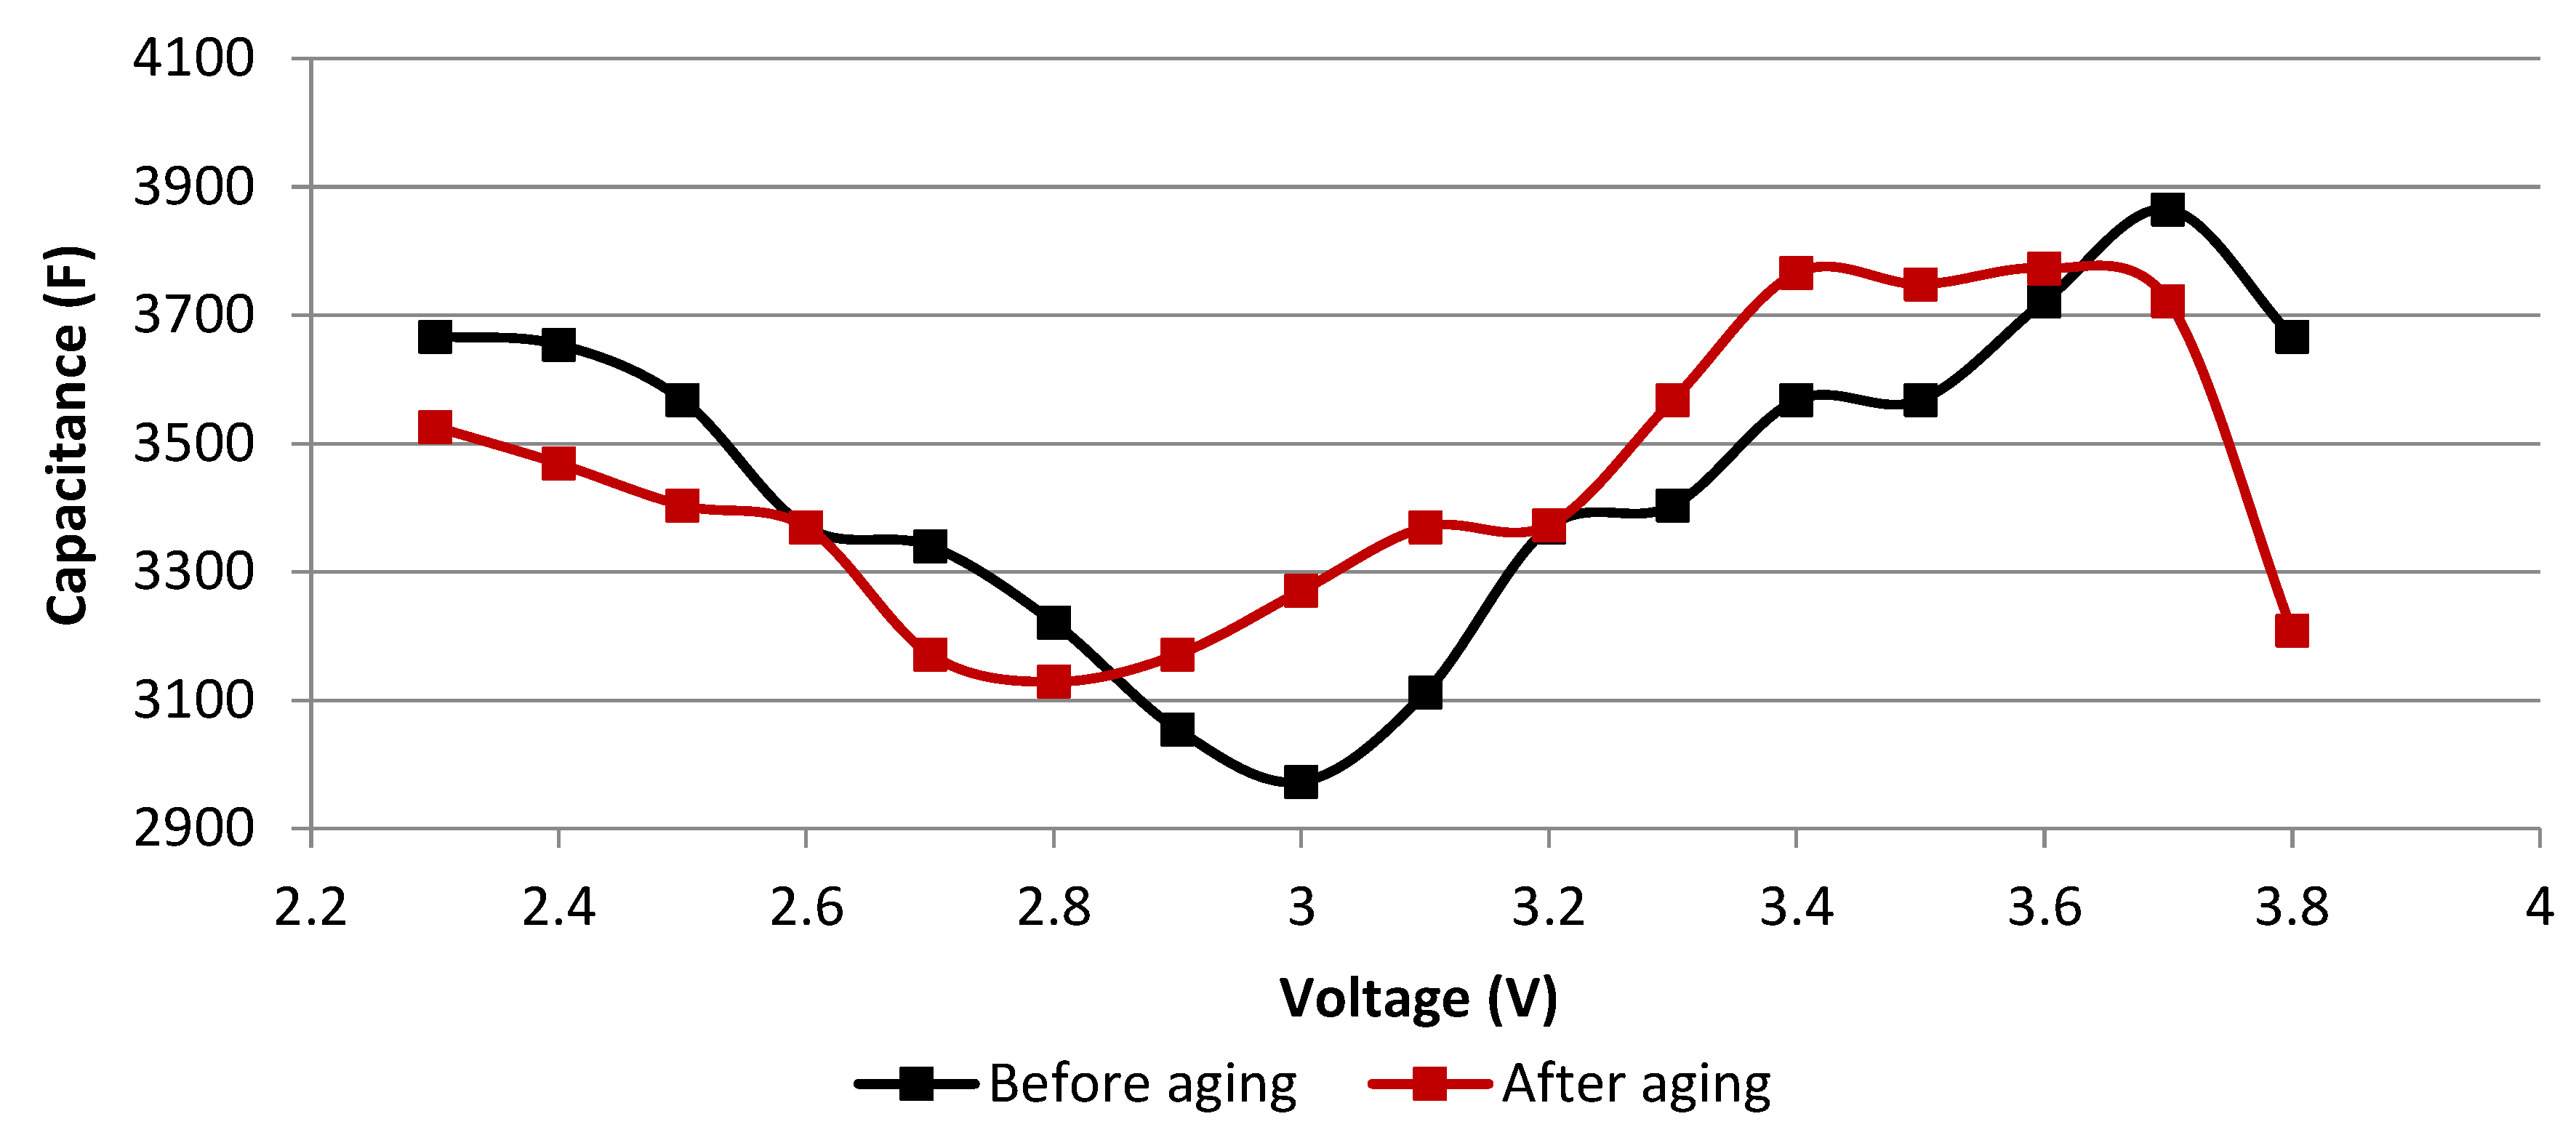
3.1. Frequency Domain Measurements

The impedance of a LiC depends on the voltage V and the frequency f [15,22]. The capacitance C(f, V) can be extracted from the imaginary part of the impedance Img(f, V) as follows:
C ( f , V ) = 1 2 π × f × I m g ( f , V )
The series resistance of a LiC at a specific frequency is equal to the real part of the impedance. These parameters were measured at 100 mHz, at the aging voltage and at 25 °C and then normalized with respect to the value found before aging (also at 25 °C). The frequency of 100 mHz was chosen for its accuracy in showing the evolution of the parameters during aging. Figure 1 and Figure 2 show the evolution of the normalized capacitance at 25 °C after 109 days of aging at 60 °C and 70 °C, respectively. The parameters of the three samples per voltage condition are represented in these figures.
LiCs aging at 3.8 V obviously have better capacitance retention than the ones aging at 2.2 V. The average capacitance decrease of cells aging at 3.8 V is 11% at 60 °C and 12% at 70 °C. On the other hand, the average capacitance decrease of cells aging at 2.2 V is 36% at 60 °C and 46% at 70 °C. In [21], the best storage voltage of LiCs was found to be 3 V since the capacitance decrease through accelerated aging tests at this voltage value was insignificant. To validate the results mentioned previously, additional measurements in the time domain were done.

3.2. Time Domain Measurements

Measurements in the time domain are based on using the voltage response of a LiC during its discharge with a DC current as explained in the traditional protocol detailed in [15]. The capacitance is calculated from the difference between the maximum and the minimum voltages during a full discharge, the time of discharge, and the value of the current. This technique evaluates the total discharge capacitance while frequency domain measurements assess the capacitance at a specific voltage value. The normalized capacitance is shown in Figure 3 for cells aging at 60 °C and in Figure 4 for the others aging at 70 °C.
Results of time domain measurements show that LiCs aging at 3.8 V barely age since their capacitance does not decrease even after being for 109 days under calendar stresses. The capacitance decrease of cells aging at 2.2 V is also much less than the one found in frequency domain measurements. For this reason, the capacitance of a cell aging at 3.8 V at each voltage value, during its discharge with a DC current, was measured according to the method explained in [15]. A comparison between the evolution of the capacitance with respect to the voltage before and after aging is presented in Figure 5.
The minimum capacitance is usually an indicator of the neutral state of the positive electrode whose potential is around 3.1 V vs. Li/Li+ at this state [15,22]. The corresponding voltage value of the complete cell shifts from 3 to 2.8 V due to aging (cf. Figure 5). This voltage is the difference between the potentials of the positive electrode and of the negative electrode. Therefore, since the potential of the negative before aging is around 0.1 V vs. Li/Li+ when the total voltage is equal to 3 V, one can conclude that its potential drifts to a more positive value that may be around 0.3 V vs. Li/Li+ when the new total voltage is equal to 2.8 V. This can be caused by the growth of the SEI at the negative electrode and the loss of cyclable lithium ions [23]. Therefore, the potential window at which the double layer at the positive electrode is formed by the anions extends from 3–3.8 V to 2.8–3.8 V. Since the anions have a small size compared to the cations [24], the associated double layer generates a higher capacitance. As a result, the total capacitance measured over the total voltage window may not show the real aging state of the cell. In fact, it may benefit from the increase of the capacitance produced by the accumulation of the anions at the positive electrode over an extended voltage window. This stability of the total capacitance may particularly happen at the beginning of aging when the only aging effect is the drift of the potential of the negative electrode. Therefore, since the measurements in the time domain did not reflect the actual aging state compared to the measurements in the frequency domain, this latter was used to follow the evolution of the parameters throughout the whole aging period.

4. Interpretation of Calendar Aging

LiCs under accelerated aging tests at 60 °C and 70 °C degraded in different ways. The evolution of their parameters was the tool for predicting the aging mechanisms at each test condition.

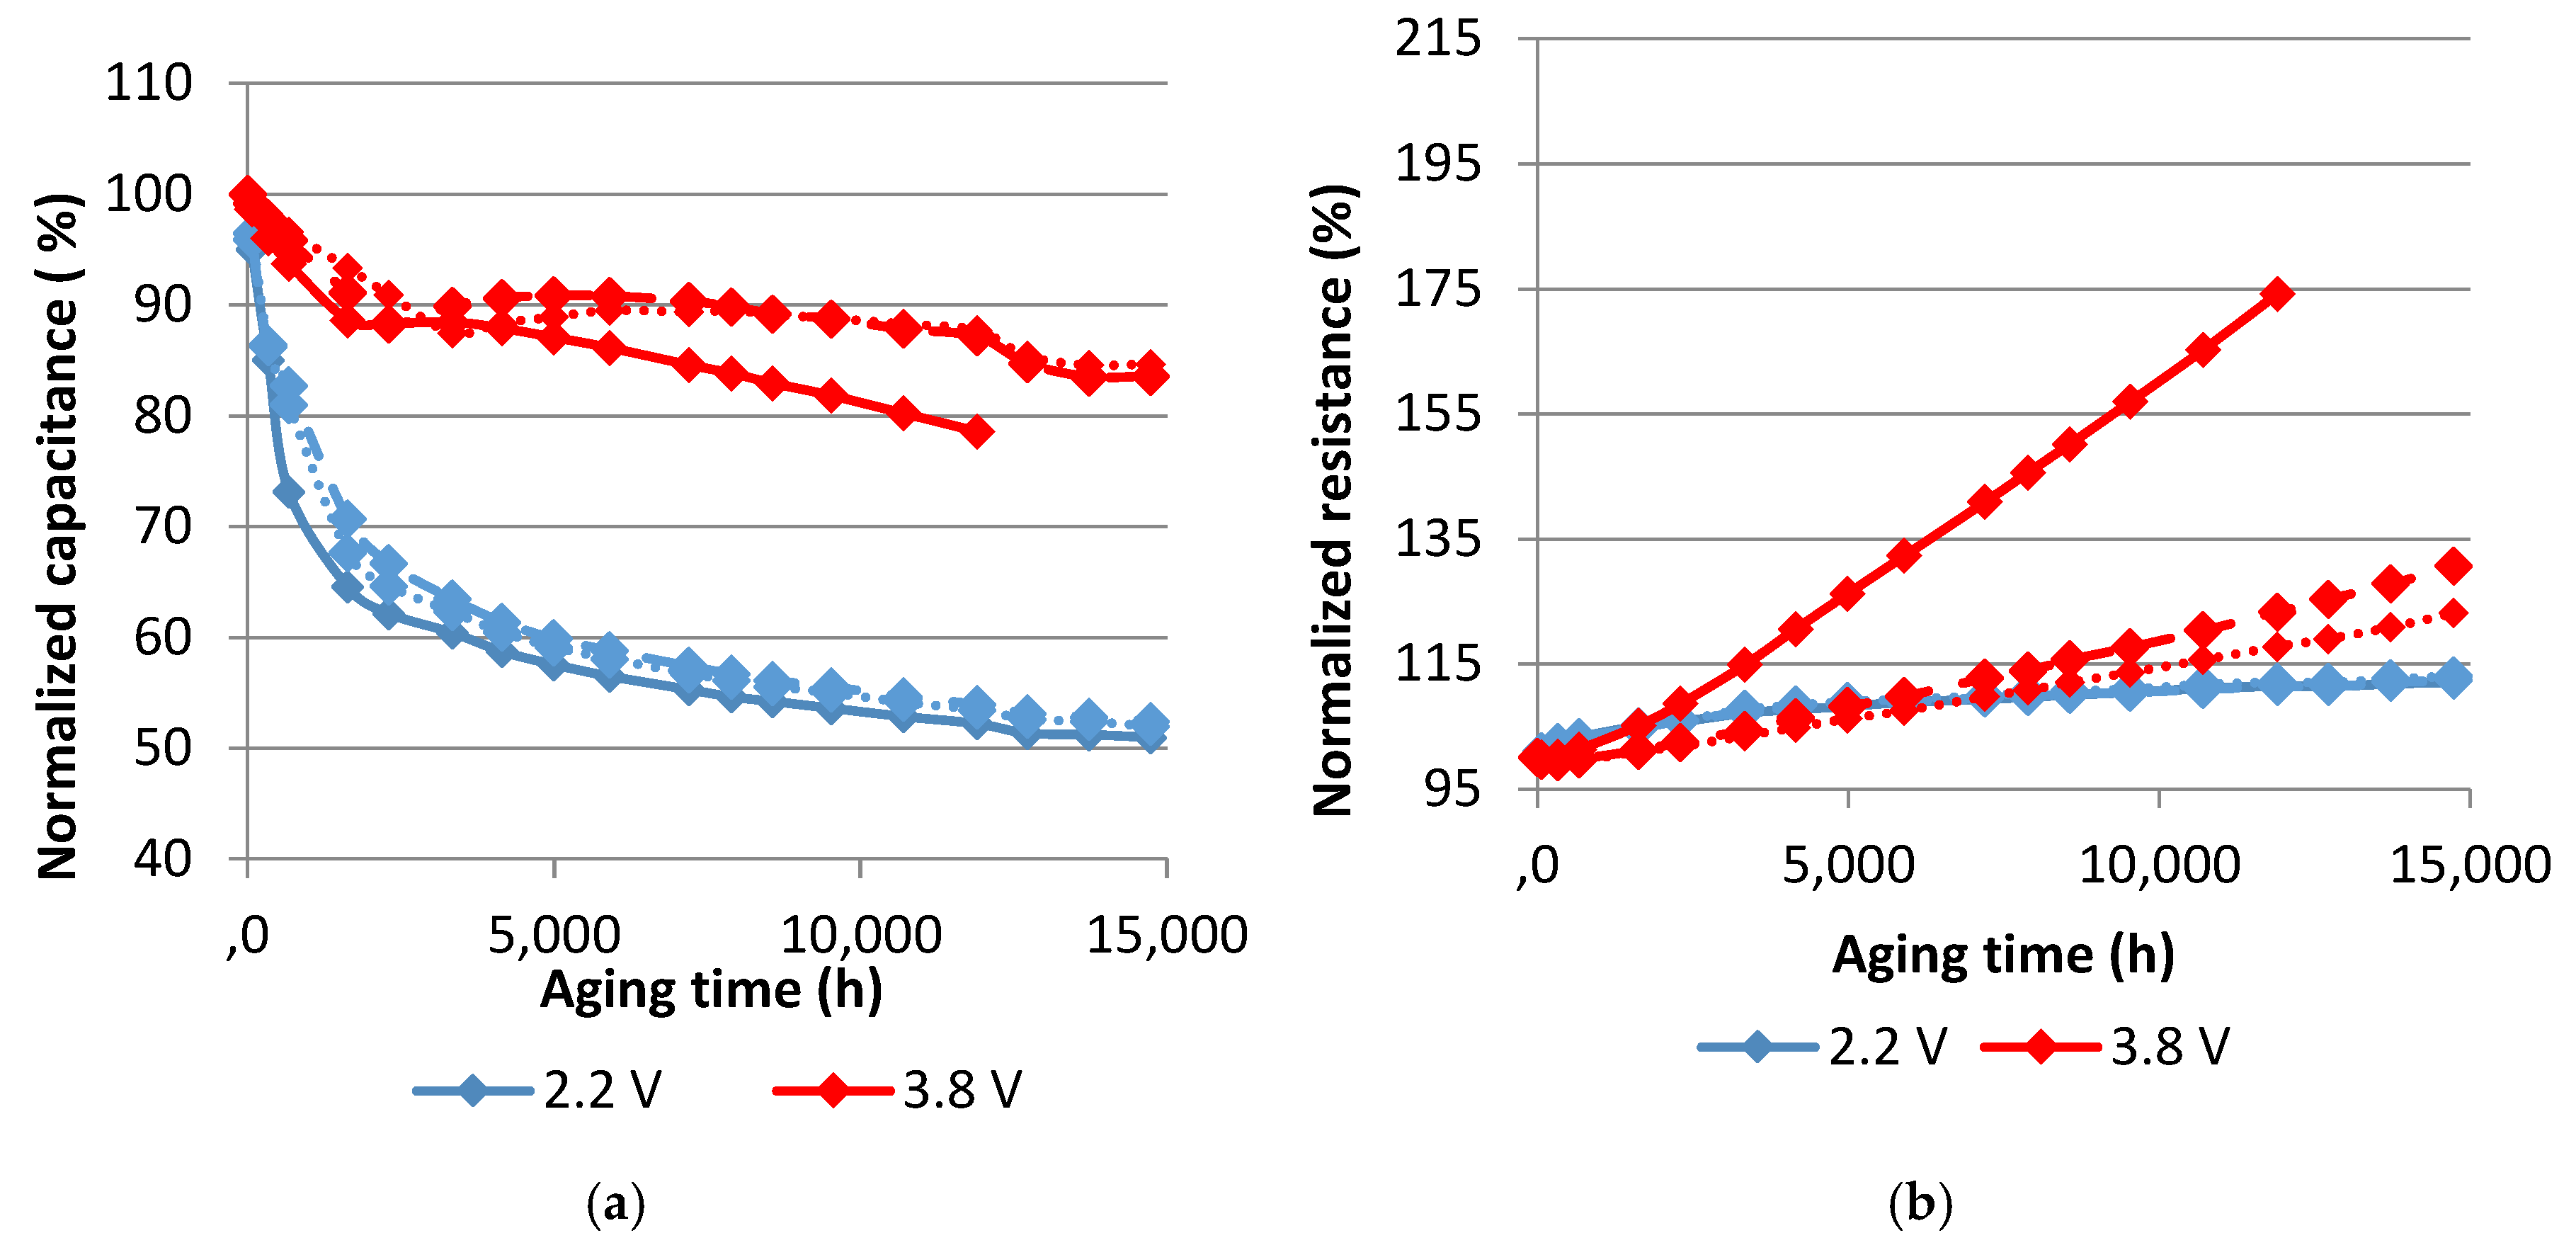
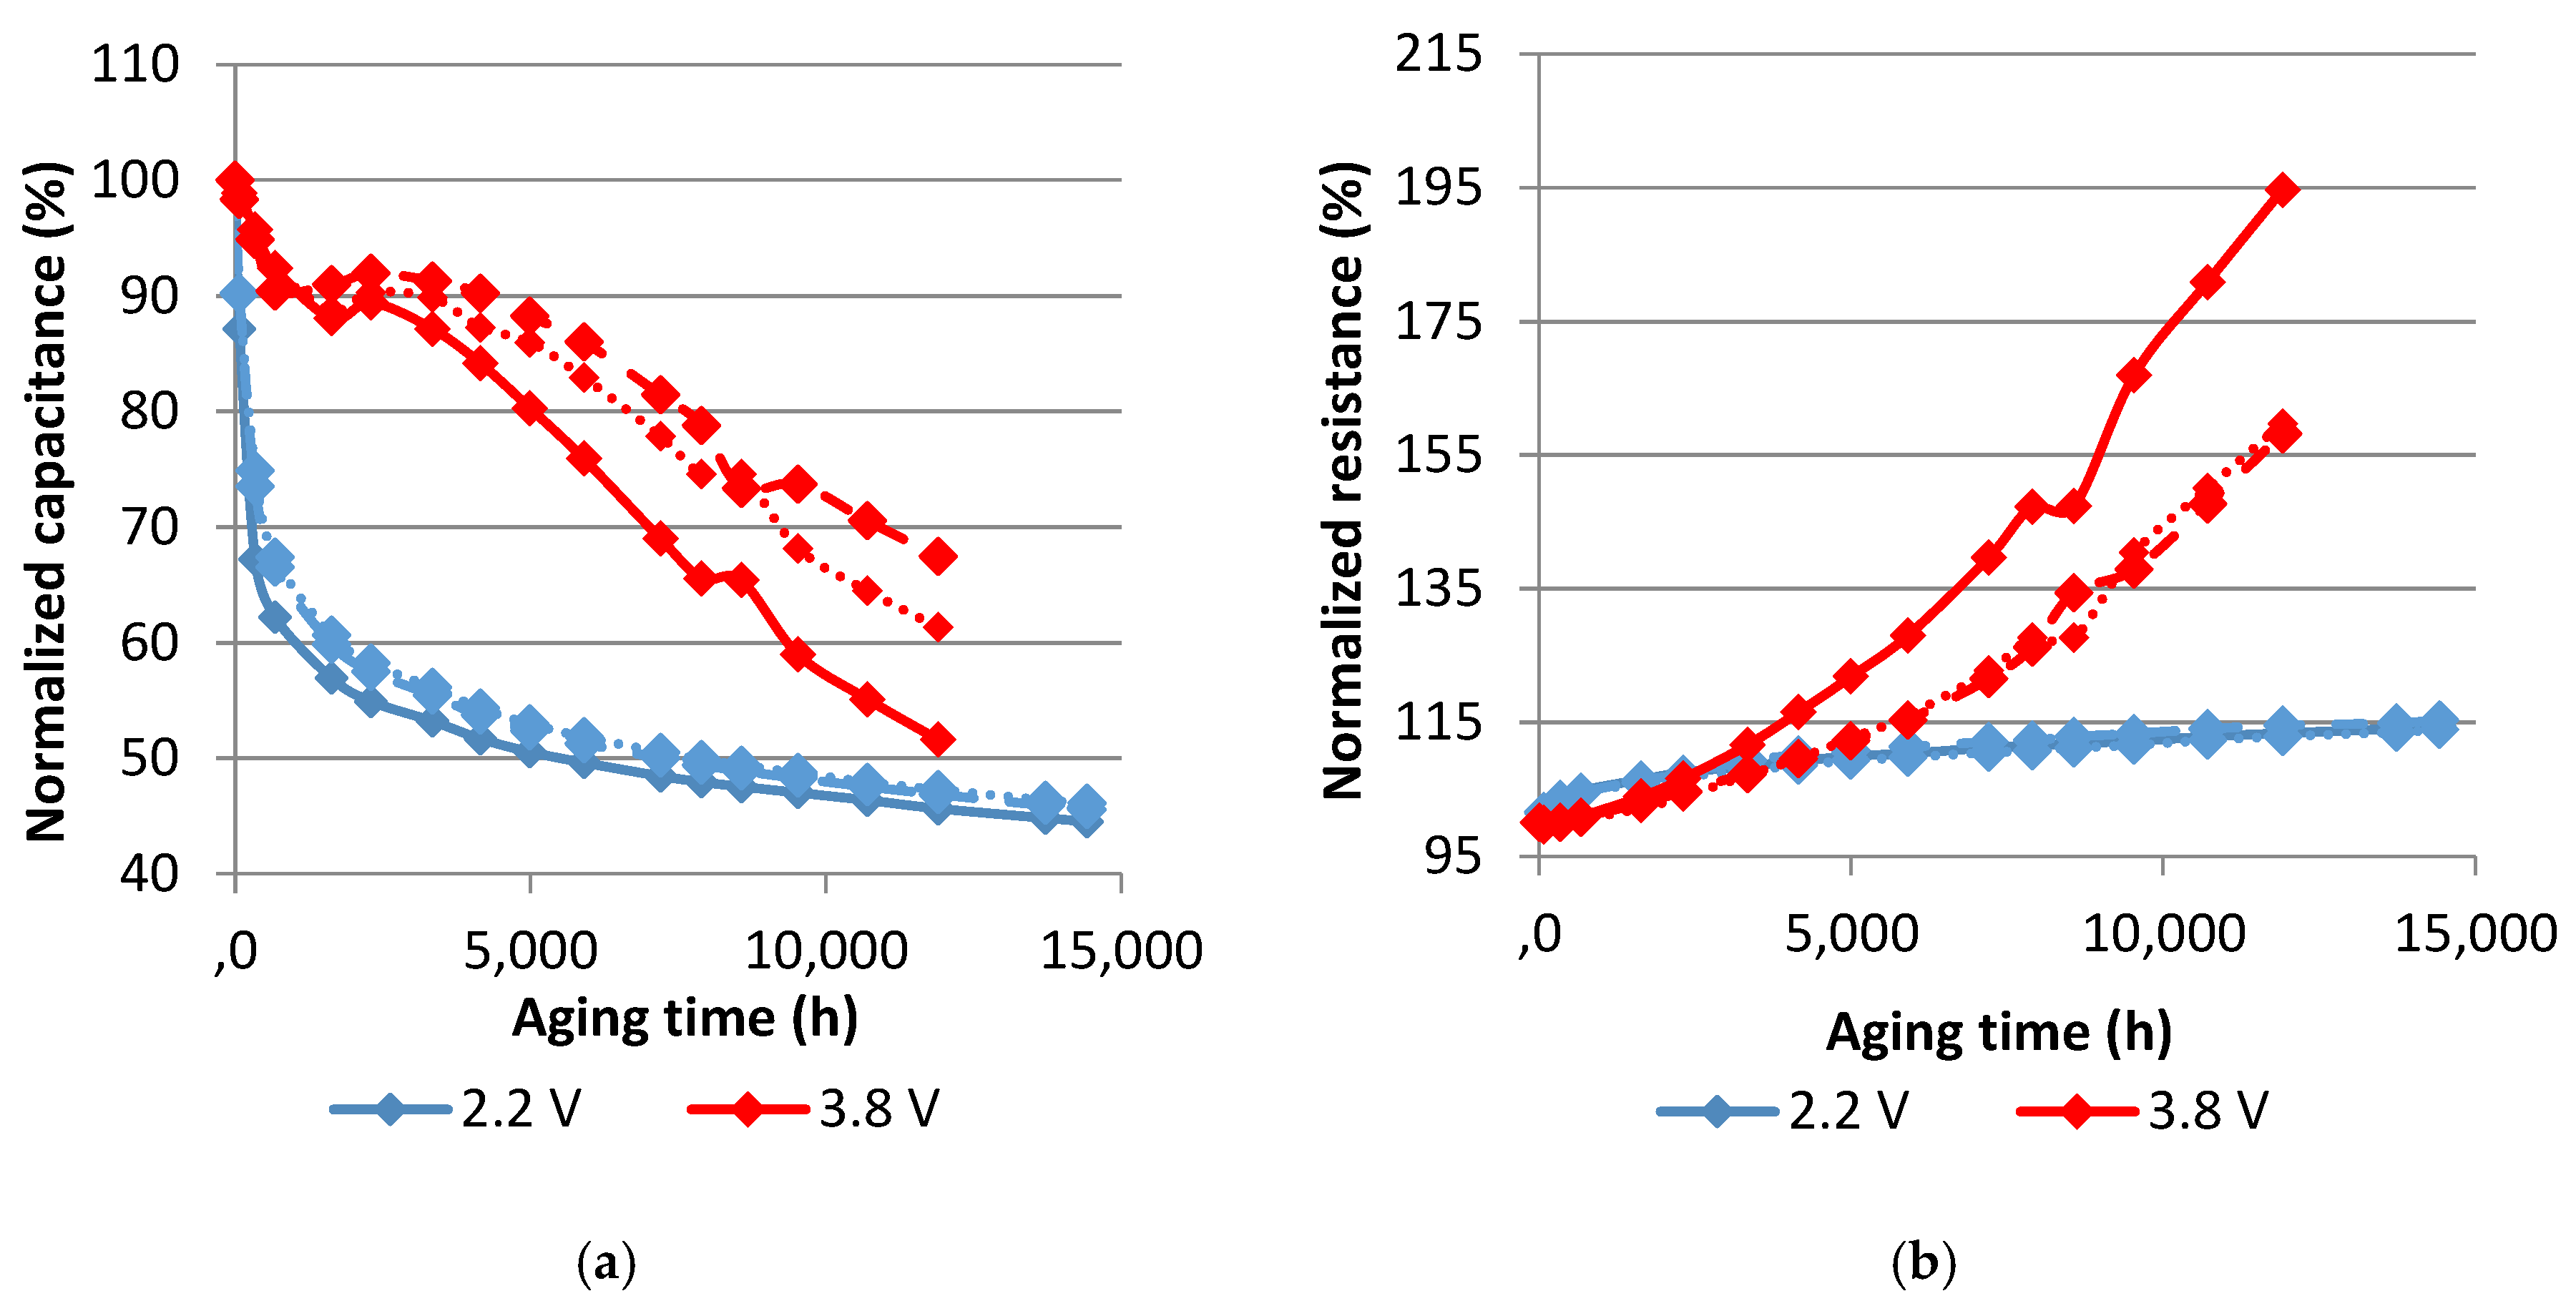
4.1. Results of Periodic Frequency Domain Measurements
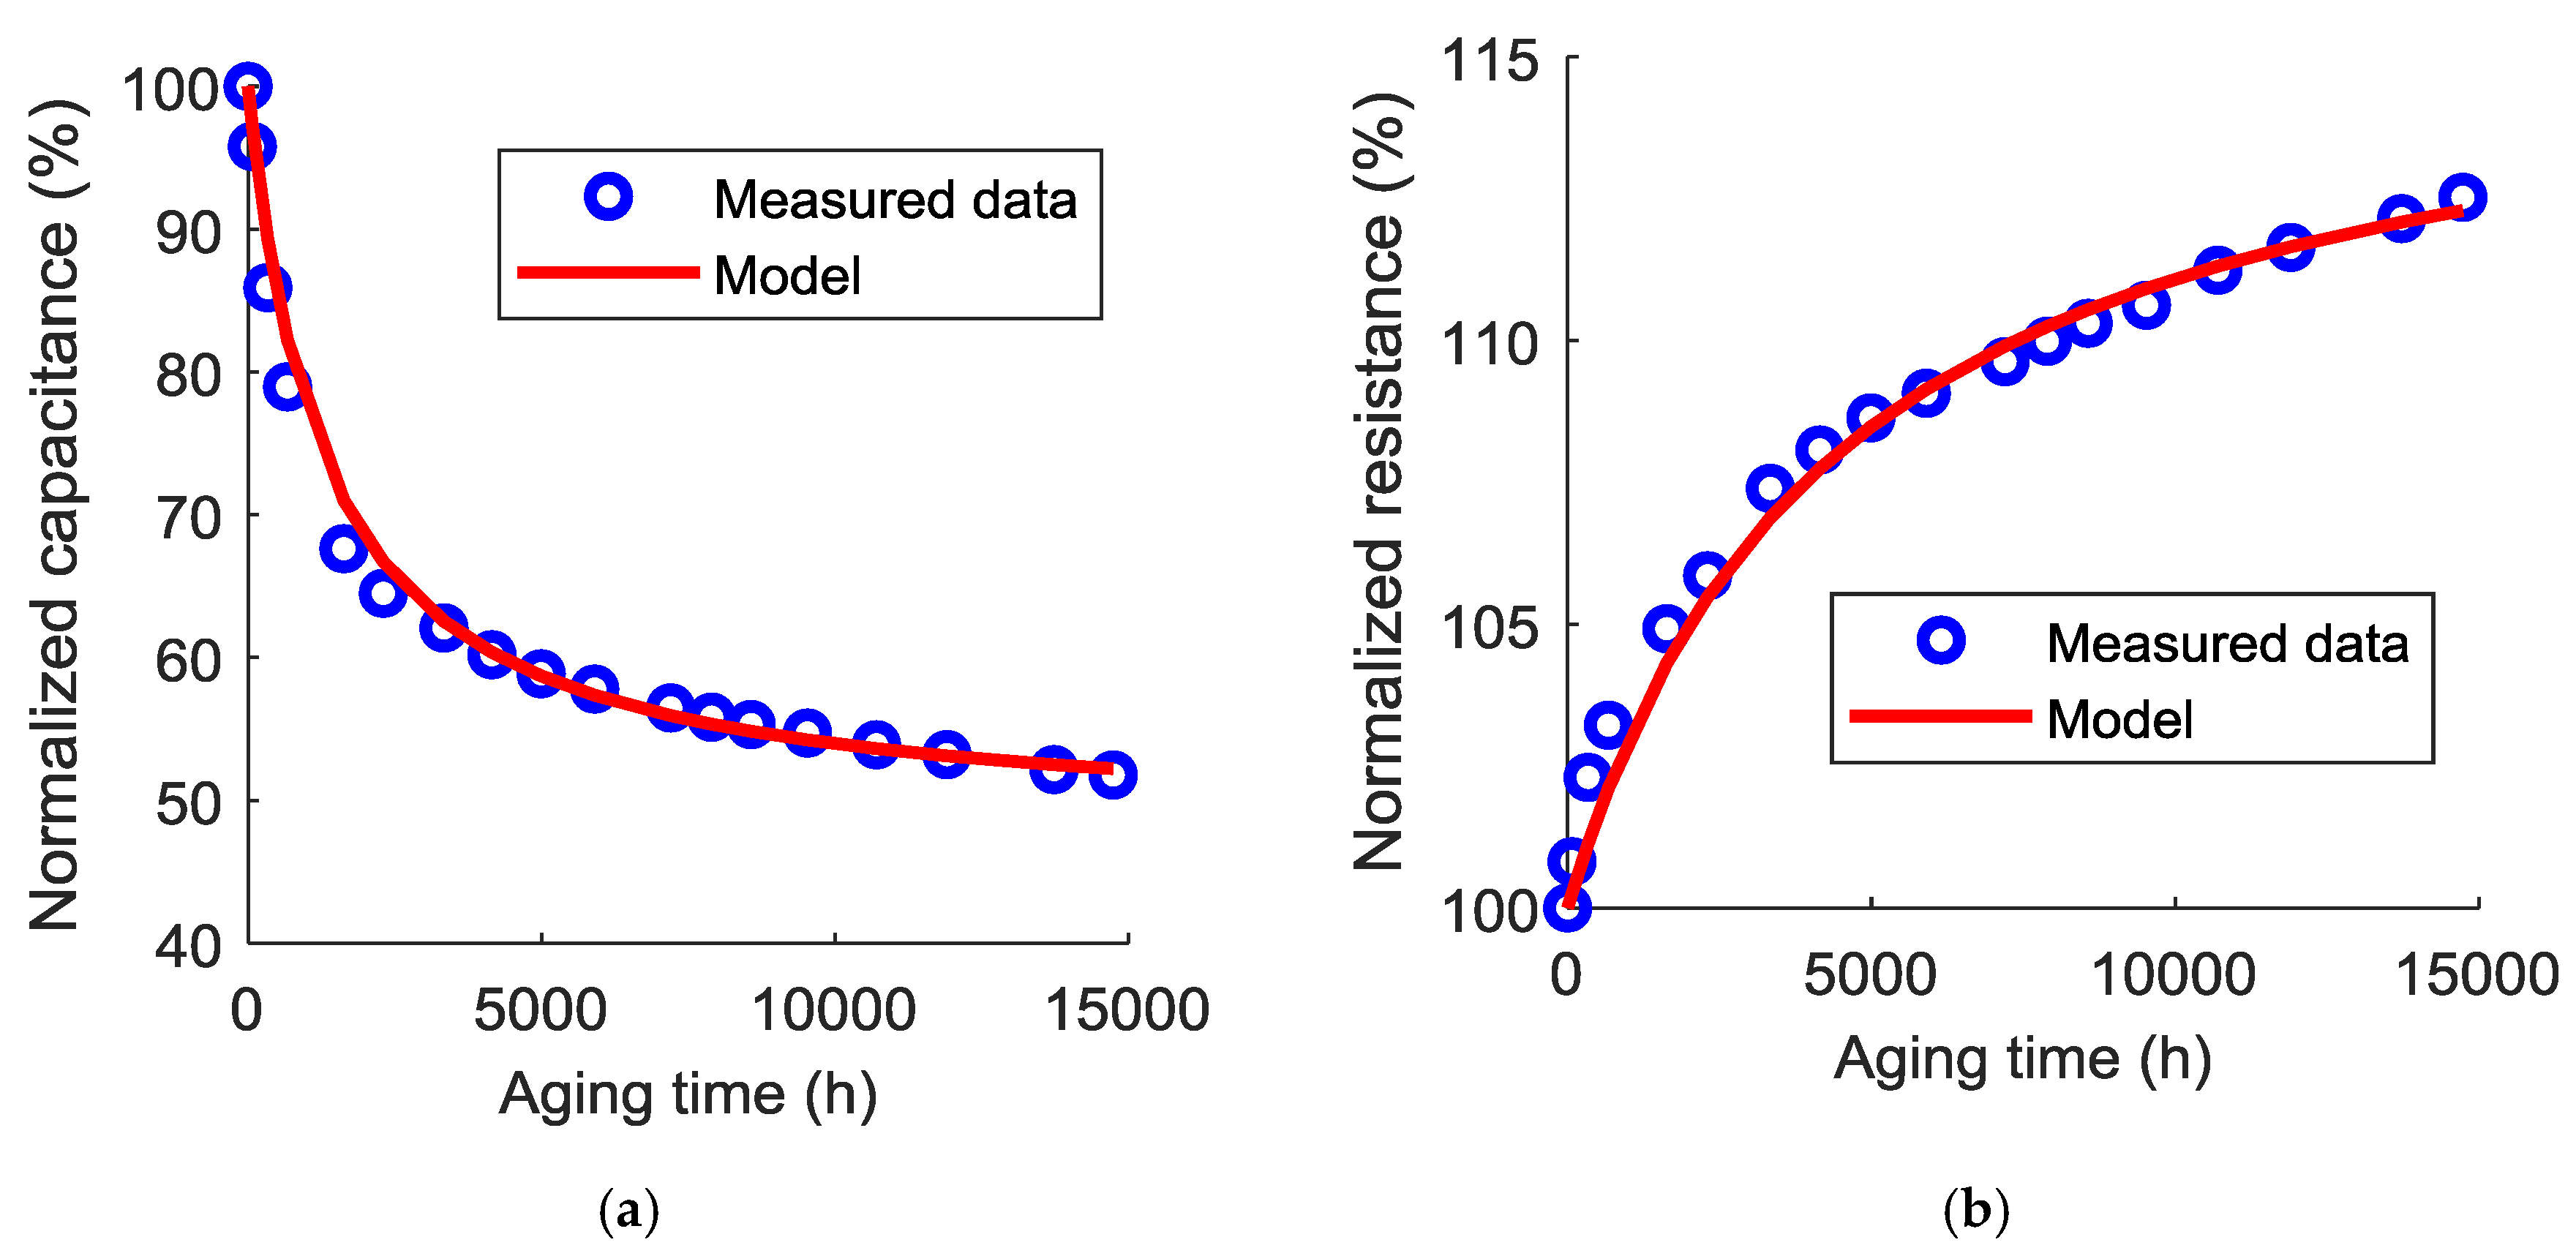
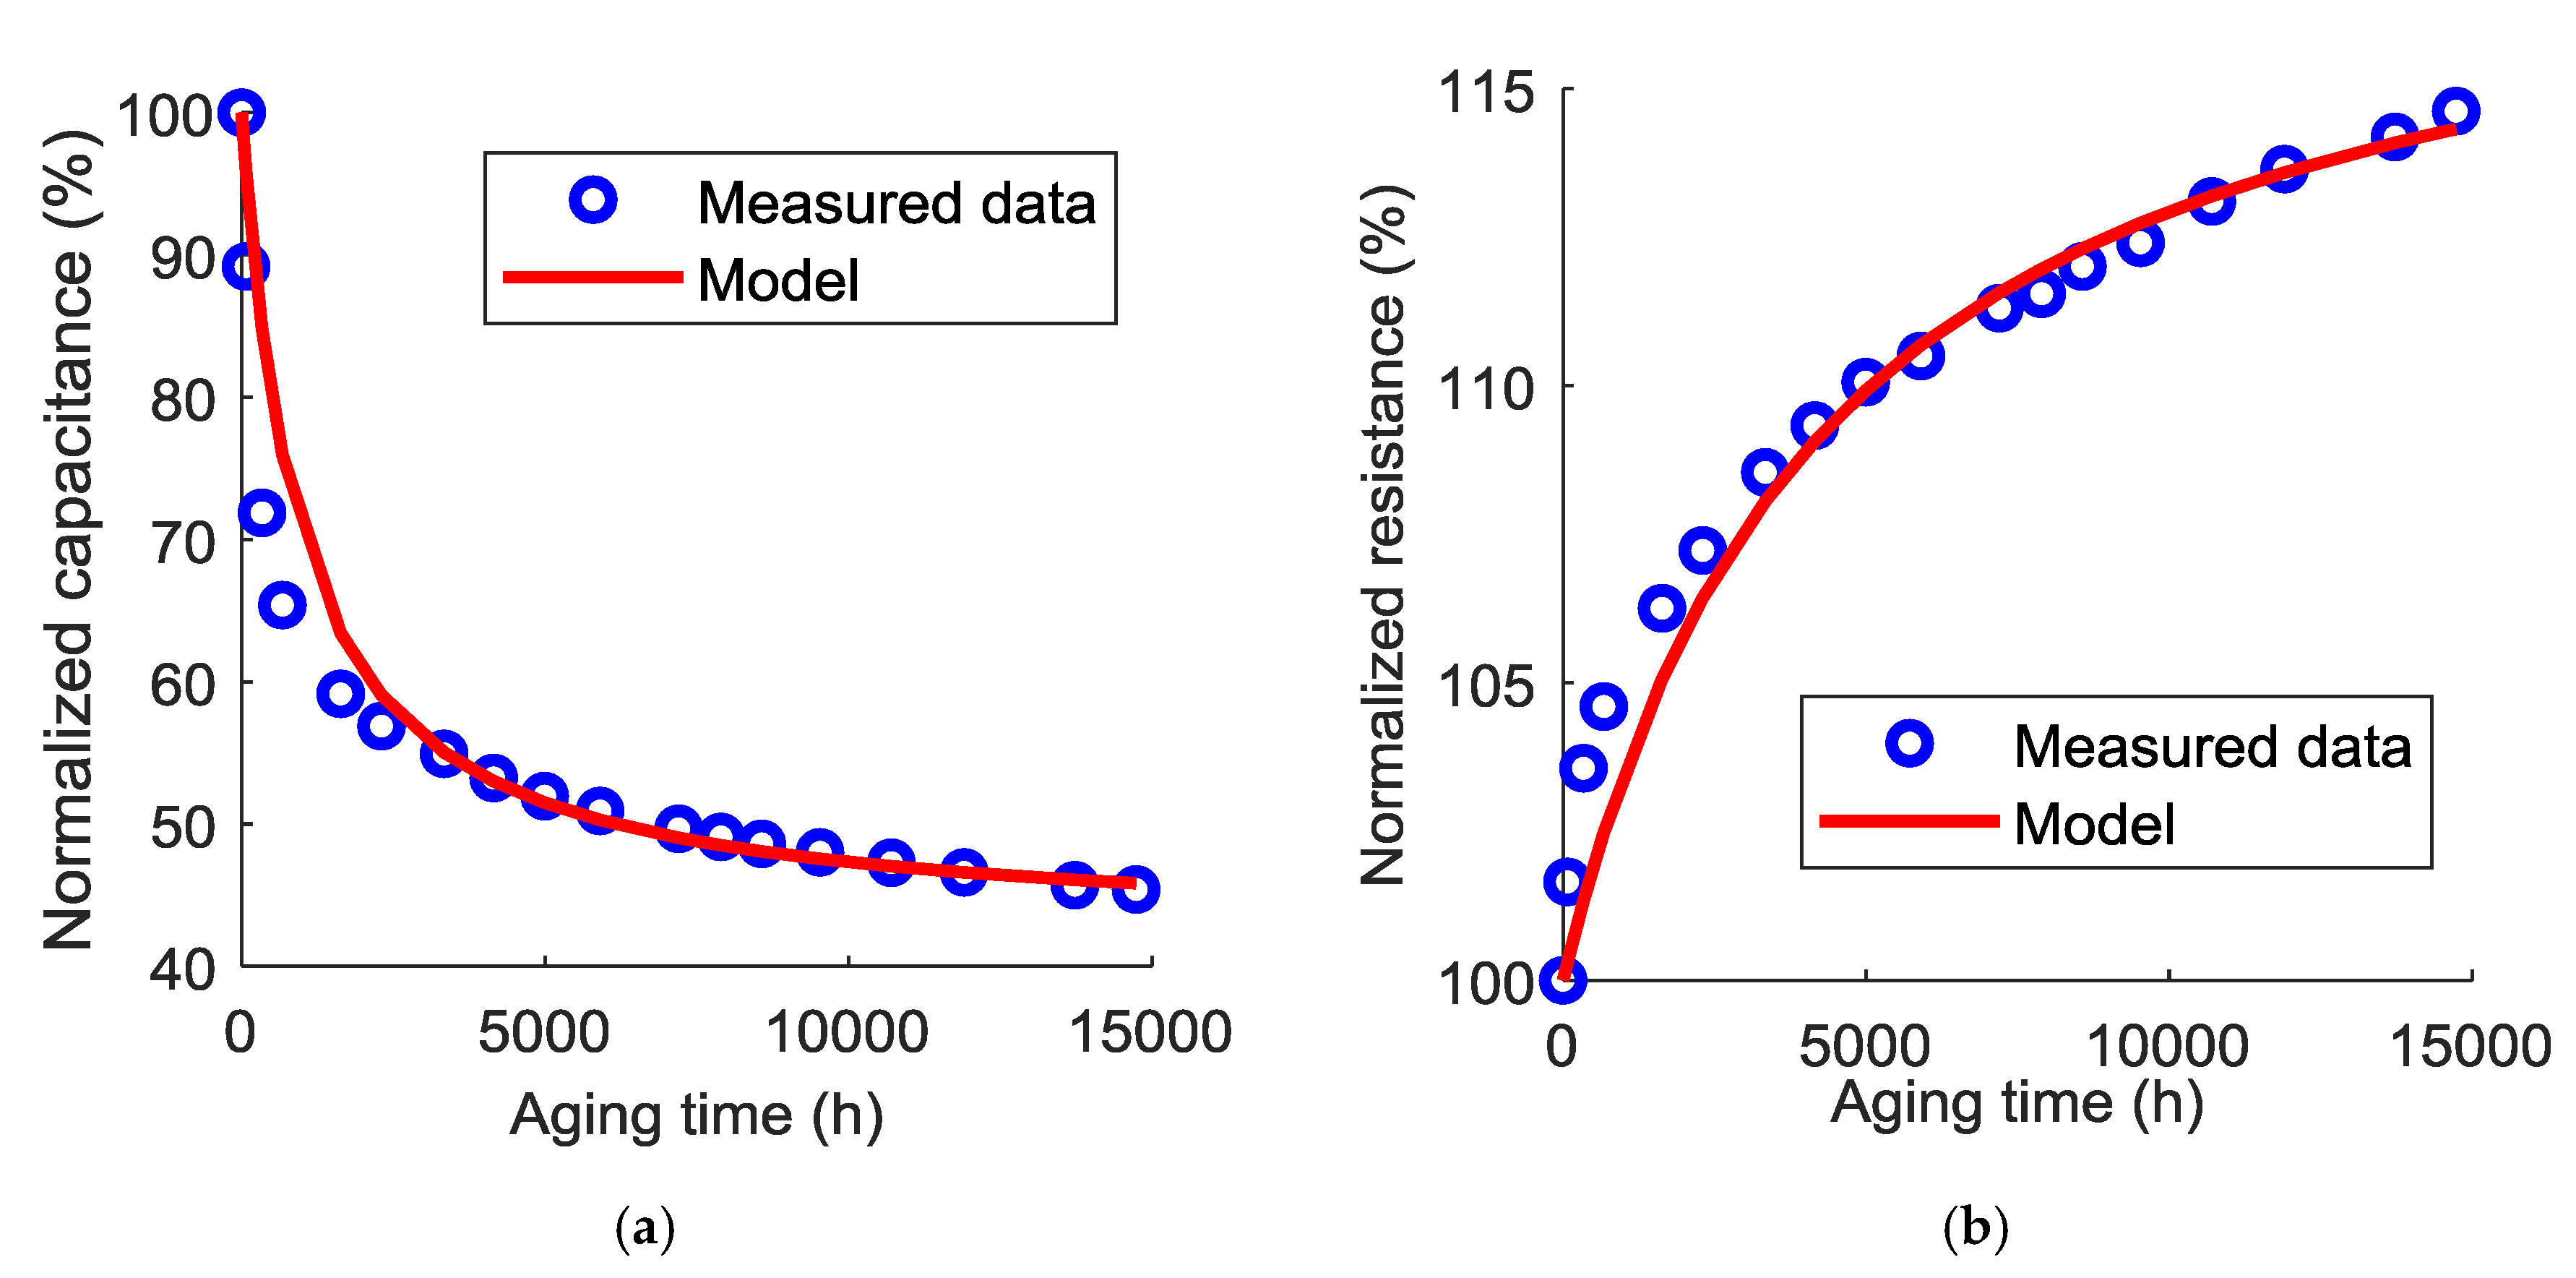
The capacitance decrease and the equivalent series resistance increase of different cells that are induced by the calendar aging are shown in Figure 6 and Figure 7 at 60 °C and 70 °C, respectively. The values were extracted from impedance measurements at the test voltage and at 100 mHz. Initial capacitance and resistance values of cells aging at 2.2 V are the following: 2586 F, 0.8 mΩ at 60 °C and 2600 F, 0.7 mΩ at 70 °C. Cells aging at 3.8 V had the following initial capacitance and resistance values: 3200 F, 0.8 mΩ at 60 °C and 3283 F, 0.8 mΩ at 70 °C.
Accelerated aging tests at 70 °C obviously provoke more severe degradations than the ones at 60 °C. The capacitance decrease at 2.2 V reaches 55% at 70 °C while the resistance increase is around 14% after 20 months. At 60 °C, less damage is found in this voltage condition. The capacitance decreases by around 49% and the equivalent series resistance increases by around 12%. The effects of calendar aging on cells that were maintained at 3.8 V are more pronounced in their equivalent series resistance. In fact, the resistance noticeably rises especially for two cells originating from a particular production batch (95% at 70 °C and 74% at 60 °C after 17 months of aging). The rest of the cells have around 26% of resistance increase after 20 months at 60 °C and 60% after 17 months at 70 °C. The capacitance of these cells decreases at a rate less than the one at 2.2 V. The corresponding drop is equal to around 18% at 60 °C and 40% at 70 °C.
According to [16], during the calendar aging of a lithium-ion battery, the degradation of its negative electrode depends on its degree of lithiation. When the negative electrode of graphite is highly lithiated, the SEI layer at its surface would grow causing the increase of the equivalent series resistance of the cell. This phenomenon can be the reason behind the high increase of the resistance of LiCs aging at 3.8 V since at this state of charge, their negative electrode is highly lithiated. Moreover, at this voltage value, the potential of the positive electrode would drift to more positive values. Consequently, redox reactions would happen between some parasitic groups present at the surface of activated carbon and the components of the electrolyte [5,25]. As a result, solid or gaseous products will appear in the cell inducing the increase of the overall resistance.
As for cells aging at 2.2 V, aging mechanisms are different due to the different chemical states of both electrodes at each voltage value [15]. Since the capacitance of LiCs that aged at 2.2 V decreases with a very high rate, an aging model for this voltage condition will be developed in the next paragraph, as well as an interpretation of the corresponding aging mechanisms.

4.2. Aging Model

Aging mechanisms in ESSs are mainly attributed to parasitic chemical reactions. These reactions can generate gases that become irreversibly adsorbed at the surface of the electrodes. Langmuir assumes that the surface consists of several equivalent sites where species can be adsorbed physically or chemically. The adsorption and desorption processes are considered to be dynamic. A law of speed can then be defined for each process and when the rates become equal, a state of equilibrium can be characterized by a reduced surface of the solid. Admitting that the double layer at the positive electrode is no longer formed where the adsorption sites are saturated with these products, the storage area decreases with their accumulation during aging [26,27]. The Langmuir isotherm defines the lost area ( Δ S ) using the concentration of gases ( [ C ] ) and the Langmuir adsorption coefficient ( a ) , as follows:
Δ S = a × [ C ] 1 + a × [ C ]
The mass of products generated by parasitic reactions, M , can be expressed by the following equation based on Faraday’s law [26,27]:
M = 1 F × Q × M a t z
where, F is the Faraday constant, Q is the total electric charge passed through the electrolyte, Mat is the molar mass of the substance and z is the valance number of ions enrolled in the reaction. The current I required for maintaining the voltage constant during the calendar aging is considered constant. Therefore, the number of moles N ( t ) of a gas in function of time can be extracted from Equation (3):
N ( t ) = I × t F × z
As a result, the concentration of gases can be described by a time dependent function. The decrease of the storage area leads to a decrease of the capacitance of the electrode. Therefore, considering the amount of produced gases constant with respect to time, the loss of capacitance in Farad ( Δ C ) can be derived from the above equations [26,27]:
Δ C = a c × t 1 + b c × t
The irreversible adsorption at the surface of the activated carbon electrode could block the pores of the material. As a result, the equivalent series resistance increase in ohm ( Δ R ) may also be modeled by Langmuir isotherm that depends on the aging time:
Δ R = a R × t 1 + b R × t
As a result, the models of the normalized capacitance and resistance at an aging time t , C ( % ) ( t ) and R ( % ) ( t ) respectively, can be expressed by the following equations:
C ( % ) ( t ) = C ( 0 ) a c × t 1 + b c × t C ( 0 ) × 100
R ( % ) ( t ) = R ( 0 ) a R × t 1 + b R × t R ( 0 ) × 100
where, C ( 0 ) and R ( 0 ) are the initial values of the capacitance and the resistance before aging. The values of C ( % ) ( t ) and R ( % ) ( t ) deduced from the impedance measurements at 100 mHz at different aging times were used to identify the parameters of Equations (5) and (6). The averages of capacitance loss and equivalent series resistance increase of the three tested samples were taken into consideration at 60 °C and 70 °C. The errors between the predicted values of the normalized capacitance and equivalent series resistance and the measured values were also evaluated ( e c and e R respectively). Table 1 combines the identified parameters and Figure 8 and Figure 9 compare the simulated model and the measured values at 60 °C and 70 °C, respectively.
As can be seen in these figures, the Langmuir model is able to accurately predict the evolution of the capacitance and the equivalent series resistance with the calendar aging time. Therefore, when cells are mounted at a fully discharged state, their lifetime can be now estimated according to the end-of-life criteria. Usually, a normalized capacitance of 80% or a normalized resistance of 200% is a sufficient indicator that the ESS has reached its end-of-life.
Based on the operating principle of a brand new LiC, the positive electrode at 2.2 V attracts the lithium ions   ( Li + ) that form the double layer at its surface. An important reason behind the degradation of supercapacitors concerns the parasitic groups present at the surface of activated carbon after the activation treatments [28]. Therefore, these groups, which reside at the surface of the positive electrode in a LiC, might irreversibly adsorb the cations Li + and block the pores of the activated carbon. As a result, additional lithium ions should be deintercalated from the negative electrode to compensate the loss of lithium ions at the positive electrode. Accordingly, the overall capacitance of the device diminishes. The aging model based on the Langmuir isotherm can then describe with a small error the evolution of the capacitance and the equivalent series resistance with respect to the aging time.

5. Conclusions

The hybrid configuration of LiCs has a huge effect on their performance at different voltage values. Calendar aging tests were applied at the minimum and maximum voltages of the total voltage window and at 60 °C and 70 °C. During the aging process, periodic measurements were applied to the cells for the aim of following the decrease of their capacitance and the increase of their equivalent series resistance. Time domain measurements were not able to reveal the real aging status. The potential drift of the negative electrode at the beginning of the aging influenced the value of the measured capacitance during a full discharge. Frequency domain measurements were then chosen as periodic measurement tool since they reflect the actual aging state of the cells.
During the calendar aging, cells that aged at the minimum voltage value had a huge capacitance decrease. They lost around 55% of their initial capacitance at 70 °C and 49% at 60 °C after 20 months of calendar aging. An aging model was developed for these cells based on Langmuir isotherm. The model can accurately predict the capacitance increase and the equivalent series resistance decrease at a specific aging time. Additional analysis should be conducted to check whether this model can be applied during the cycle aging of LiCs or not. This will also depend on the aging mechanisms generated throughout the lifetime of LiCs on duty. In fact, the model was unable to predict the capacitance decrease and the resistance increase of cells aging at 3.8 V since the corresponding aging mechanisms generated non-monotonous change of properties during the whole aging period due to different aging mechanisms.

Author Contributions

Writing and original draft preparation, N.E.G; Review & Editing, A.S, P.V.; Results discussion, all authors.

Funding

This research received no external funding.

Conflicts of Interest

The authors declare no conflict of interest.

References

  1. Uddin, K.; Perera, S.; Widanage, W.D.; Somerville, L.; Marco, J. Characterising Lithium-Ion Battery Degradation through the Identification and Tracking of Electrochemical Battery Model Parameters. Batteries 2016, 2, 13. [Google Scholar] [CrossRef]
  2. Stroe, D.-I.; Swierczynski, M.; Stroe, A.-I.; Knudsen Kær, S. Generalized Characterization Methodology for Performance Modelling of Lithium-Ion Batteries. Batteries 2016, 2, 37. [Google Scholar] [CrossRef]
  3. Kandasamy, N.K.; Badrinarayanan, R.; Kanamarlapudi, V.R.K.; Tseng, K.J.; Soong, B.-H. Performance Analysis of Machine-Learning Approaches for Modeling the Charging/Discharging Profiles of Stationary Battery Systems with Non-Uniform Cell Aging. Batteries 2017, 3, 18. [Google Scholar] [CrossRef]
  4. Ossai, C.I. Prognosis and Remaining Useful Life Estimation of Lithium-Ion Battery with Optimal Multi-Level Particle Filter and Genetic Algorithm. Batteries 2018, 4, 15. [Google Scholar] [CrossRef]
  5. German, R.; Venet, P.; Sari, A.; Briat, O.; Vinassa, J.M. Improved Supercapacitor Floating Ageing Interpretation Through Multipore Impedance Model Parameters Evolution. IEEE Trans. Power Electron. 2014, 29, 3669–3678. [Google Scholar] [CrossRef]
  6. German, R.; Sari, A.; Briat, O.; Vinassa, J.M.; Venet, P. Impact of Voltage Resets on Supercapacitors Aging. IEEE Trans. Ind. Electron. 2016, 63, 7703–7711. [Google Scholar] [CrossRef]
  7. Redondo-Iglesias, E.; Venet, P.; Pelissier, S. Eyring acceleration model for predicting calendar ageing of lithium-ion batteries. J. Energy Storage 2017, 13, 176–183. [Google Scholar] [CrossRef] [Green Version]
  8. Redondo-Iglesias, E.; Venet, P.; Pelissier, S. Global Model for Self-discharge and Capacity Fade in Lithium-ion Batteries Based on the Generalized Eyring Relationship. IEEE Trans. Veh. Technol. 2018. [Google Scholar] [CrossRef]
  9. Savoye, F.; Venet, P.; Millet, M.; Groot, J. Impact of Periodic Current Pulses on Li-Ion Battery Performance. IEEE Trans. Ind. Electron. 2012, 59, 3481–3488. [Google Scholar] [CrossRef]
  10. Ronsmans, J.; Lalande, B. Combining energy with power: Lithium-ion capacitors. In Proceedings of the 2015 International Conference on Electrical Systems for Aircraft, Railway, Ship Propulsion and Road Vehicles (ESARS), Aachen, Germany, 3–5 March 2015; pp. 1–4. [Google Scholar]
  11. Zuo, W.; Li, R.; Zhou, C.; Li, Y.; Xia, J.; Liu, J. Battery-Supercapacitor Hybrid Devices: Recent Progress and Future Prospects. Adv. Sci. 2017, 4, 1600539. [Google Scholar] [CrossRef] [PubMed] [Green Version]
  12. Adelowo, E.; Baboukani, A.R.; Chen, C.; Wang, C. Electrostatically Sprayed Reduced Graphene Oxide-Carbon Nanotubes Electrodes for Lithium-Ion Capacitors. C 2018, 4, 31. [Google Scholar] [CrossRef]
  13. Holtstiege, F.; Bärmann, P.; Nölle, R.; Winter, M.; Placke, T. Pre-Lithiation Strategies for Rechargeable Energy Storage Technologies: Concepts, Promises and Challenges. Batteries 2018, 4, 4. [Google Scholar] [CrossRef]
  14. Cao, W.J.; Luo, J.F.; Yan, J.; Chen, X.J.; Brandt, W.; Warfield, M.; Lewis, D.; Yturriaga, S.R.; Moye, D.G.; Zheng, J.P. High Performance Li-Ion Capacitor Laminate Cells Based on Hard Carbon/Lithium Stripes Negative Electrodes. J. Electrochem. Soc. 2017, 164, A93–A98. [Google Scholar] [CrossRef]
  15. Ghossein, N.E.; Sari, A.; Venet, P. Nonlinear Capacitance Evolution of Lithium-Ion Capacitors Based on Frequency- and Time-Domain Measurements. IEEE Trans. Power Electron. 2018, 33, 5909–5916. [Google Scholar] [CrossRef]
  16. Keil, P.; Schuster, S.F.; Wilhelm, J.; Travi, J.; Hauser, A.; Karl, R.C.; Jossen, A. Calendar Aging of Lithium-Ion Batteries I. Impact of the Graphite Anode on Capacity Fade. J. Electrochem. Soc. 2016, 163, A1872–A1880. [Google Scholar] [CrossRef]
  17. Savoye, F. Impact des impulsions périodiques de courant sur la performance et la durée de vie des accumulateurs lithium-ion et conséquences de leur mise en oeuvre dans une application transport. Ph.D. Thesis, Université Claude Bernard Lyon 1, Lyon, France, 2012. [Google Scholar]
  18. Sun, X.; Zhang, X.; Liu, W.; Wang, K.; Li, C.; Li, Z.; Ma, Y. Electrochemical performances and capacity fading behaviors of activated carbon/hard carbon lithium ion capacitor. Electrochim. Acta 2017, 235, 158–166. [Google Scholar] [CrossRef]
  19. Aida, T.; Murayama, I.; Yamada, K.; Morita, M. Analyses of Capacity Loss and Improvement of Cycle Performance for a High-Voltage Hybrid Electrochemical Capacitor. J. Electrochem. Soc. 2007, 154, A798–A804. [Google Scholar] [CrossRef]
  20. Uno, M.; Kukita, A. Cycle Life Evaluation Based on Accelerated Aging Testing for Lithium-Ion Capacitors as Alternative to Rechargeable Batteries. IEEE Trans. Ind. Electron. 2016, 63, 1607–1617. [Google Scholar] [CrossRef]
  21. Ghossein, N.E.; Sari, A.; Venet, P. Effects of the Hybrid Composition of Commercial Lithium-Ion Capacitors on their Floating Aging. IEEE Trans. Power Electron. 2018. [Google Scholar] [CrossRef]
  22. Ghossein, N.E.; Sari, A.; Venet, P. Interpretation of the Particularities of Lithium-Ion Capacitors and Development of a Simple Circuit Model. In Proceedings of the 2016 IEEE Vehicle Power and Propulsion Conference (VPPC), Hangzhou, China, 17–20 October 2016; pp. 1–5. [Google Scholar]
  23. Sivakkumar, S.R.; Pandolfo, A.G. Evaluation of lithium-ion capacitors assembled with pre-lithiated graphite anode and activated carbon cathode. Electrochim. Acta 2012, 65, 280–287. [Google Scholar] [CrossRef]
  24. Shellikeri, A.; Hung, I.; Gan, Z.; Zheng, J. In Situ NMR Tracks Real-Time Li Ion Movement in Hybrid Supercapacitor–Battery Device. J. Phys. Chem. C 2016, 120, 6314–6323. [Google Scholar] [CrossRef]
  25. Azaïs, P.; Duclaux, L.; Florian, P.; Massiot, D.; Lillo-Rodenas, M.-A.; Linares-Solano, A.; Peres, J.-P.; Jehoulet, C.; Béguin, F. Causes of supercapacitors ageing in organic electrolyte. J. Power Sources 2007, 171, 1046–1053. [Google Scholar] [CrossRef]
  26. German, R.; Sari, A.; Venet, P.; Zitouni, Y.; Briat, O.; Vinassa, J.M. Ageing law for supercapacitors floating ageing. In Proceedings of the 2014 IEEE 23rd International Symposium on Industrial Electronics (ISIE), Istanbul, Turkey, 1–4 June 2014; pp. 1773–1777. [Google Scholar]
  27. Chaari, R. Evaluation et Modélisation du Vieillissement des Supercondensateurs pour des Applications Véhicules Hybrides. Ph.D. Thesis, Université Bordeaux 1, Bordeaux, France, 2013. [Google Scholar]
  28. Zhang, T.; Fuchs, B.; Secchiaroli, M.; Wohlfahrt-Mehrens, M.; Dsoke, S. Electrochemical behavior and stability of a commercial activated carbon in various organic electrolyte combinations containing Li-salts. Electrochim. Acta 2016, 218, 163–173. [Google Scholar] [CrossRef]
Figure 1. Capacitance evolution of cells aging at 2.2 V and 3.8 V at 60 °C after 109 days of calendar aging. The results are found from measurements in the frequency domain at 25 °C.
Batteries 05 00028 g001
Figure 2. Capacitance evolution of cells aging at 2.2 V and 3.8 V at 70 °C after 109 days of calendar aging. The results are found from measurements in the frequency domain at 25 °C.
Batteries 05 00028 g002
Figure 3. Capacitance evolution of cells aging at 2.2 V and 3.8 V at 60 °C after 109 days of calendar aging. The results are found from measurements in the time domain at 25 °C.
Batteries 05 00028 g003
Figure 4. Capacitance evolution of cells aging at 2.2 V and 3.8 V at 70 °C after 109 days of calendar aging. The results are found from measurements in the time domain at 25 °C.
Batteries 05 00028 g004
Figure 5. Effects of aging at 3.8 V and 60 °C for 109 days on the capacitance evolution with respect to the voltage, deduced from time domain measurements at 25 °C.
Batteries 05 00028 g005
Figure 6. Evolution of the normalized capacitance (a) and the normalized resistance (b) with aging time at 60°C. Each curve represents one sample.
Batteries 05 00028 g006
Figure 7. Evolution of the normalized capacitance (a) and the normalized resistance (b) with aging time at 70°C. Each curve represents one sample.
Batteries 05 00028 g007
Figure 8. Comparison between the measured data and the model for the capacitance (a) and the equivalent series resistance (b) evolutions at 60 °C.
Batteries 05 00028 g008
Figure 9. Comparison between the measured data and the models of the capacitance (a) and the equivalent series resistance (b) evolution at 70 °C.
Batteries 05 00028 g009
Table 1. Identified parameters of the Langmuir model at 60 °C and 70 °C.
Temperature (°C) a c ( F · h 1 ) b c ( h 1 ) e c ( % ) a R ( m · h 1 ) b R ( h 1 ) e R ( % )
601.20.0010.73.5 × 10−53.2 × 10−40.3
701.90.001434.1 × 10−53.1 × 10−40.7

